


-
Adverse childhood experiences (ACEs) are prevalent among adolescents and are correlated with a great risk for risky health behaviors such as drug use, early onset of smoking, self-harm and suicidal behaviors [1-4]. A recent study of a nationally representative sample of 94,369 US children (6–17 years) by the National Survey of Children’s Health (NSCH) conducted from 2016–2019 found that approximately half of children (48%) had experienced lifelong exposure to at least one type of ACE [5]. A school-based study including a representative sample of 14,500 students (10–20 years) from four provinces in China found that 86.6% of participants reported at least one type of ACE [6]. Adolescence is an important developmental period and a time when ACEs can significantly influence health outcomes in the short and long terms. Clarifying the association between ACEs and adolescent health risky behaviors could help inform target interventions aimed at reducing the potential negative outcomes of ACEs. However, current studies may be limited in the measurement of ACEs, which may impede our understanding of the association between ACEs and risky health behaviors. Some issues with ACE measurements still need to be addressed.
First, no consensus has been reached on the definition of ACEs[7, 8]. Using a clear definition of ACEs can not only help determine what items should be included in the ACE assessment but also provide evidence for ACE screening and prevention. In this study, we aimed to use a broad definition of ACEs to include more items of adversity and provide guidance on ACE prevention. We used McLaughlin’s definition of adversities: “experiences which require significant adaptation by the developing child in terms of psychological, social and neurodevelopmental systems, and which are outside of the normal expected environment”[9].
Second, the questionnaire used to measure ACEs omits certain types of adverse experiences. Two widely used tools for measuring ACEs are the 10-item ACEs and the Adverse Childhood Experiences International Questionnaire (ACE-IQ). The 10-item ACEs were first used by Felitti and cover two main types of preventable childhood adversity: maltreatment and household dysfunction [10]. The ACE-IQ was developed by the World Health Organization based on the bias in the 10-item ACEs, further adding three new types of ACEs: peer violence, witnessing community violence, and exposure to collective violence[11]. However, neither of these scales measures certain types of ACEs that are deemed important for health outcomes[7, 8]. Increasing evidence suggests that the ecological validity of the ACE framework may be improved by measuring adversities resulting from other experiences such as spanking, poverty, community violence, parental gambling problems, peer victimization or bullying, and poor academic performance[12-15] due to their negative impact on health outcomes. Furthermore, most studies conducted in China have used the 10-item ACEs and ACE-IQ[4, 16-18] and thus may have missed some important types of ACEs specific to the Chinese context.
Third, another limitation related to ACE studies lies in the widely used simple cumulative risk approach. This method hypothesizes that different types of ACEs pose an equal level of health risk and have an exposure-response relationship to health risks, thus disregarding potential heterogeneity between ACE categories. However, different types of ACEs (e.g., sexual abuse) have different health consequences[19-21] and frequently co-occur [22]. Thus, latent class analysis (LCA) has been introduced to address these limitations by considering the differences and cooccurrence of different types of ACEs[7, 23]. LCA, a person-centered approach, can help identify homogeneous, mutually exclusive subgroups of ACEs and explore their effects on health outcomes. LCA has been used in ACE studies and has identified certain clusters susceptible to specific health outcomes, thus providing new insights into ACE screening and prevention. For example, Li et al. [6] used the LCA model to explore ACE patterns and found a four-class solution showing that high ACE scores, high levels of abuse and neglect, high levels of neglect, low ACE scores, and high ACE scores to be linked to an increased risk for suicidal behaviors. Similarly, Kim et al. adopted the LCA model and identified four distinct groups of ACEs (i.e., child maltreatment, household dysfunction, violence and low adversity) in a large sample of 10,702 adolescents in the US, and the child maltreatment class was found to be related to increased odds of experiencing depressive symptoms[24].
Fourth, another important issue that needs to be considered in measuring ACEs is the influence of contexts (e.g., cultural, economic, and political). Previous studies have revealed that some specific types of ACEs vary across different contexts. For example, the prevalence of child physical abuse is higher in China than that in international estimates [25]. Additionally, ACE patterns vary across contexts. For example, a study[26] uniquely identified a class called household violence in a sample of 1,346 university students in Japan and China (including Taiwan and Hong Kong). This class of individuals has a higher likelihood of experiencing physical and emotional abuse and witnessing domestic violence[26]. In particular, most previous studies of ACEs have been conducted in Western and developed countries. These findings highlight the need to develop ACE measurements suitable for the Chinese cultural and social context and explore their effects on health outcomes.
Thus, we used a data-driven approach to phenotyping childhood adversity in a large sample of adolescents aged 12–18 years. We used a broad definition of childhood adversity and collected information about experiences with 27 types of ACEs from four main domains (i.e., the family, peer, school and personal domains). Furthermore, we applied LCA to explore the ACE groups and their relationship with risky adolescent health behaviors. To better guide ACE screening and prevention, we also sought to clarify which ACE groups best differentiated the ACE groups.
-
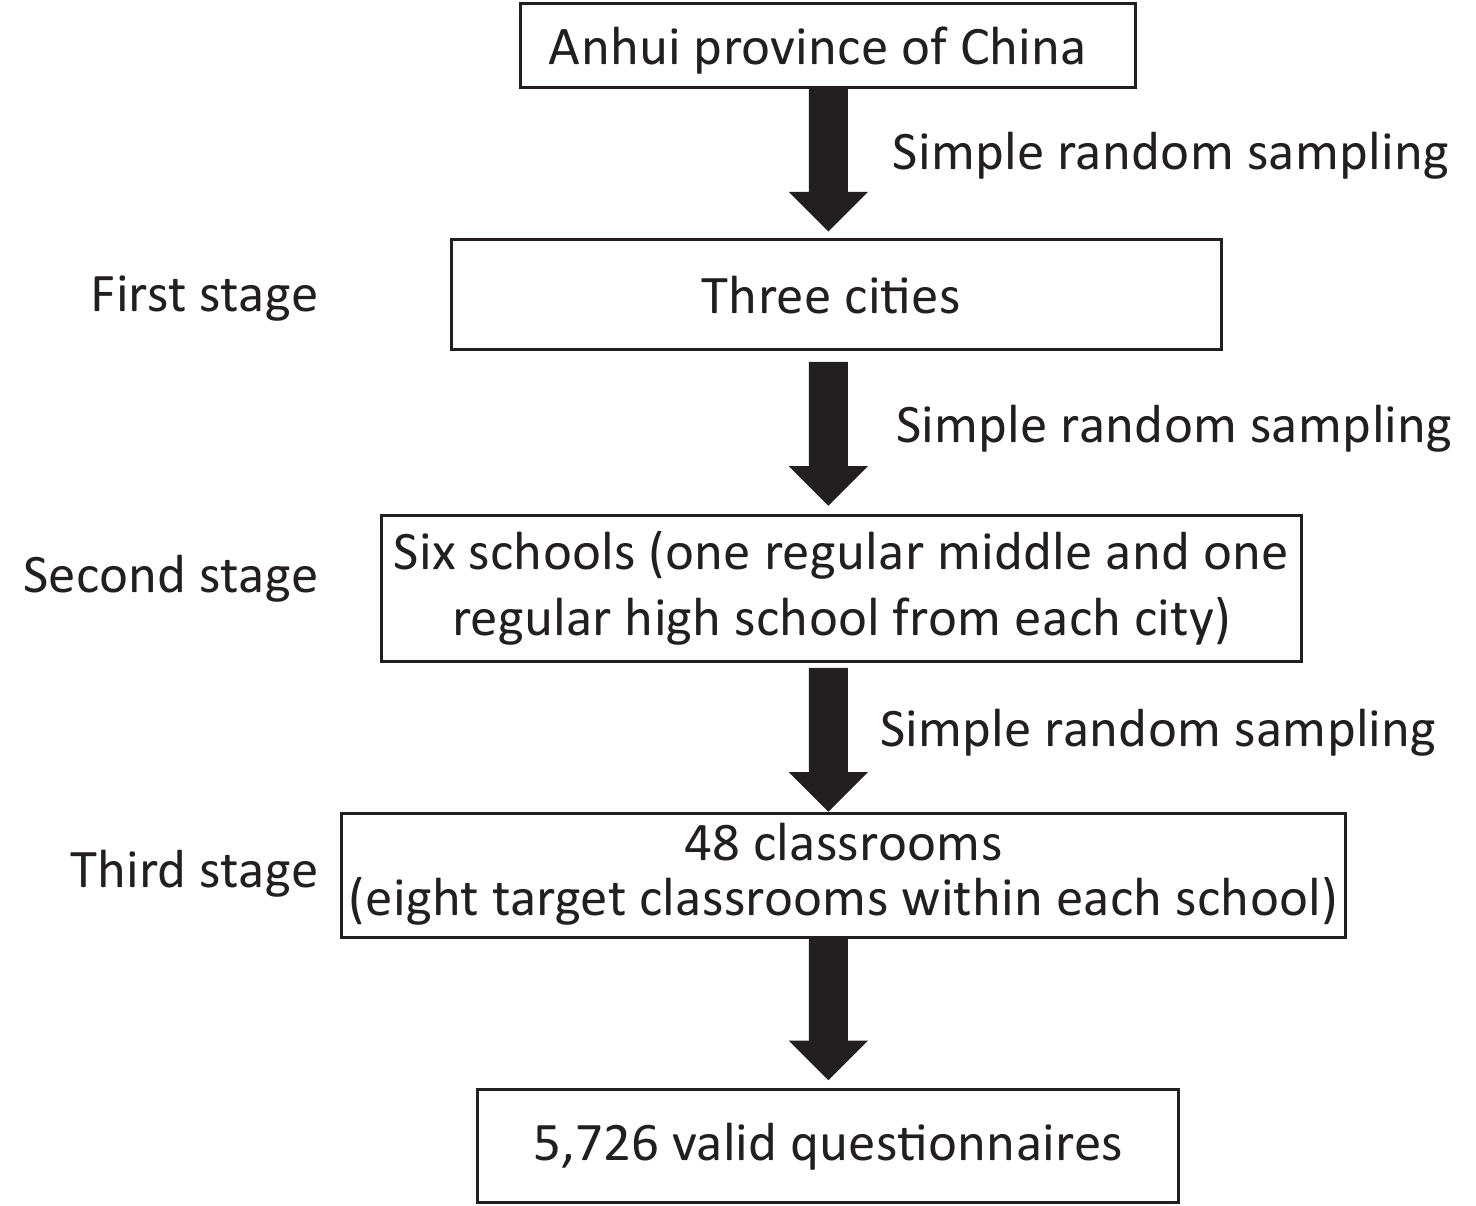
Participants were drawn from a project titled “Adolescent Health and Risky Behaviours in Anhui Province”. This project involved a cross-sectional survey conducted in Anhui, China in December 2013 intended to explore the relationship between ACEs and adolescent health; further details on the project are provided in our previous work [27-29]. The sample size was estimated based on an assumed 2.7% prevalence of suicide attempts [30]. The significance level and permissible error were set as 0.05 and 0.005, respectively. As the design effect of a 3-stage, random cluster sampling was ≥ 1, the estimated sample size was 4,037. A 3-stage, random cluster sampling method was used to select participants. The process is shown in Figure 1. We finally obtained an effective sample of 5,726 students aged 12–18 years (mean age of 14.81) for the analyses, including 2,848 males (49.7%) and 2,878 females (50.3%). The study protocol was reviewed and approved by the Biomedicine Ethics Committee of Anhui Medical University.
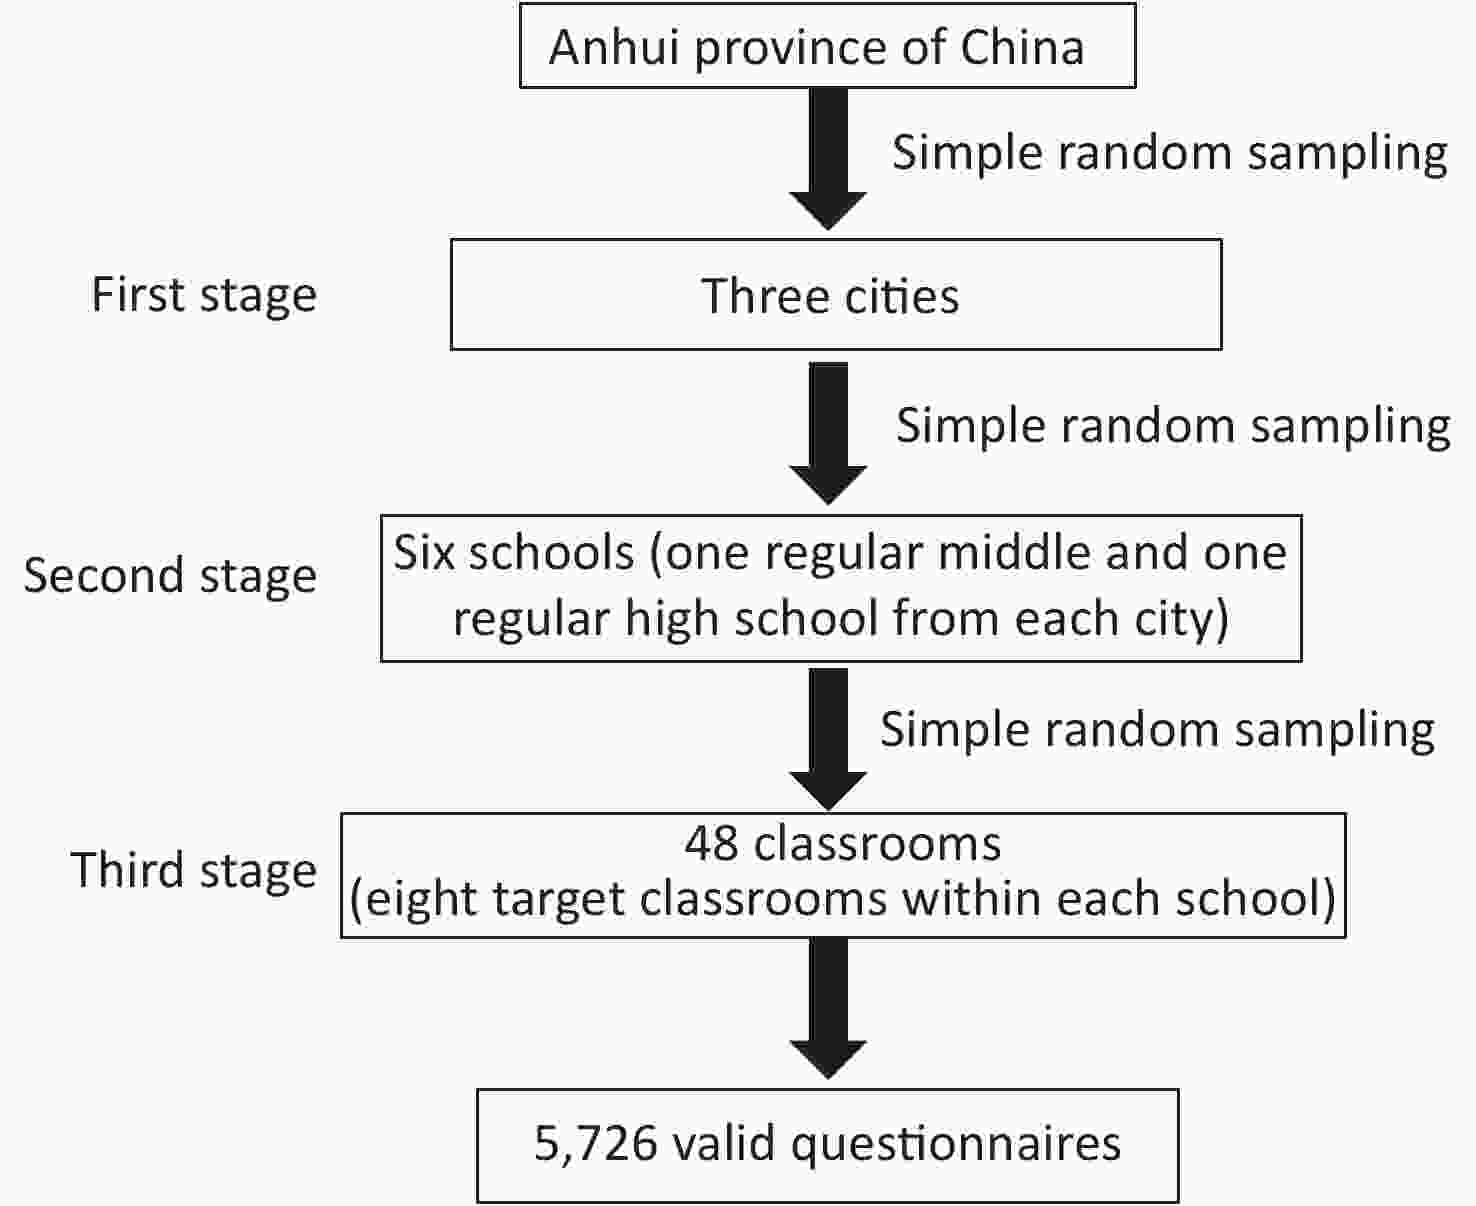
Figure 1. Flow chart for participants sampling in the study
-
In this study, we simultaneously considered multiple indices of childhood adversity to determine which kinds of adversity matter most for risky adolescent health behaviors in the Chinese social context. Thus, we gathered data on exposure to adverse childhood events based on the living environments of the children in four domains (i.e., adverse family, peer, school, and personal events). Based on previous studies[10-15, 31] and our research on the Chinese cultural context, the following 27 categories were included (see Supplementary Method available in www.besjournal.com). Specifically, details about five types of childhood maltreatment (assessed by using the Chinese version of the Childhood Trauma Questionnaire-Short Form[27-29]), ten types of family adversity and three types of peer victimization[27], and one type of physical disability and chronic illness[28] have been provided in our previous studies. An additional eight items of school adversity were adopted from previous studies[14, 31-33]. Each type of childhood adversity was dichotomized (yes/no). Further details on the ACE measurements are provided in the Supplementary Method.
Types Items References Childhood maltreatment 25 items [1-2] Physical abuse (PA) The Childhood Trauma Questionnaire
Short Form (CTQ-SF)The CTQ-SF cut-off scores used in this study were as follows: PA ≥ 8; EA ≥ 9; SA ≥ 6; PN ≥ 8; and EN ≥ 10 Emotional abuse (EA) Sexual abuse(SA) Physical neglect (PN) Emotional neglect (EN) Childhood peer victimization Six items (details see our previous study[5]) [3-4] Physical peer victimization (1) hitting, kicking, pushing, shoving, or locking indoors
(2) blackmailing for money or damaging thingsThe response options: 1 = never; 2 = rarely; 3 = sometimes; 4 = often; and 5 = very often. We used the criterion that students were bullied sometimes to evaluate occurrences of physical, verbal and relational victimization. Verbal peer victimization (1) calling mean names or making fun or teasing in a hurtful way
(2) saying mean things about an accentRelational peer victimization (1) excluding others from their group of friends or leaving others out of things on purpose
(2) telling lies or spreading false rumours about others or sending mean notes and trying to make others unpopularChildhood family adversity Ten items (details see our previous study[5]) [5-6] Family financial difficulties Response option: 0 = no and 1 = yes. Parents often fight or quarrel Response option: 0 = no and 1 = yes. Family trauma (e.g., earthquake,
fire, and theft)Response option: 0 = no and 1 = yes. Parents overconsume alcohol or are addicted to gambling; Response option: 0 = no and 1 = yes. Disabled family member; Response option: 0 = no and 1 = yes. Parental absence; Response option: 0 = no and 1 = yes. Family member involved in a crime; Response option: 0 = no and 1 = yes. Parental divorce; Response option: 0 = no and 1 = yes. Death of family member; Response option: 0 = no and 1 = yes. Family member with a serious illness Response option: 0 = no and 1 = yes. Childhood school adversity Eight items [6-9] The teacher prejudiced against me Response option: 0 = no and 1 = yes. Being scolded or insulted by a teacher Response option: 0 = no and 1 = yes. Being physically punished by a teacher Response option: 0 = no and 1 = yes. Reluctance to go to school Response option: 0 = no and 1 = yes. Poor academic performance Response option: 0 = no and 1 = yes. Having difficulty getting along with classmates Response option: 0 = no and 1 = yes. Being laughed at by classmates Response option: 0 = no and 1 = yes. Being insulted by classmates Response option: 0 = no and 1 = yes. Physical disability and chronic illness Do you have any physical disabilities or long-term health problems in childhood?” (More details are provided in our previous study[10] ). The response options were as follows: yes, no, and not sure. the response option of “No” and “Not sure” was combined into the one group (i.e., No). Table . Details for ACEs items
-
We used the six types of risky health behaviors as outcomes, including smoking, drinking, sex-related behavior, self-harm, suicidal ideation and suicide attempts, based on the original study of ACEs and later ACE studies of adolescents [3-4, 34-35]. The following 6 questions were posed [36]: 1) smoking: “Have you ever tried smoking (including just a cigarette or two)?”; 2) drinking: “Have you ever had a habit of drinking alcohol (defined as drinking alcohol, including beer, liquor, wine, etc., at least once a month); 3) sexual intercourse: “Have you ever had sexual intercourse with someone?”; 4) self-harm: “In the last six months, how many times have you committed acts of self-harm that were not intended to end your life? (such as beating yourself, cutting yourself, pulling your own hair, etc. but not to end your life)”; 5) suicidal ideation: “Have you thought about ending your life in the past 6 months?”; and 6) suicide attempts: “Have you deliberately tried to end your life over the past 6 months?” These questions were coded with binary variables (yes/no).
-
Because demographic variables such as sex, grade level, self-perceived family socioeconomic status, self-perceived maternal and paternal relationships, friend quantity, only child status and character, and academic performance have previously been associated with risky health behaviors and ACEs [3-6, 18, 22, 35], the above sociodemographic information was collected through self-reports from the participants. Information on the sociodemographic covariates is shown in Supplementary Table S1 (available in www.besjournal.com).
Variables n High
adversity
n (%)Peer
victimization
n (%)School
adversity
n (%)Maltreatment
and peer
victimization
n (%)School adversity
and peer
victimization
n (%)Low
adversity
n (%)χ2
valueP
valueSex 28.421 < 0.001 Males 2,848 119 (58.6) 442 (50.6) 720 (45.5) 92 (62.6) 568 (19.9) 907 (50.1) Females 2,878 84 (41.4) 432 (49.4) 861 (54.5) 55 (37.4) 554 (18.9) 902 (49.9) Grade 74.350 < 0.001 Middle 2,958 99 (3.3) 517 (59.2) 722 (45.7) 86 (58.5) 515 (46.3) 1,019 (56.3) High 2,768 104 (3.8) 357 (40.8) 859 (54.3) 61 (41.5) 597 (53.7) 790 (43.7) Self-perceived family status 149.701 < 0.001 Poor 800 52 (25.6) 101 (11.6) 216 (19.4) 24 (16.3) 268 (17.0) 139 (7.7) Medium 4,377 136 (67.0) 678 (77.6) 833 (74.9) 112 (76.2) 1,167 (73.8) 1,451 (80.2) Good 549 15 (7.4) 95 (10.9) 63 (5.7) 11 (7.5) 146 (9.2) 219 (12.1) Only child 102.941 < 0.001 No 2,469 76 (37.4) 422 (48.3) 589 (37.3) 62 (42.2) 399 (35.9) 921 (50.9) Yes 3,257 127 (62.6) 452 (51.7) 992 (62.7) 85 (57.8) 713 (64.1) 888 (49.1) Family structure 42.718 < 0.001 Nuclear family 3,792 128 (63.1) 561 (64.2) 1,031 (65.2) 106 (72.1) 736 (66.2) 1,230 (68.0) Lager family 1,353 41 (20.2) 241 (27.6) 355 (22.5) 26 (17.7) 260 (23.4) 430 (23.8) Single-parent family 469 26 (12.8) 59 (6.8) 161 (10.2) 10 (6.8) 90 (8.1) 123 (6.8) Others 112 8 (3.9) 13 (1.5) 34 (2.2) 5 (3.4) 26 (2.3) 26 (1.4) Relationship with father 138.630 < 0.001 Poor 1,911 123 (60.6) 269 (30.8) 529 (33.5) 70 (47.6) 438 (39.4) 482 (26.6) Good 3,815 80 (39.4) 605 (69.2) 1,052 (66.5) 77 (52.4) 674 (60.6) 1,327 (73.4) Relationship with mother 125.274 < 0.001 Poor 1,353 94 (46.3) 175 (20.0) 370 (23.4) 64 (43.5) 304 (27.3) 346 (19.1) Good 4,373 109 (53.7) 699 (80.0) 1,211 (76.6) 83 (56.5) 808 (72.7) 1,463 (80.9) Character trait 40.795 < 0.001 Introvert 1,278 52 (25.6) 161 (18.4) 347 (21.9) 24 (16.3) 311 (28.0) 383 (21.2) Neutral 2,281 78 (38.4) 355 (40.6) 652 (41.2) 52 (35.4) 421 (37.9) 723 (40.0) Extrovert 2,167 73 (36.0) 358 (41.0) 582 (36.8) 71 (48.3) 380 (34.2) 703 (38.9) Academic performance 186.560 < 0.001 Low 1,380 80 (39.4) 143 (16.4) 452 (28.6) 52 (35.4) 347 (31.2) 306 (16.9) Medium 3,201 87 (42.9) 502 (57.4) 870 (55.0) 75 (51.0) 583 (52.4) 1,084 (59.9) High 1,145 36 (17.7) 229 (26.2) 259 (16.4) 20 (13.6) 182 (16.4) 419 (23.2) Number of friends 61.828 < 0.001 < 3 1,439 79 (38.9) 212 (24.3) 383 (24.2) 35 (23.8) 350 (31.5) 380 (21.0) ≥ 3 4,287 124 (61.1) 662 (75.7) 1,198 (75.8) 112 (76.2) 762 (68.5) 1,492 (79.0) Table S1. Descriptive statistics for the LCA classes by different sociodemographic characteristics
-
A series of LCA models were established to determine mutually exclusive ACE groups using Mplus 6.4. The optimal solution was selected based on the Akaike information criterion (AIC), Bayesian information criterion (BIC), adjusted BIC (aBIC), Lo-Mendell-Rubin (LMR) P value, and entropy value[37-39]. Lower AIC, BIC, and aBIC values and a significant p value from the LMR test show a better-fitting model, and entropy values closer to 1 show a clearer classification of groups[37-39].
A partial least square discriminant analysis (PLS-DA) was performed to determine which of the 27 ACE types best differentiated the ACE latent classes using R software version 3.5.1 (the R Foundation for Statistical Computing, Vienna, Austria) (mixOmcs packages)[40]. The optimal number of components was determined using a 5-fold cross-validation method[41]. We used the variable importance in the projection (VIP) index to determine the importance of the variables in the model, and variables with a VIP value higher than 1 were considered important variables from discriminating the different LCA classes. Univariate and multivariate logistic regression tests (adjusting for covariates) were used to explore the associations between LCA classes and risky health behaviors using SPSS version 21.0 (IBM, Armonk, NY, USA) as well as the relationships between the ACE types that most strongly discriminated LCA classes and risky health behaviors. The level of significance was set at < 0.05. Considering the low prevalence of some types of risky health behaviors, Poisson regression models were also conducted to explore the relationships, and the results remained robust. We include these results in the Supplementary Figures S1–S3 (available in www.besjournal.com).
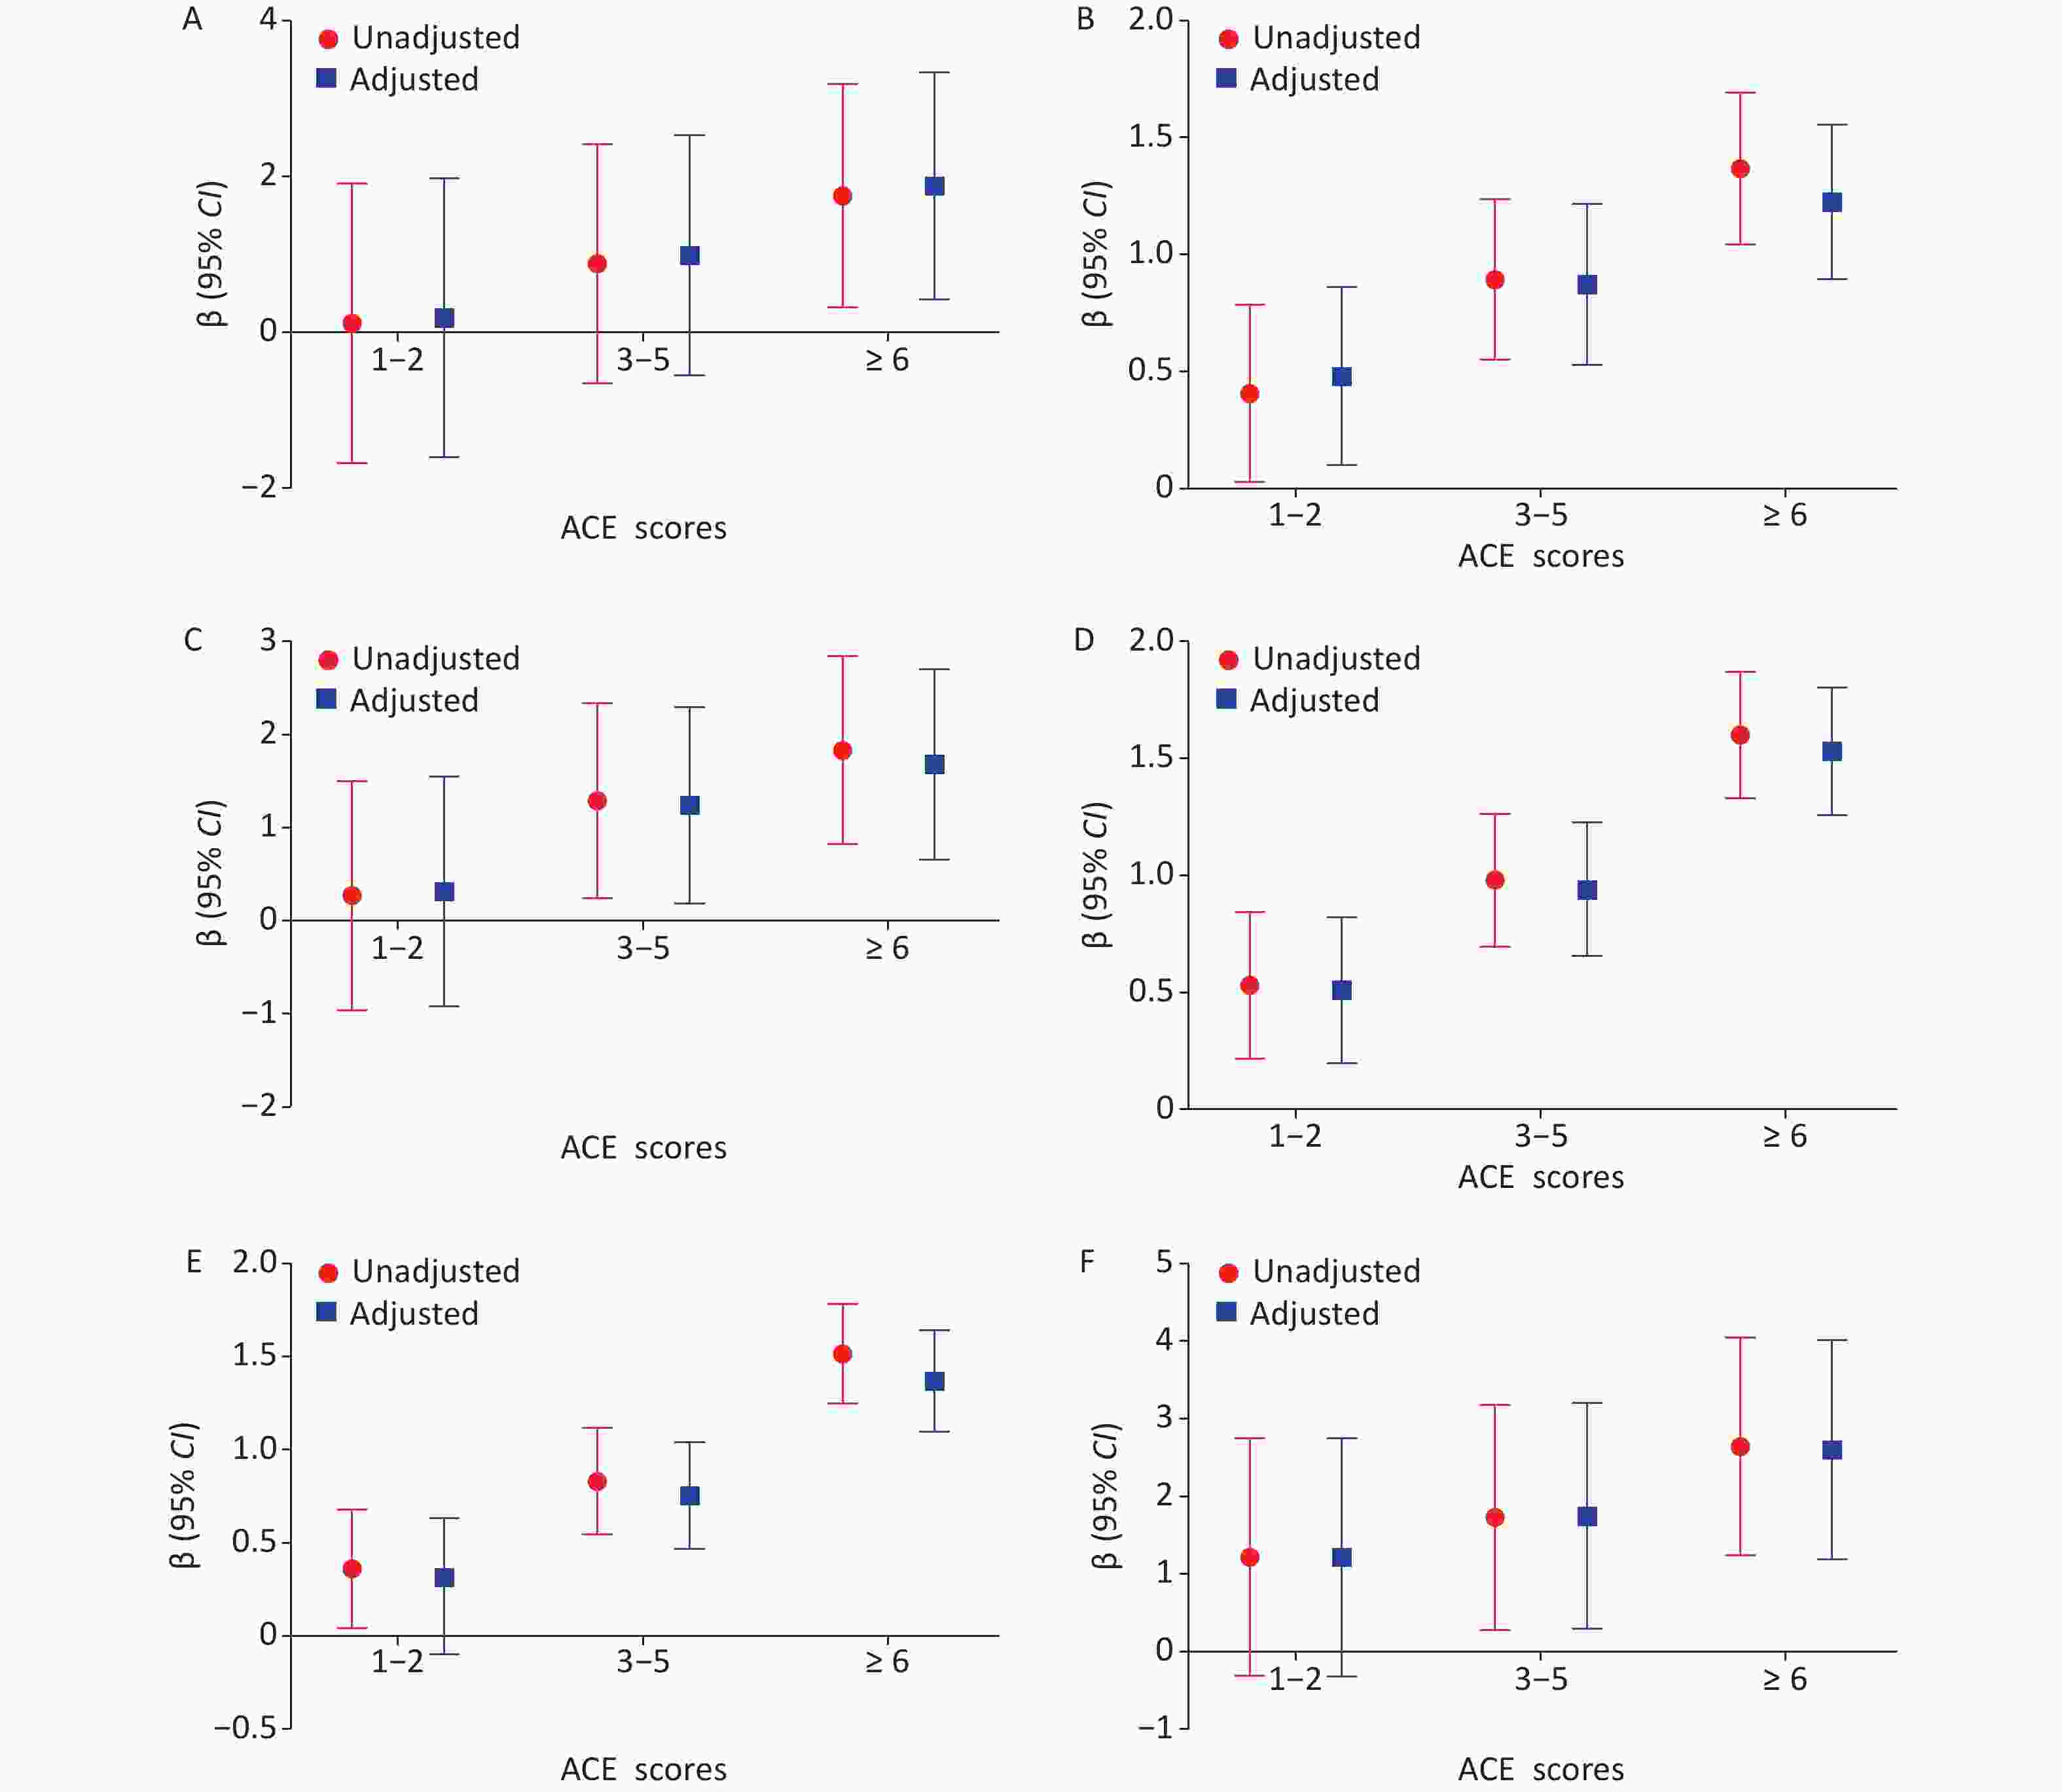
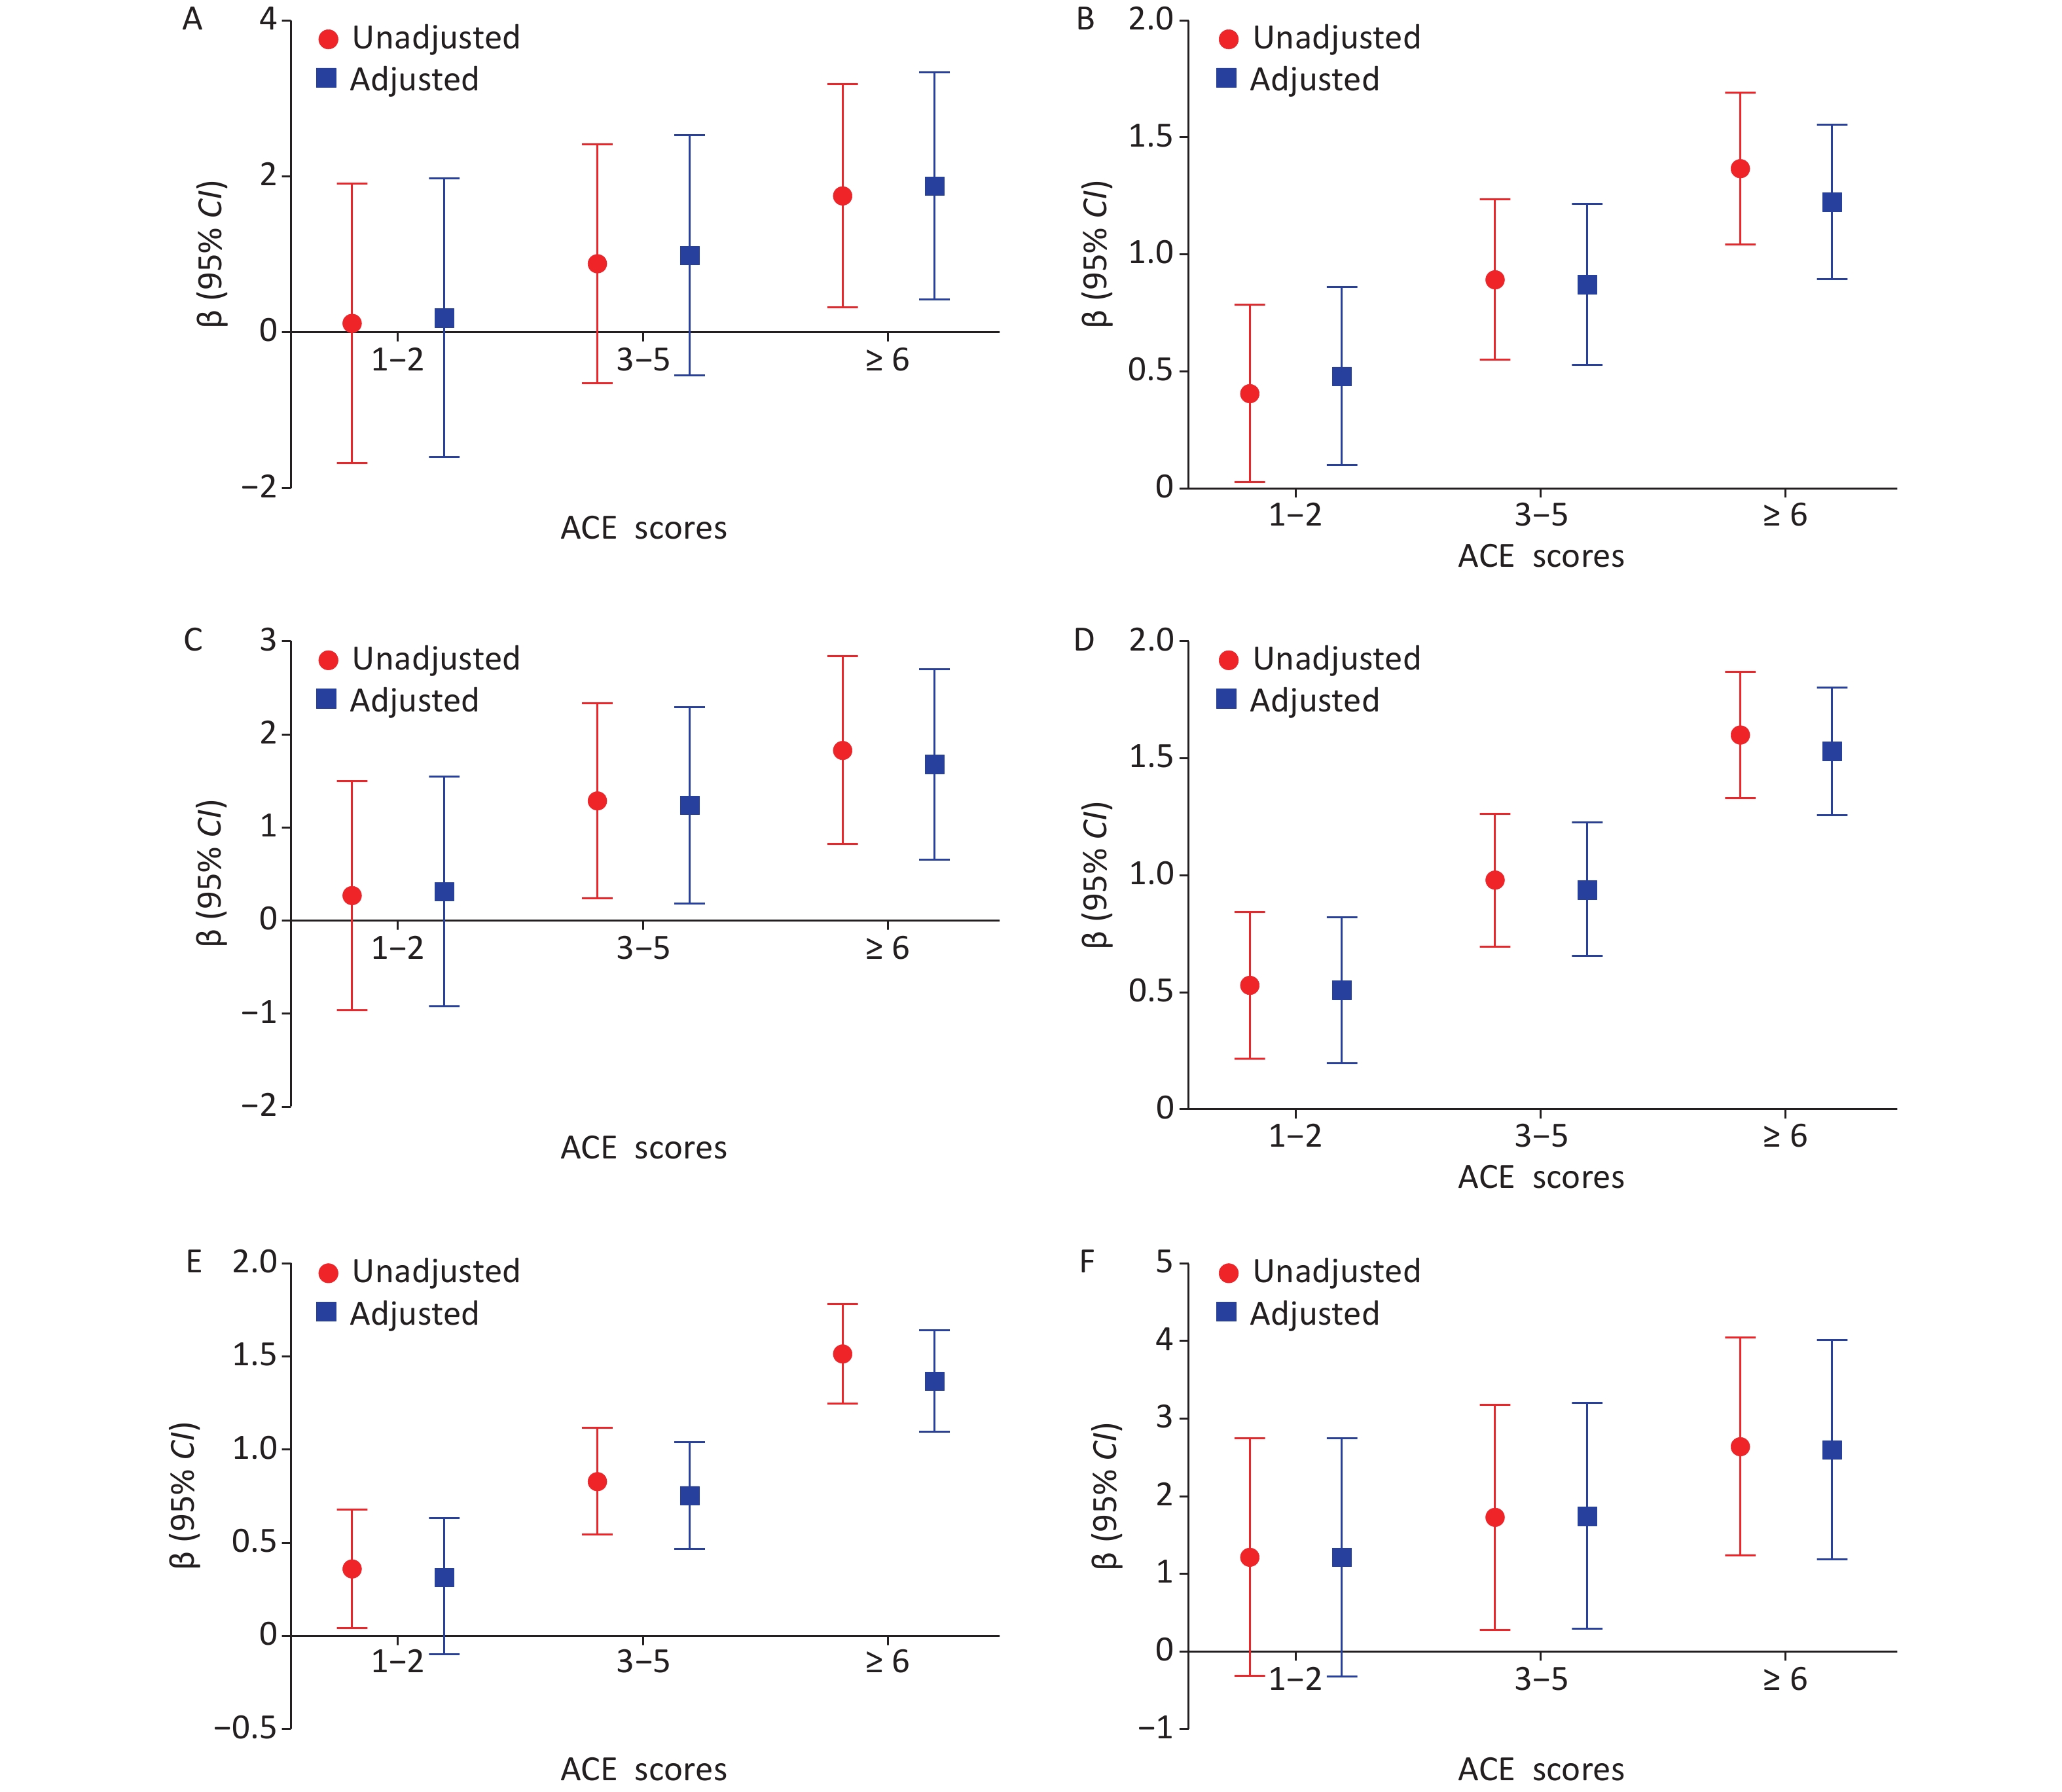
Figure S1. Possion regression models for unadjusted and adjusted β (95% CI) for the association between ACE scores and risky health behaviors among adolescents (Reference group = None): (A) smoking, (B) drinking, (C) sexual intercourse, (D) self-harm, (E) suicidal ideation, and (F) suicidal attempts. In the adjusted models, we adjusted models, we adjusted the sociodemographic covariates, including sex, grade, self-perceived family socioeconomic status, self-perceived relation with mother and father, number of friends, only-child status and character trait, and academic performance.
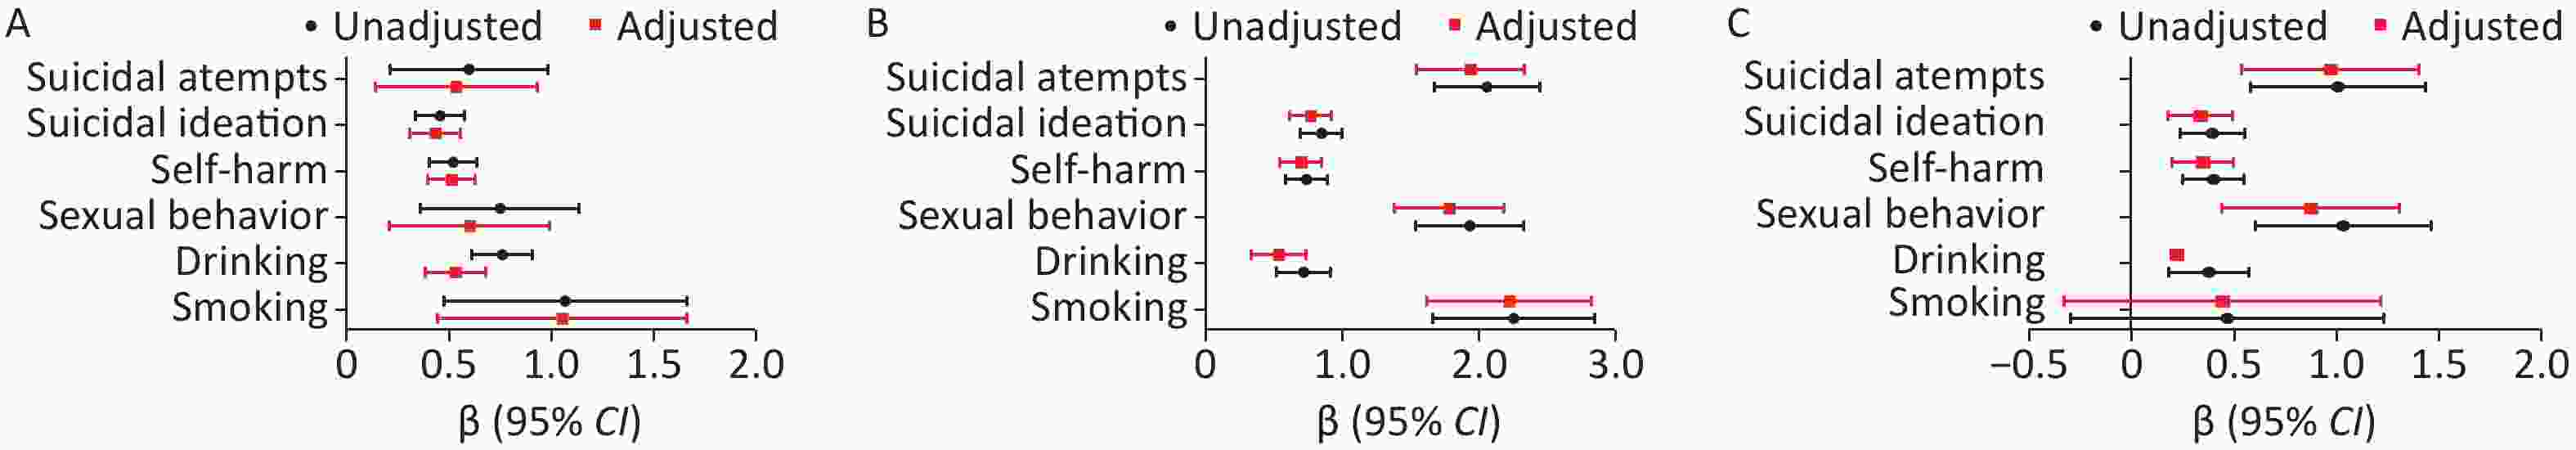
Figure S3. Possion regression models for unadjusted and adjusted β (95% Cl) for the association between (A) being physically punished by a teacher (Reference group = No), (B) sexual abuse (Reference group = No) and (C) Family trauma (Reference group = No) and risky health behaviors among adolescents. In the adjusted models, we adjusted the sociodemographic covariates, including sex, grade, self-perceived family socioeconomic status, self-perceived relationship with mother and father, number of friends, only-child status and character trait, and academic performance.
-
As shown in Figure 2, two types of adversity have a prevalence rate of more than 40%, six types of adversity have a prevalence rate of more than 30%, and twelve types of adversity have a prevalence rate of 20%. Specifically, verbal peer victimization (41.9%), poor academic performance (40.2%), and being scolded or insulted by a teacher (36.7%) were the most common types of adversity. The prevalence rate of self-harm was 21.0% (1,203/5,726), followed by those of suicidal ideation (19.3%, 1,103/5,726), drinking (12.4%, 710/5,726), suicide attempts (1.8%, 105/5,726), sexual behavior (1.8%, 103/5,726) and smoking (0.8%, 44/5,726) .
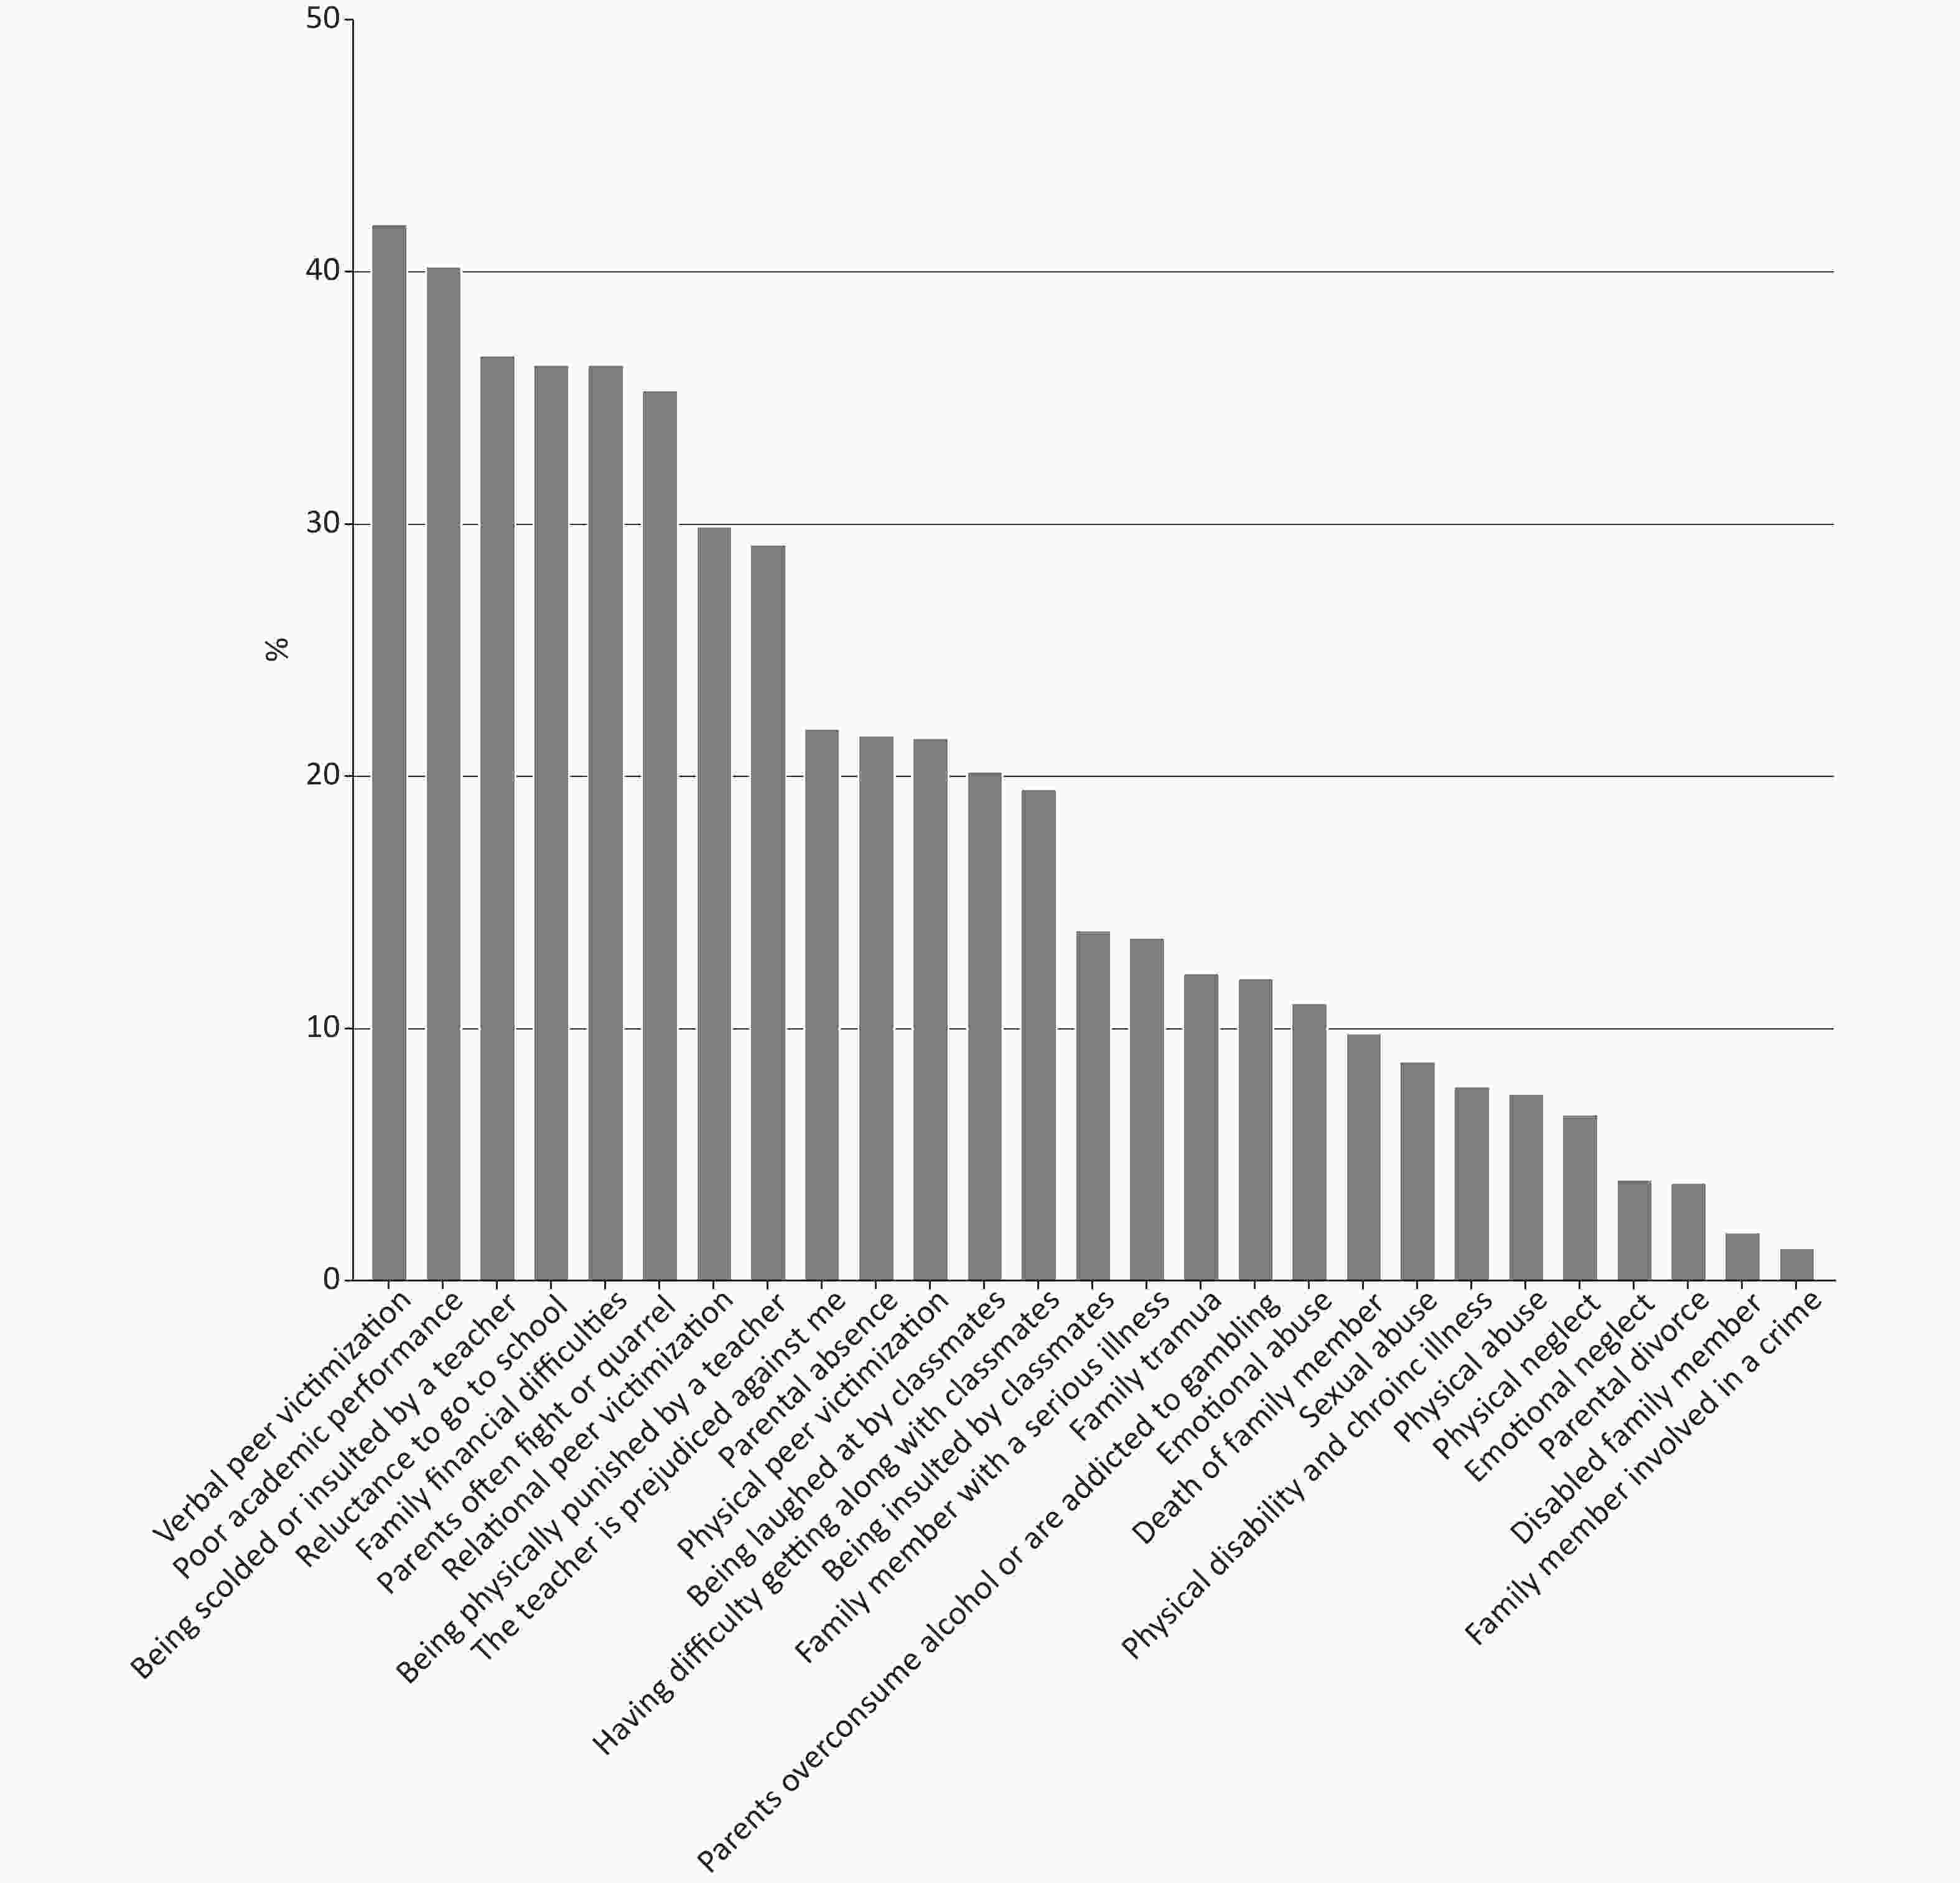
Figure 2. Prevalence of 27 types of ACEs
-
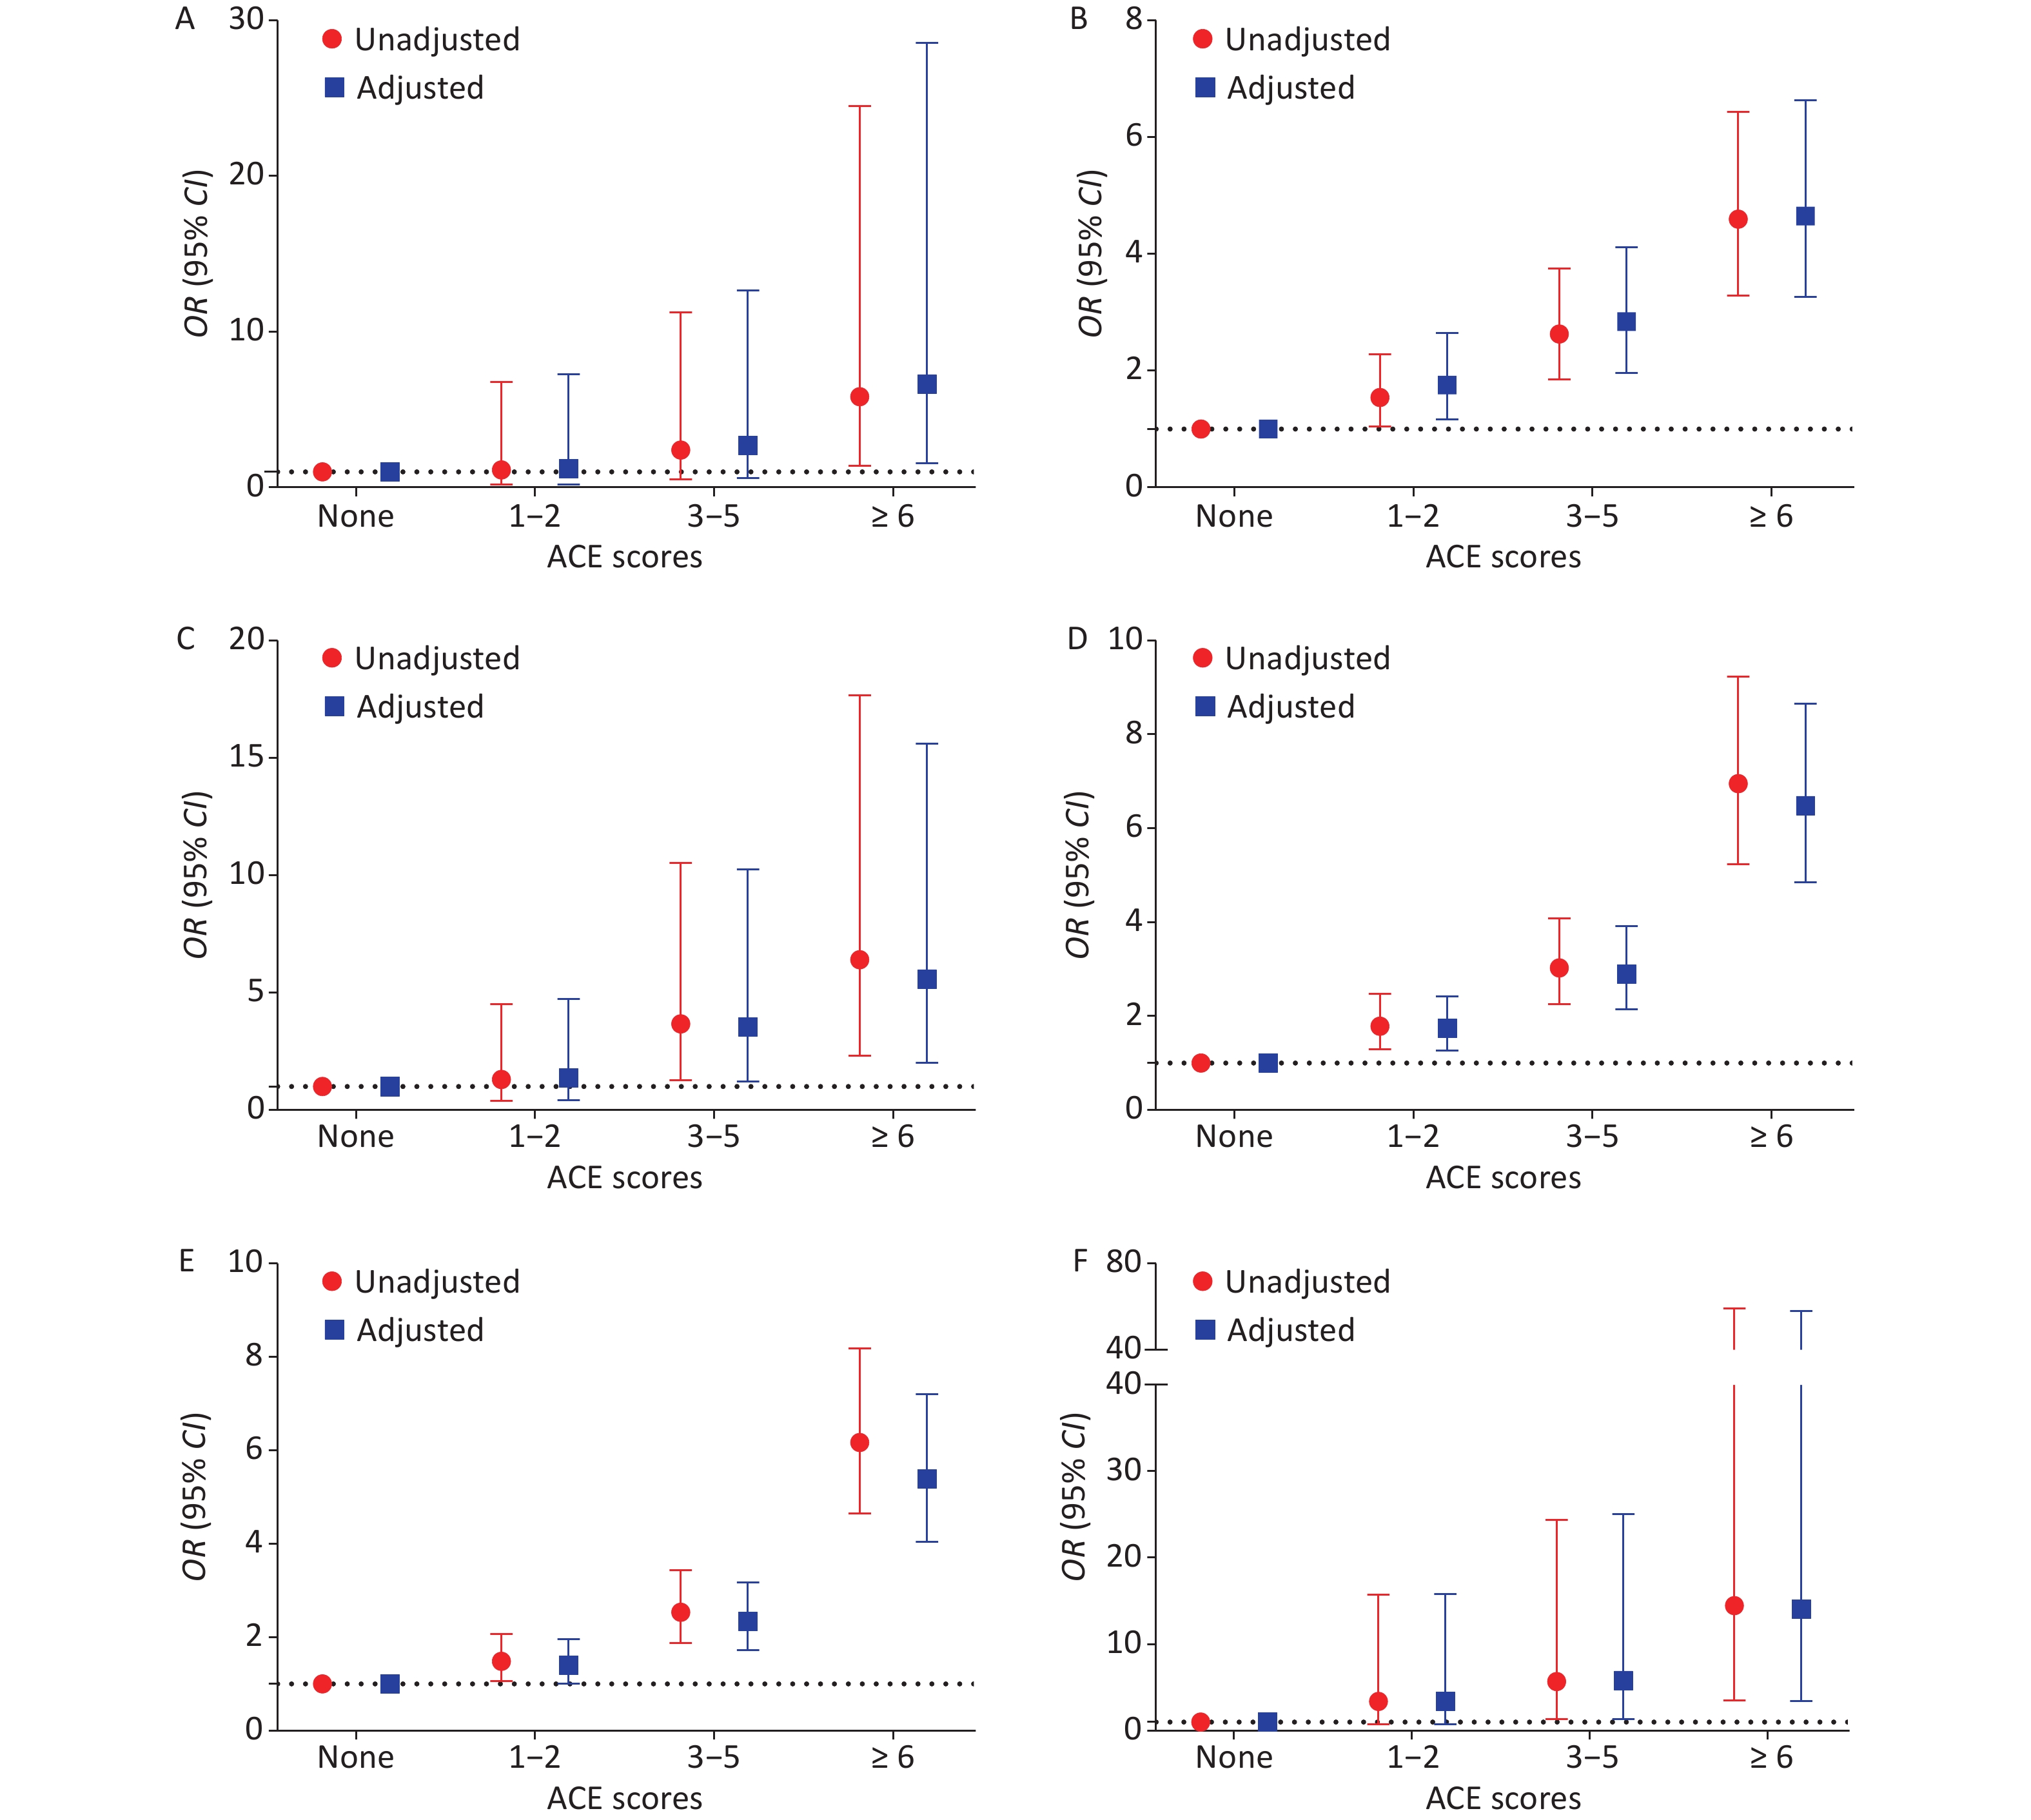
In total, 85.3% of the individuals had experienced at least one type of ACE. Specifically, 19.6% of the participants had experienced one or two types of adversity, 27.4% had experienced 3-5 types ACEs, and 38.2% had experienced at least six types of ACEs. Descriptive statistics for ACEs scores and adolescent health risky behaviors are shown in Supplementary Table S2 (available in www.besjournal.com). Students with 3–5 ACEs and ≥ 6 ACEs were associated with an increased risk for drinking, sexual behavior, self-harm, suicidal ideation and suicide attempts in both univariate and multivariate regression models compared to those with no ACEs. However, only a positive association between ≥ 6 ACEs and smoking was observed (Figure 3).
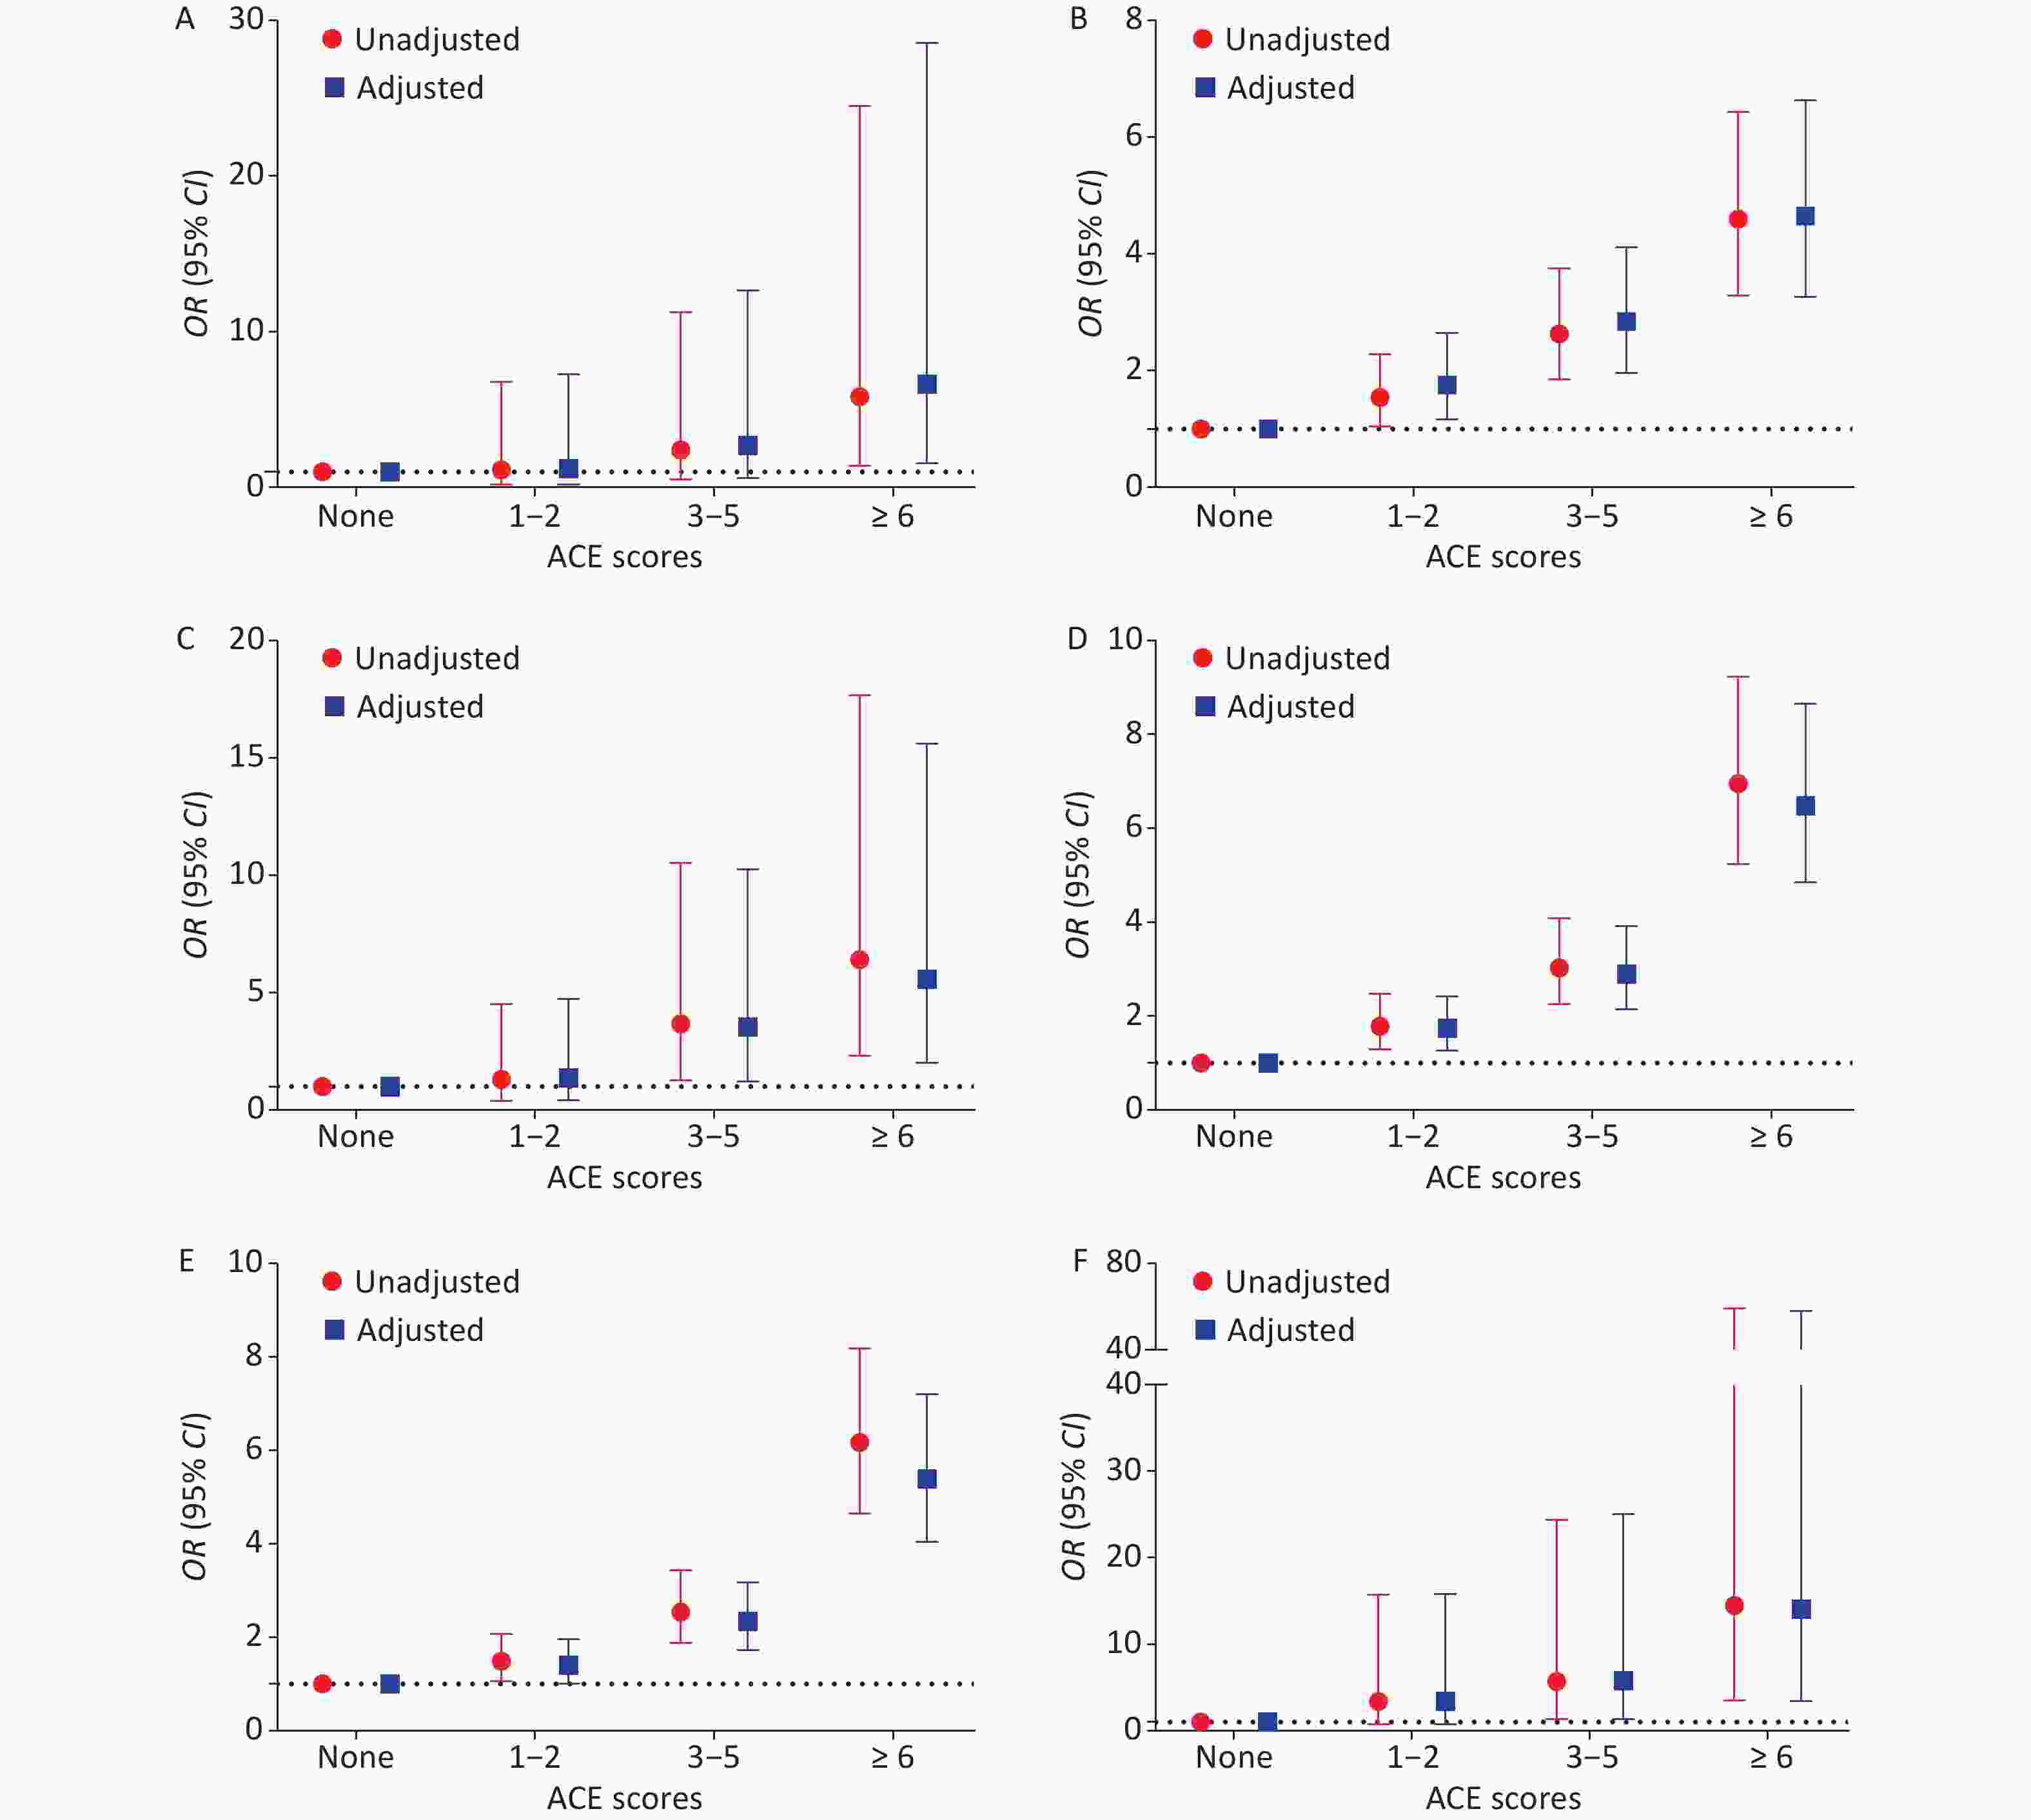
Figure 3. Logistic regression models for unadjusted OR (95% CI) for the association between ACE scores and risky health behaviors among adolescents (Reference group = None): (A) smoking, (B) Drinking, (C) sexual intercourse, (D) self-harm, (E) suicidal ideation, and (F) suicidal attempts. In the adjusted models, we adjusted the sociodemographic covariates, including sex, grade, self-perceived family socioeconomic status, self-perceived relationship with mother and father, number of friends, only-child status and character trait, and academic performance.
Variables n (%) Smoking
n (%)Drinking
n (%)Sexual
intercourse
n (%)Self-harm
n (%)Suicidal
ideation
n (%)Suicidal
attempts
n (%)ACEs scores None 843 (14.7) 2 (0.0) 40 (0.7) 4 (0.1) 57 (1.0) 58 (1.0) 2 (0.0) 1−2 1,123 (19.6) 3 (0.1) 80 (1.4) 7 (0.1) 129 (2.3) 111 (1.9) 9 (0.2) 3−5 1,507 (27.4) 9 (0.2) 182 (3.2) 27 (0.5) 283 (4.9) 248 (4.3) 21 (0.4) ≥ 6 2,190 (38.2) 30 (0.5) 408 (7.1) 65 (1.1) 734 (12.8) 686 (12.0) 73 (1.3) LCA classes Low adversity 1,809 (31.6) 4 (0.2) 108 (6.0) 11 (0.6) 165 (9.1) 152 (8.4) 8 (0.4) School adversity and peer victimization 1,112 (19.4) 12 (1.1) 202 (18.2) 27 (2.4) 353 (31.7) 329 (29.6) 20 (1.8) Maltreatment and peer victimization 147 (2.6) 5 (3.4) 31 (21.1) 10 (6.8) 65 (44.2) 65 (44.2) 18 (12.2) School adversity 1,581 (27.6) 8 (0.5) 219 (13.9) 25 (1.6) 324 (20.5) 277 (17.5) 18 (1.1) Peer victimization 874 (15.3) 7 (0.8) 96 (11.0) 14 (1.6) 181 (20.7) 165 (18.9) 21 (2.4) High adversity 203 (3.5) 8 (3.9) 54 (26.6) 16 (7.9) 115 (56.7) 115 (56.7) 20 (9.9) Being corporally punished by the teacher No 4,053 (70.8) 20 (0.5) 377 (9.3) 55 (1.4) 24 (3.0) 668 (16.5) 60 (1.5) Yes 1,673 (29.2) 24 (1.4) 333 (19.9) 48 (2.9) 112 (26.0) 435 (26.0) 45 (2.7) Sexual abuse No 5,227 (91.3) 23 (0.4) 594 (11.4) 589 (23.9) 1,003 (19.2) 902 (17.3) 60 (1.1) Yes 499 (8.7) 21 (4.2) 116 (23.2) 992 (30.5) 200 (40.1) 201 (40.3) 45 (9.0) Family Trauma No 5,025 (87.8) 36 (0.7) 590 (11.7) 1,031 (27.2) 996 (19.8) 914 (18.2) 76 (1.5) Yes 701 (12.2) 8 (1.1) 120 (17.1) 34 (30.4) 207 (29.5) 189 (27.0) 29 (4.1) Table S2. Descriptive statistics for ACE scores, LCA classes, being corporally punished by the teacher, sexual abuse, and family trauma and adolescent risky health behaviors
-
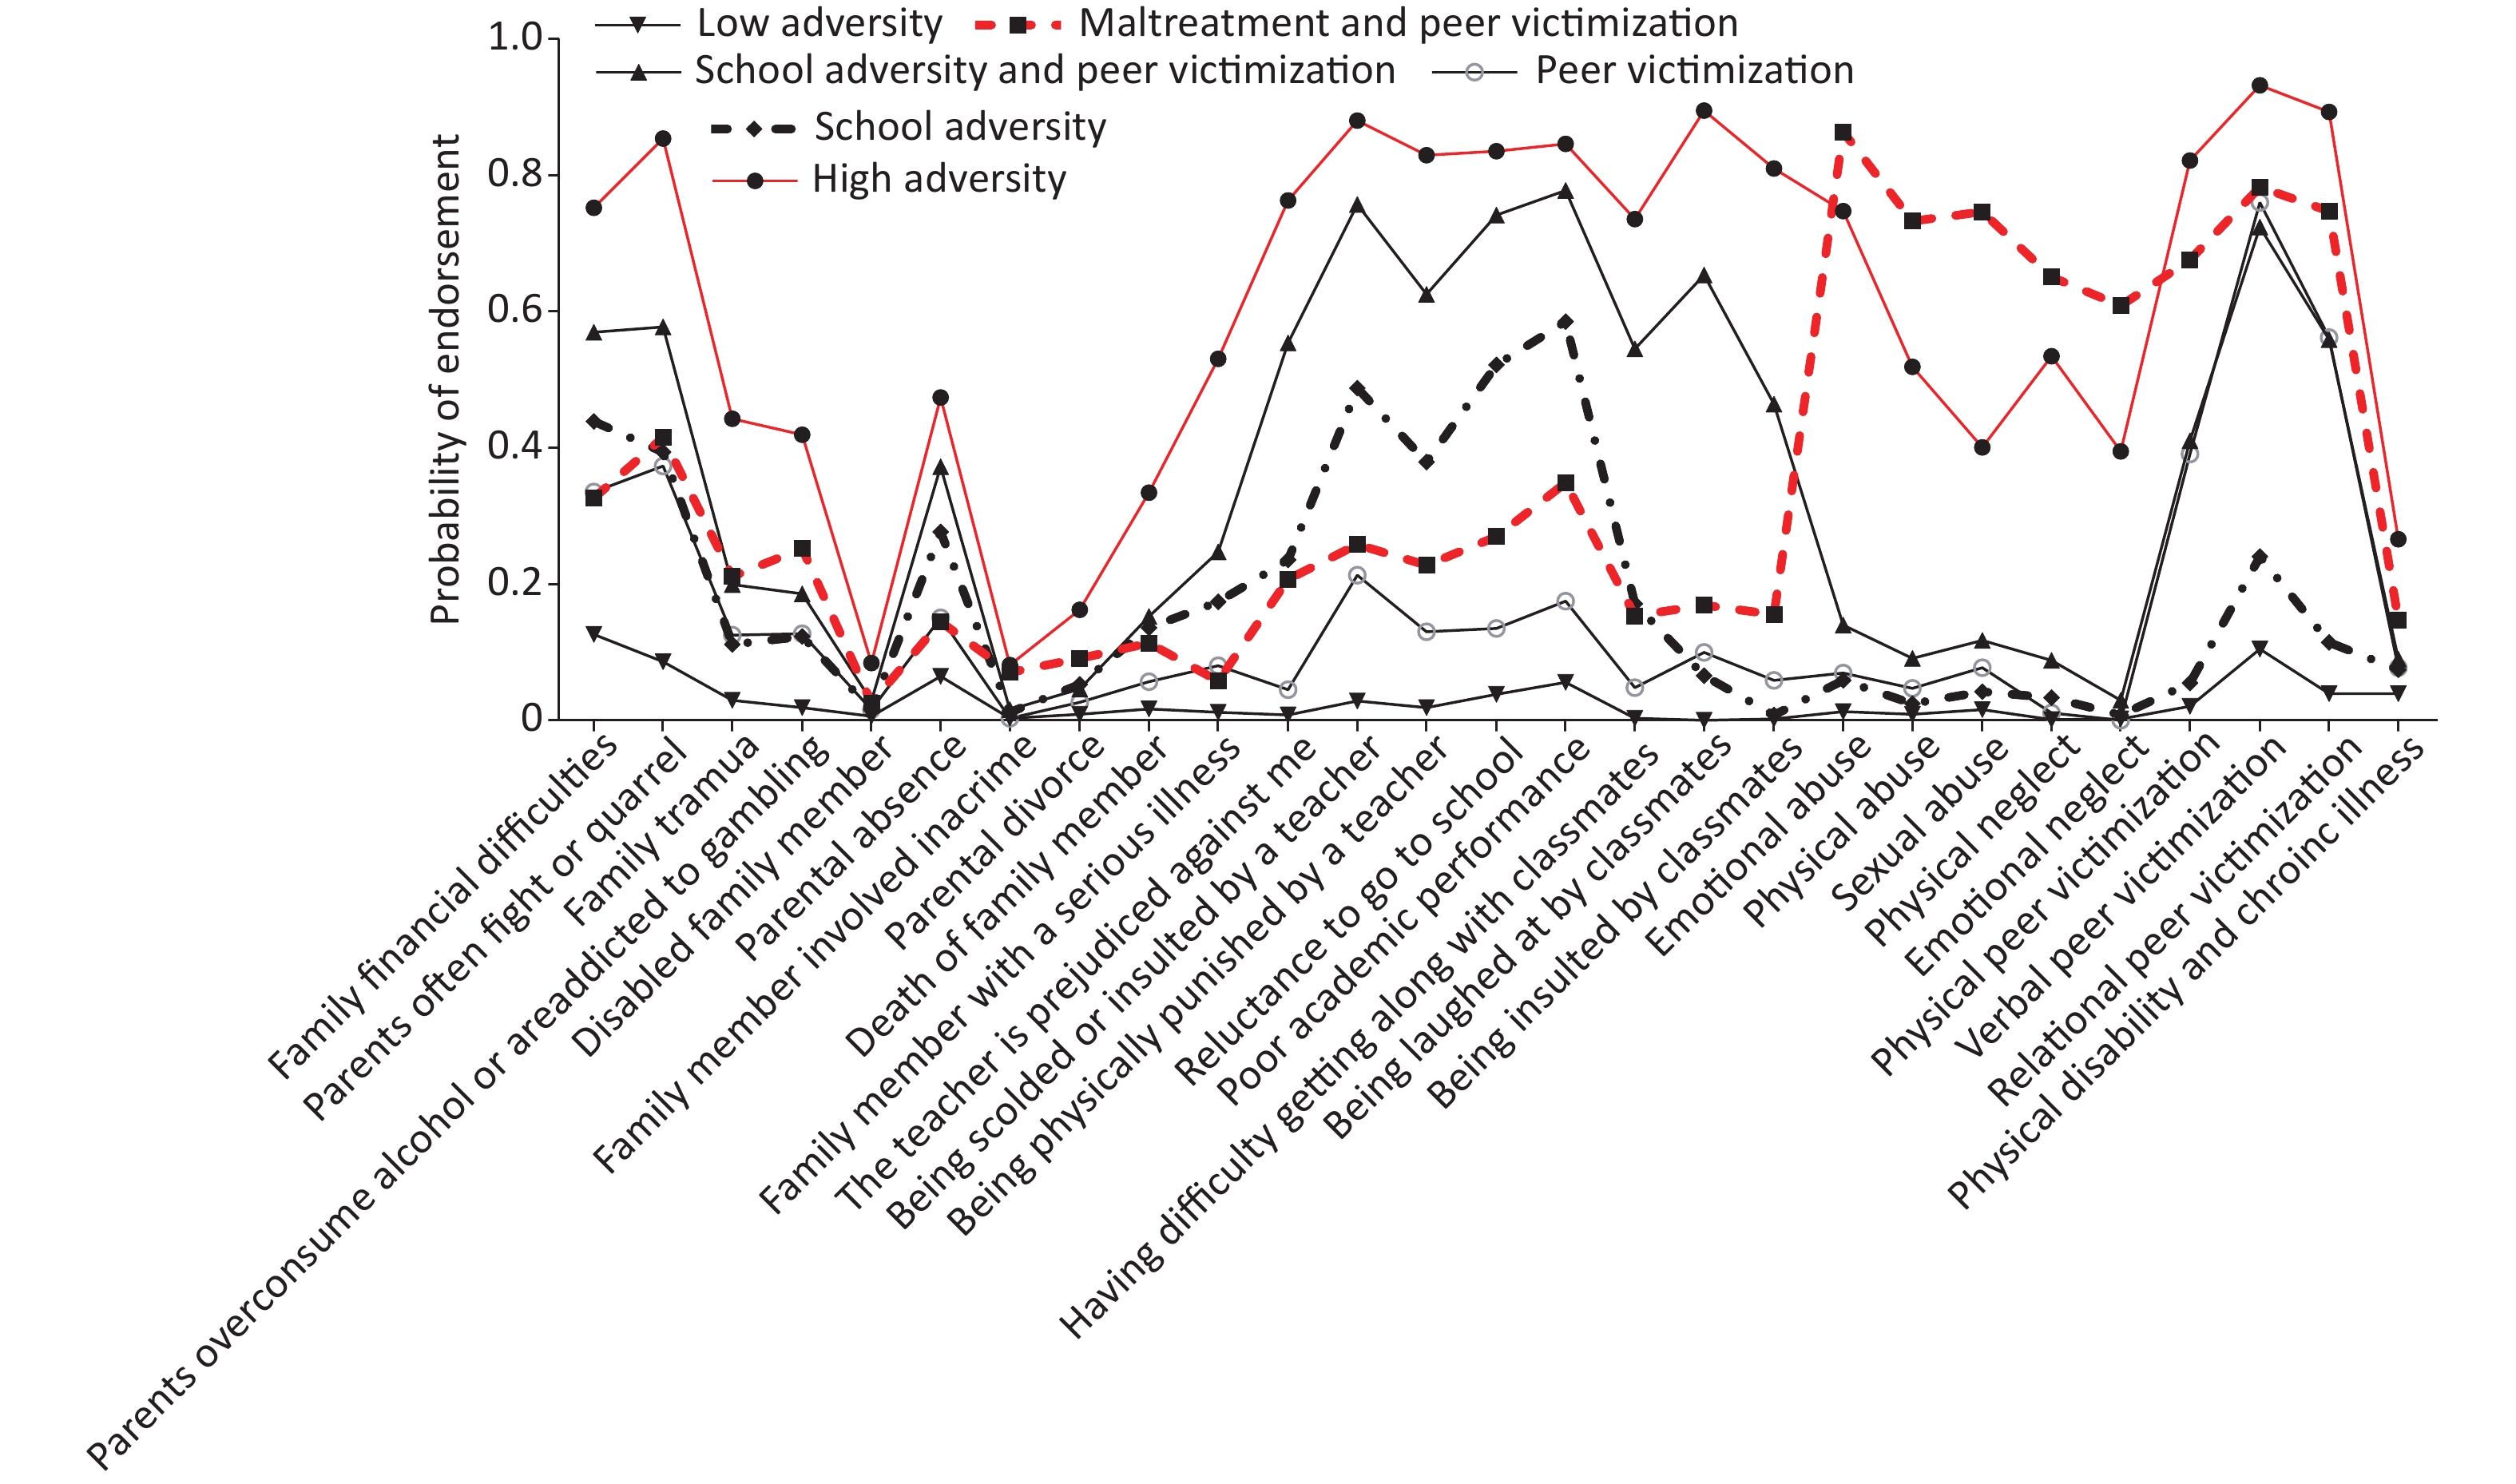
We compared the fit statistics of the LCA models to two to seven classes (see Supplementary Table S3 available in www.besjournal.com). The 6-class model was chosen based on a lower BIC, the aBIC value and an entropy value of close to 0.8 (0.793): (1) low exposure to all ACEs, labeled low adversity (1,809, 31.6%); (2) a high probability of exposure to school adversity, labeled school adversity (1,581, 27.6%); (3) a high probability of exposure to both school adversity and peer victimization, labeled school adversity and peer victimization (1,112, 19.4%); (4) a high probability of exposure to peer bullying, labeled peer victimization (874, 15.3%); (5) a high probability of exposure to maltreatment and peer bullying, labeled maltreatment and peer victimization (203, 3.5%); and (6) a high probability of exposure to all types of ACEs, labeled high adversity (147, 2.6%) (Figure 4). Sex, grade level, self-perceived family status, only child status, family structure, paternal relationship quality, maternal relationship quality, character traits, academic performance, and friend quantity were significantly linked to the ACE groups (Supplementary Table S1).
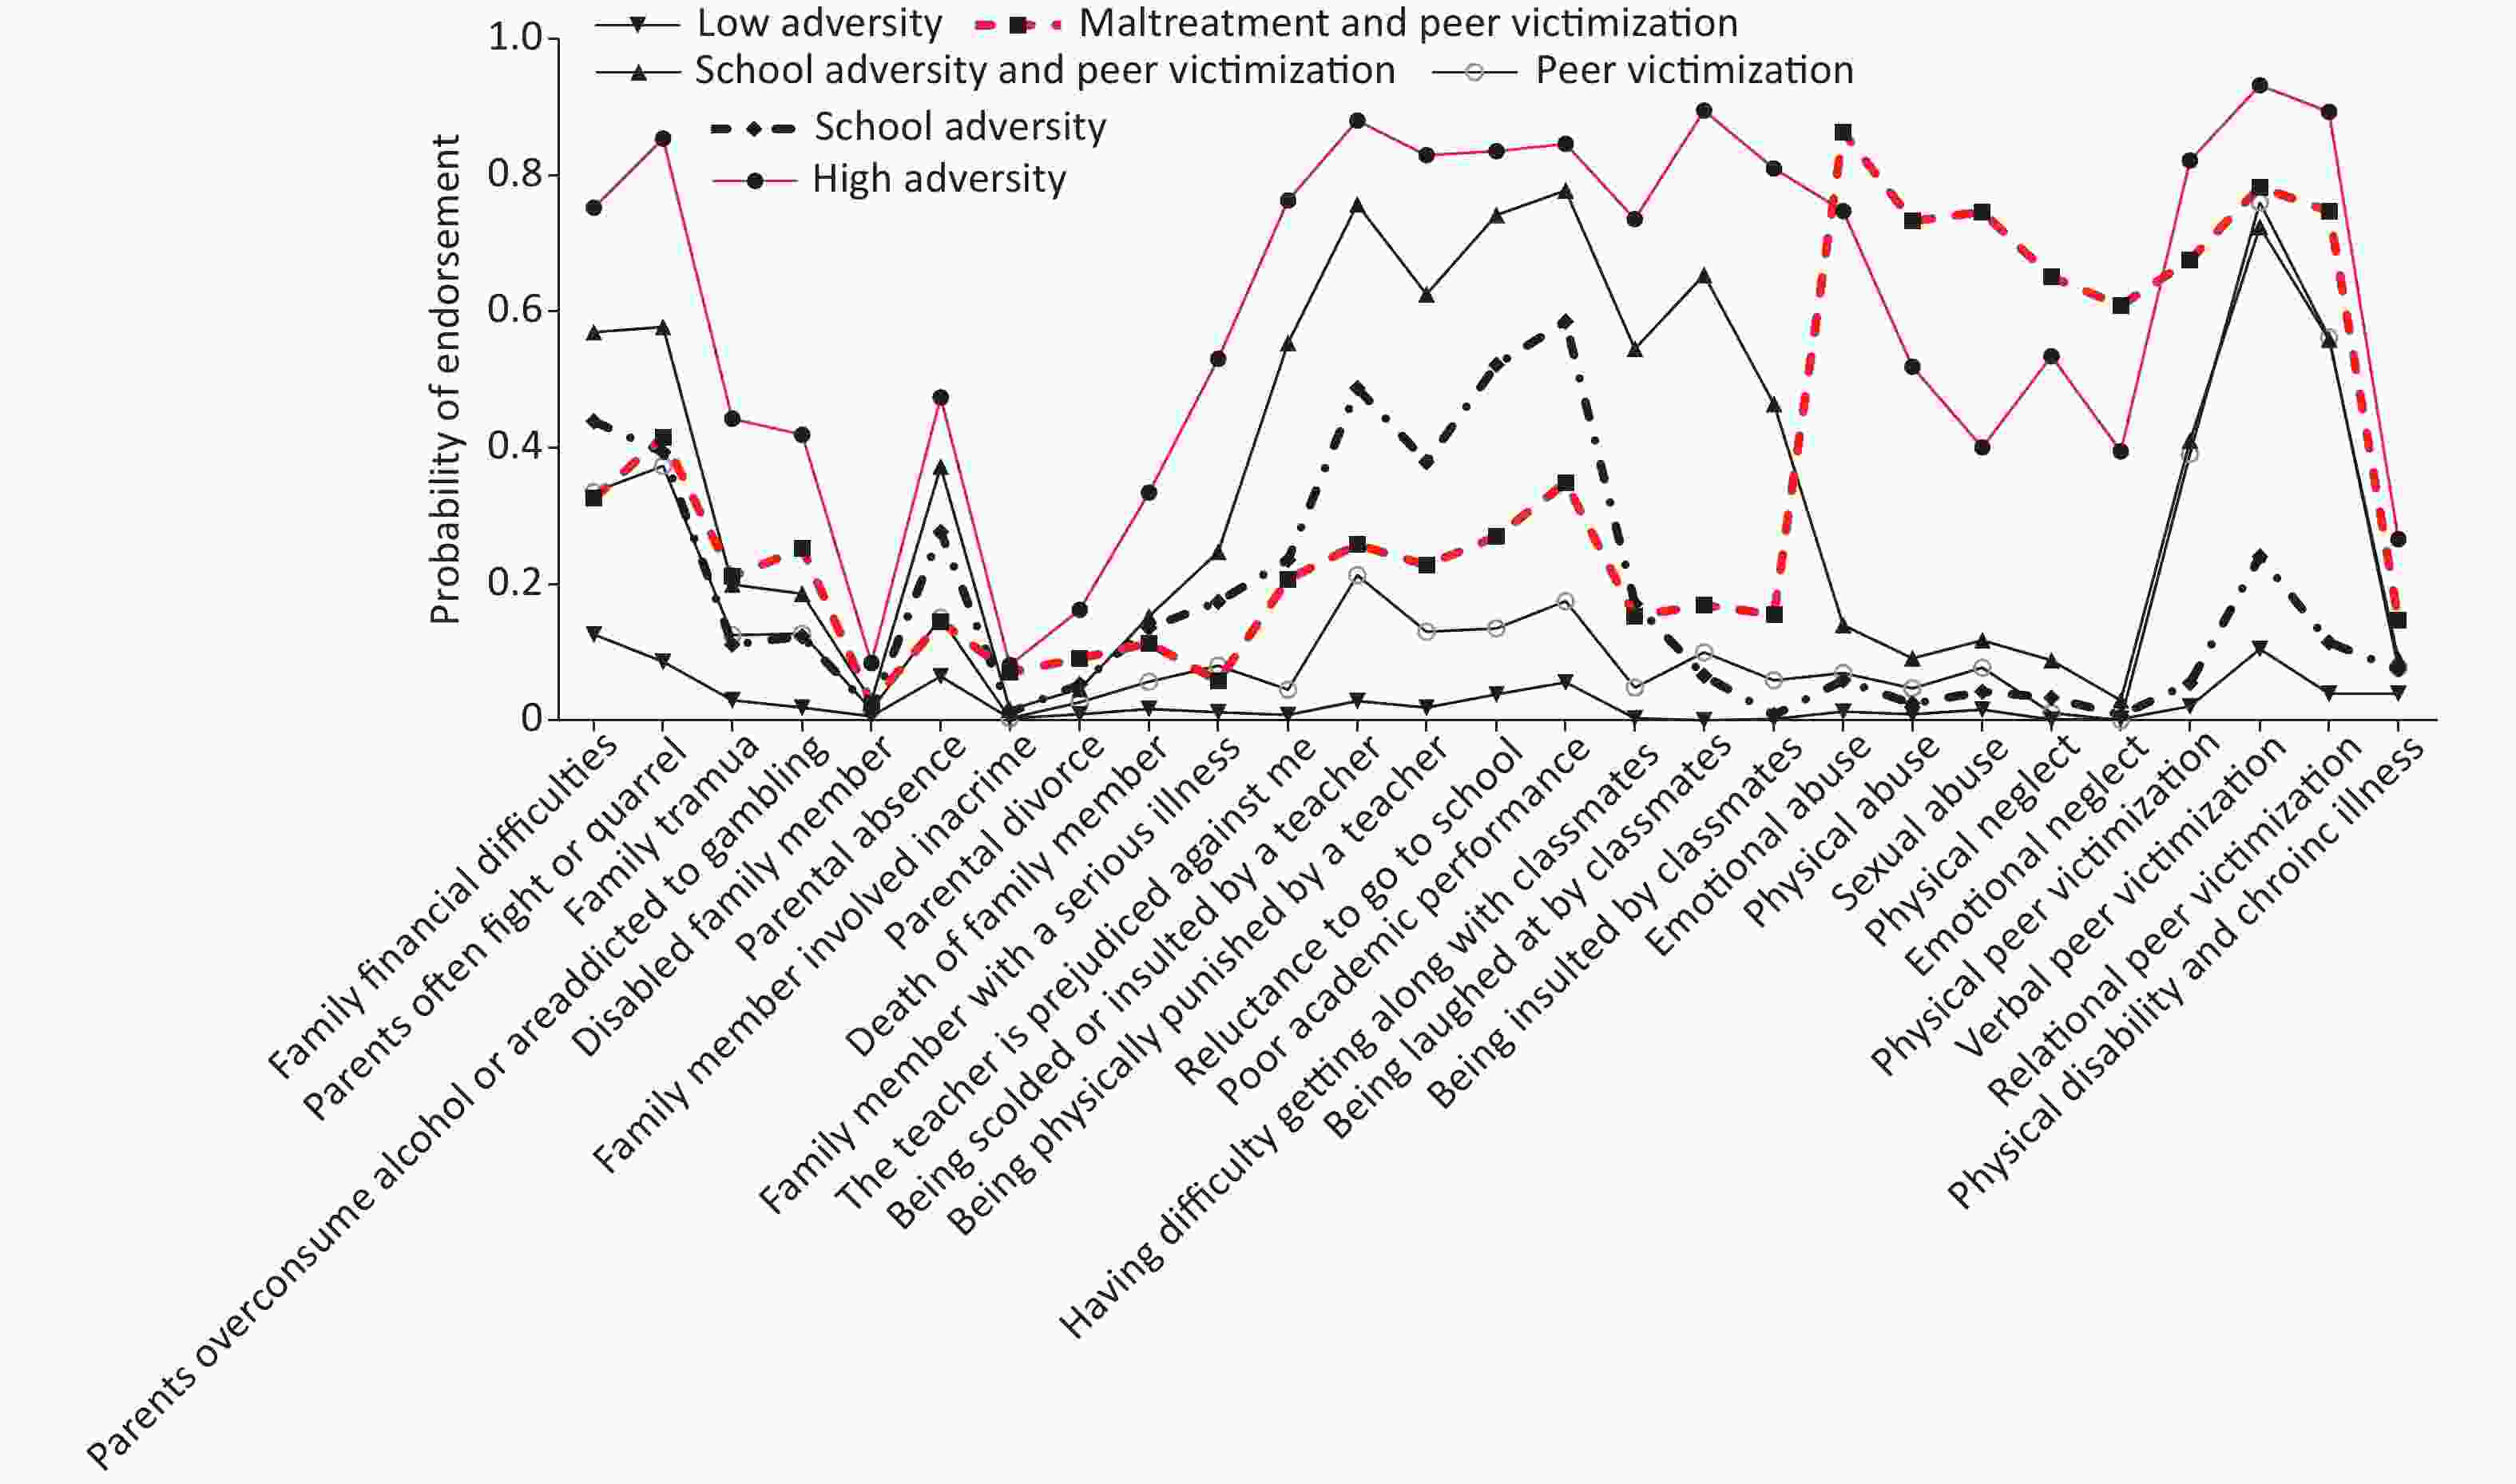
Figure 4. Probability of 27-item ACEs for a six-class model
No. of class AIC BIC aBIC LRT Entropy 1 132054.425 132234.050 132148.252 NA − 2 117971.518 118337.420 118162.647 P < 0.001 0.850 3 115306.634 115858.814 115595.065 P < 0.001 0.798 4 113794.595 114533.052 114180.327 P < 0.001 0.813 5 112946.301 113871.036 113429.335 P < 0.001 0.806 6 112278.353 113389.366 112858.689 0.0032 0.793 7 111737.474 113034.765 112415.113 0.1782 0.776 Note. AIC: Akaike Information Criterion; BIC: Bayesian Information Criterion; aBIC: the sample-size Adjusted BIC; LRT: Bootstrapped Likelihood Ratio Test. Table S3. Fit indices for LCA models with 1–7 classes
-
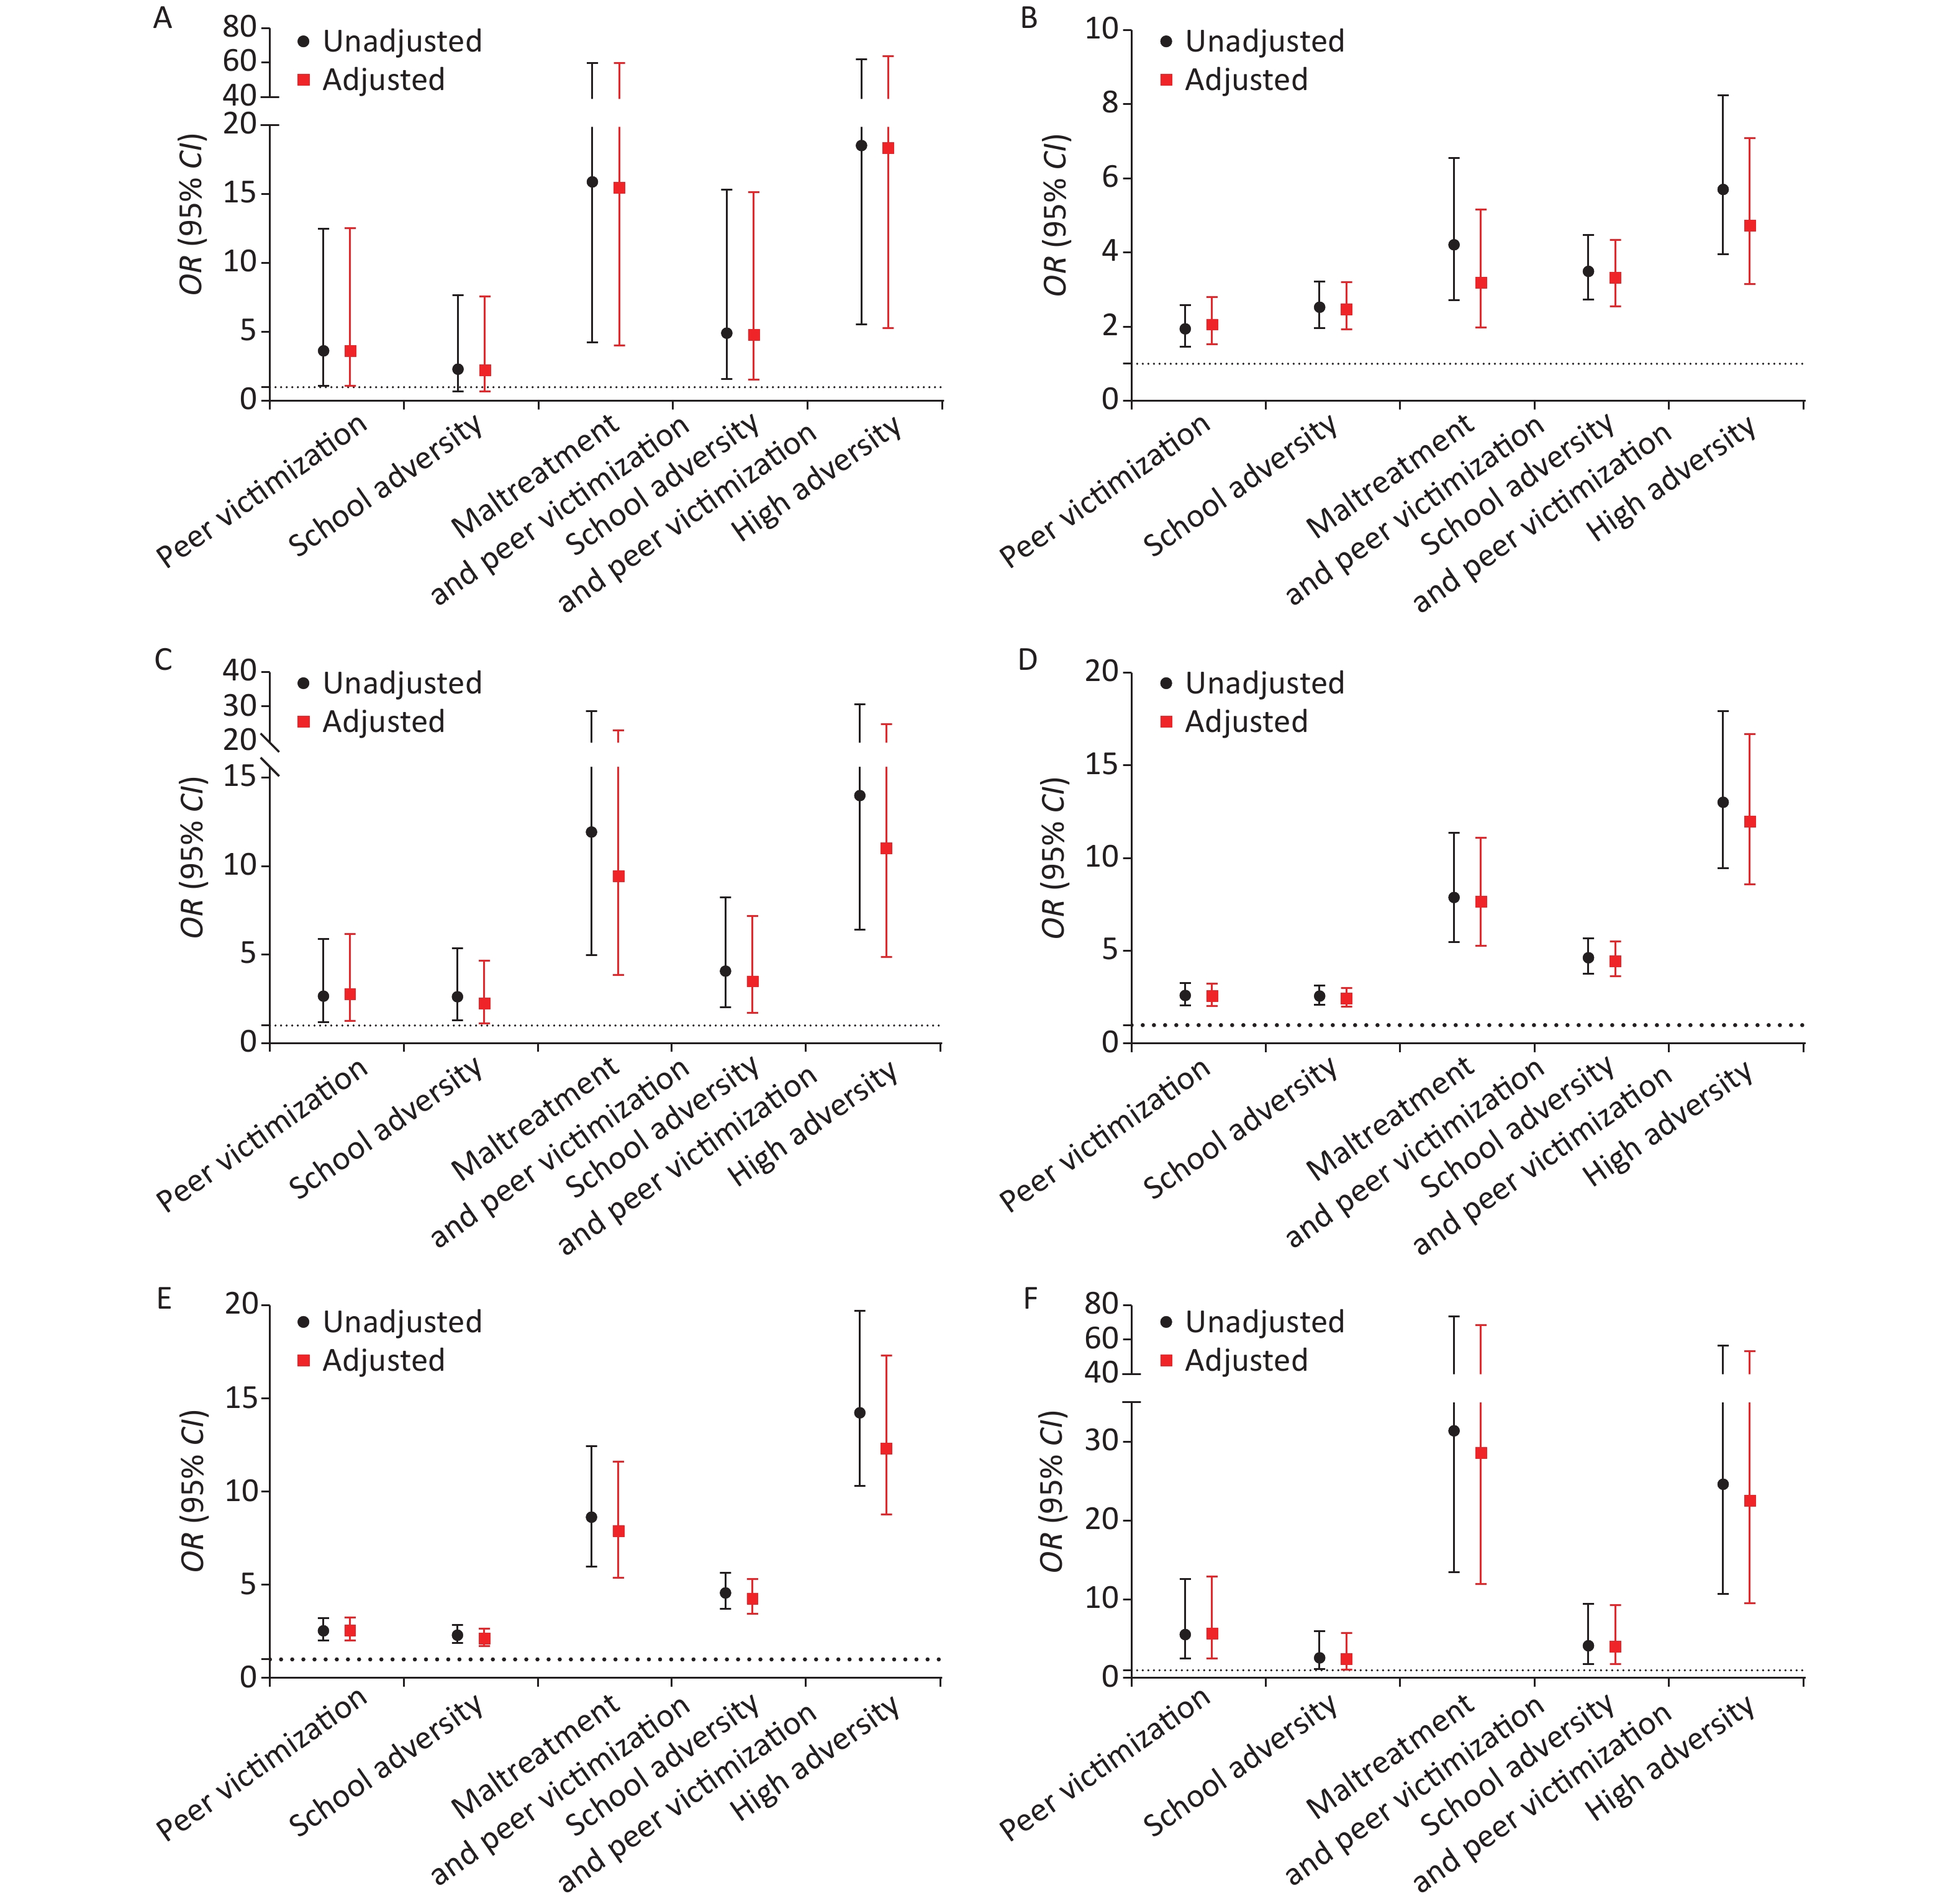
Descriptive statistics for the LCA groups and adolescent health risky behaviors are shown in Supplementary Table S2. As presented in Figure 5, compared to the low adversity subtype, participants in any other subtype of ACE exposure were associated with an increased risk for smoking, drinking, sexual behavior, self-harm, suicidal ideation and suicide attempts in both univariate and multivariate regression models, except for the nonsignificant association between school adversity and smoking. Notably, we found that “high adversity” and “maltreatment and peer victimization” had higher ORs for smoking, drinking, sexual behavior, self-harm, suicidal ideation and suicide attempts. Specifically, of the six types of risky adolescent health behaviors, high adversity presented the highest ORs, except for suicide attempts.

Figure 5. Logistic regression models for unadjusted and adjusted OR (95% CI) for the association between LCA classes and risky health behaviors among adolescents (Reference group = Low adversity): (A) smoking, (B) drinking, (C) sexual intercourse, (D) selfharm, (E) suicidal ideation, and (F) suicidal attempts. In the adjusted models, we adjusted the sociodemographic covariates, including sex, grade, self-perceived family socioeconomic status, self-perceived relationship with mother and father, number of friends, only-child status and character, and academic performance.
-
PLS-DA was performed to determine which of the 27 ACEs best differentiated the ACE groups. The model with 1 component was selected by 5-fold cross-validation. The ACEs with VIP scores of greater than 1 are deemed the most relevant for differentiating the 6 ACE groups. Figure 6 presents the VIP scores of the 27 ACEs sorted by VIP scores. Eleven ACEs were considered important (> 1), and being physically punished by a teacher, experiencing sexual abuse, and experiencing family trauma generated the 3 highest VIP scores (> 1.5). Other ACEs with VIP scores greater than 1 include having difficulty getting along with classmates, being scolded or insulted by a teacher, experiencing verbal peer victimization, being laughed at by classmates, experiencing one’s parents overconsume alcohol or being addicted to gambling, experiencing relational peer victimization, experiencing emotional abuse and having a family member with a serious illness.
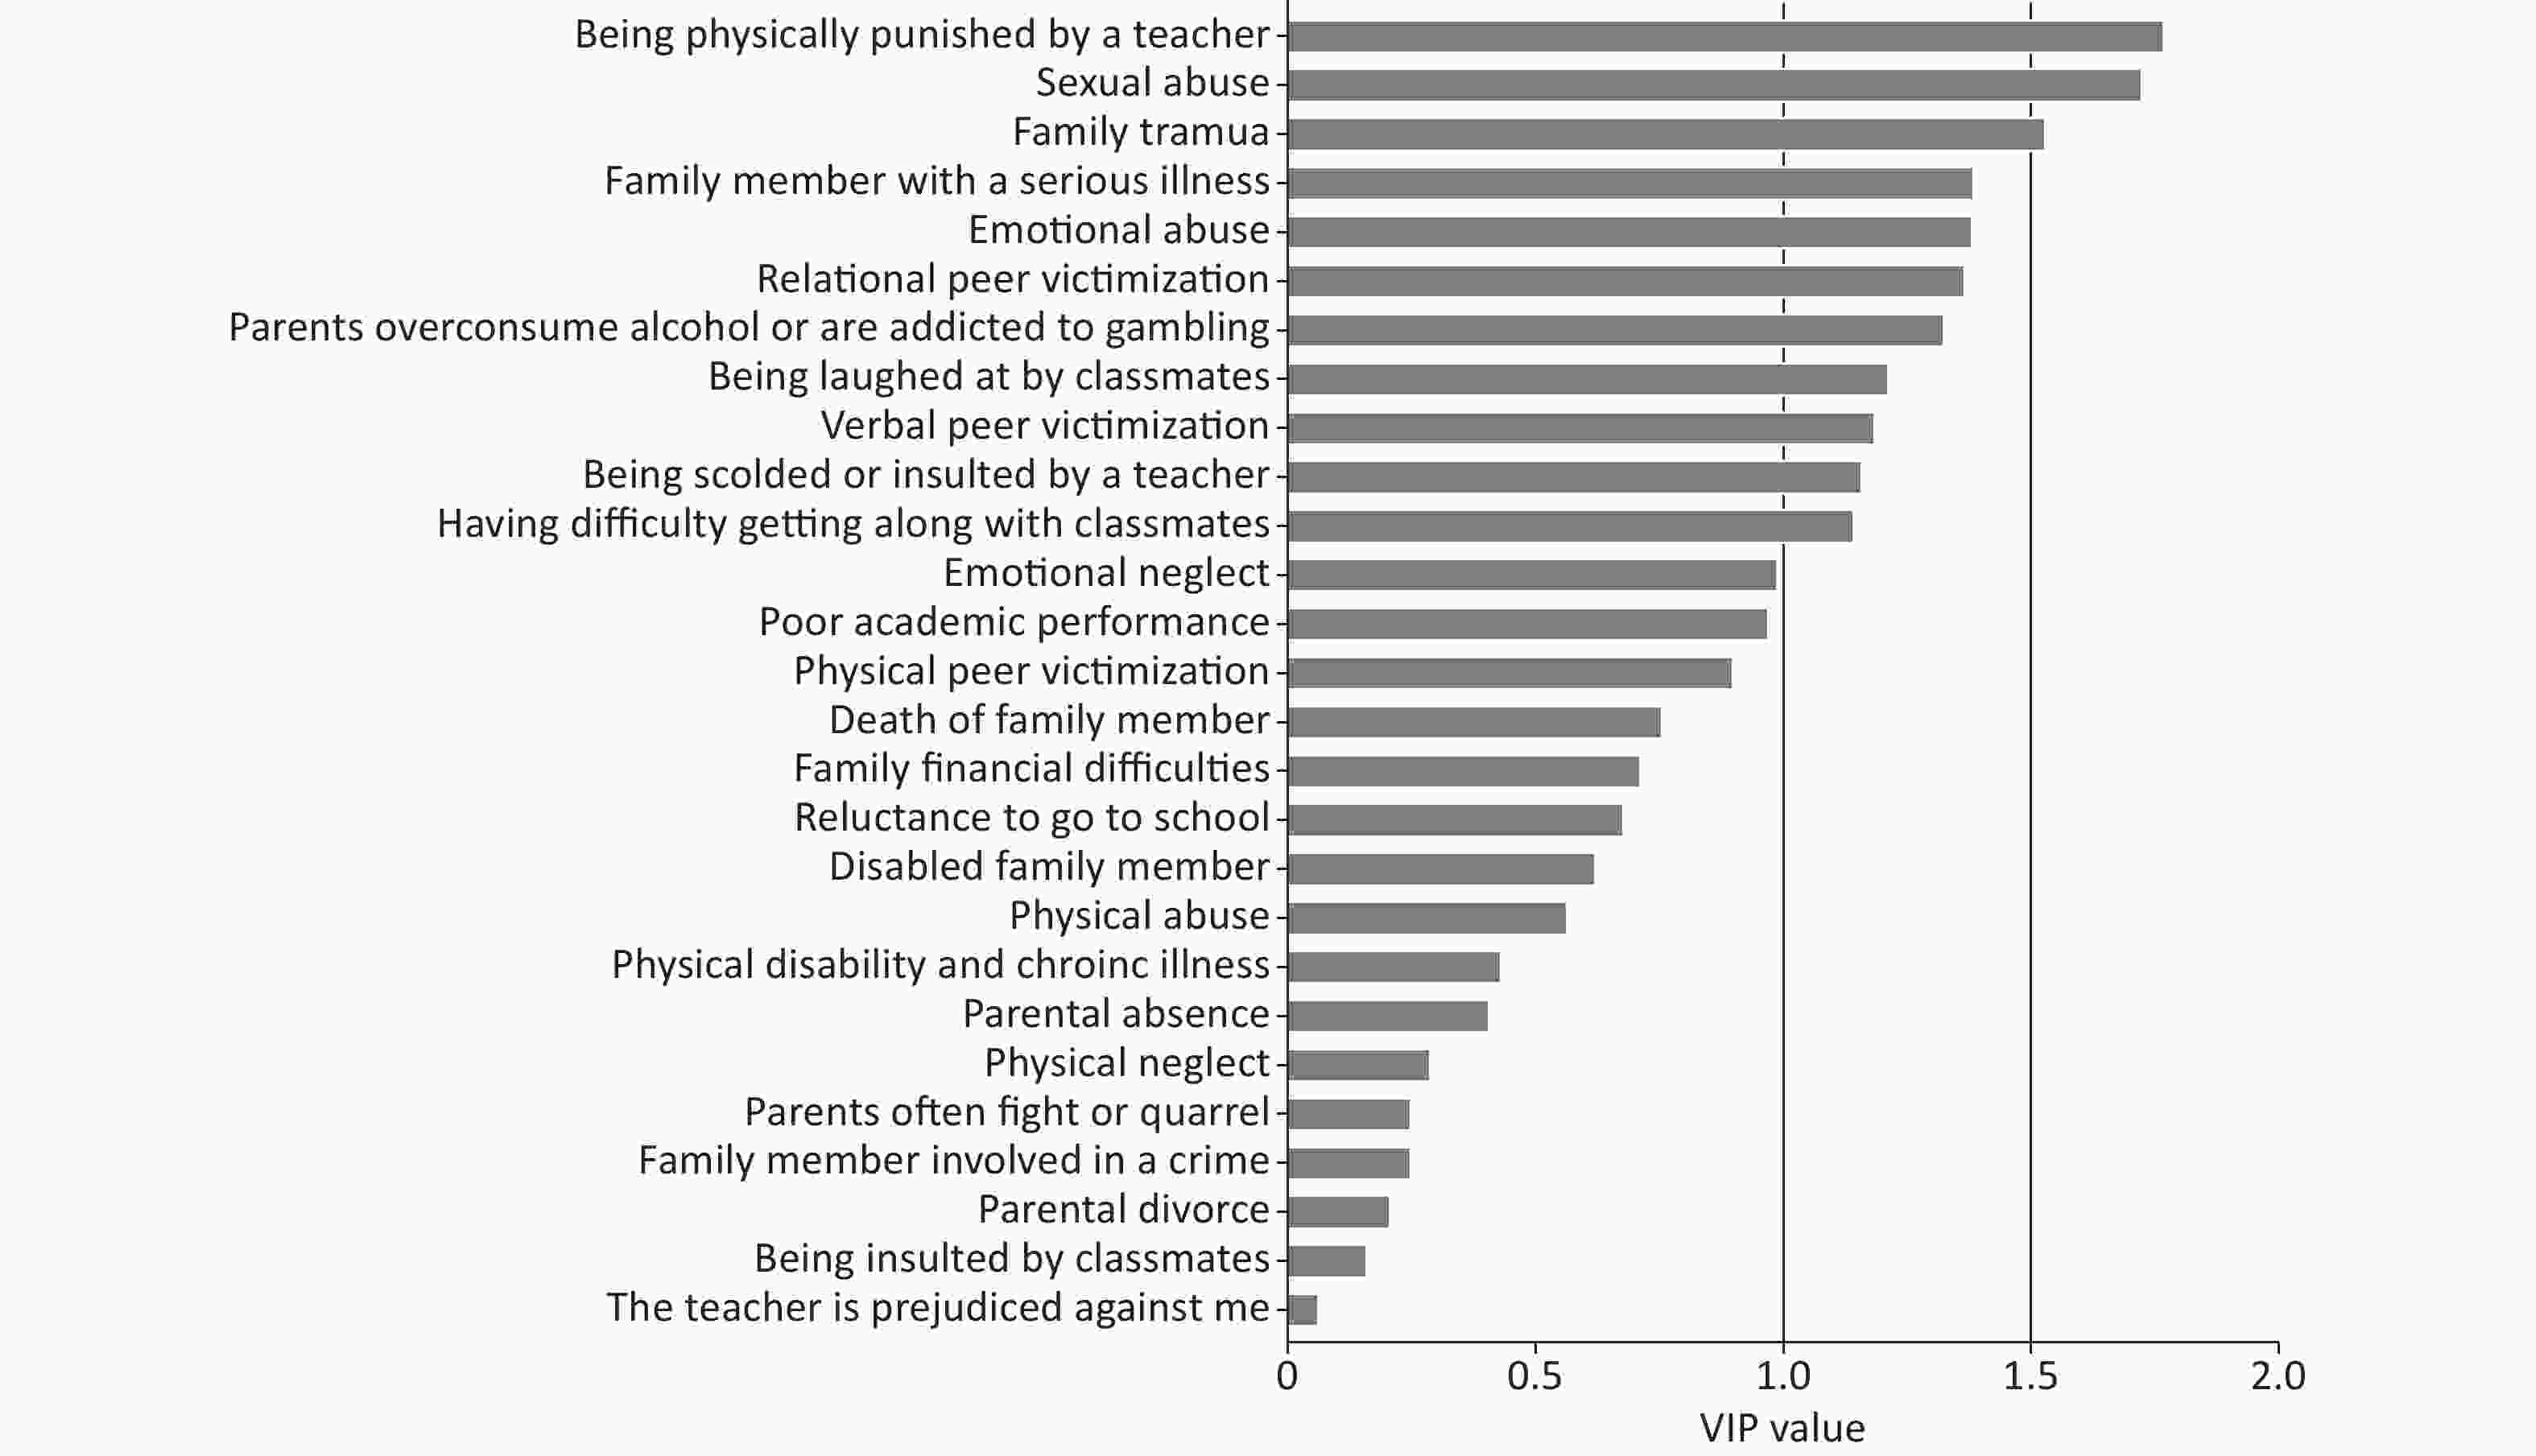
Figure 6. Partial least squares discriminant analysis was used to evaluate the relative influence of the 27 adversity indicator variables in the creation of the latent profiles. Variable Importance in Projection (VIP) scores that extend to the right beyond vertical red line are > 1 and significantly differentiate the latent stress profiles. Eleven variables were considered were considered significant according to VIP scores > 1.
-
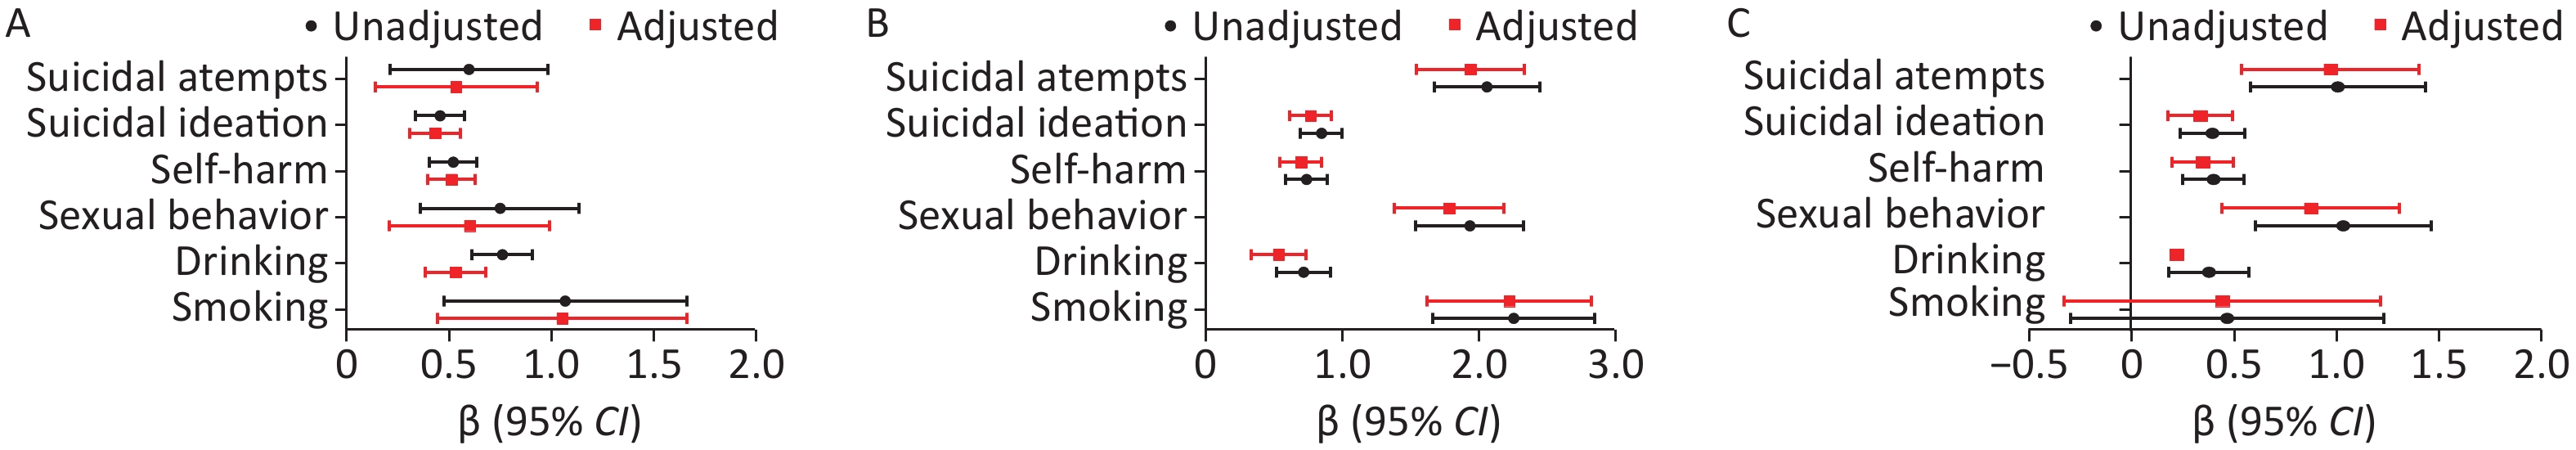
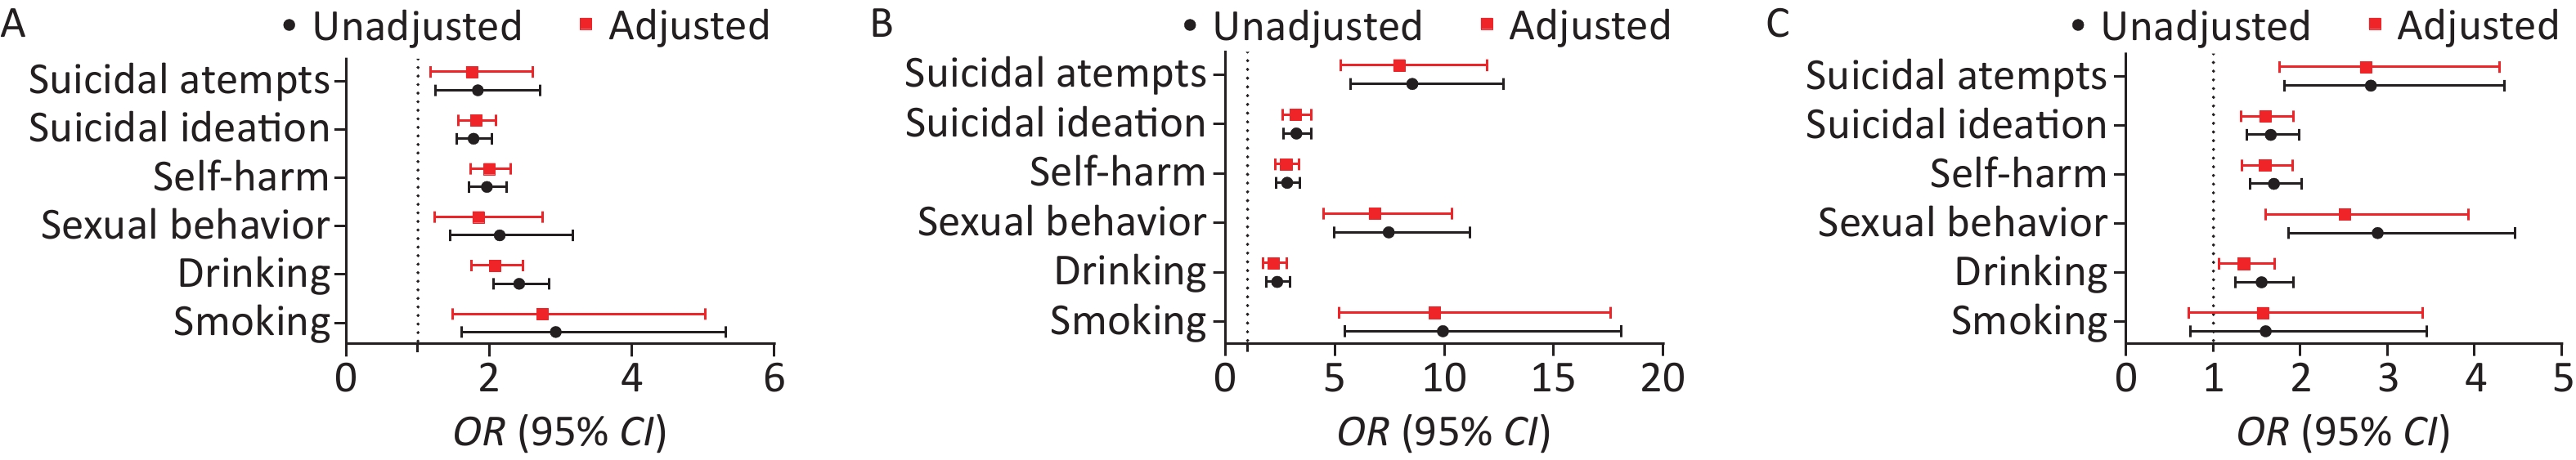
Descriptive statistics for being physically punished by a teacher, experiencing sexual abuse, experiencing family trauma and risky adolescent health behaviors are shown in Supplementary Table S2. As Figure 7 shows, being physically punished by a teacher, experiencing sexual abuse, and experiencing family trauma were significantly and positively correlated with six types of risky adolescent health behavior, except a nonsignificant association was found between experiencing family trauma and smoking. Interestingly, of the six types of risky adolescent health behaviors, “sexual abuse” generated the highest ORs.
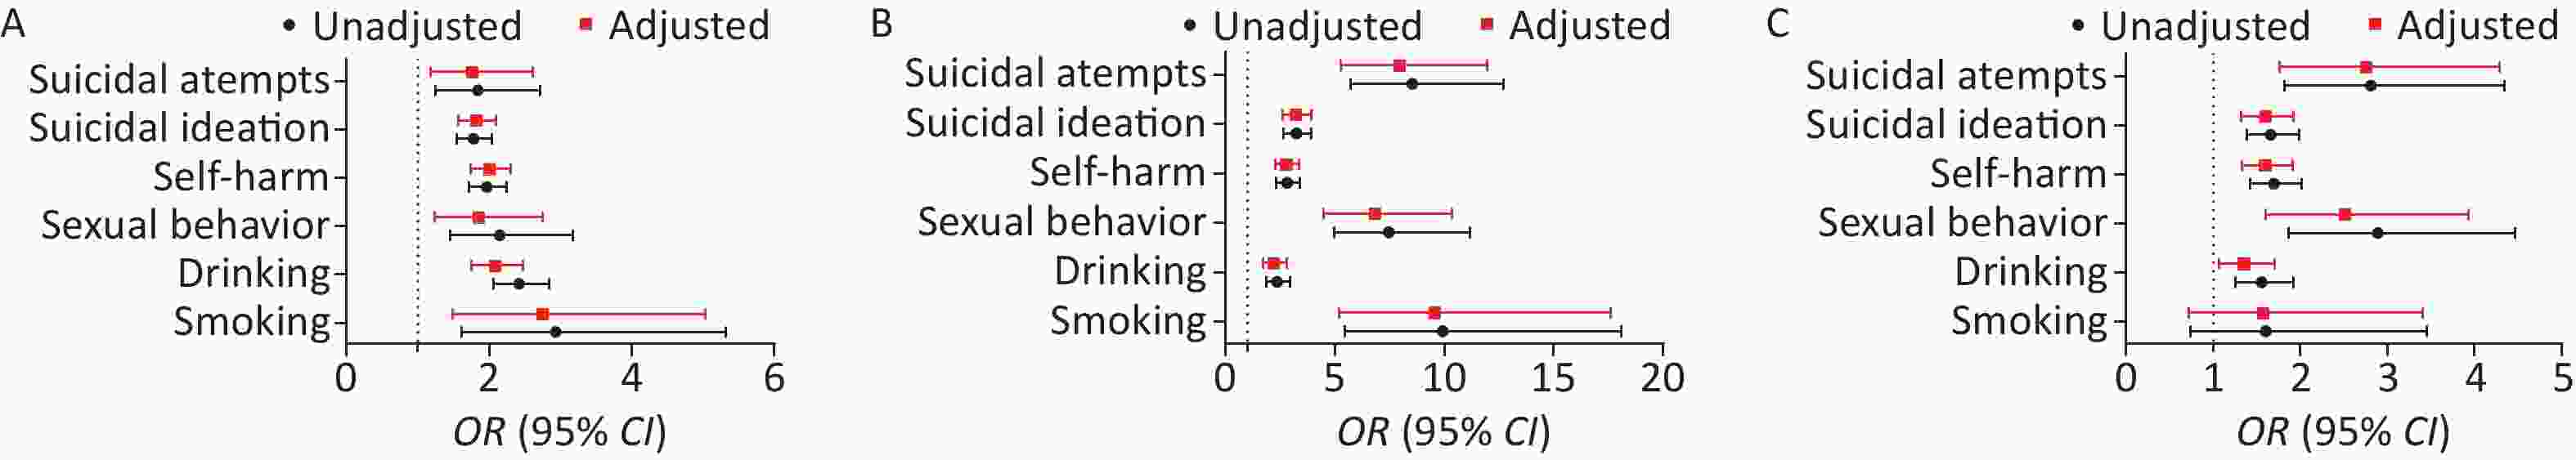
Figure 7. Logistic regression models for unadjusted and adjusted OR (95% CI) for the association between (A) being physically punished by the teacher (Reference group = No), (B) sexual abuse (Reference group = No), and (C) family trauma (Reference group = No) and risky health behaviors among adolescents. In the adjusted models, we adjusted the sociodemographic covariates, including sex, grade, self-perceived family socioeconomic status, self-perceived relationship with mother and father, number of friends, only-child status and character trait, and academic performance.
-
This study is novel in that we used a data-driven approach to phenotype childhood adversity among adolescents by using an operationalizing definition based on the Chinese social context and identified several important findings. First, six classes of ACEs were identified, including low adversity, school adversity, school adversity and being bullied, being bullied, maltreatment and being bullied, and high adversity. Second, being physically punished by a teacher, experiencing sexual abuse, and experiencing family trauma contributed most in differentiating the six groups. Third, being physically punished by a teacher, experiencing sexual abuse, and experiencing family trauma and specific LCA classes increased odds for risky adolescent health behavior. The findings of this study provide more evidence of the impact of ACEs on risky health behaviors among Chinese adolescents.
This study confirms that ACEs are common in adolescents [5-6, 27, 35]. Notably, 85.3% of the students studied had experienced at least one type of ACE, which is higher than the average level among adolescents in low- and middle-income countries[42] and comparable to that found in a previous study conducted in China [6]. Specifically, verbal peer victimization (41.9%), poor academic performance (40.2%), and being scolded or insulted by a teacher (36.7%) were found to be the three most common types of adversity in this study. Corresponding to this finding, previous studies have indicated that childhood bullying is prevalent[14, 15]. A recent study conducted in China reported that 13.5% of children (mean age of 8.1) had experienced school adverse events[31]. It is possible that the high prevalence of school adversity found in this study is rooted in sample characteristics and in the additional items used to measure school ACEs.
The positive relationship between ACE scores and risky health behaviors among adolescents found in this study aligns with previous findings of a strong relationship between ACE levels and risky health behaviors[1-4,35], supporting a cumulative risk model for ACEs and health outcomes. Such information may guide clinical interventions in identifying high-risk individuals for risky health behaviors among adolescents. Importantly, we applied the LCA model to examine ACE patterns and identified six patterns of childhood adversity. Previous studies have consistently examined the two classes of high and low adversity [6, 24, 26, 31]. Furthermore, we identified four distinct groups of ACEs (i.e., school adversity, peer victimization, school adversity and peer victimization, and maltreatment and peer victimization) that have been disregarded in many ACE studies. The peer victimization group has a high probability of being bullied by peers and is significantly related to risky adolescent health behaviors. Previous studies have demonstrated that experiencing peer victimization or bullying in childhood results in a high prevalence of interpersonal trauma and increases the likelihood of poor mental and physical health conditions[43, 44]. Our findings are consistent with previous results and suggest that peer victimization should be included as a type of ACE in future studies. The school adversity group featured a high probability of experiencing adverse school events and was correlated with risky adolescent health behaviors. Finkelhor et al.[14] found that adding school performance to ACEs could improve understanding of the association between ACEs and mental health problems. These results highlight the need to address school adversity in future ACE studies. Another two new classes of ACEs examined in this study (i.e., school adversity and peer victimization and maltreatment and peer victimization) suggest that peer victimization clusters with school adversity and maltreatment. We observed a high prevalence of peer victimization relative to other ACEs in our study, providing a possible explanation for this finding (see Figure 1). Furthermore, peer victimization was associated with distress and mental health problems in children[43, 45], potentially increasing the risk of being maltreated at home and experiencing school adversity. This finding indicates that reducing the occurrence of peer victimization can mitigate the impacts of other ACEs. However, whether peer victimization precedes or is an outcome of other ACEs warrants further study. Overall, this finding suggests that ACE researchers and practitioners should consider peer victimization and school adverse events as impactful early adverse experiences.
Third, we found that being physically punished by a teacher, experiencing sexual abuse, and experiencing family trauma most strongly discriminated the groups and that these experiences are linked to an increased risk for risky health behaviors. Previous studies have consistently reported that sexual abuse and family trauma are associated with risky health behaviors [19, 35, 36, 46]. Interestingly, of the six types of risky adolescent health behaviors, “sexual abuse” generated the highest ORs. A recent meta-analysis revealed that sexual abuse is positively related to an increased likelihood of suicidal ideation and suicide attempts relative to other types of childhood maltreatment[19], partly supporting our findings. Importantly, we uncovered the novel finding that being physically punished by a teacher is associated with an increased risk for risky health behaviors. This finding may be explained by the influence of traditional Chinese norms, which accept the use of discipline and physical punishment to control children[47]. This is also supported by the finding that the prevalence of physical abuse was relatively high in this study (see Figure 1). Our results underscore that the local context needs to be considered when examining ACE exposure and its health effects. A recent systematic review showed that school physical punishment is prevalent worldwide and has a negative impact on the physical and mental health of children [48]. We also found VIP scores of greater than 1 for having difficulty getting along with classmates, being scolded or insulted by a teacher, experiencing verbal peer victimization, being laughed at by classmates, experiencing one’s parents overconsume alcohol or be addicted to gambling, experiencing relational peer victimization, experiencing emotional abuse and having a family member with a serious illness. This finding verifies that maltreatment and household dysfunction are important types of ACEs and suggests that certain types of school adversity, such as being physically punished by a teacher, having difficulty getting along with classmates, and being scolded or insulted by a teacher, should be considered additional types of ACEs, especially for adolescents in China.
Our findings further understanding of ACE items, patterns, and health outcomes affecting Chinese adolescents. However, several limitations should be noted. First, the frequency and severity of ACEs were not measured. Second, ACEs were self-reported by recall; thus, recall bias was inevitable. Third, the cross-sectional nature of this study prevented a casual interpretation of the relationship between ACEs and risky adolescent health behaviors. A longitudinal design should be used to understand ACE classes and their associations with adolescent health.
-
This study used a data-driven approach to phenotype childhood adversity among adolescents and found that specific ACE patterns in Chinese adolescents, such as school adversity, bullying and maltreatment, may be associated with risky adolescent health behaviors. Furthermore, certain ACEs (i.e., being physically punished by a teacher, experiencing sexual abuse, and experiencing family trauma) are the key defining ACE groups. Our findings show that peer victimization and school adversity should be considered in future ACE studies and provide scientific bias for ACE screening and prevention in China.
-
The authors would like to thank all the schools, parents and students who participated in this study.
-
The authors declared no potential conflicts of interest with respect to the research, authorship, and/or publication of this article.
-
Conceptualization and design: PS, GW. Acquisition of data: GW, JC, MY, YL. Analysis and interpretation of data: GW, JC, MY, YL. Revising it for intellectual content: GW, MY, PS. Obtained funding: PS. Final approval of completed article: all authors. All authors had full access to all data in the study and take responsibility for the integrity of the data and the accuracy of the data analysis.
HTML
Participants
Measures
Childhood Adversity
Adolescent Health Risky Behaviors
Sociodemographic Covariates
Statistical Analysis
Prevalence of Childhood Adversity and Risky Health Behaviors
ACEs Scores and Risky Adolescent Health Behaviors
Latent Class Analysis of Childhood Adversity
Associations between ACE Classes and Risky Adolescent Health Behaviors
ACEs That Most Strongly Discriminated ACE Groups
Relationships between being Physically Punished by a Teacher, Experiencing Sexual Abuse, and Experiencing Family Trauma and Risky Adolescent Health Behaviors
 21372Supplementary Materials.pdf
|

|

 Quick Links
 DownLoad: