


-
The main noncommunicable diseases (NCDs) are cardiovascular disease, cancer, respiratory diseases, and diabetes, with the first two accounting for 66% of deaths attributable to NCDs worldwide [1]. In 2019, global NCD deaths rose to almost 42 million, with nearly a quarter of these deaths occurring in China [2]. China experienced an 11% relative increase in the crude mortality rate for NCDs but a 10% relative decrease in the age-standardized mortality rate (ASMR) during 2010–2019 [2]. This situation is similar to many other countries, and is mainly the result of population aging. According to World Population Prospects [3], there will be 247 million adults aged 65 years and over in China in 2030, 1.43 times more than in 2020, which will pose a huge challenge to managing the burden of NCDs.
China is a developing country with particularly pronounced regional disparities in many respects, such as socioeconomic issues, healthcare resources, and population aging. The NCD burden therefore also varies by region. However, previous studies have focused more on national levels or urban–rural comparisons [4,5]. Controlling and reducing regional disparities in healthcare, including in NCD management, was one of the goals of Health China 2030. A crucial starting point for this work is understanding the current status of NCDs burden with population aging by region during 2010–2019, and projecting trends for 2020 to 2030. This will provide data-driven evidence for policy-makers to develop region-specific measures to address the increased burden of NCDs in the context of population aging.
We used codes from the International Classification of Diseases, Tenth Revision (ICD 10) to extract death data for 2010–2019 by region (eastern, central, and western China) for seven NCDs with a high prevalence or incidence, including two types of cardiovascular disease (cerebrovascular diseases I60–I69, ischemic heart diseases I20–I25) and five cancers (lung C33–C34, stomach C16, liver C22, colorectal C18–C21, and esophageal C15) from China’s death surveillance datasets. From 2013, the number of death surveillance points (DSPs) involved in the system expanded from 161 to 605, increasing the coverage of the national population from 6% to 24%. The Chinese Center for Disease Control and Prevention has carried out strict data quality control. China’s projected population data from 2020 to 2030 were derived from the United Nations Population Division World Population Prospects, 2019 Revision [3].
We calculated the age-specific mortality rate for each 5-year age group (from 30–35 years to 85+ years; the incidence of NCDs in people under 30 years old is low [2]) by cause of death and region to describe the status of the selected NCDs during 2010–2019, and ASMR based on age-specific mortality rate and the Chinese standard population in 2010 [6].
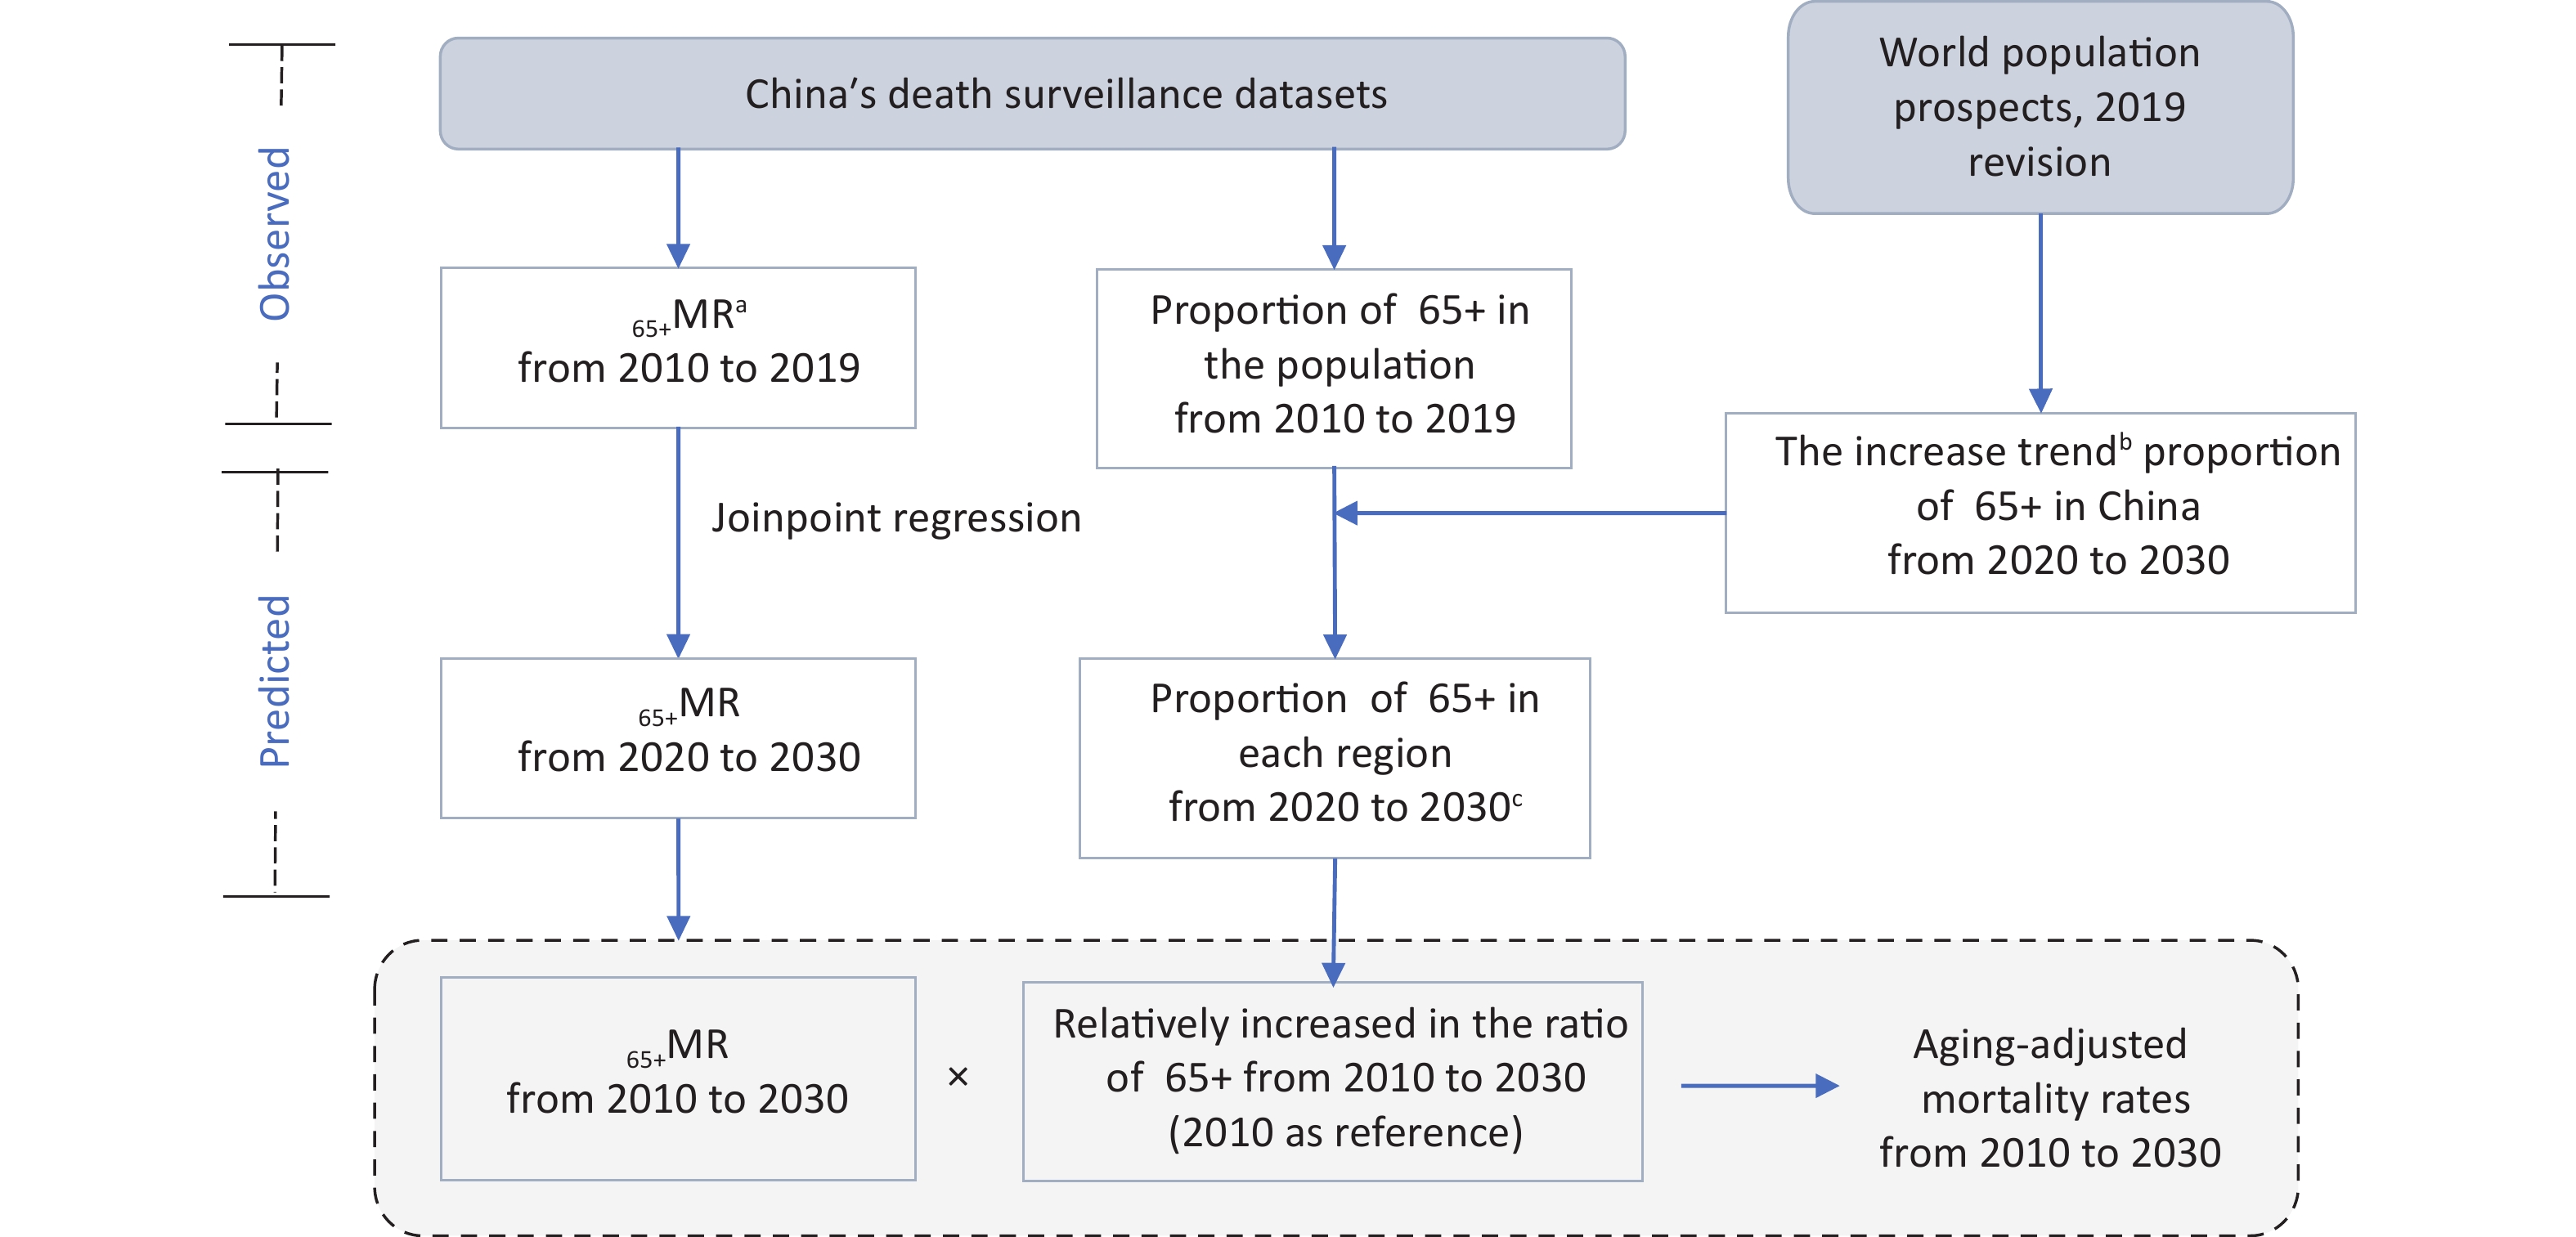
Considering the impact of sudden changes in the aging population, we calculated the aging-adjusted mortality rate (AAMR) [5],
$$ AAM{R_i} = \frac{{{p_i}}}{{{p_0}}} \times {}_{65 + }M{R_i} $$ where
$ {p_0} $ is the proportion of the population aged 65+ years in 2010 (reference year),$ {p_i} $ is the proportion in the ith year ($i = 2011,2012, \cdots ,2019$ ),$ \dfrac{{{p_i}}}{{{p_0}}} $ is the relative change in the proportion of the population aged 65+ years in the ith year; and 65+MRi is the mortality rate (MR) for the population aged 65+ years.Under the assumption that current trends will be maintained for socioeconomic and other risk factors in each region, we projected 65+MR, ASMR and AAMR for selected NCDs for the period 2020–2030 as follows.
We identified trends in 65+MR by region over the baseline period (2010–2019) using a joinpoint regression model. We noted years in which a significant change occurred in the linear slope of the trend, to confirm that each straight line contained at least five data points (the most recent trends). We used the most recent trends to fit a linear regression model and predicted the 65+MR. 65+MR trends and annual percent change (APC) are shown in Supplementary Table S1 (available in www.besjournal.com). The age-specific mortality rate for each 5-year age group was predicted using the same process. We then calculated the ASMR for 2020–2030 using the predicted age-specific mortality rate and Chinese standard population [6]. The same prediction model was used in other articles [7]. To project the proportion of the population aged 65+ years in the three study regions, we assumed that the future growth rate in this proportion for the three regions is the same as that for China overall from 2020 to 2030, from World Population Prospects [3]. This was obtained by fitting linear regression models (Supplementary Table S2, available in www.besjournal.com). Finally, the AAMR was calculated (Supplementary Figure S1, available in www.besjournal.com).
Cause of death Eastern Central Western Trend1 Trend2 Trend1 Trend1 Years APC Years APC Years APC Years APC Cardiovascular diseases 2010−2015 1.74 2015−2019 −4.07 2010−2019 −0.89 2010−2019 1.15* Cerebrovascular diseases 2010−2019 −2.16* — — 2010−2019 −2.34* 2010−2019 −0.75 Ischemic heart diseases 2010−2015 3.98* 2015−2019 −2.86 2010−2019 0.95 2010−2019 4.45* Cancer site 2010−2019 −0.37 — — 2010−2019 −2.14* 2010−2019 −0.23 Lung 2010−2019 0.31 — — 2010−2019 −0.25 2010−2019 1.1 Stomach 2010−2015 2.31 2015−2019 −6.39 2010−2019 −4.59* 2010−2019 −2.58* Liver 2010−2019 −2.01* — — 2010−2019 −2.45* 2010−2019 −1.49* Esophageal 2010−2019 −0.34 — — 2010−2019 −5.3* 2010−2019 −1.15* Colorectal 2010−2019 1.41* — — 2010−2019 0.12 2010−2019 2.94* Note. *P < 0.05. Table S1. 65+MR trends and annual percent change (APC) of selected NCDs over time
Year Eastern Central Western 2020 1.55 1.55 1.53 2021 1.60 1.61 1.59 2022 1.65 1.67 1.65 2023 1.70 1.73 1.71 2024 1.75 1.79 1.77 2025 1.81 1.84 1.83 2026 1.86 1.90 1.90 2027 1.91 1.96 1.96 2028 1.96 2.02 2.02 2029 2.01 2.08 2.08 2030 2.07 2.14 2.14 Table S2. Relatively increased in the ratio of age 65+
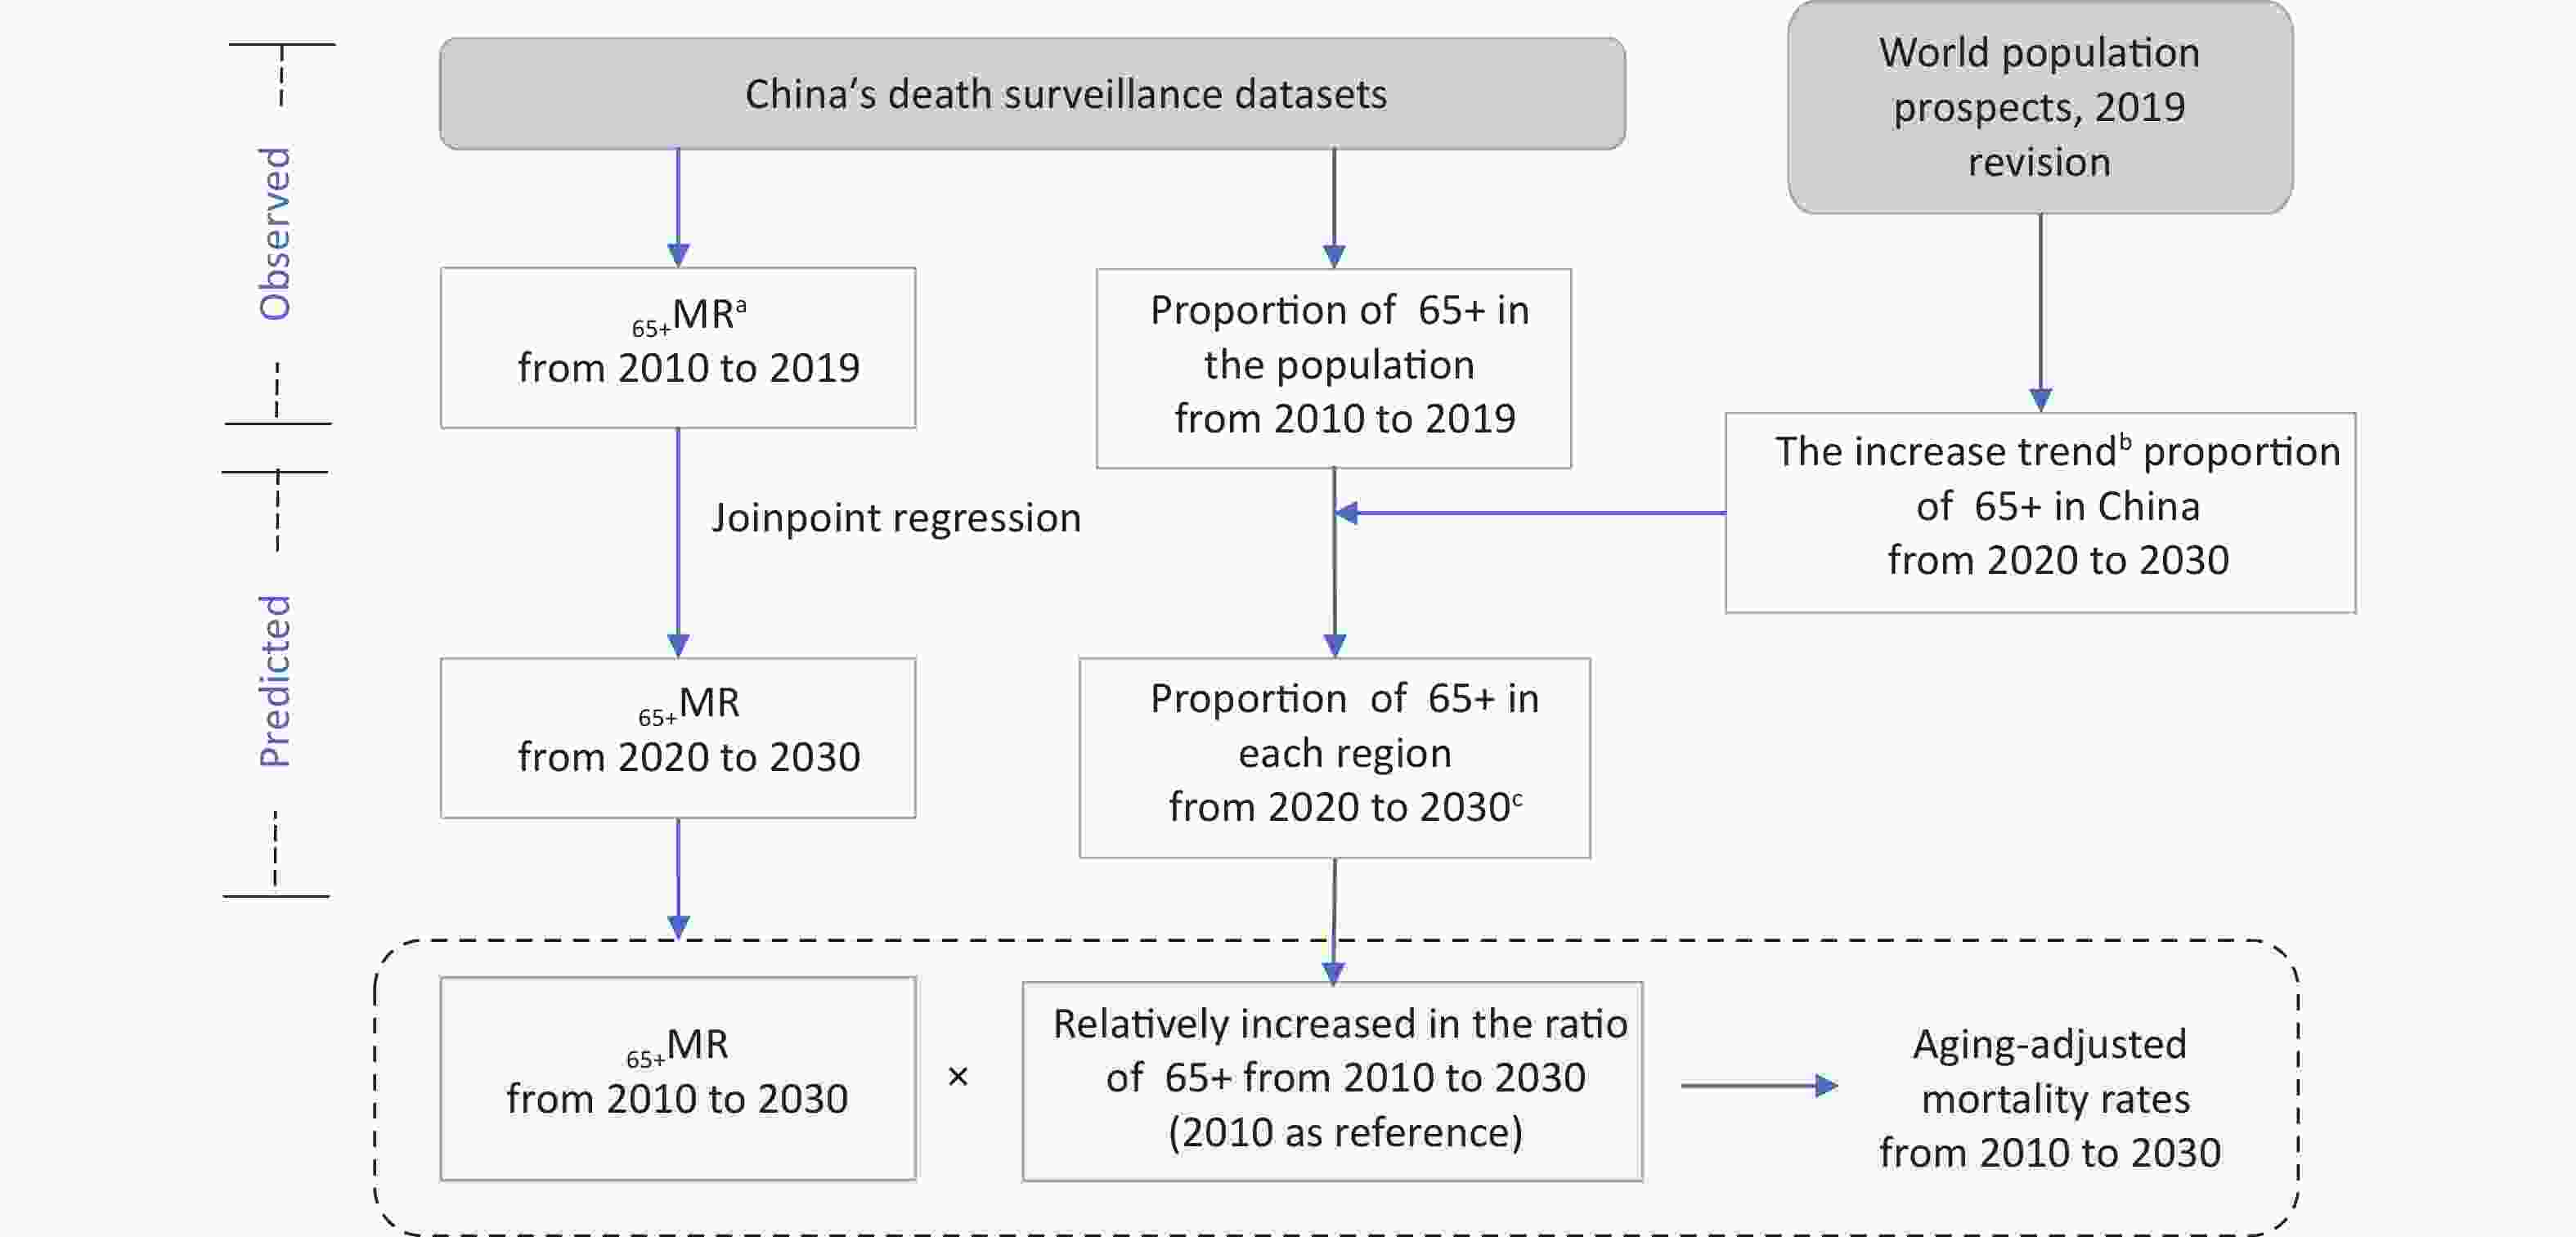
Figure S1. Flowchart of aging-adjusted mortality rate calculation. a65+MR is the mortality rate for the population age 65+ years; bThe increasing trend in the proportion of the population age 65+ years in China from 2020 to 2030 obtained by linear regression model; cAssumption: the increasing trends in the proportion of the population age 65+ years in the future for these three regions are the same.
There is an underlying assumption that the population aged 65 years and older is homogeneous. Letting 65+MR denote the effect of modifiable factors (e.g., smoking, alcohol consumption and sedentary behavior) and AAMR denote the effect of both modifiable factors and population aging, challenges in the management of the NCD burden in the next 10 years can be divided into three scenarios (Supplementary Table S3, available in www.besjournal.com).
Scenario 65+MR AAMR Dominant effect 1 

Dual Challenge of population aging and modifiable factors 2 

Population aging in increasing disease burden 3 

Modifiable factors in reducing disease burden Table S3. Scenarios for the challenge of managing NCDs burden from 2020 to 2030
The analyses used Joinpoint Regression Program (Version 4.8.0.1, Statistical Methodology and Applications Branch, Surveillance Research Program, National Cancer Institute., USA ), and SAS software (version 9.4, SAS Institute, North Carolina, USA).
In 2019, 60% of the monitoring sites of DSPs in the eastern region were in rural areas, compared to 66% and 70% in the central and western regions. Other regional disparities in basic characteristics are shown in Supplementary Table S4 (available in www.besjournal.com).
Characteristic Eastern Central Western 2010 2019 2010 2019 2010 2019 Proportion of age 65+ (%) 9.19 13.74 8.15 12.17 7.89 11.61 Relatively increased in the ratio of age 65+ 1.00 1.495 1.00 1.492 1.00 1.470 All-cause mortality (per 100,000) 573.93 677.20 588.01 672.36 561.70 673.26 All-cause mortality of age 65+ 4406.41 3807.47 4839.55 4135.96 4386.34 4185.53 NCDsa mortality (per 100,000) 325.18 401.14 346.98 417.59 259.25 350.55 NCDs mortality of age 65+ 2632.64 2331.47 3051.09 2675.30 2207.59 2294.96 Note. aThe total of selected noncommunicable diseases in this study. Table S4. Basic characteristics of three study regions of China in 2010 and 2019
Table 1 shows the cause-specific mortality rates (per 100,000) of the selected NCDs in the three regions for the population aged 65+ years. Central region has the greatest 65+MR in cardiovascular diseases in 2019, which can be explained by the small difference between the population age 65+ years in the central region and the eastern region (13.74% vs. 12.17%; Supplementary Table S4) and lower level of health care. In the past 10 years, changes in the 65+MR for overall cardiovascular diseases varied across regions. However, changes in the disease-specific 65+MR showed a highly consistent pattern across the three regions. The 65+MR of cerebrovascular disease saw a decline in all three regions, with the most rapid relative decrease in the eastern region (22.9%) and the slowest in the western region (8.7%). By contrast, the 65+MR of ischemic heart disease showed an increase in all three regions, with the most rapid relative increase being 41.5% in the western region, 10 times more than the slowest.
Cause of death ICD-10b code Eastern Central Western 2010 2019 2010 2019 2010 2019 Cardiovascular diseases 1,925.71 1,693.12 2,273.54 2,051.60 1,636.18 1,755.74 Cerebrovascular diseases I60–I69 1,146.82 884.37 1,361.91 1,069.79 1,115.53 1,018.78 Ischemic heart diseases I20–I25 778.89 808.75 911.63 981.81 520.65 736.96 Cancer site 706.93 638.35 777.56 623.70 571.41 539.22 Lung C33–C34 283.88 277.95 288.29 273.99 204.28 215.74 Stomach C16 146.85 116.26 173.94 112.16 121.96 95.13 Liver C22 118.92 91.88 145.98 112.35 117.80 96.48 Esophageal C15 87.38 75.50 107.32 64.87 77.15 69.51 Colorectal C18–C21 69.91 76.75 62.03 60.33 50.22 62.37 Note. aNoncommunicable disease; bInternational Classification of Diseases, 10th Revision. Table 1. Estimated cause-specific mortality rates (per 100,000) of selected NCDsa for the population aged 65+ years by region in 2010 and 2019
For overall cancer, the 65+MR showed a decline in all three regions, with relative decreases of 9.7%, 19.8%, and 5.6% in the eastern, central, and western regions (Table 1). However, changes in the 65+MR for some cancers showed different patterns across regions. Lung cancer had the highest 65+MR among the five cancers in the three regions, with the 65+MR showing a decrease in the eastern and central regions (2.1% and 5.0% relative decreases) but an increase in the western region (5.6%). Stomach cancer had the second-highest 65+MR in 2010, but showed the most rapid decrease in 65+MR in all three regions, with relative decreases of 20.8%, 35.5%, and 22.0% in the eastern, central, and western regions. The 65+MR of colorectal cancer, which had the lowest rate of all cancers in 2010, increased in the eastern region from 69.91/100,000 to 76.75/100,000 (9.8%) and in the western region from 50.22/100,000 to 62.37/100,000 (24.2%). China has seen declines in cardiovascular disease and cancer mortality among people aged 65–89 years [2]. However, the country has experienced three fertility peaks since 1949, and these birth cohorts entered the older population beginning in 2014; this may be partly responsible for the decline in mortality rate among the population aged 65+ years rather than effective control of other risk factors.
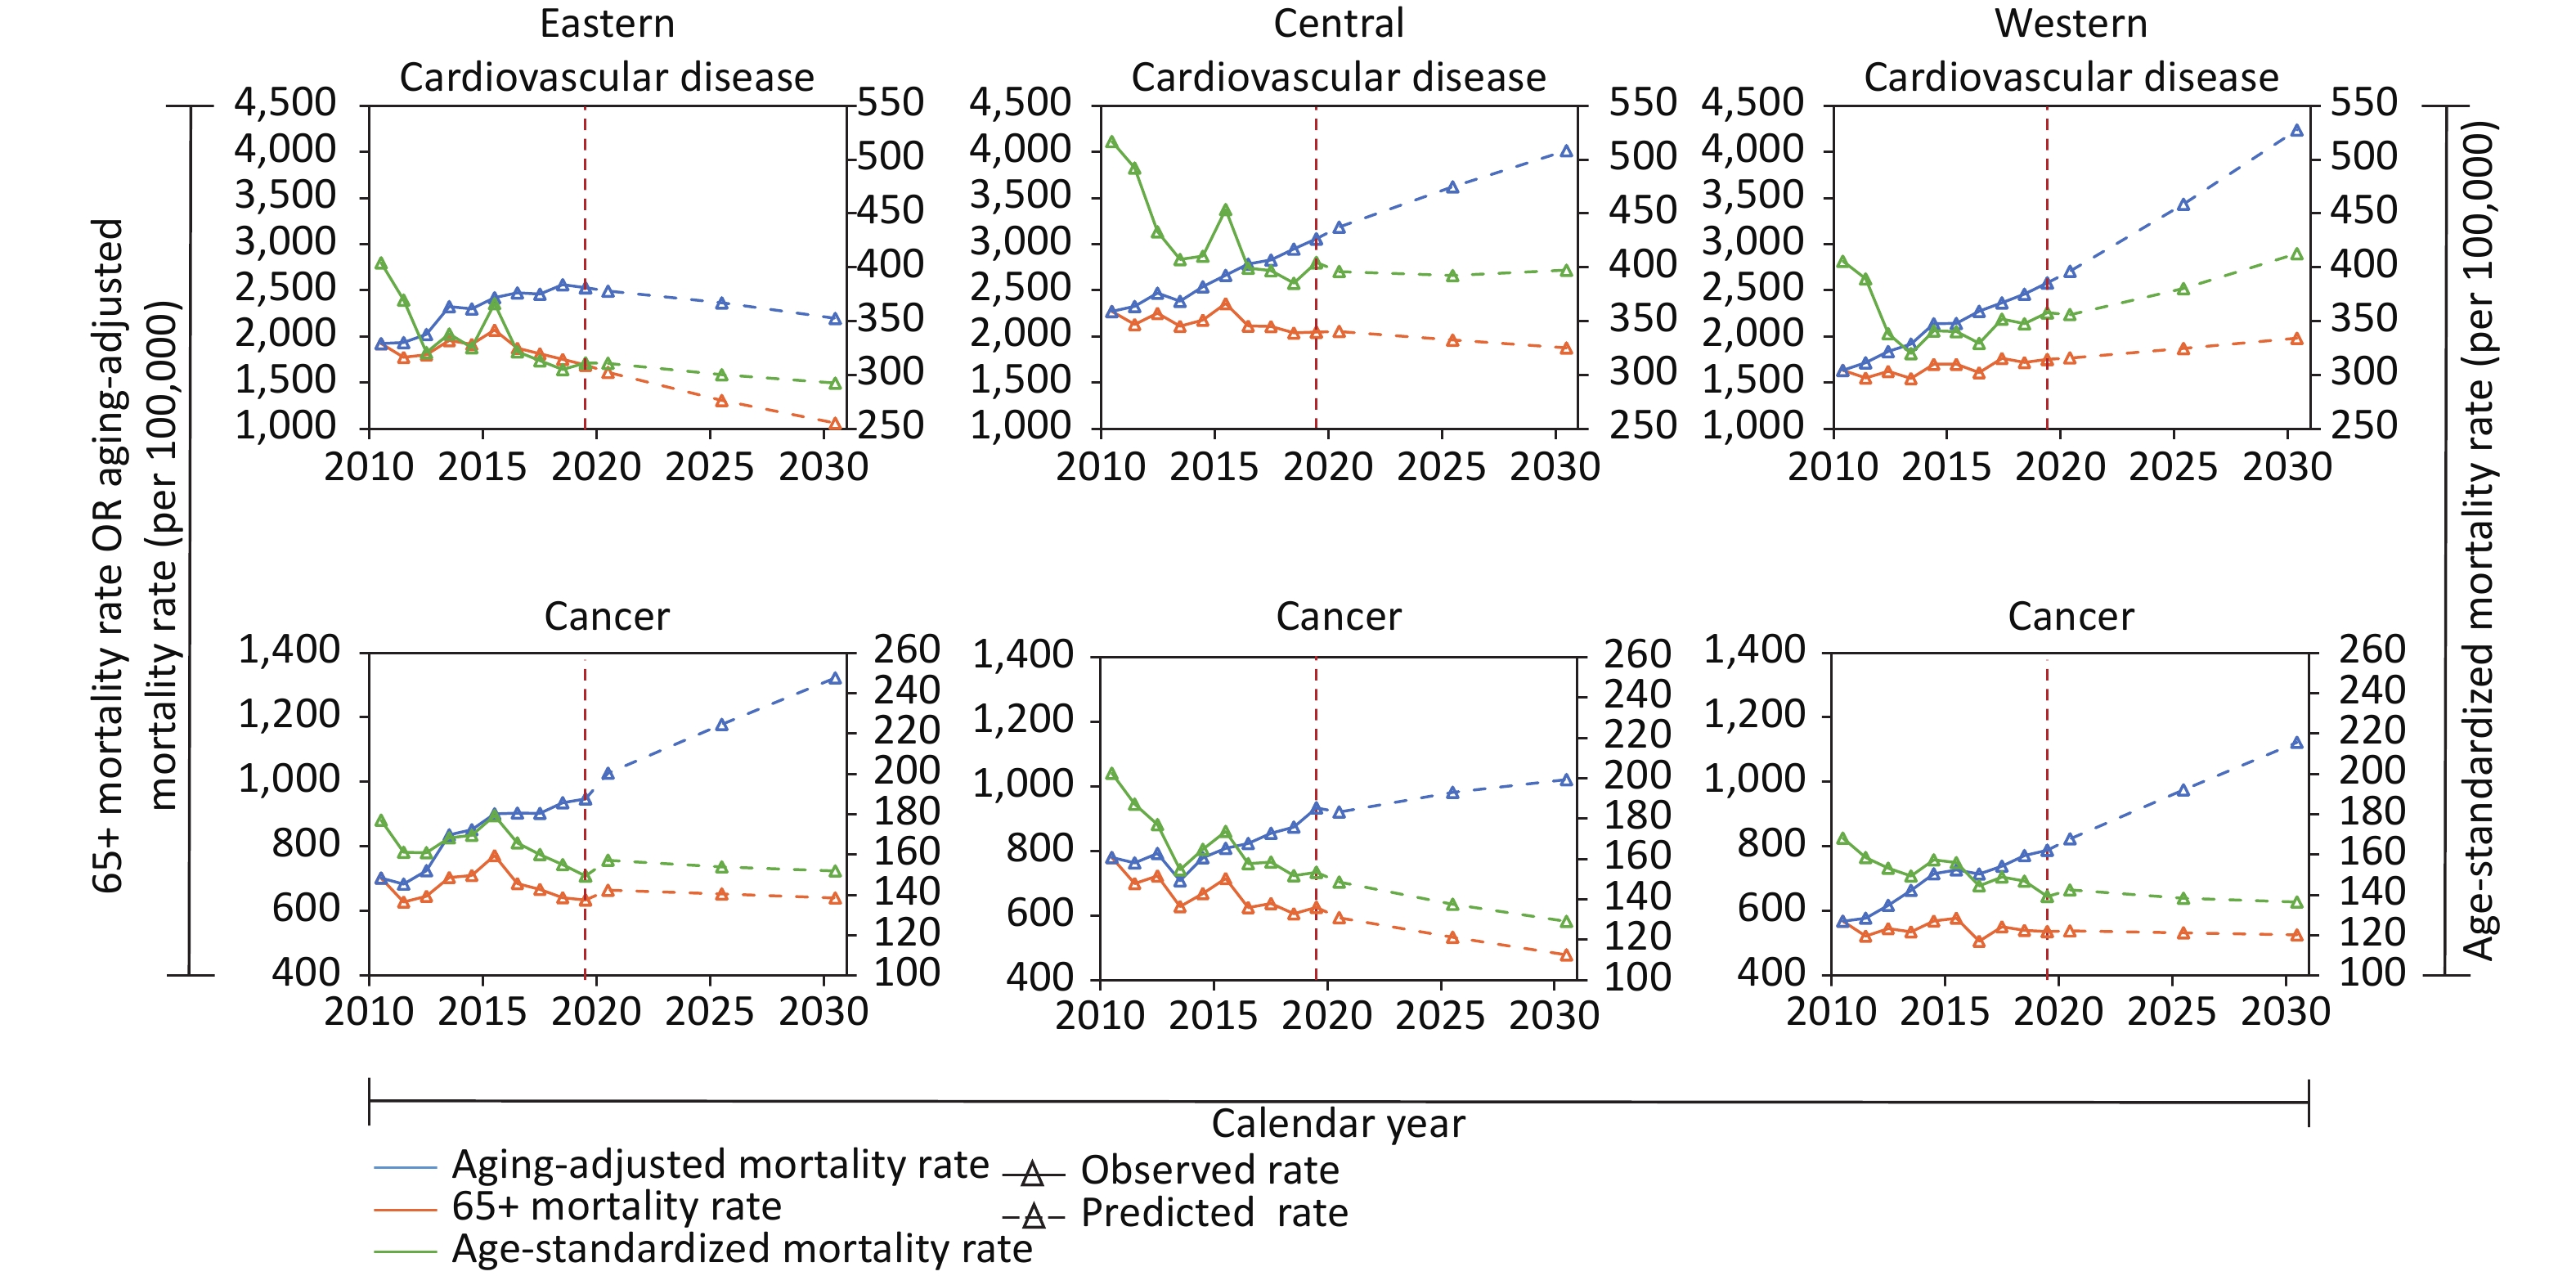
Figure 1 shows projected trends in the ASMR, 65+MR, and AAMR (per 100,000) of cardiovascular diseases and cancers from 2020 to 2030. The 95% confidence intervals (CIs) are shown in Supplementary Table S5 (available in www.besjournal.com). The scenarios varied by region for cardiovascular diseases. Compared with 2019, the 65+MR and AAMR in the eastern region are projected to see a relative decrease of 37.1% and 13.1% (Supplementary Table S6, available in www.besjournal.com). This is likely to be from the effect of modifiable factors reducing the burden of cardiovascular diseases, which offsets the effect of population aging (scenario 3). In the central region, the effect of modifiable factors in reducing the disease burden cannot fully offset the effect of population aging (scenario 2: 8.4% relative decrease in 65+MR, 31.2% relative increase in AAMR). The western region is expected to see the dual effects of population aging and modifiable risk factors increasing the disease burden (scenario 1: 13.0% and 64.2% relative increases in 65+MR and AAMR). By 2030, the AAMR of cardiovascular diseases in the western region is expected to be the highest among the three regions, nearly double that in the eastern region (4,241.36/100,000 vs. 2,199.87/100,000).
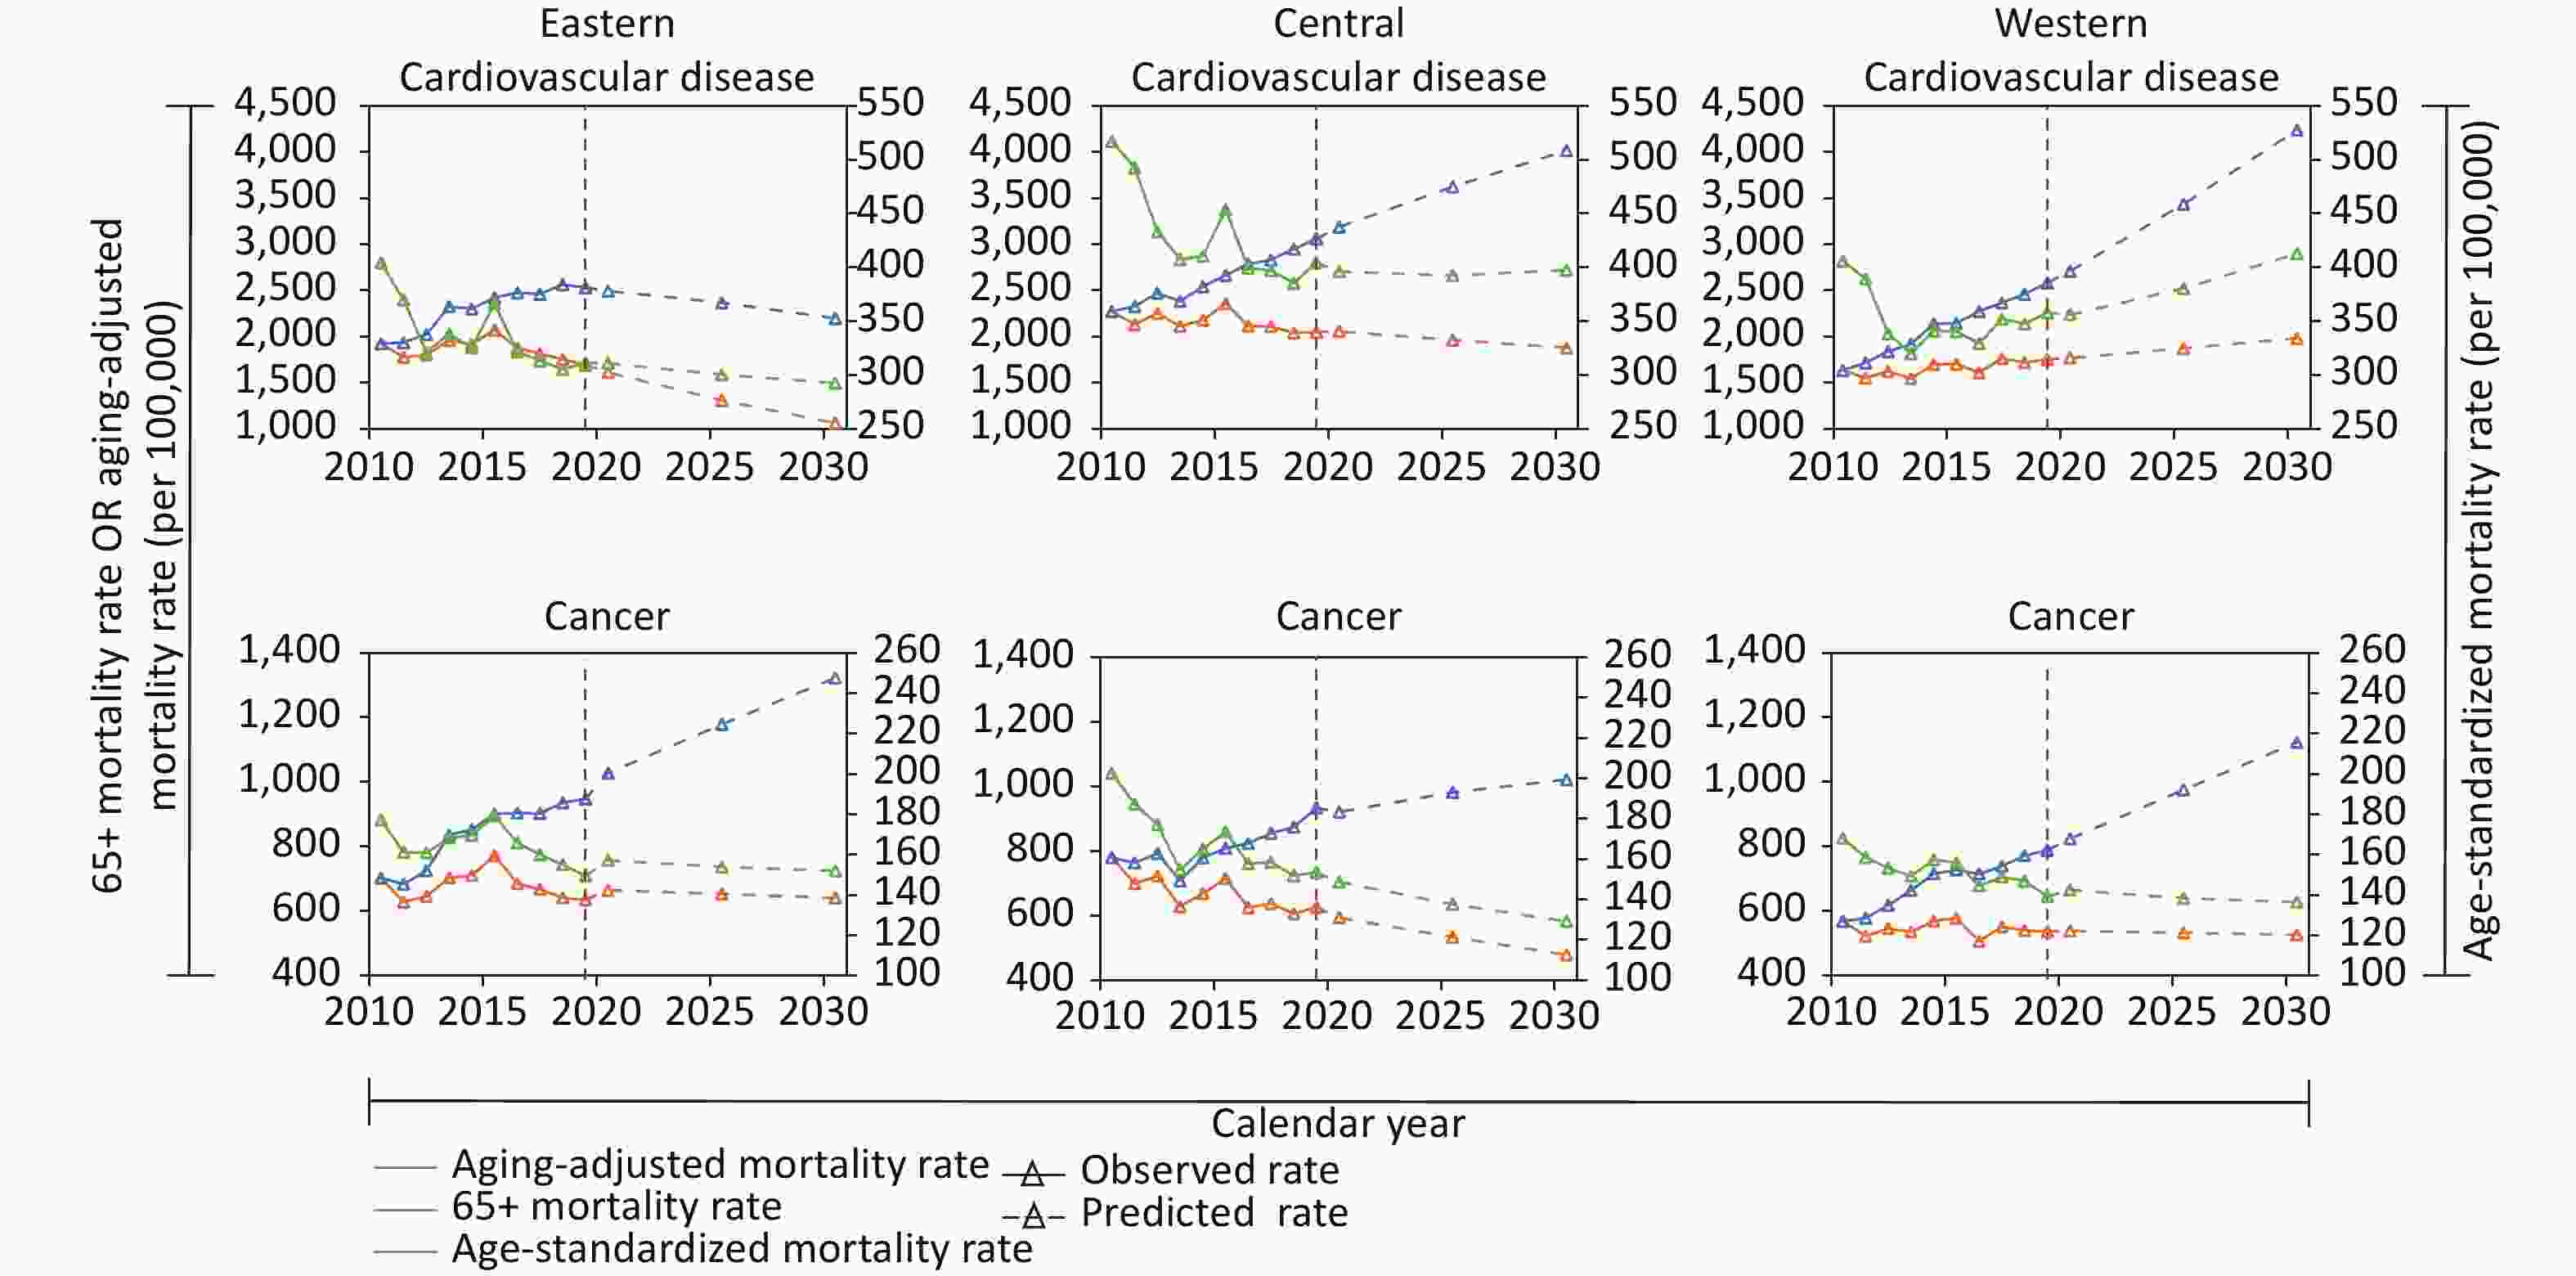
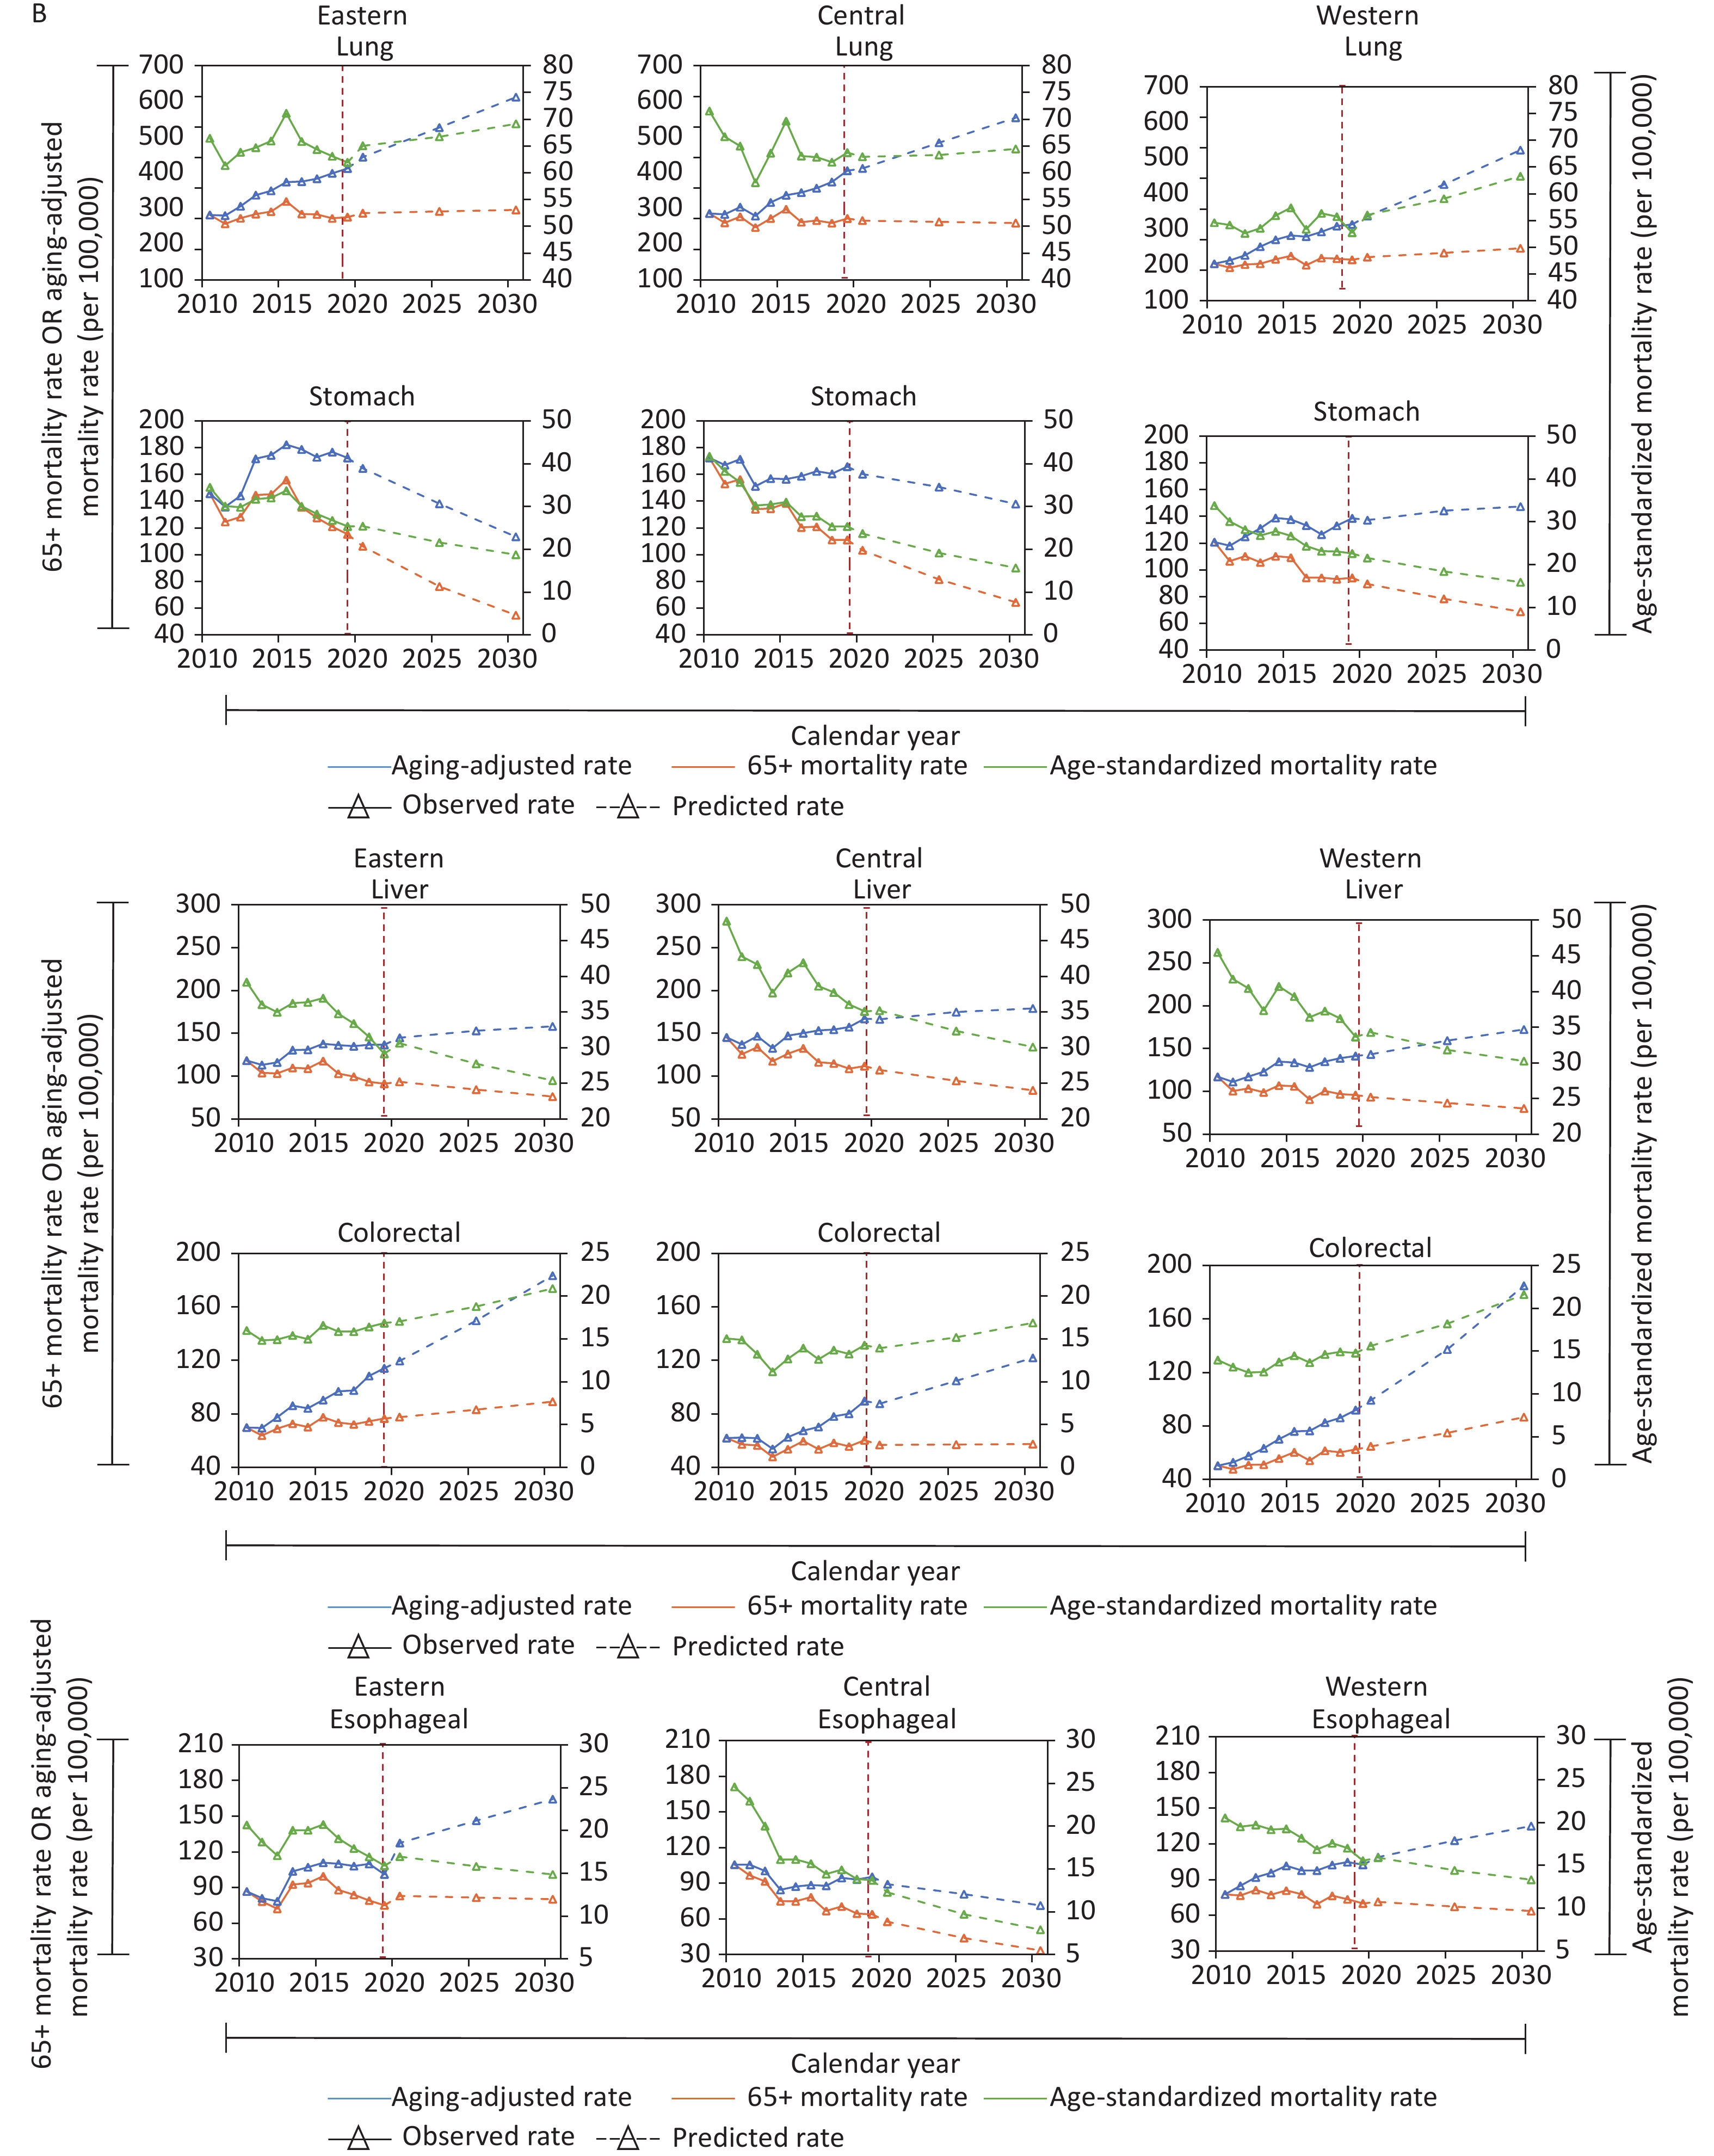
Figure 1. Age-standardized mortality rate, mortality rate for age 65+ years, and aging-adjusted mortality rate (per 100,000) for two major causes of death by region, 2010 to 2030.
In terms of cancers, the eastern region is expected to see scenario 1 in the future, with scenario 2 applying to the central and western regions. From 2019 to 2030, the cancer 65+MR is projected to increase in the eastern region (1.0% relative increase) but decrease in the central and western regions (by 23.6% and 1.9%). The AAMR in the western region is projected to show the most rapid increase (42.5% relative increase). By 2030, the AAMR of cancer in the western region is expected to be higher than that of the central region (1,130.70/100,000 vs. 1,018.68/100,000).
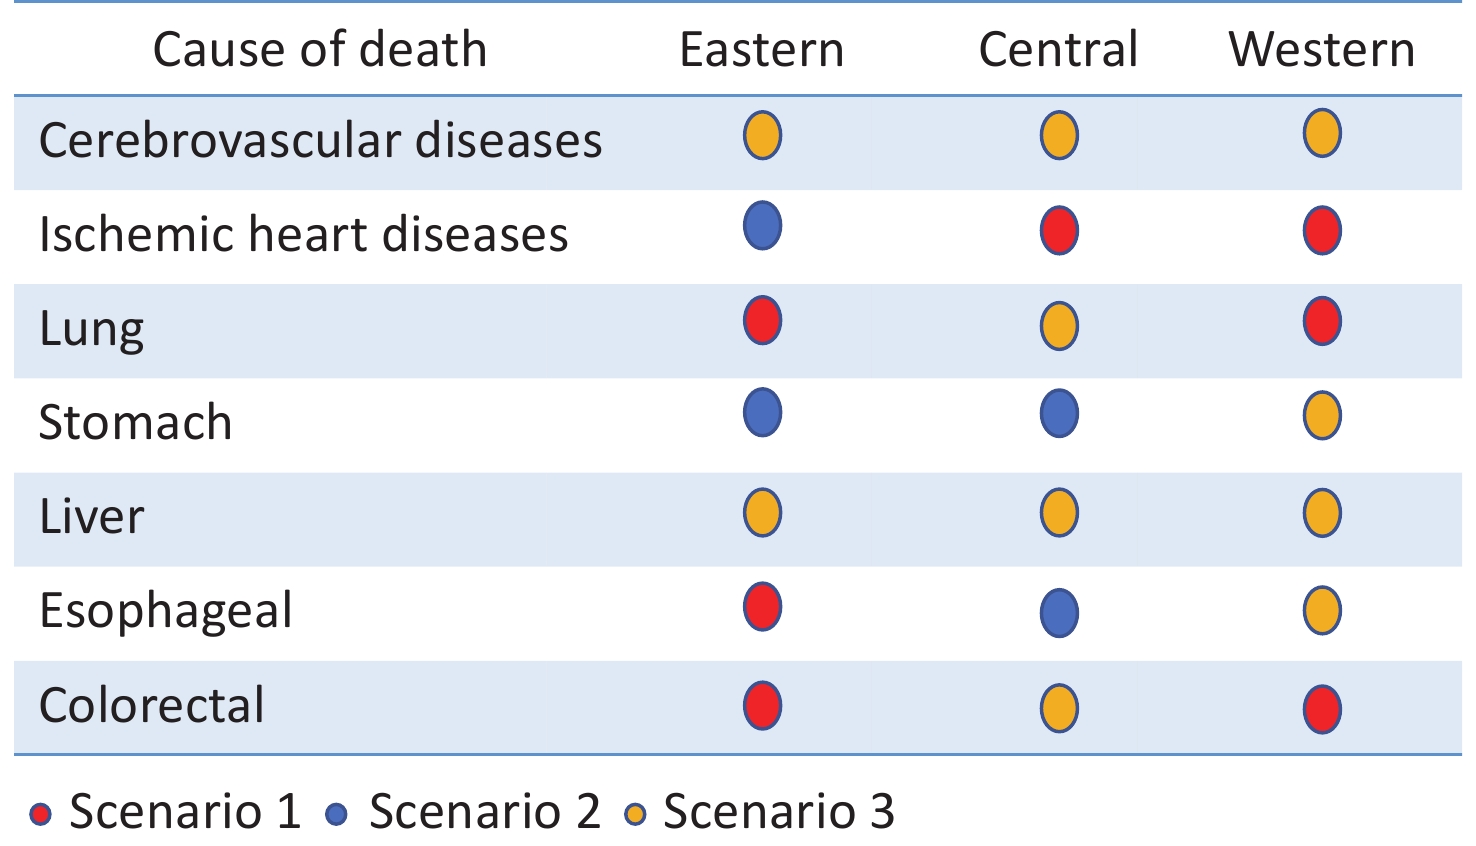
Figure 2 summarizes the scenario for all specific causes of death in each region during the next 10 years. The recommended management priorities are broadly consistent with those suggested by the current status. In 2030, colorectal cancer in the eastern region is expected to be the second most important cause of death, with the most rapid increase in 65+MR among all cancers (16.6% relative increase) and a 61.1% relative increase in AAMR. The same is true for colorectal cancer in the western region. The 65+MR of lung cancer and esophageal cancer in the eastern region are also projected to show a slight increase (7.4% and 6.9% relative increase). Coupled with population aging, the burden of these two cancers is likely to pose a double challenge (Supplementary Figure S2 and Supplementary Table S6). Cerebrovascular diseases are expected to show the same scenario in all three regions, with the highest 2030 65+MR and AAMR in the western region (922.92/100,000 and 1,972.58/100,000). The regional disparities for selected NCDs can be explained by the many modifiable risk factors and socioeconomic issues. In the western region in particular, there is a higher prevalence of risk factors (such as hypertension) for diseases, as well as lower healthcare access and quality[8]. In the eastern region, there is high urbanization, and increases in adoption of a westernized diet and sedentary lifestyle is expected to lead to increased mortality from lung and colorectal cancers in the next 10 years, despite the lower smoking prevalence there. In resource-limited China, it is therefore important to use targeted action in each region to curtail a future rise in deaths from NCDs.
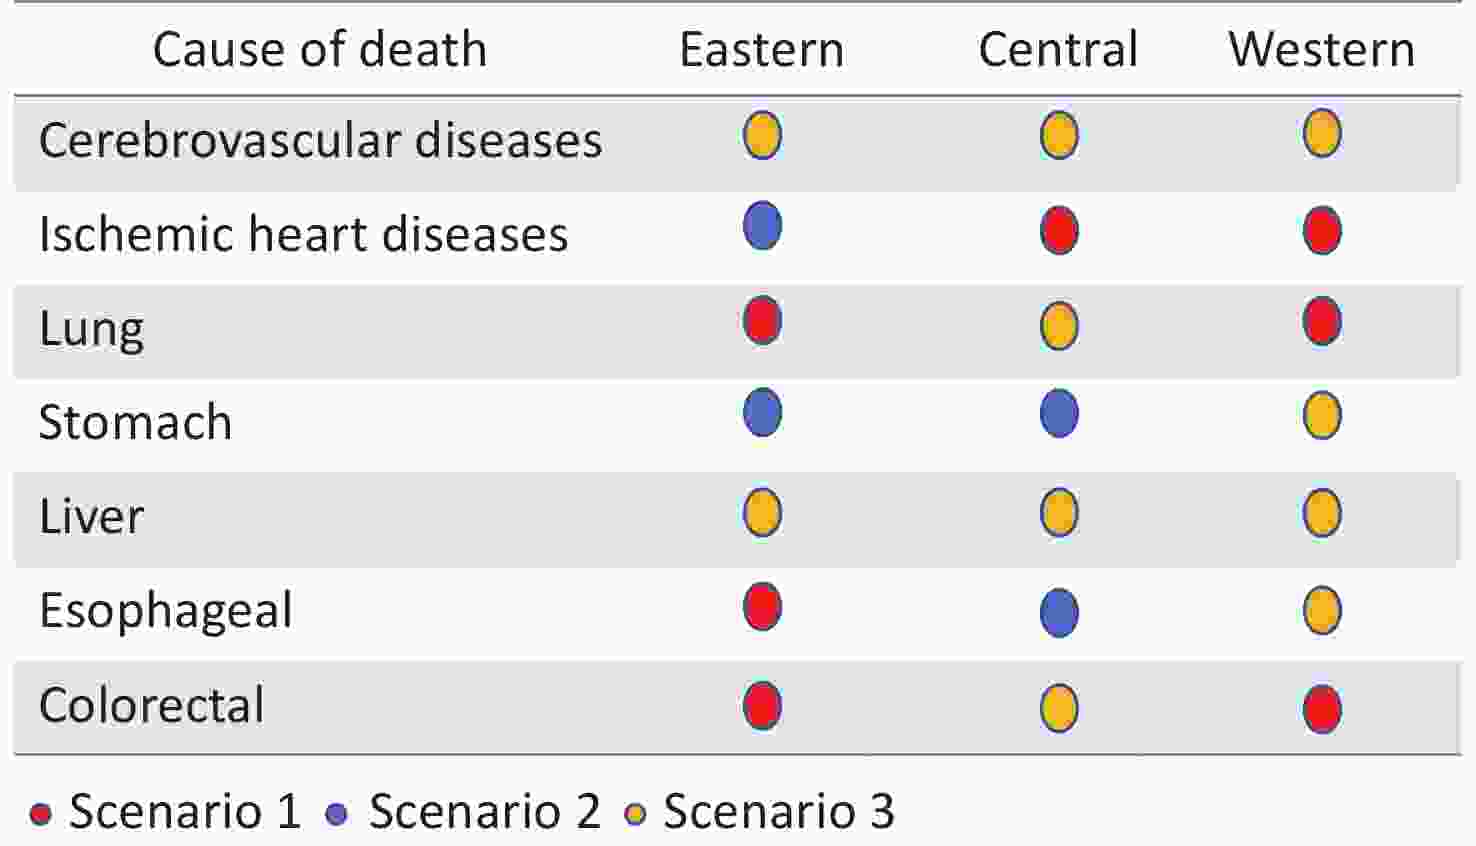
Figure 2. Summary of scenariosa for specific cause of death in 2030 compared with 2019. aScenario 1, marked with red solid circles, indicates the effects of modifiable factors and population aging that increase the disease burden; scenario 2, marked with yellow solid circles, indicates that the effect of population aging in increasing the disease burden is dominant; scenario 3, marked with blue solid circles, indicates that the effect of modifiable factors in reducing the disease burden is dominant.
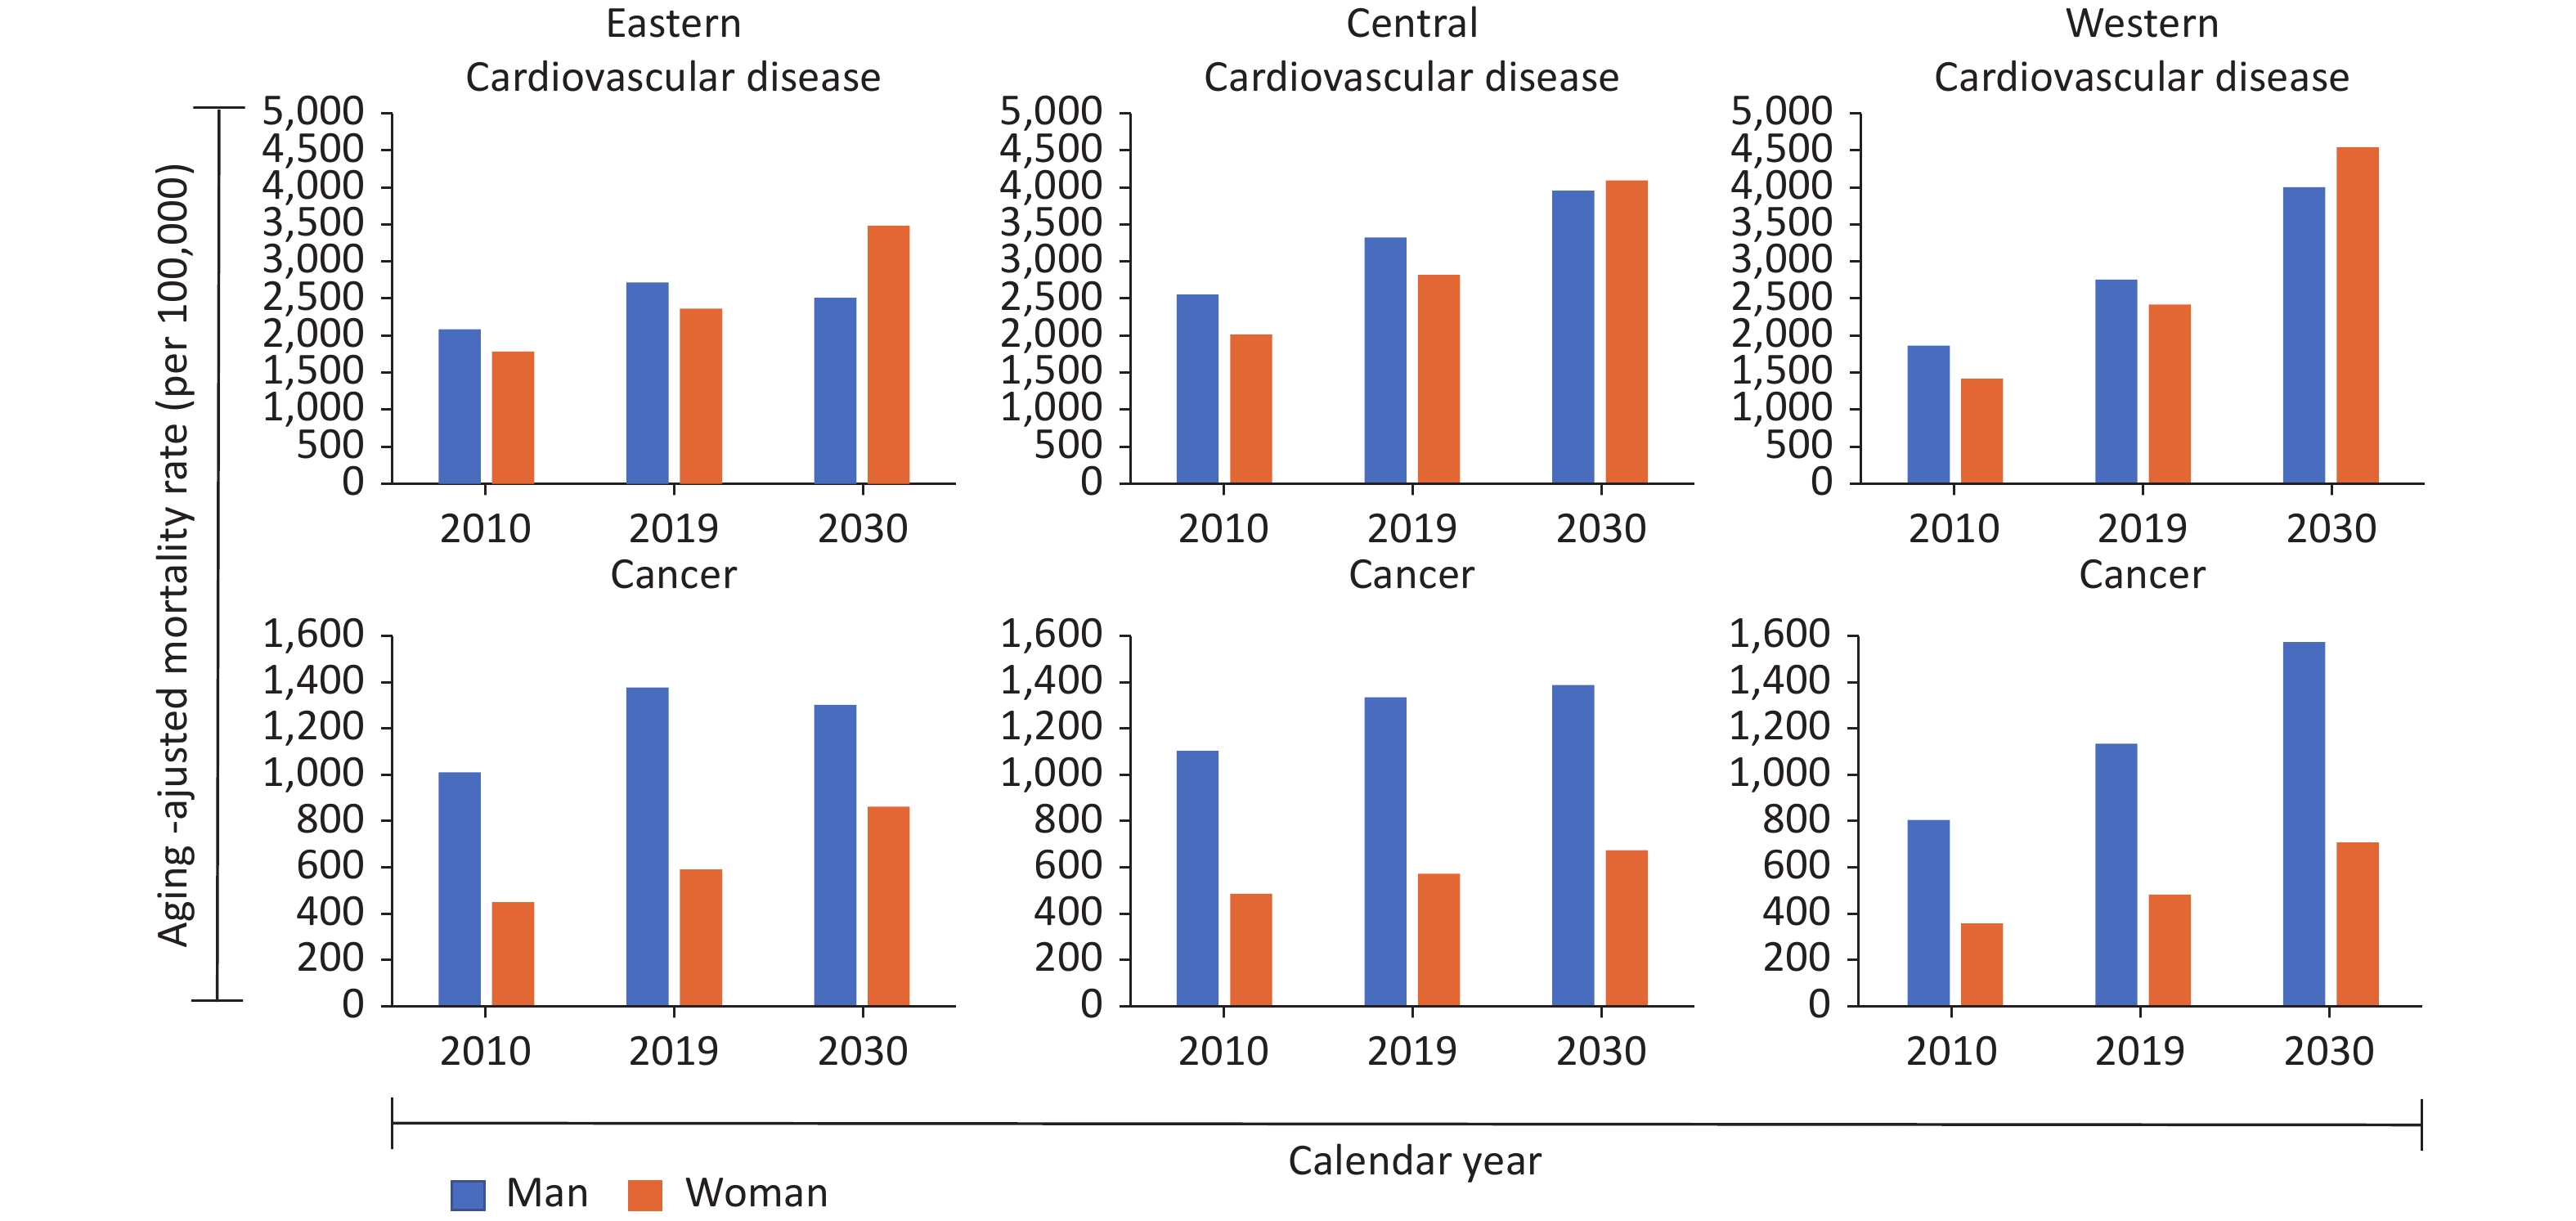
For cardiovascular diseases in men, the AAMR is projected to increase in all three regions from 2010 to 2030 (20.2%, 55.1%, and 114.6% relative increases; Supplementary Figure S3 and Supplementary Table S7, available in www.besjournal.com). The same trend was also projected for women. For cancer, the AAMR trends in both men and women showed the same profile as for cardiovascular diseases. The AAMR of cancer is projected to increase faster in women than men, but still to remain consistently higher in men. This can be partially explained by smoking prevalence, which is lower among women but women are more likely to experience passive smoking at home and in the workplace[9].
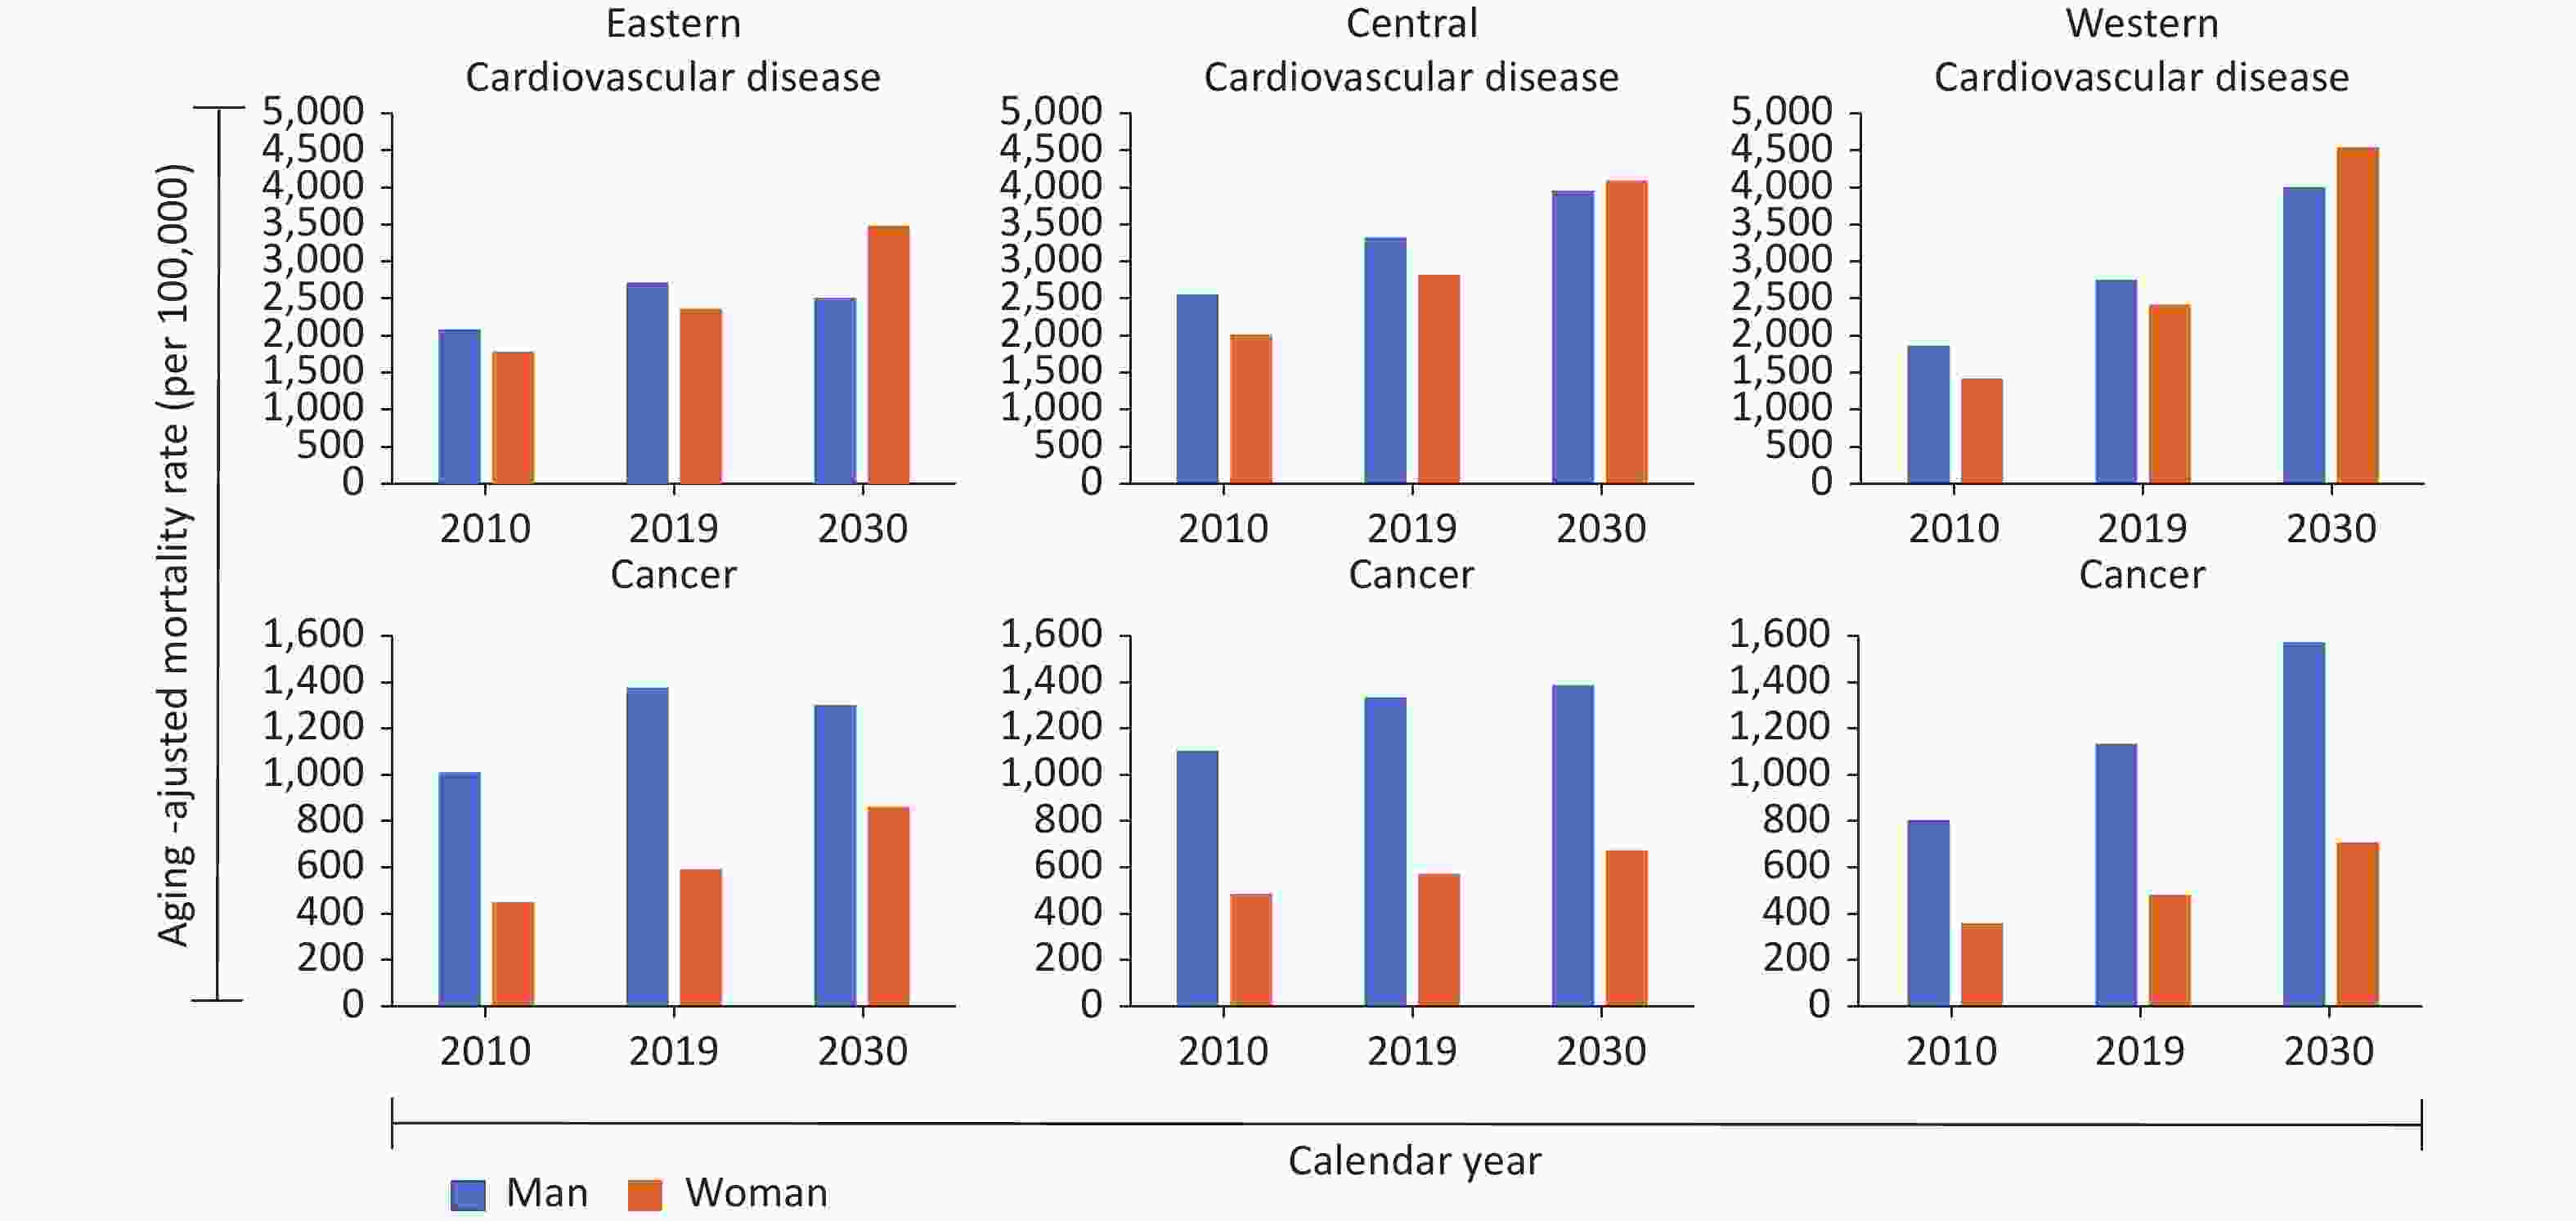
Figure S3. Aging-adjusted mortality rates (per 100,000) for two major causes of death, by sex and region from 2010 to 2030.
Cause of death Year Eastern Central Western Male Female Male Female Male Female Cardiovascular diseases 2010 2087.92 1785.11 2553.48 2017.83 1865.63 1421.52 2019 2719.55 2367.37 3326.59 2820.36 2758.69 2418.93 2030 2510.18 3482.38 3959.69 4096.40 4004.02 4541.85 Cerebrovascular diseases 2010 1277.69 1033.39 1584.43 1158.65 1301.46 941.59 2019 1476.24 1188.17 1814.43 1399.13 1663.57 1345.57 2030 1211.52 1472.99 1804.05 1645.04 1949.12 1891.53 Ischemic heart diseases 2010 810.24 751.72 969.05 859.18 564.16 479.94 2019 1243.31 1179.20 1512.17 1421.23 1095.12 1073.36 2030 1325.91 1103.29 2172.76 2435.45 2251.54 2816.61 Cancer site 2010 1007.64 446.29 1100.53 482.55 801.86 355.81 2019 1375.58 588.48 1332.36 569.61 1131.38 480.44 2030 1299.59 858.97 1384.59 671.17 1570.74 705.07 Lung 2010 410.56 174.07 419.08 168.83 296.84 117.68 2019 608.67 247.81 603.26 234.15 464.89 180.91 2030 643.89 387.10 757.89 335.60 731.75 312.13 Stomach 2010 213.93 88.72 243.68 110.23 168.34 78.57 2019 258.11 100.60 241.55 100.68 196.29 87.81 2030 187.60 127.51 189.88 82.69 197.71 93.89 Liver 2010 170.52 74.20 207.28 90.00 164.90 73.74 2019 195.93 86.49 234.34 107.69 196.62 91.33 2030 209.77 107.24 221.86 129.90 223.54 115.59 Esophageal 2010 130.00 50.43 151.41 67.04 111.41 45.09 2019 169.50 63.70 141.38 56.72 157.78 50.89 2030 129.78 104.99 101.71 55.87 218.86 52.22 Colorectal 2010 82.63 58.88 79.08 46.45 60.38 40.72 2019 143.37 89.88 111.83 70.38 115.79 69.50 2030 225.87 144.08 141.17 97.60 229.77 131.41 Table S7. Aging-adjusted mortality rates (per 100,000) for selected NCDs by sex and region from 2010 to 2030
Compared with developed countries, China’s healthcare system is not sufficiently mature. In neighboring Japan, patients can easily access medical institutions at a low cost, and routine health checkups cover all adults age 40 years and over[10]. Chinese policy-makers are gradually improving the healthcare system by expanding the coverage of social health insurance and the scope of reimbursement in the eastern region. In the western region, the primary task is to improve socioeconomic status, which is associated with improving health. To develop the economy of the western region, the government issued the “Strategy for Large-scale Development of Western China” beginning from the 10th Five-Year Plan, and linked to the Belt and Road Initiative in 2013. These initiatives provide a material and economic basis for the management of NCDs. In 2016, China released the Health China 2030 Planning Outline, which further highlights the importance of a healthy population. It also implements health poverty alleviation projects for the central and western regions to narrow regional disparities. These initiatives present a tremendous opportunity to prevent and control NCDs among aging populations in these regions.
Our study had several limitations. First, under-reporting of data may lead to underestimation of mortality rates. Second, there are many aspects of change which could lead to uncertainty about future trends. However, regional disparities are still likely. With the development of healthcare systems and urban–rural development, the 65+MR of cardiovascular diseases will probably decline faster than our prediction, which would overestimate the projected future mortality rate. Additionally, we do not have access to data on changes in the proportion of the population aged 65+ years for each region between 2020 and 2030. We assumed that the proportion of this population in the three regions would grow at the same pace, which may lead to the projections of AAMR being skewed to some extent. Mortality rates have been adjusted for age and sex, but future mortality rates will also be influenced by many other factors, such as smoking cessation rates, and the development of screening.
There is wide regional disparity in the burden of NCDs in China. The most serious burden is in the western region, where the impact of population aging far outweighs the decline that could be obtained by controlling modifiable factors. A one-size-fits-all management model in China is not feasible and each region should identify its own disease control priorities.
Ethics Approval and Consent to Participate Not applicable.
Consent for Publication Not applicable.
Acknowledgments We appreciate the work by China’s disease surveillance points system and the United Nations Population Division. We thank Analisa Avila, MPH, ELS, and Melissa Leffler, MBA of Liwen Bianji (Edanz) (www.liwenbianji.cn), for editing the language of a draft of this manuscript.
Availability of Data and Materials The data that support the findings of our study are openly available in the China death surveillance datasets (2010–2019) published by the Chinese Center for Disease Control and Prevention (
https://ncncd.chinacdc.cn/xzzq_1/202101/t20210111_223706.htm ), and the population data are available in the United Nations Population Division 2019 Revision of World Population Prospects (https://population.un.org/wpp/ ). Administrative permissions were not required to access the raw data used in this study.Conflict of Interest The authors declare that the research was conducted in the absence of any commercial or financial relationships that could be construed as a potential conflict of interest.
Authors’ Contributions YCH and CYL designed the entire study and drafted the manuscript. YCH, CYL, LN, and JJM analyzed and interpreted the data. YCH, CYL, LN, WZX, HW, XF, WP, GWT, DJ, and JJM revised the manuscript. All authors read and approved the final manuscript.
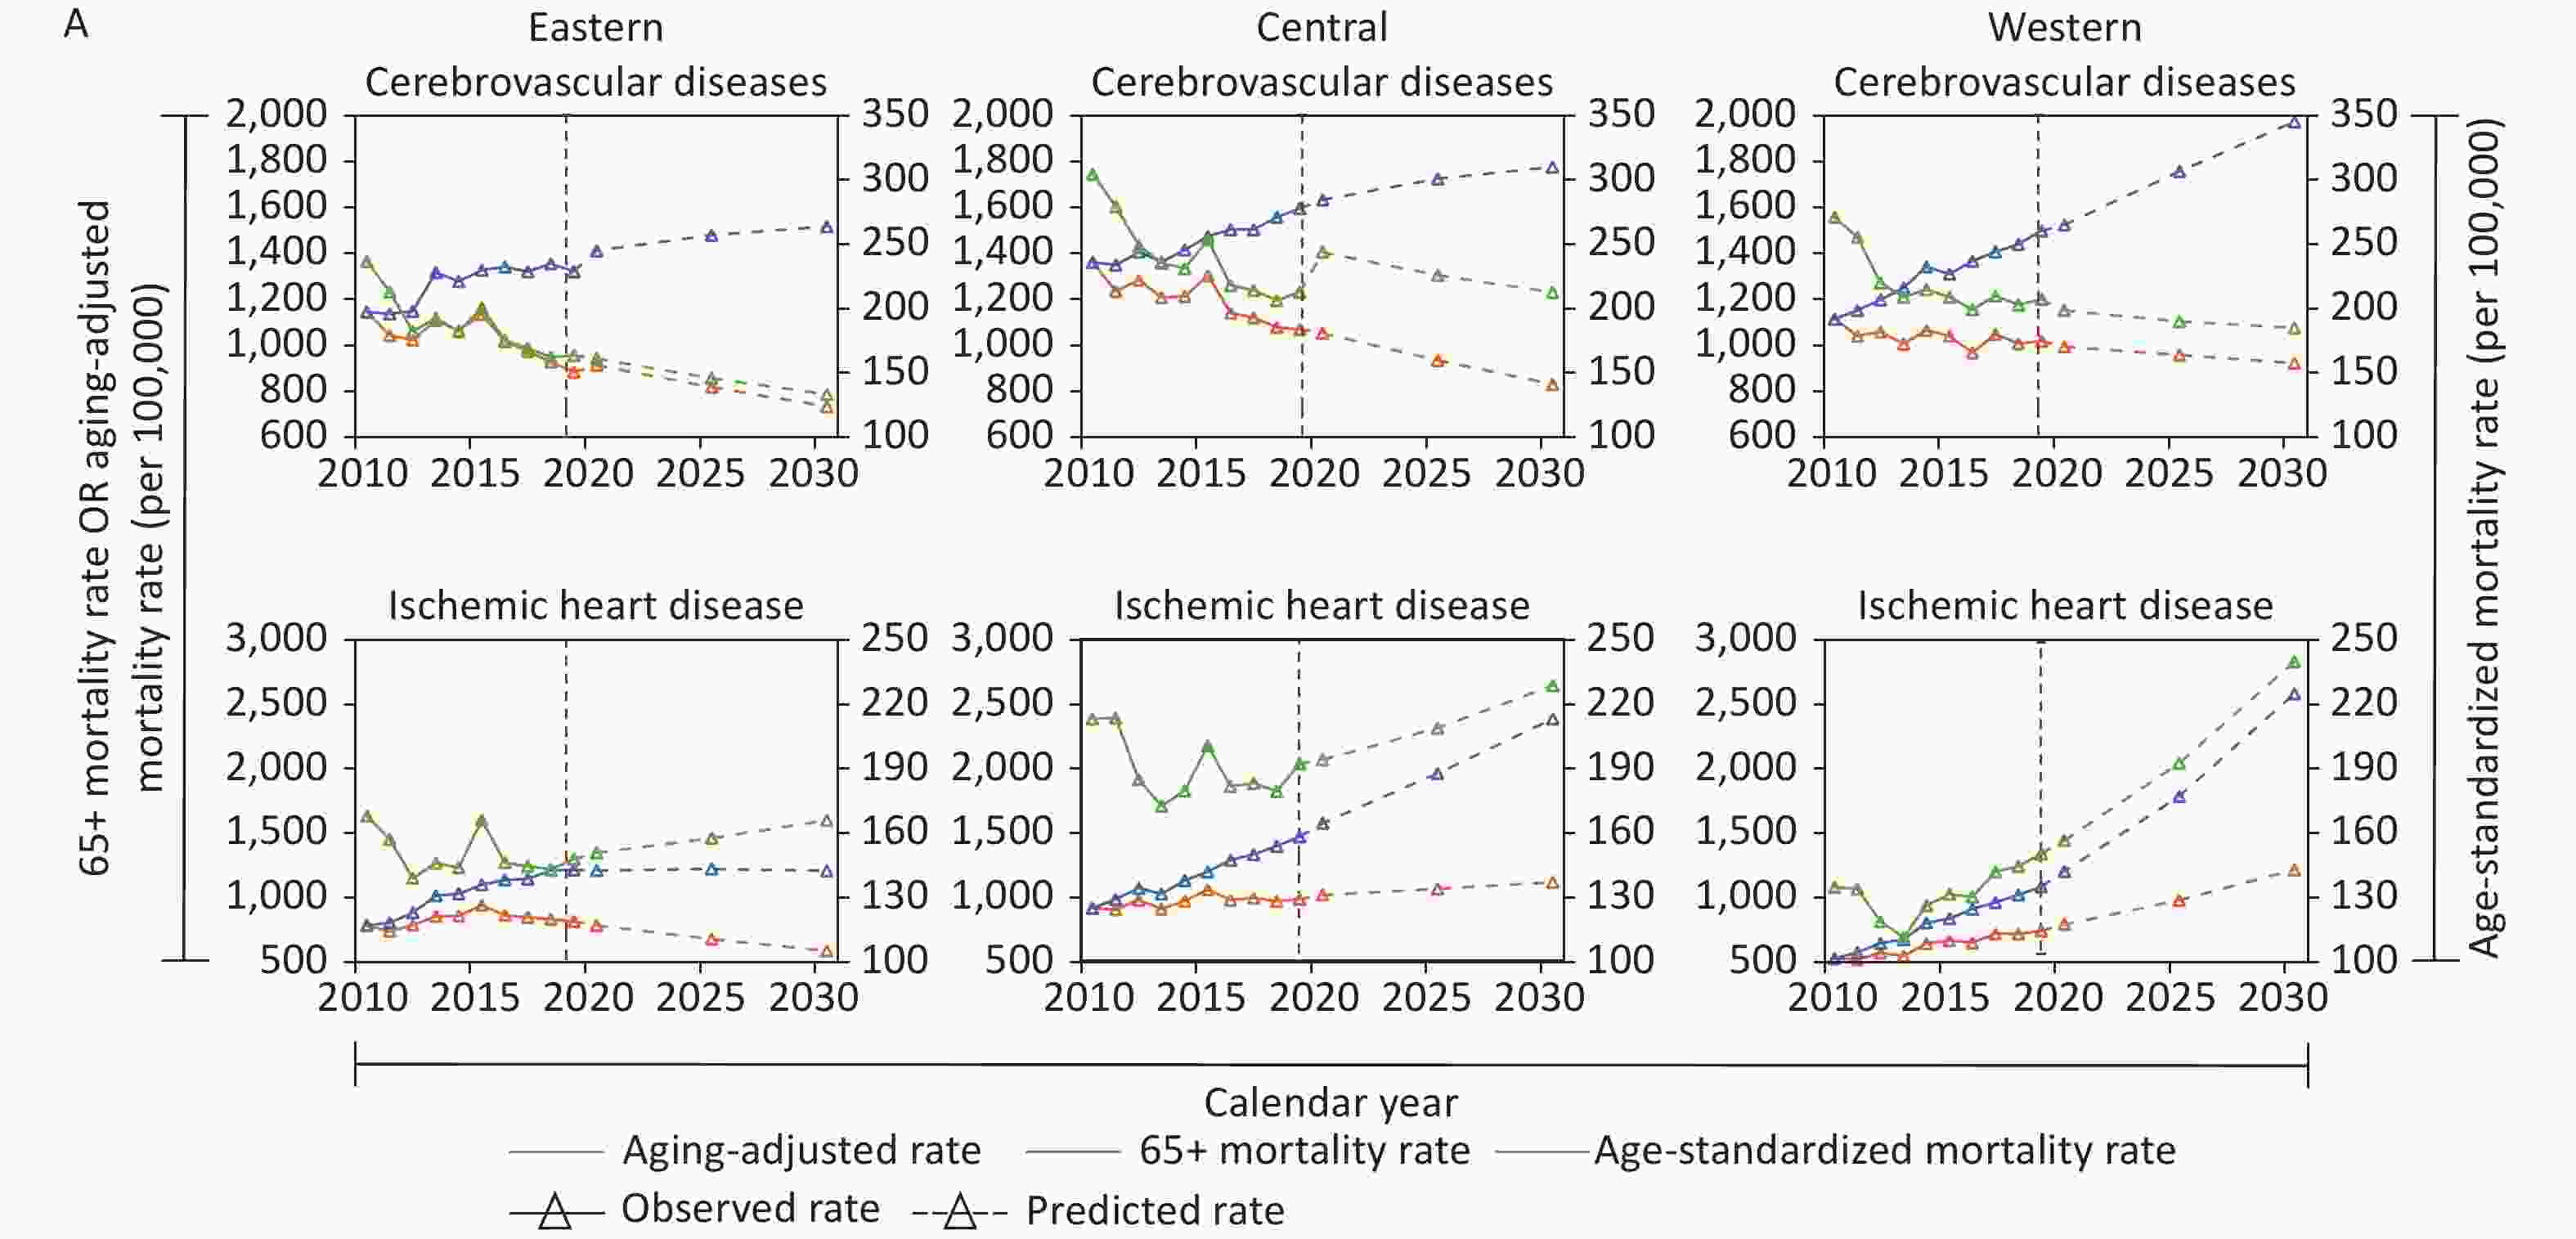
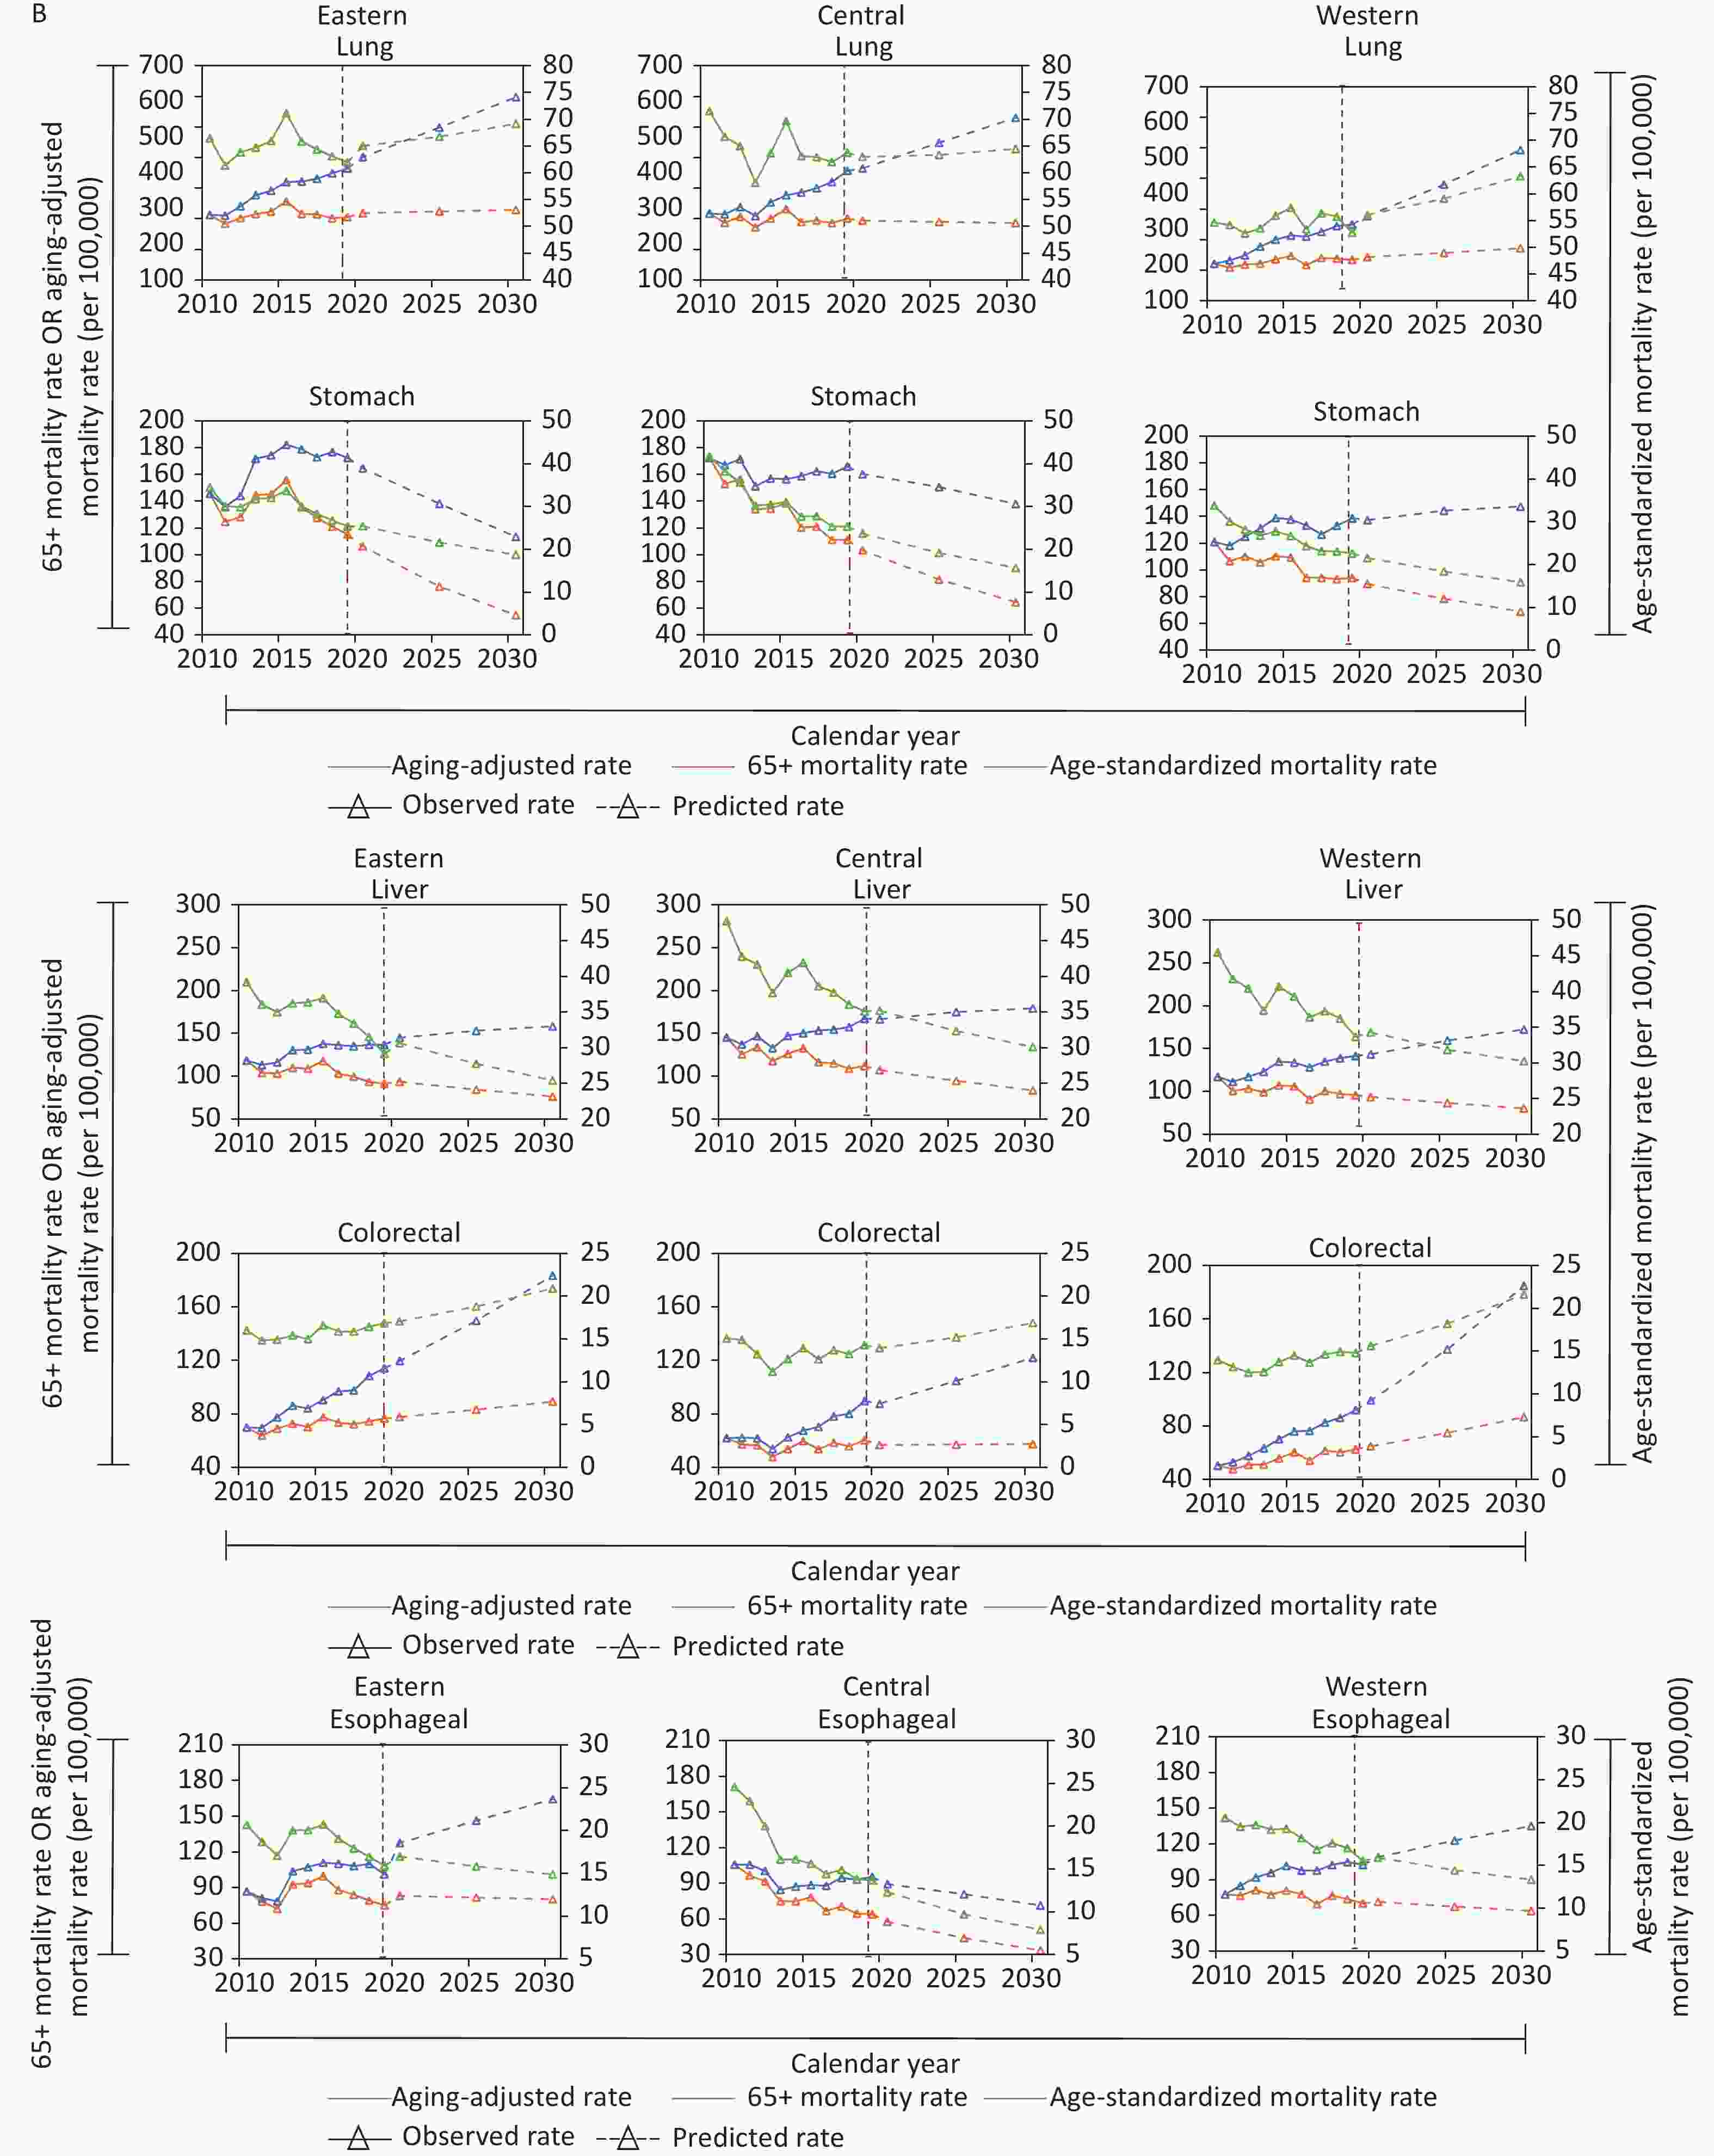
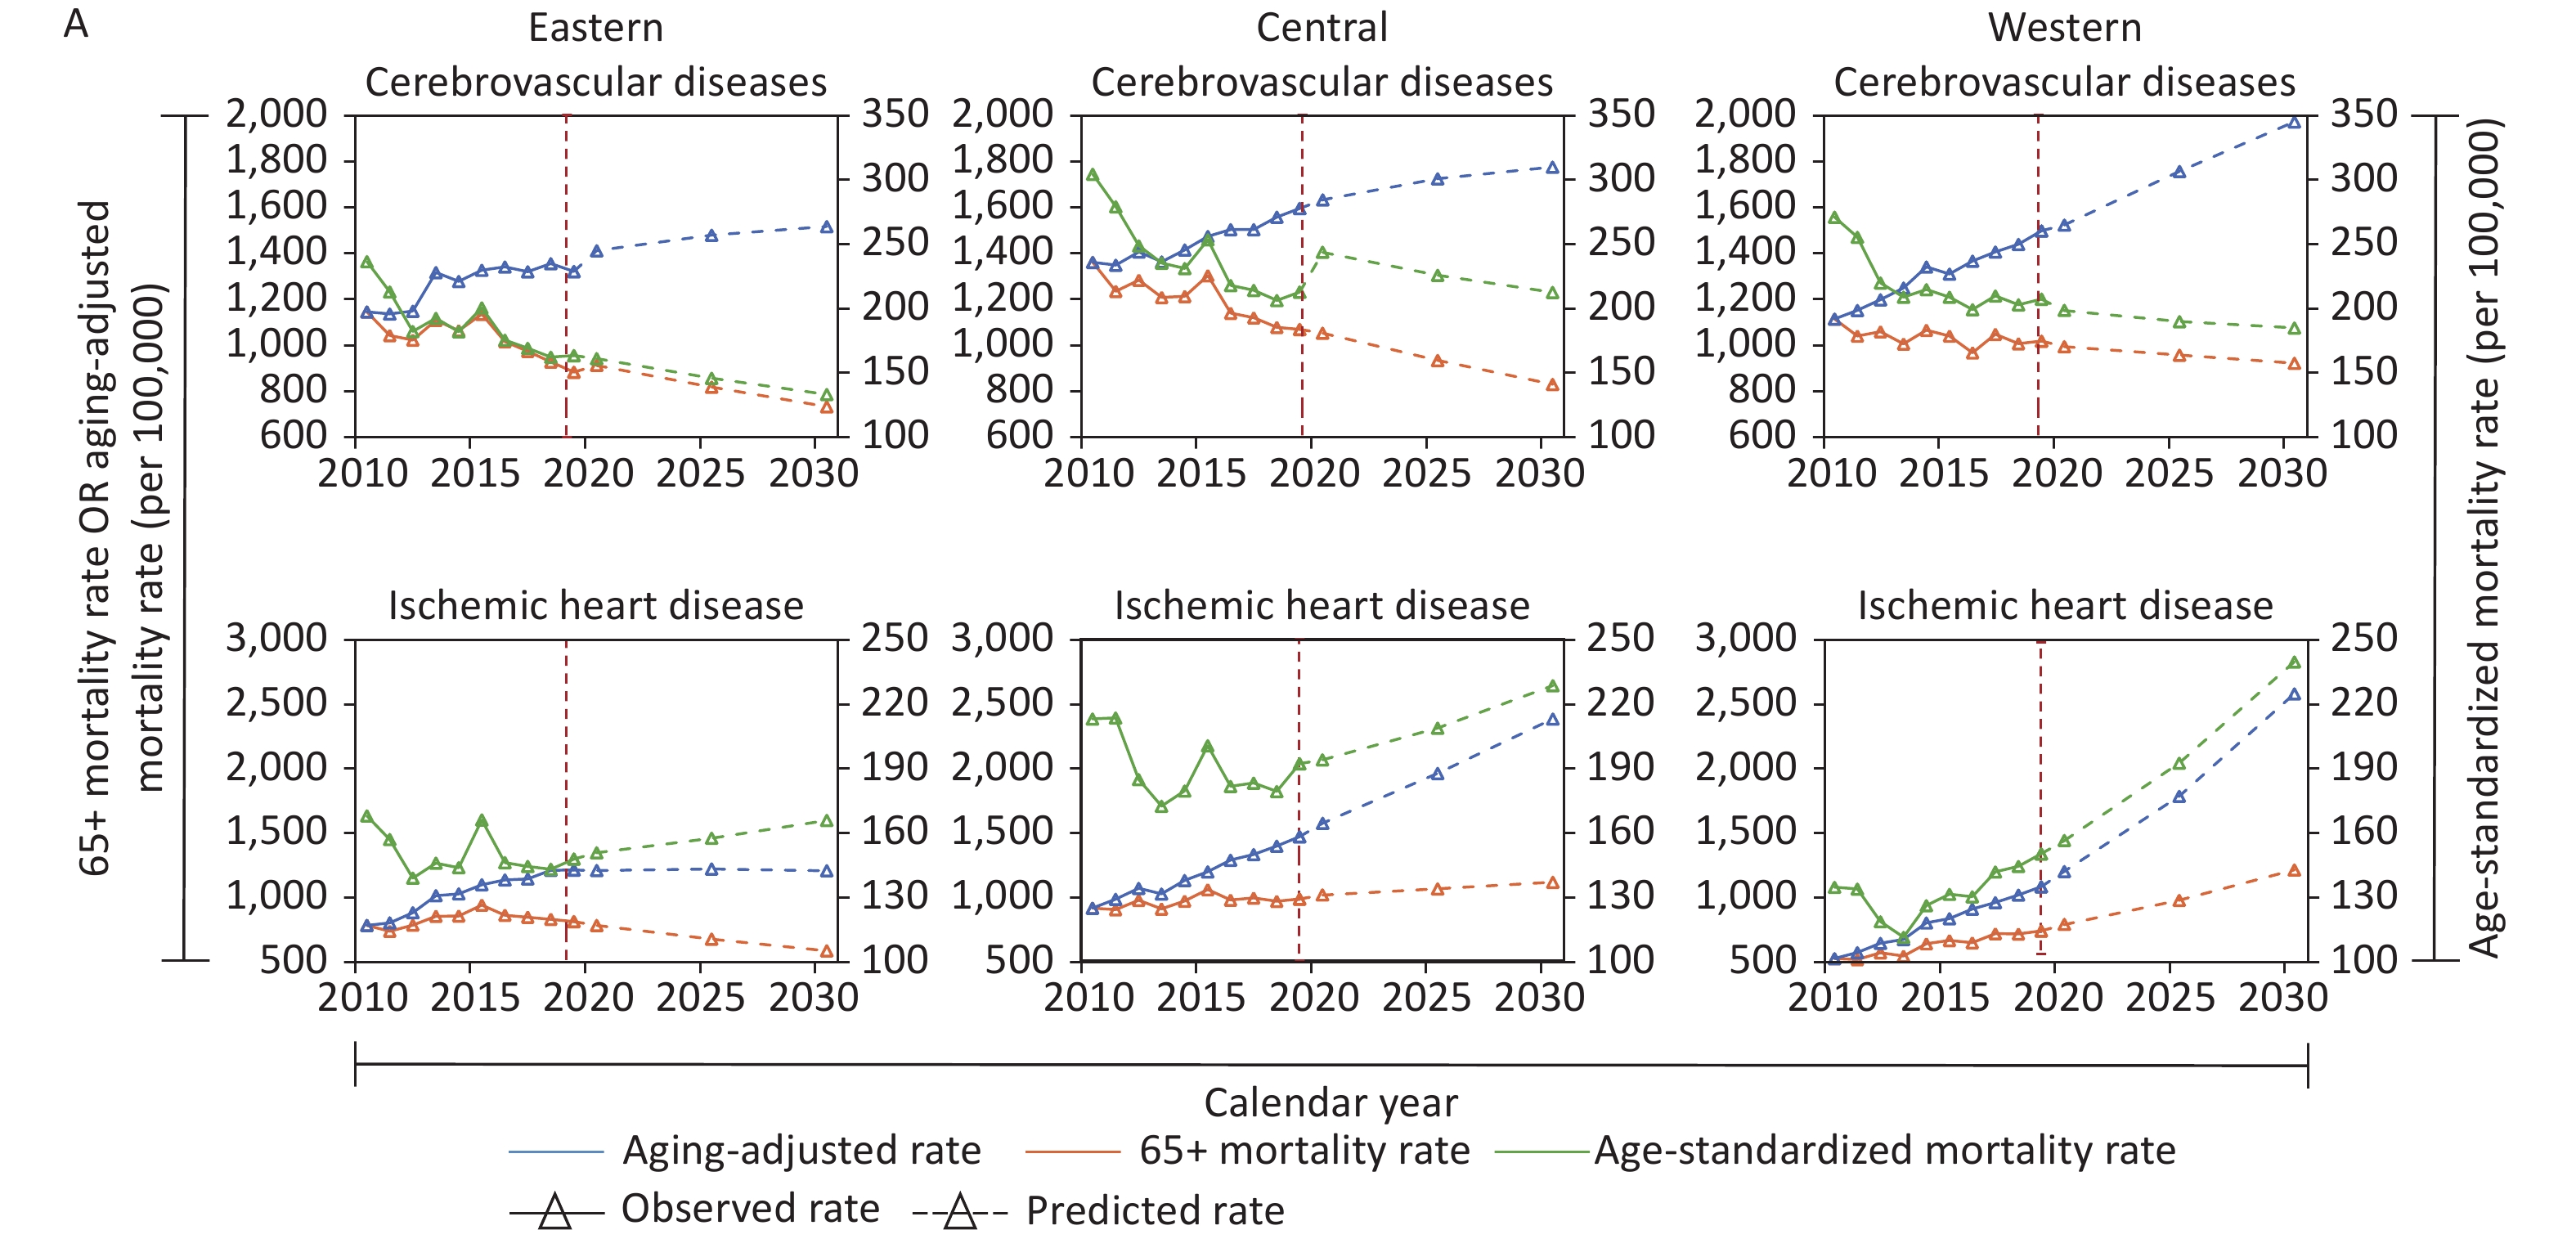
Figure S2. Age-standardized mortality rate, mortality rate age 65+ years, and aging-adjusted mortality rate (per 100,000) for cardiovascular diseases (A) and cancers (B) by region, 2010 to 2030.
(a) Region Cardiovascular Cancer Estimated value 95% CI Estimated value 95% CI East 2020 1612.96 (1474.37, 1764.59) 668.85 (601.00, 744.35) 2025 1310.36 (1051.51, 1632.94) 656.66 (544.32, 792.20) 2030 1064.53 (746.99, 1517.06) 644.70 (491.30, 845.99) Central 2020 2056.66 (1929.98, 2191.67) 591.90 (544.32, 643.65) 2025 1966.37 (1758.83, 2198.40) 531.22 (458.58, 615.36) 2030 1880.04 (1599.63, 2209.61) 476.76 (385.32, 589.89) West 2020 1769.86 (1675.89, 1869.11) 541.48 (506.14, 579.28) 2025 1874.08 (1703.01, 2062.33) 535.21 (475.45, 602.49) 2030 1984.43 (1727.58, 2279.48) 529.03 (445.67, 627.98) Table S5. Predicted value and 95% CI for 65+MR(a), AAMR(b), and ASMR(c) in 2020–2030
(b) Region Cardiovascular Cancer Estimated value 95% CI Estimated value 95% CI East 2020 2494.88 (2280.50, 2729.41) 1034.55 (929.61, 1151.33) 2025 2367.35 (1899.70, 2950.13) 1186.35 (983.38, 1431.21) 2030 2199.87 (1543.66, 3135.02) 1332.28 (1015.28, 1748.25) Central 2020 3189.67 (2985.22, 3390.00) 917.98 (841.93, 995.57) 2025 3625.57 (3177.58, 3971.72) 979.45 (828.49, 1111.74) 2030 4017.04 (3305.66, 4566.20) 1018.68 (796.28, 1219.02) West 2020 2711.03 (2592.21, 2891.08) 829.42 (782.88, 896.01) 2025 3438.09 (3076.73, 3725.89) 981.88 (858.97, 1088.49) 2030 4241.36 (3570.06, 4710.57) 1130.70 (920.98, 1297.72) (c) Region Cardiovascular Cancer Estimated value 95% CI Estimated value 95% CI East 2020 311.02 (281.99, 343.05) 157.93 (146.30, 170.48) 2025 300.50 (253.03, 356.87) 154.58 (135.17, 176.78) 2030 292.68 (228.17, 375.41) 152.57 (125.62, 185.29) Central 2020 396.23 (359.07, 437.23) 148.31 (135.93, 161.82) 2025 392.72 (330.41, 466.78) 137.36 (117.88, 160.06) 2030 397.65 (309.63, 510.68) 128.83 (103.24, 160.78) West 2020 356.25 (337.67, 375.86) 143.10 (136.39, 150.15) 2025 380.62 (340.81, 425.07) 138.95 (127.71, 151.19) 2030 413.02 (348.65, 489.28) 137.04 (121.28, 154.85) Cause of death Age-standardized mortaility rate Mortality of aged 65+ Aging-adjusted mortality rate East Central West East Central West East Central West Cardiovascular diseases 292.68 397.65 413.02 1064.53 1880.04 1984.43 2199.87 4017.04 4241.36 Cerebrovascular diseases 133.46 212.68 185.06 734.36 831.39 922.92 1517.57 1776.41 1972.58 Ischemic heart diseases 165.73 228.32 241.07 582.54 1113.33 1217.11 1203.83 2378.82 2601.35 Cancer site 152.57 128.83 137.04 644.70 476.76 529.03 1332.28 1018.68 1130.70 Lung 69.42 64.71 63.79 298.46 261.55 248.89 616.78 558.85 531.96 Stomach 19.03 15.95 16.19 55.39 65.12 69.62 114.47 139.14 148.81 Liver 25.48 30.15 30.32 76.80 84.07 80.88 158.72 179.62 172.87 Esophageal 15.00 8.01 13.28 80.75 33.89 63.13 166.86 72.41 134.92 Colorectal 21.12 17.06 21.58 89.46 57.42 86.43 184.87 122.69 184.73 Table S6. Age-standardized mortality rate, mortality rate age 65+ years, and aging-adjusted mortality rate (per 100,000) by region in 2030
HTML


Reference

 Quick Links
 DownLoad: