


-
Peripheral nerve injury (PNI) is a common clinical problem; despite the advances that have been made in understanding the pathophysiological and biological factors related to nerve injury and recovery and the availability of modern diagnostic procedures and advanced microsurgical techniques, the clinical treatment outcome for this condition remains unsatisfactory [1-3]. Therefore, research on improving the treatment outcome is a popular but difficult area of concern in neurosurgery and neuroscience; the exploration and use of preclinical PNI models thus remain necessary, and the selection of convenient and effective models that reflect the clinical reality of PNI is crucial to obtain the desired experimental results. Elucidating the capacity for and characteristics of nerve regeneration in these models is essential for further research on nerve regeneration.
At present, a variety of experimental animal models of PNI (represented by the sciatic nerve) have been developed, such as transection injury[4], crush injury[5, 6], traction injury[7, 8], freezing injury[9], and chemical injury[10]. Different injury models can simulate clinical problems in different situations. The most commonly used approaches in rodent models to model nerve injury in human patients are sciatic nerve transection and nerve crush, and both have well-established time courses of demyelination, immune cell influx, axonal regrowth, and remyelination[11]. These two injury models are undoubtedly more stable and representative[8, 12]. The crush injury model is characterized by a simple injury pattern that results in incomplete nerve damage, while the transection injury model is characterized by a consistent degree of damage that results in a more direct response to nerve regeneration after complete nerve dissection and reanastomosis, requiring specialized personnel and knowledge of microsurgical suturing techniques. However, what are the differences in nerve regeneration between the two injury models? What are the causes and manifestations of these differences? What is the relationship between the pathological process of nerve regeneration and its functional behavior? Further exploration is needed to address these questions.
The main objective of this study was to provide useful information for selecting the most appropriate PNI model for studying different nerve injury repair processes. To this end, two rat models of sciatic nerve injury, including nerve entrapment injury and nerve dissociation caused by trauma, were established, and the nerve regeneration capacity and characteristics in these models were compared. The aims of the study were to identify the key factors that may affect the rate of nerve regeneration after different types of nerve injury by evaluating the difference in the time to functional recovery after sciatic nerve injury in rats and to analyze the effects of the nerve regeneration rate, thereby providing a basis for nerve repair and clinical treatment.
-
Sixty male Sprague Dawley rats (3 months old, weighing 180–200 g) were provided by Beijing Vital River Laboratory Animal Technology Co., Ltd. The rats were housed in specific pathogen-free (SPF) cages under an artificial cycle of 12 h of light and 12 h of darkness. The experiment was approved by the Beijing Neurosurgical Institute Laboratory Animal Welfare and Ethics Committee.
The sixty rats were randomly divided into 2 groups with 30 rats in each group. Behavioral and histological tests were performed at the following 5 time points: before sciatic nerve injury (before), 7 days after sciatic nerve injury (day 7), 14 days after sciatic nerve injury (day 14), 21 days after sciatic nerve injury (day 21) and 28 days after sciatic nerve injury (day 28).
-
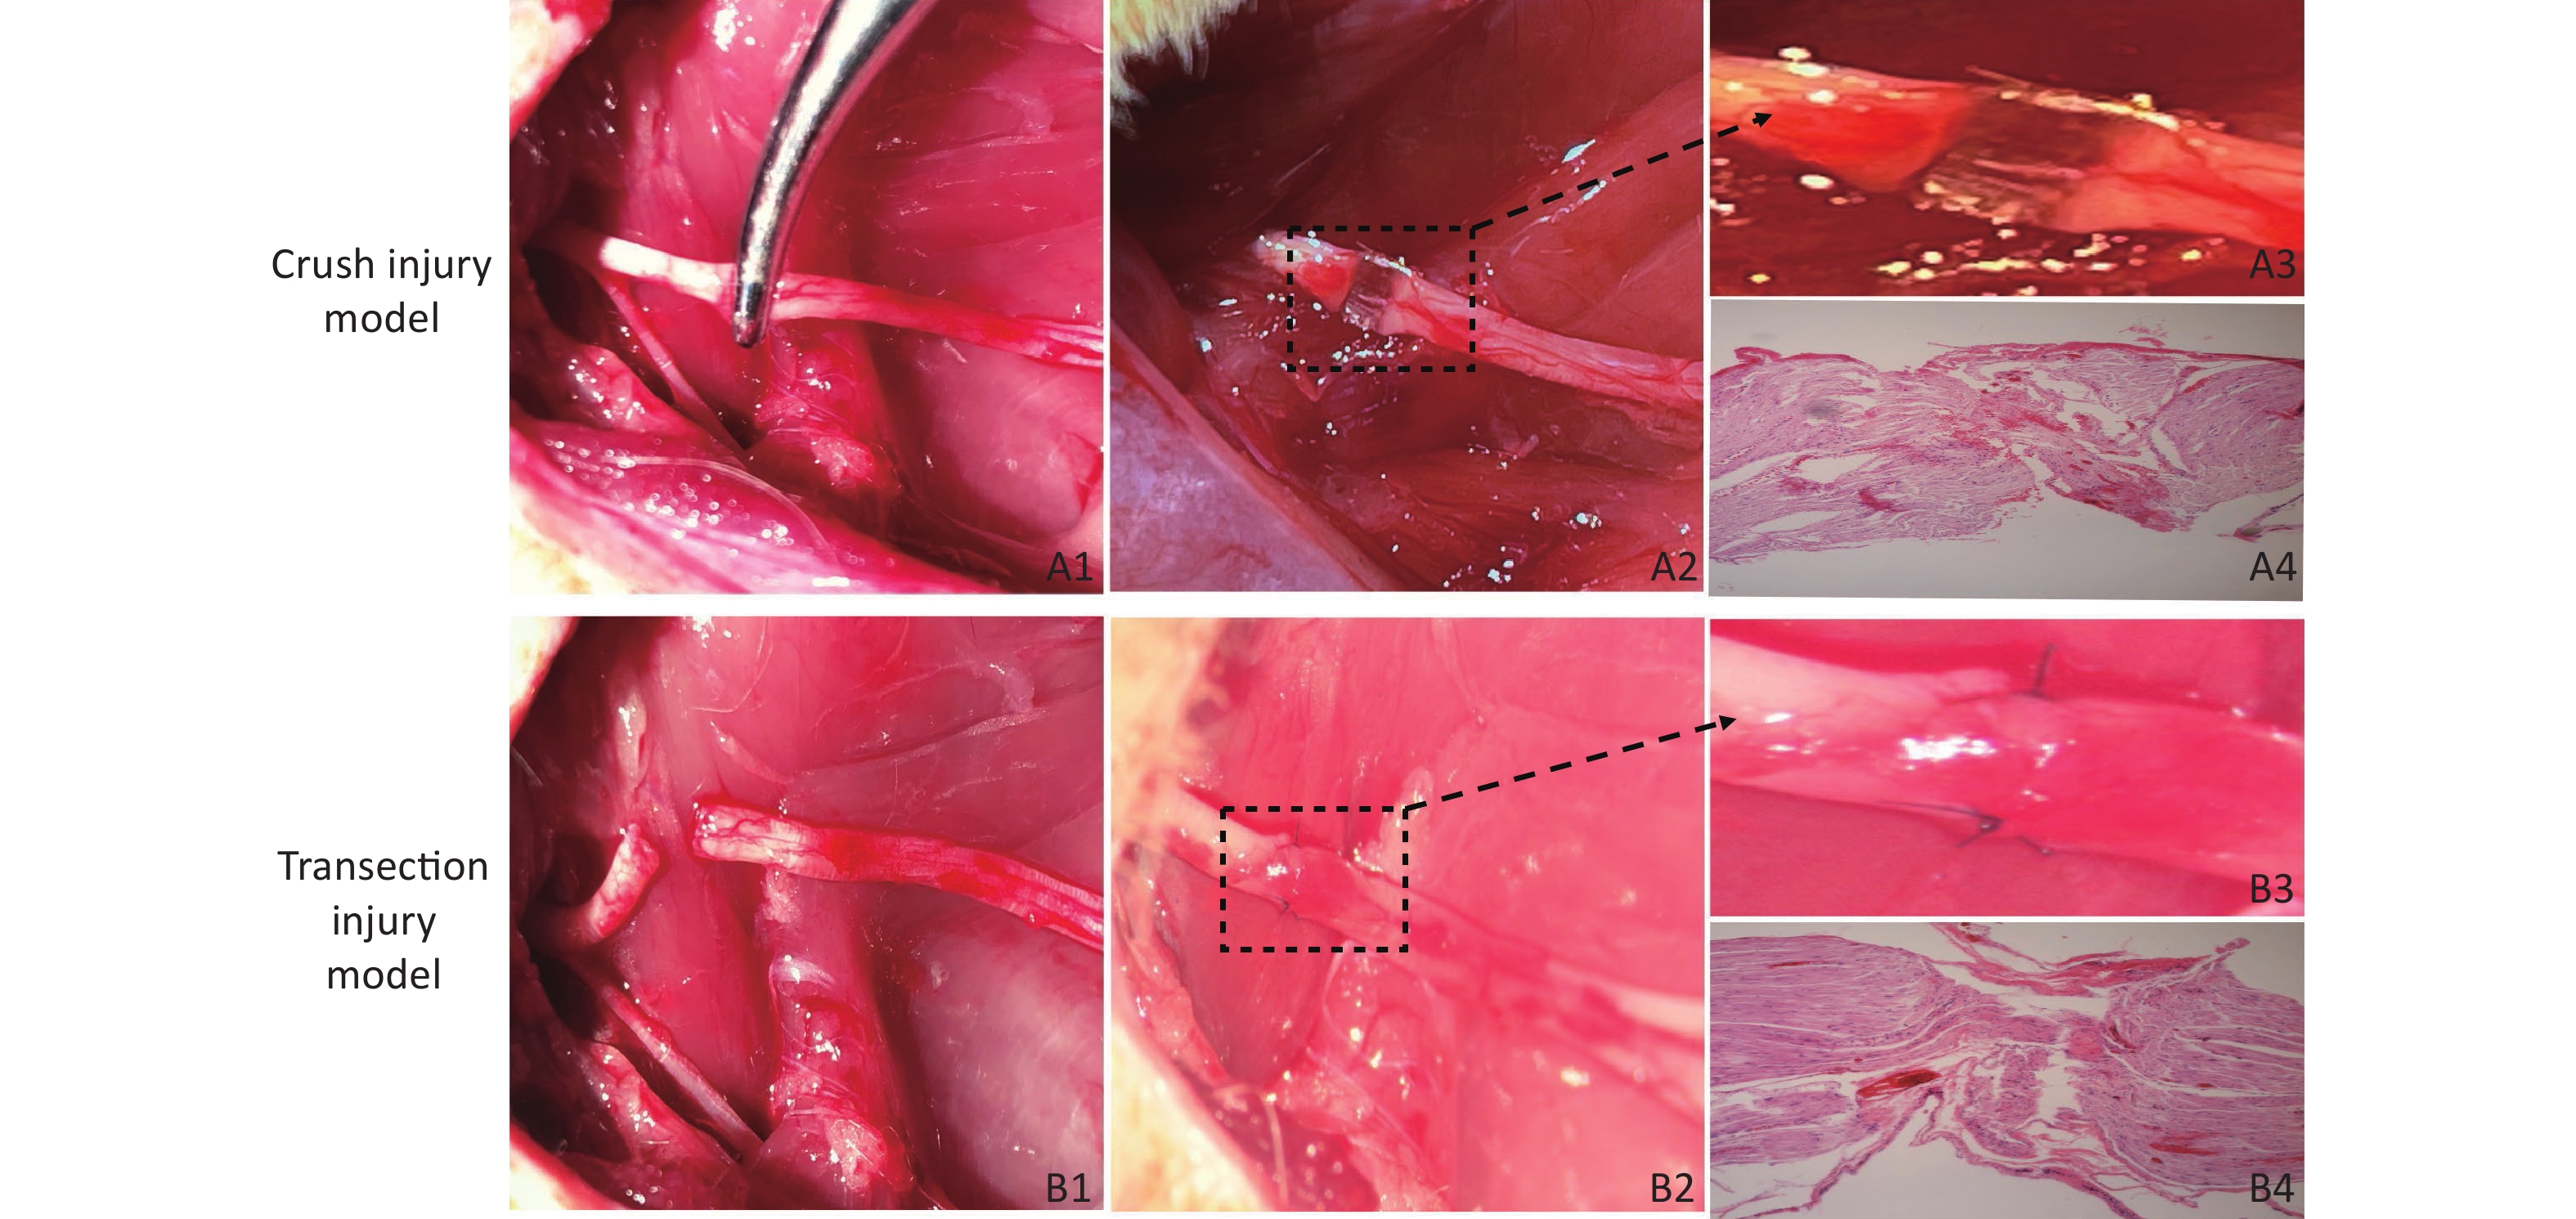
Crush Injury Model (Group A) Rats were anesthetized with isoflurane (induction: 4%, maintenance: 2%), and after an intraperitoneal injection of 10% chloral hydrate (0.3 mL/100 g), the rats were fixed on the operating table in the prone position. At a point 5 mm from the sciatic tubercle on the right hip of the rat, an incision was made along the sciatic nerve (SN) to separate the biceps femoris muscle and expose the SN. We used a 12.5-cm nonserrated clamp (JCZ210, JZ, China) to squeeze to the maximum compressible degree for three sequential 10 s periods, resulting in only the superficial epineurium being visible and with nerve fibers spaced nearly 1 mm apart, as shown in Figure 1A1 , A2, A3, which revealed the presence of collagen fibers in the epineural tissue via hematoxylin-eosin (H&E) staining (Figure 1A4), and then the injury site was marked with sutures. The surgical wound was closed with 4–0 nylon sutures, and the rats were returned to their cages.
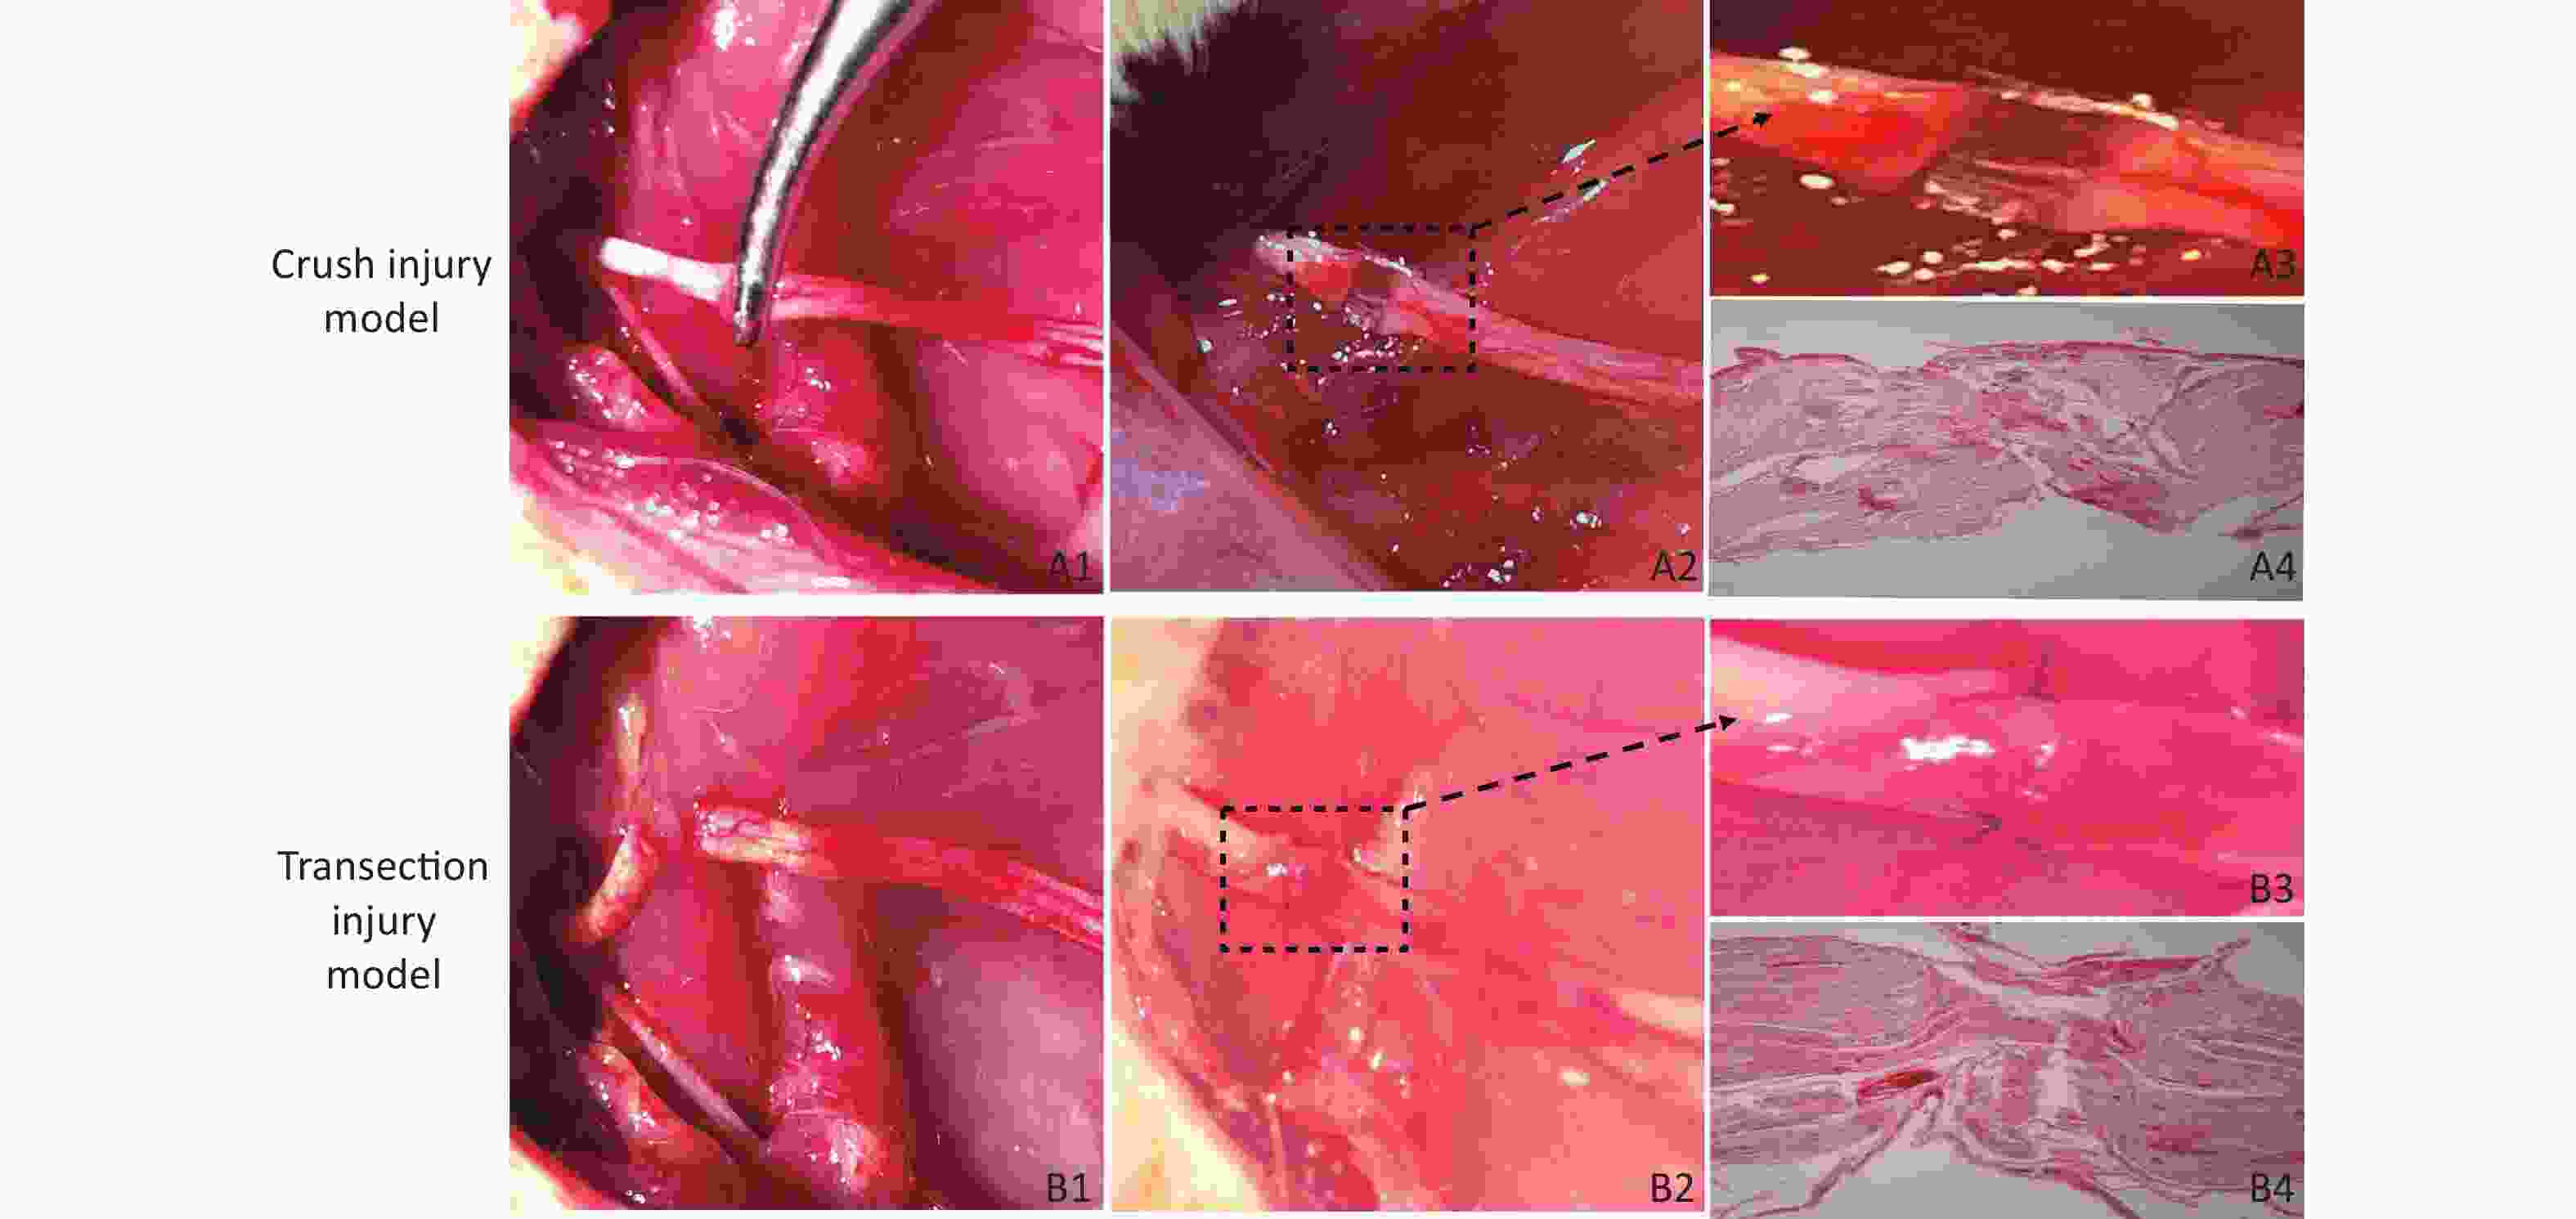
Figure 1. Establishment of the two models of sciatic nerve injury. (A1–A2) Representative images of the method used to establish the crush injury model. (A3) Enlarged view of the section marked in A2. (A4) The sciatic nerve tissue H&E staining of A3 revealed the presence of collagen fibers in the epineurium, magnification = 10x. (B1–B2) Representative images of the method used to establish the transection injury model. (B3) Enlarged view of the section marked in B2. (B4) The sciatic nerve tissue H&E staining of B3 revealed the structural damage and disorder of collagen fibers in the epineurium, magnification = 10x
Transection Injury Model (Group B) The right SN was completely exposed using a bulldog clamp, and then the nerve near the sciatic tubercle was sectioned. The nerve was sutured with 3 stitches using 10–0 nylon sutures immediately under a Leica operating microscope (Figure 1B1, B2, B3), which revealed structural damage and disorder of collagen fibers in the epineurium via H&E staining (Figure 1 B4), and the wound was closed with 4–0 nylon skin sutures.
-
CatWalk Analysis All the animals were placed into individual housing, and a 7-day training period was started for CatWalk gait analysis (MSI/DIG-IDF, USA,) using a glass runway with a white fluorescent tube that recorded the motion projection of the four paws[13]. During a 7-day period in which a 12 g/day food deprivation protocol was used for motivation, the animals were trained to make consecutive runs over the glass runway without hesitation. The following parameters were determined: the sciatic functional index (SFI), the hind limb stance width [the distance between the left hind (LH) and right hind (RH) paws measured perpendicular to the waking direction], the stance duration (the duration of contact of the hind paw with the glass floor), and the swing duration (the duration for which the hind paw was not in contact with the glass floor). The purpose of this experiment was to evaluate the magnitude and extent of dynamic and static gait changes after sciatic nerve injury in adult rats, which may involve not only the animal’s motor control but also the degree of neuropathic pain.
-
The degree of myoatrophy and recovery of the target muscle are effective indicators of nerve innervation. After obtaining electrophysiological recordings at different times relative to the sciatic nerve injury, the fresh bilateral gastrocnemius muscles were obtained, and the surface connective tissue was removed. The blood on the surface of the muscles was dried with filter paper; then, the muscles were placed on a drug balance rack plate to determine their wet weights. The wet weight ratio of the gastrocnemius was calculated as the weight of the muscle from the ipsilateral leg (with the injured nerve) to that of the contralateral leg (without the injured nerve). After weighing, the muscles were fixed with paraformaldehyde, and 10 µm transverse paraffin sections were obtained for routine H&E staining to show the outline of the myofibers.
-
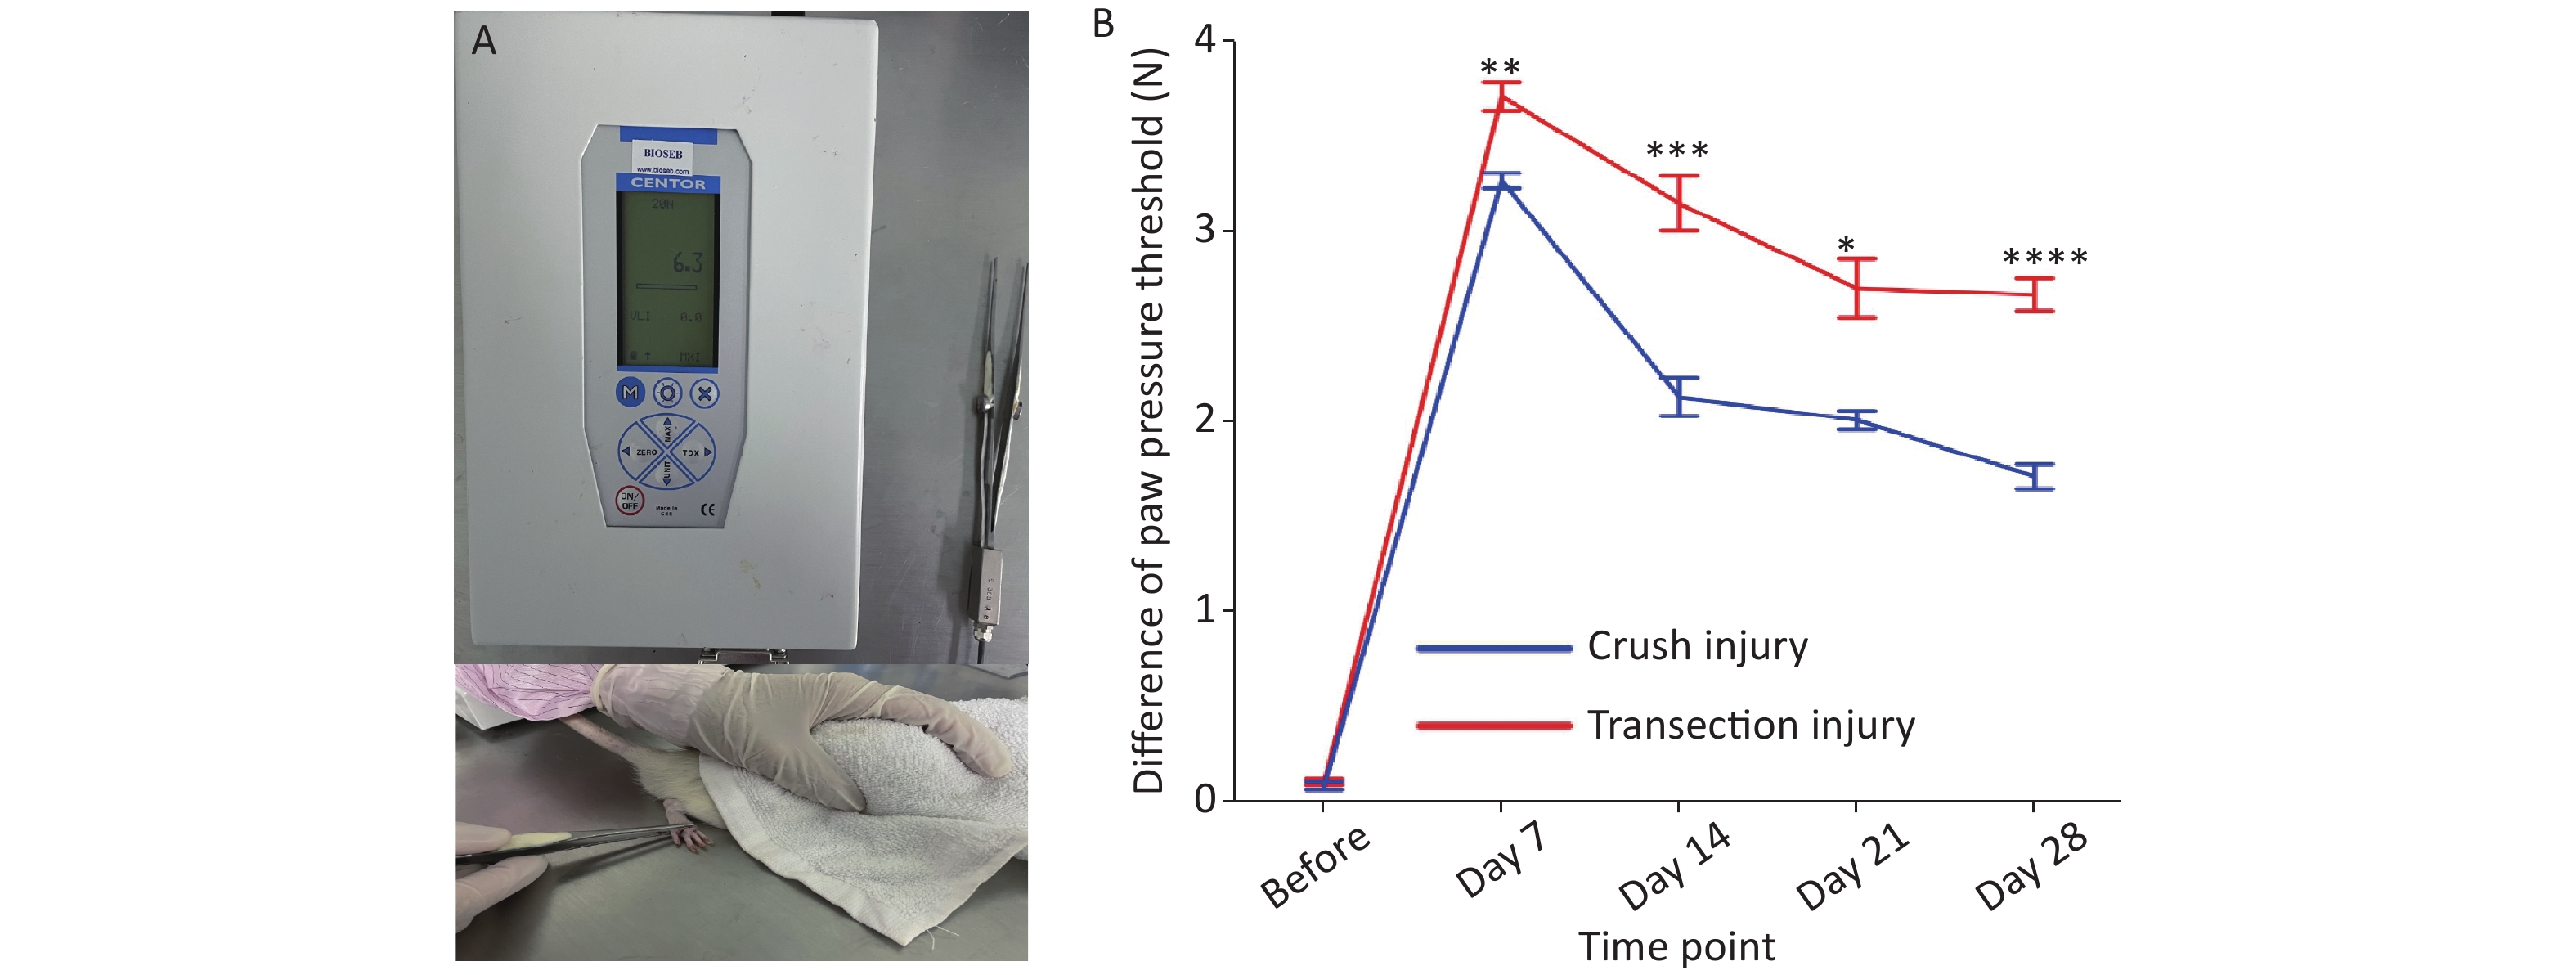
The calibrated forceps (developed and supplied by Bioseb) consisted of a pair of large blunt pliers (15 cm long; flat contact area; 7 mm x 1.5 mm, smooth edges) equipped with 2 strain gauges connected to an improved electronic dynamometer. The test rats were placed on a bench with a towel over their eyes to limit the effects of environmental stimulation. The tip of the forceps was placed around the hind paw, applying the same length each time. Then, the applied force was increased by hand at a rate of approximately 2 N every 3 s until the claw retracted[14]. The maximum force applied did not exceed 10 N, as this could cause unnecessary damage to the paws. The difference between the pressure thresholds on the two sides was measured three times, and the average was taken as the final value.
-
All rats were tested in a quiet, electromagnetic interference-free testing room, and anesthetized with isoflurane (induction: 4%, maintenance: 2%). The compound muscle action potential (cMAP) was recorded from the right gastrocnemius muscle while the proximal SN was electrically stimulated using a CareFusion-Synergy (Middleton, WI, USA) electromyogram to evaluate its functional reinnervation. The stimulation (0.2 ms, 1 mA) was delivered on the surface of the proximal side of the injured sciatic nerve through two electrodes (0.2 mm diameter), and the recording electrodes (0.2 mm diameter) were inserted into the gastrocnemius muscle, using a 45 degree insertion with a depth of approximately 5 mm, and the ground electrode was inserted into subcutaneously into the back. The parameters were set as follows: bandpass filter 10 Hz to 10 kHz, and electrical resistance < 4 kΩ. The amplitude and latency components were measured using Synergy Version 20.0 software (CareFusion 209, Inc, USA). The latency time reflects the remyelination level, and the amplitude of the cMAP is proportional to the number of axons in the conducting nerve and was measured from the recorded signal.
-
The neural tracer CTB-Alexa 555 (Molecular Probes, Eugene, Oregon, USA) was used to retrogradely label axons from the lumbar enlargement of the spinal cord to the paralyzed gastrocnemius muscles to assess axon regrowth. At the 4 time points after injury, 5 rats were randomly selected from each group for retrograde labeling. The rats were anesthetized with isoflurane, and 10 μL of 1% CTB-Alexa 555 solution was injected at multiple points into the right gastrocnemius using a 10-μL Hamilton syringe. After the rats recovered consciousness, they were returned to their cages. Five days later, the rats were euthanized with isoflurane (induction: 5%) and 10% chloral hydrate (6 mL/100 g) and underwent intracardiac perfusion with 300 mL of phosphate-buffered saline (0.1 mol/L, pH 7.2) followed by 200 mL of 4% paraformaldehyde (PFA) solution for 3 h. The samples were then dissected and successively cryopreserved in 20%, 30%, and 40% sucrose at 4 °C. All specimens were immersed in optimal sectioning temperature (OCT) compound and then cross-sectioned at a thickness of 30 μm on a cryostat. The labeled motor neurons in the spinal cord were identified and quantified under a fluorescence microscope (Nikon Diaphot, Japan).
-
A 5-mm distal segment of the injured SN was removed, fixed in 3.6% glutaraldehyde solution for 3 h, washed three times with phosphate-buffered saline (PBS, 0.1 mol/L, pH 7.0) for 10 minutes, postfixed with osmium tetroxide and embedded in Epon. Semithin (0.35 μm) and ultrathin (0.07 µm) cross-sections were obtained using an ultramicrotome (Reichert Ultrasection S Wild M3z, Leica Microsystems) and stained with thionin or uranyl acetate and lead citrate. The semithin sections were examined under an optical microscope, and the number of regenerated axons was counted using an Aperio imagesope (Leica). The ultrathin sections were analyzed with a Hitachi S520 electron microscope and used to quantitatively assess the morphology of the myelinated sciatic nerve fibers. All evaluations were performed by researchers who were blinded to the details of the study.
-
The data are all presented as the mean ± standard error of the mean (SEM). GraphPad Prism 9.0 (USA) was used for statistical analysis. All data were tested for normality and lognormality test. Repeated-measures analysis of variance (two-way repeated-measures ANOVA) was used to compare the functional and pathological tests in different injury groups. Intergroup differences were analyzed by performing Bonferroni post hoc tests. P values ≤ 0.05 were considered statistically significant (****, P ≤ 0.0001; ***, P ≤ 0.001; **, P ≤ 0.01; *, P ≤ 0.05).
-
During the follow-up period, no rats suffered complications from either surgery or routine treatments based on our observations of their physical status and activities in their home cages. The surgical wounds healed well.
-
The motion projection of the four paws was obtained through fluorescence photography of the track (Figure 2A–C) and then gait analysis was performed by software (DigiGaitTM Imaging analysis software 10.0, USA). For the SFI, two-way repeated-measures ANOVA revealed a significant interaction of time and injury mode (F4,31 = 4.279, P < 0.01). The statistical post hoc test, before injury and days 7 and 14 after injury showed that the differences between group A and group B were not significant (before: –5.63 ± 2.36 vs. –4.32 ± 1.71; day 7: –47.34 ± 7.99 vs. –49.67 ± 5.00; day 14: –45.95 ± 7.83 vs. –44.6 ± 7.34). After 14 days, significant differences began to appear between the two groups, and the recovery of the SFI in group A was significantly higher than that in group B (day 21: –30.87 ± 2.49 vs. –44.06 ± 4.79, P < 0.01; day 28: –24.19 ± 2.66 vs. –36.94 ± 5.36, P < 0.01) (Figure 2D). For the hind stance width, on day 28 after injury, group B had significantly greater values than group A (day 28: 37.25 ± 1.48 vs. 33.5 ± 2.06, P < 0.05); however, at day 14, the hind stance width in group B was observably narrow, which may reflect a significant brief recovery (40.8 ± 1.17 vs. 30.0 ± 1.62, P < 0.0001) (Figure 2E). For the stance duration and swing duration, after 14 days, group B had a much slower rate of behavioral recovery in sensory control and pain perception than group A, but there were no obvious differences between the two groups at each time point, except on day 21 for the stance duration (0.78 ± 0.04 vs. 0.75 ± 0.09, P < 0.05) (Figure 2F, G).
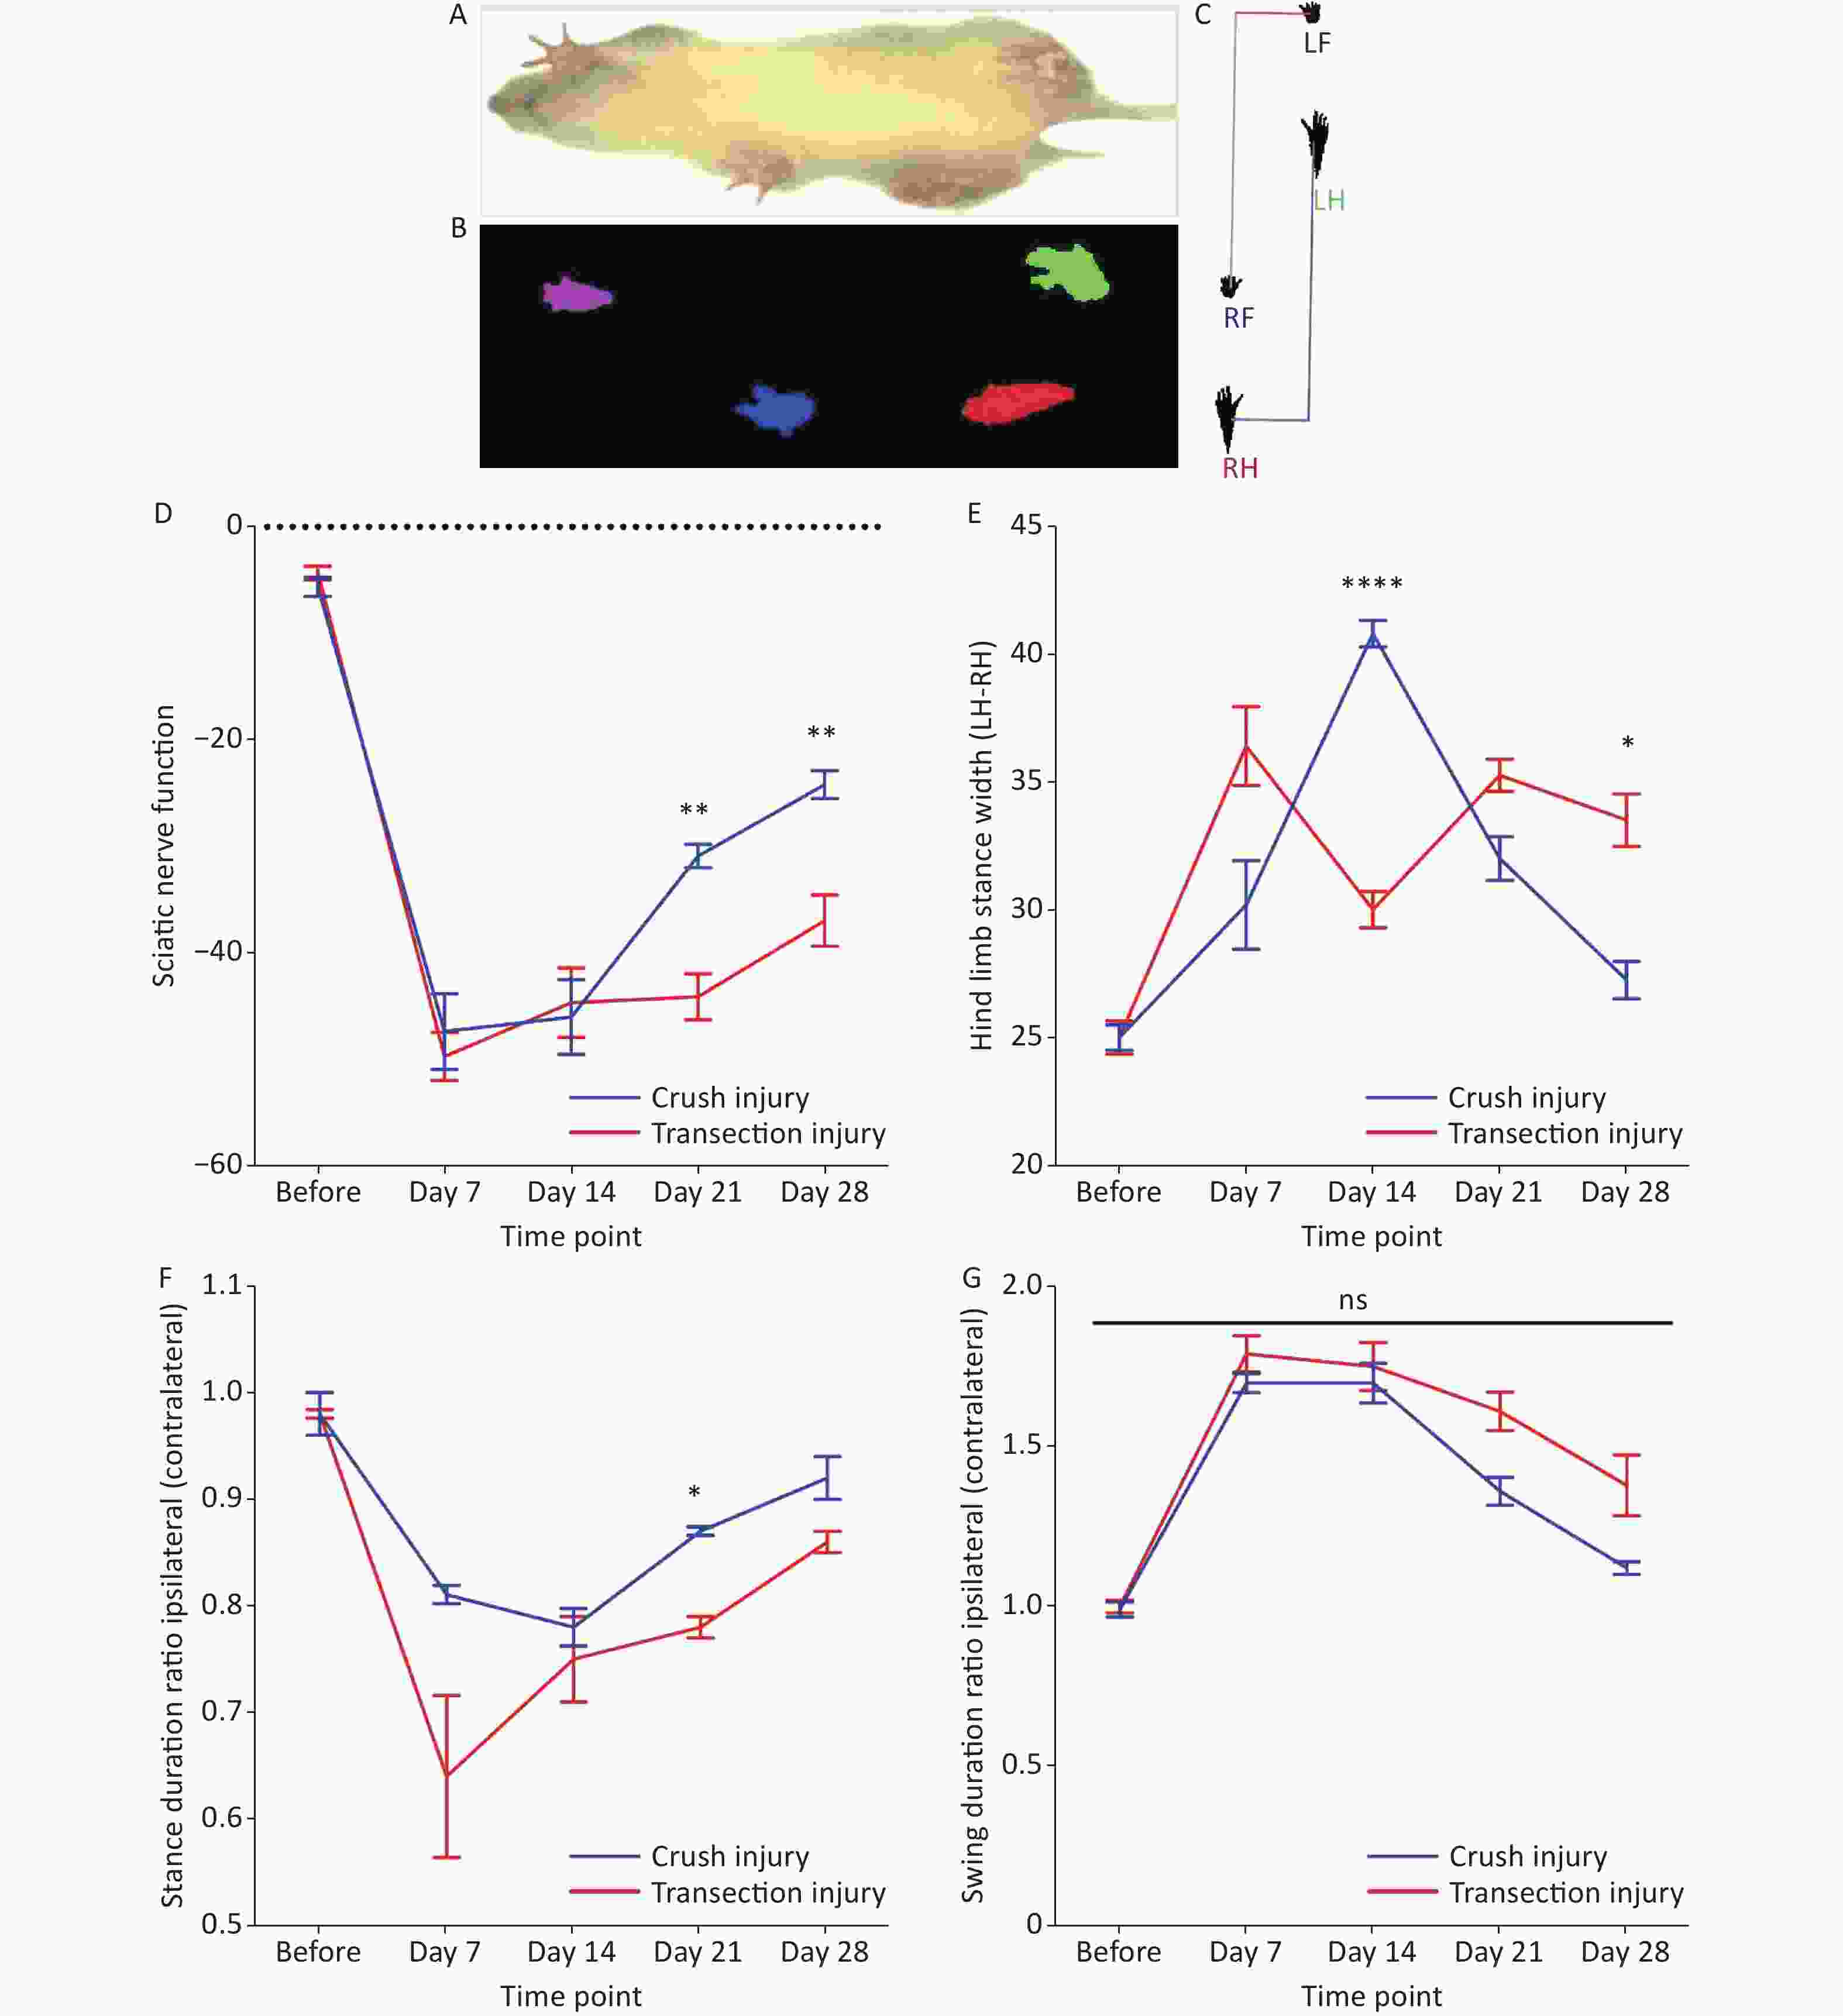
Figure 2. Evaluation of the magnitude and extent of dynamic and static gait changes before and after sciatic nerve injury in adult rats. (A–C) Representative diagram of rat gait under fluorescence photography of the track. (D) The sciatic nerve function index at different times; two-way repeated-measures ANOVA: F4,31 = 4.279, P < 0.01; day 21, P < 0.01; day 28, P < 0.01. (E) Hind limb stance width; two-way repeated-measures ANOVA: F4,36 = 21.58 P < 0.0001; day 14, P < 0.0001; day 28, P < 0.05. (F) Stance duration ratio between the ipsilateral and contralateral sides; two-way repeated-measures ANOVA: F4,33 = 2.893, P < 0.05; day 21, P < 0.05. (G) Swing duration ratio between the ipsilateral and contralateral sides; two-way repeated-measures ANOVA: F4,33 = 2.081, P = 0.1. *Represents the post hoc test comparing the two groups at the same time point.
-
We measured the differences in the pressure threshold for the hind paw at different times using calibrated forceps for the two injury modes (Figure 3A). Two-way repeated-measures ANOVA revealed a significant interaction of time and injury mode (F4,61 = 11.01, P < 0.0001). Before the injury, the mean difference in the pressure threshold of the two groups was approximately 0.1 N. From 7 to 14 days, the recovery rate of group A was higher than that of group B (day 7: 3.27 ± 0.13 N vs. 3.71 ± 0.25 N, P < 0.01; day 14: 2.13 ± 0.32 N vs. 3.15 ± 0.46 N, P < 0.001). After 14 days, the recovery rate of group B increased and then stabilized to a certain extent, but the overall pressure threshold was greater than that of group A; overall, the degree of sensory recovery in group B was worse than that in group A (day 21: 2.01 ± 0.15 N vs. 2.7 ± 0.45 N, P < 0.05; day 28: 1.17 ± 0.18 N vs. 2.67 ± 0.22 N, P < 0.0001) (Figure 3B).
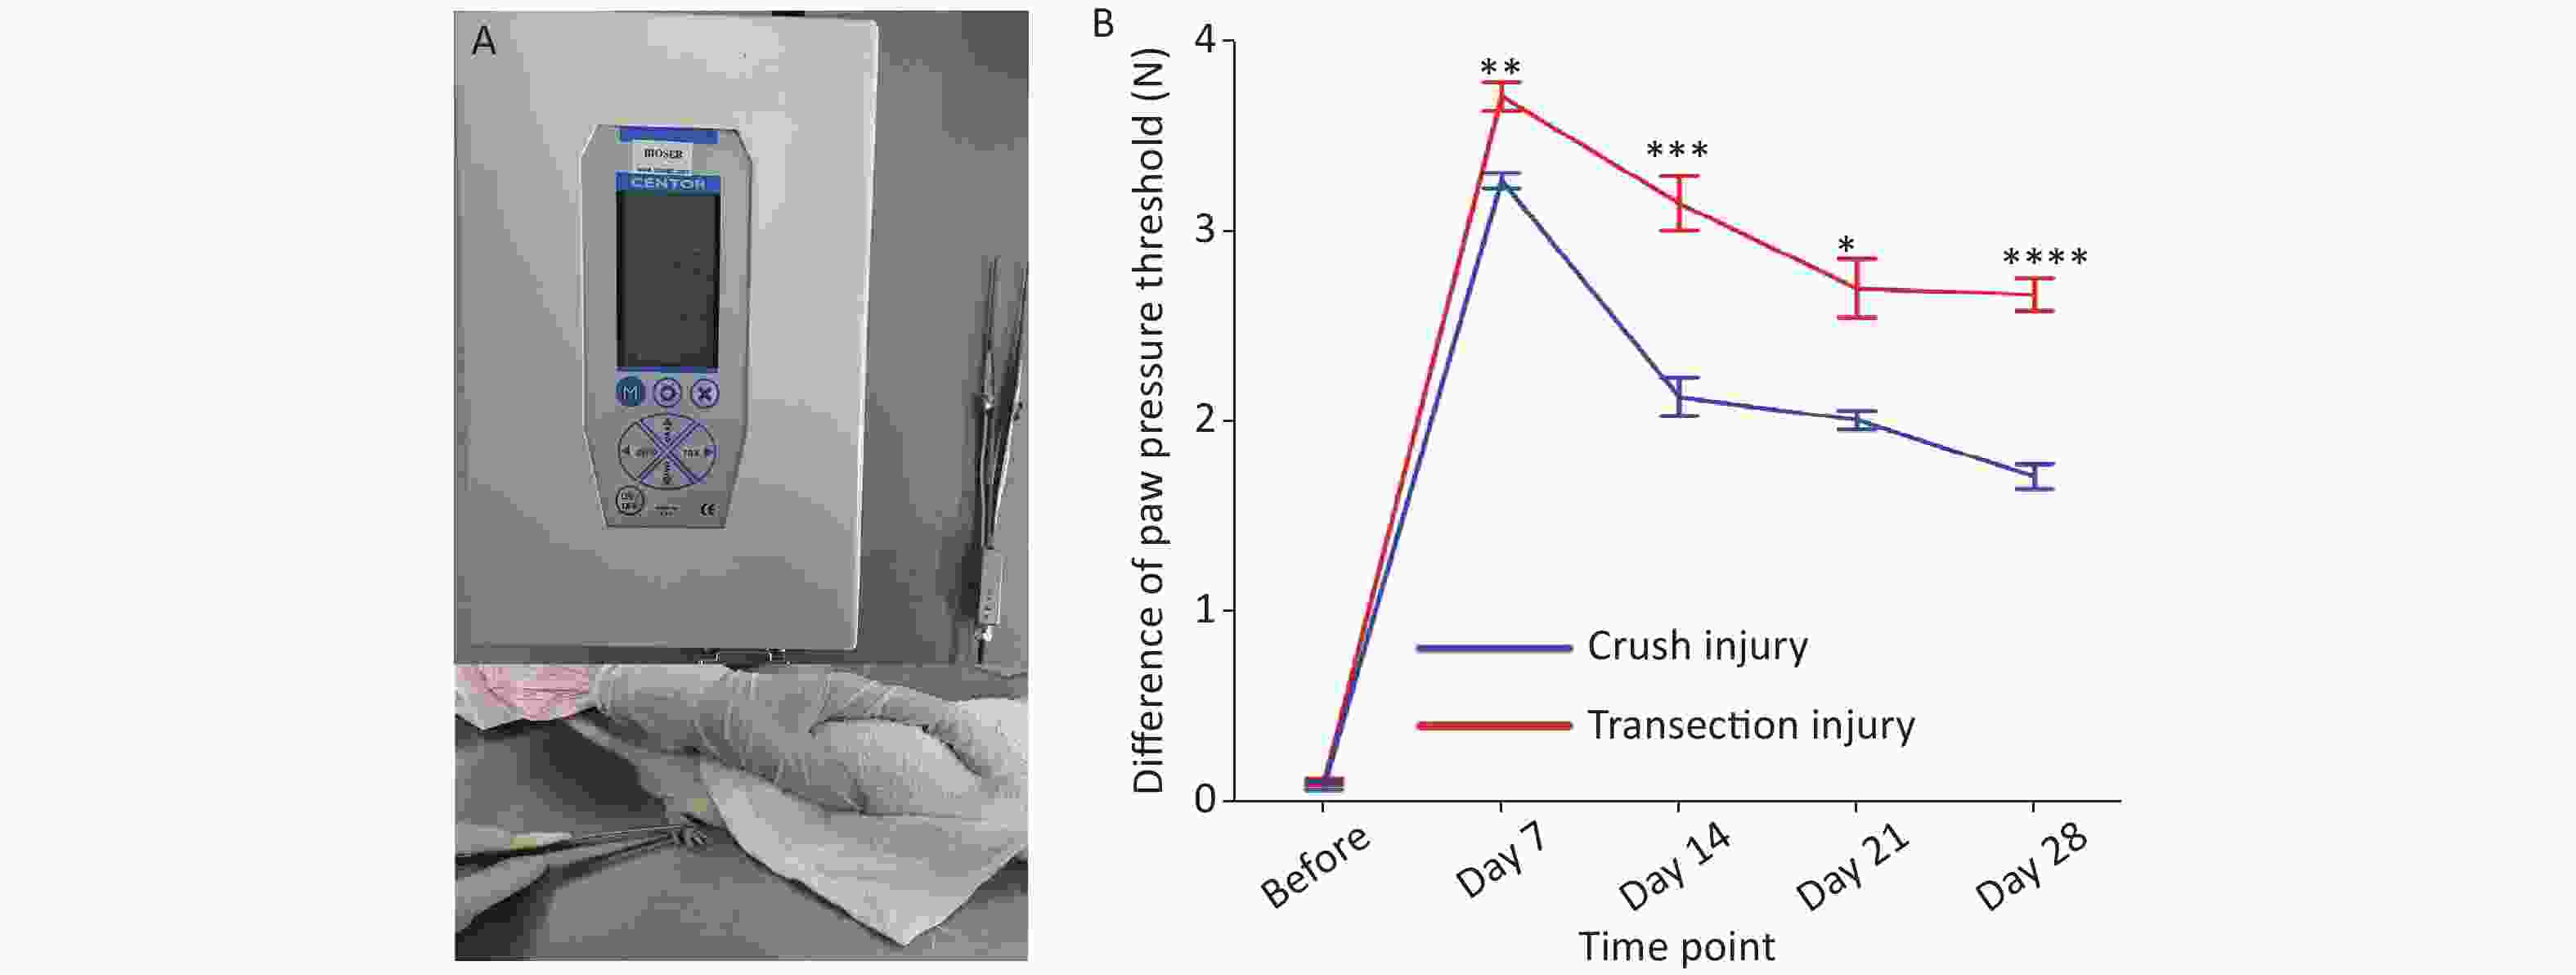
Figure 3. Evaluation of the pressure threshold for the hind paw. (A) Calibrated forceps and measurement technique. (B) Pressure threshold trend over time; two-way repeated-measures ANOVA: F4,61 = 11.01, P < 0.0001; day 7, P < 0.01; day 14, P < 0.001; day 21, P < 0.05; day 28, P < 0.0001. *Represents the post hoc test comparing the two groups at the same time point.
-
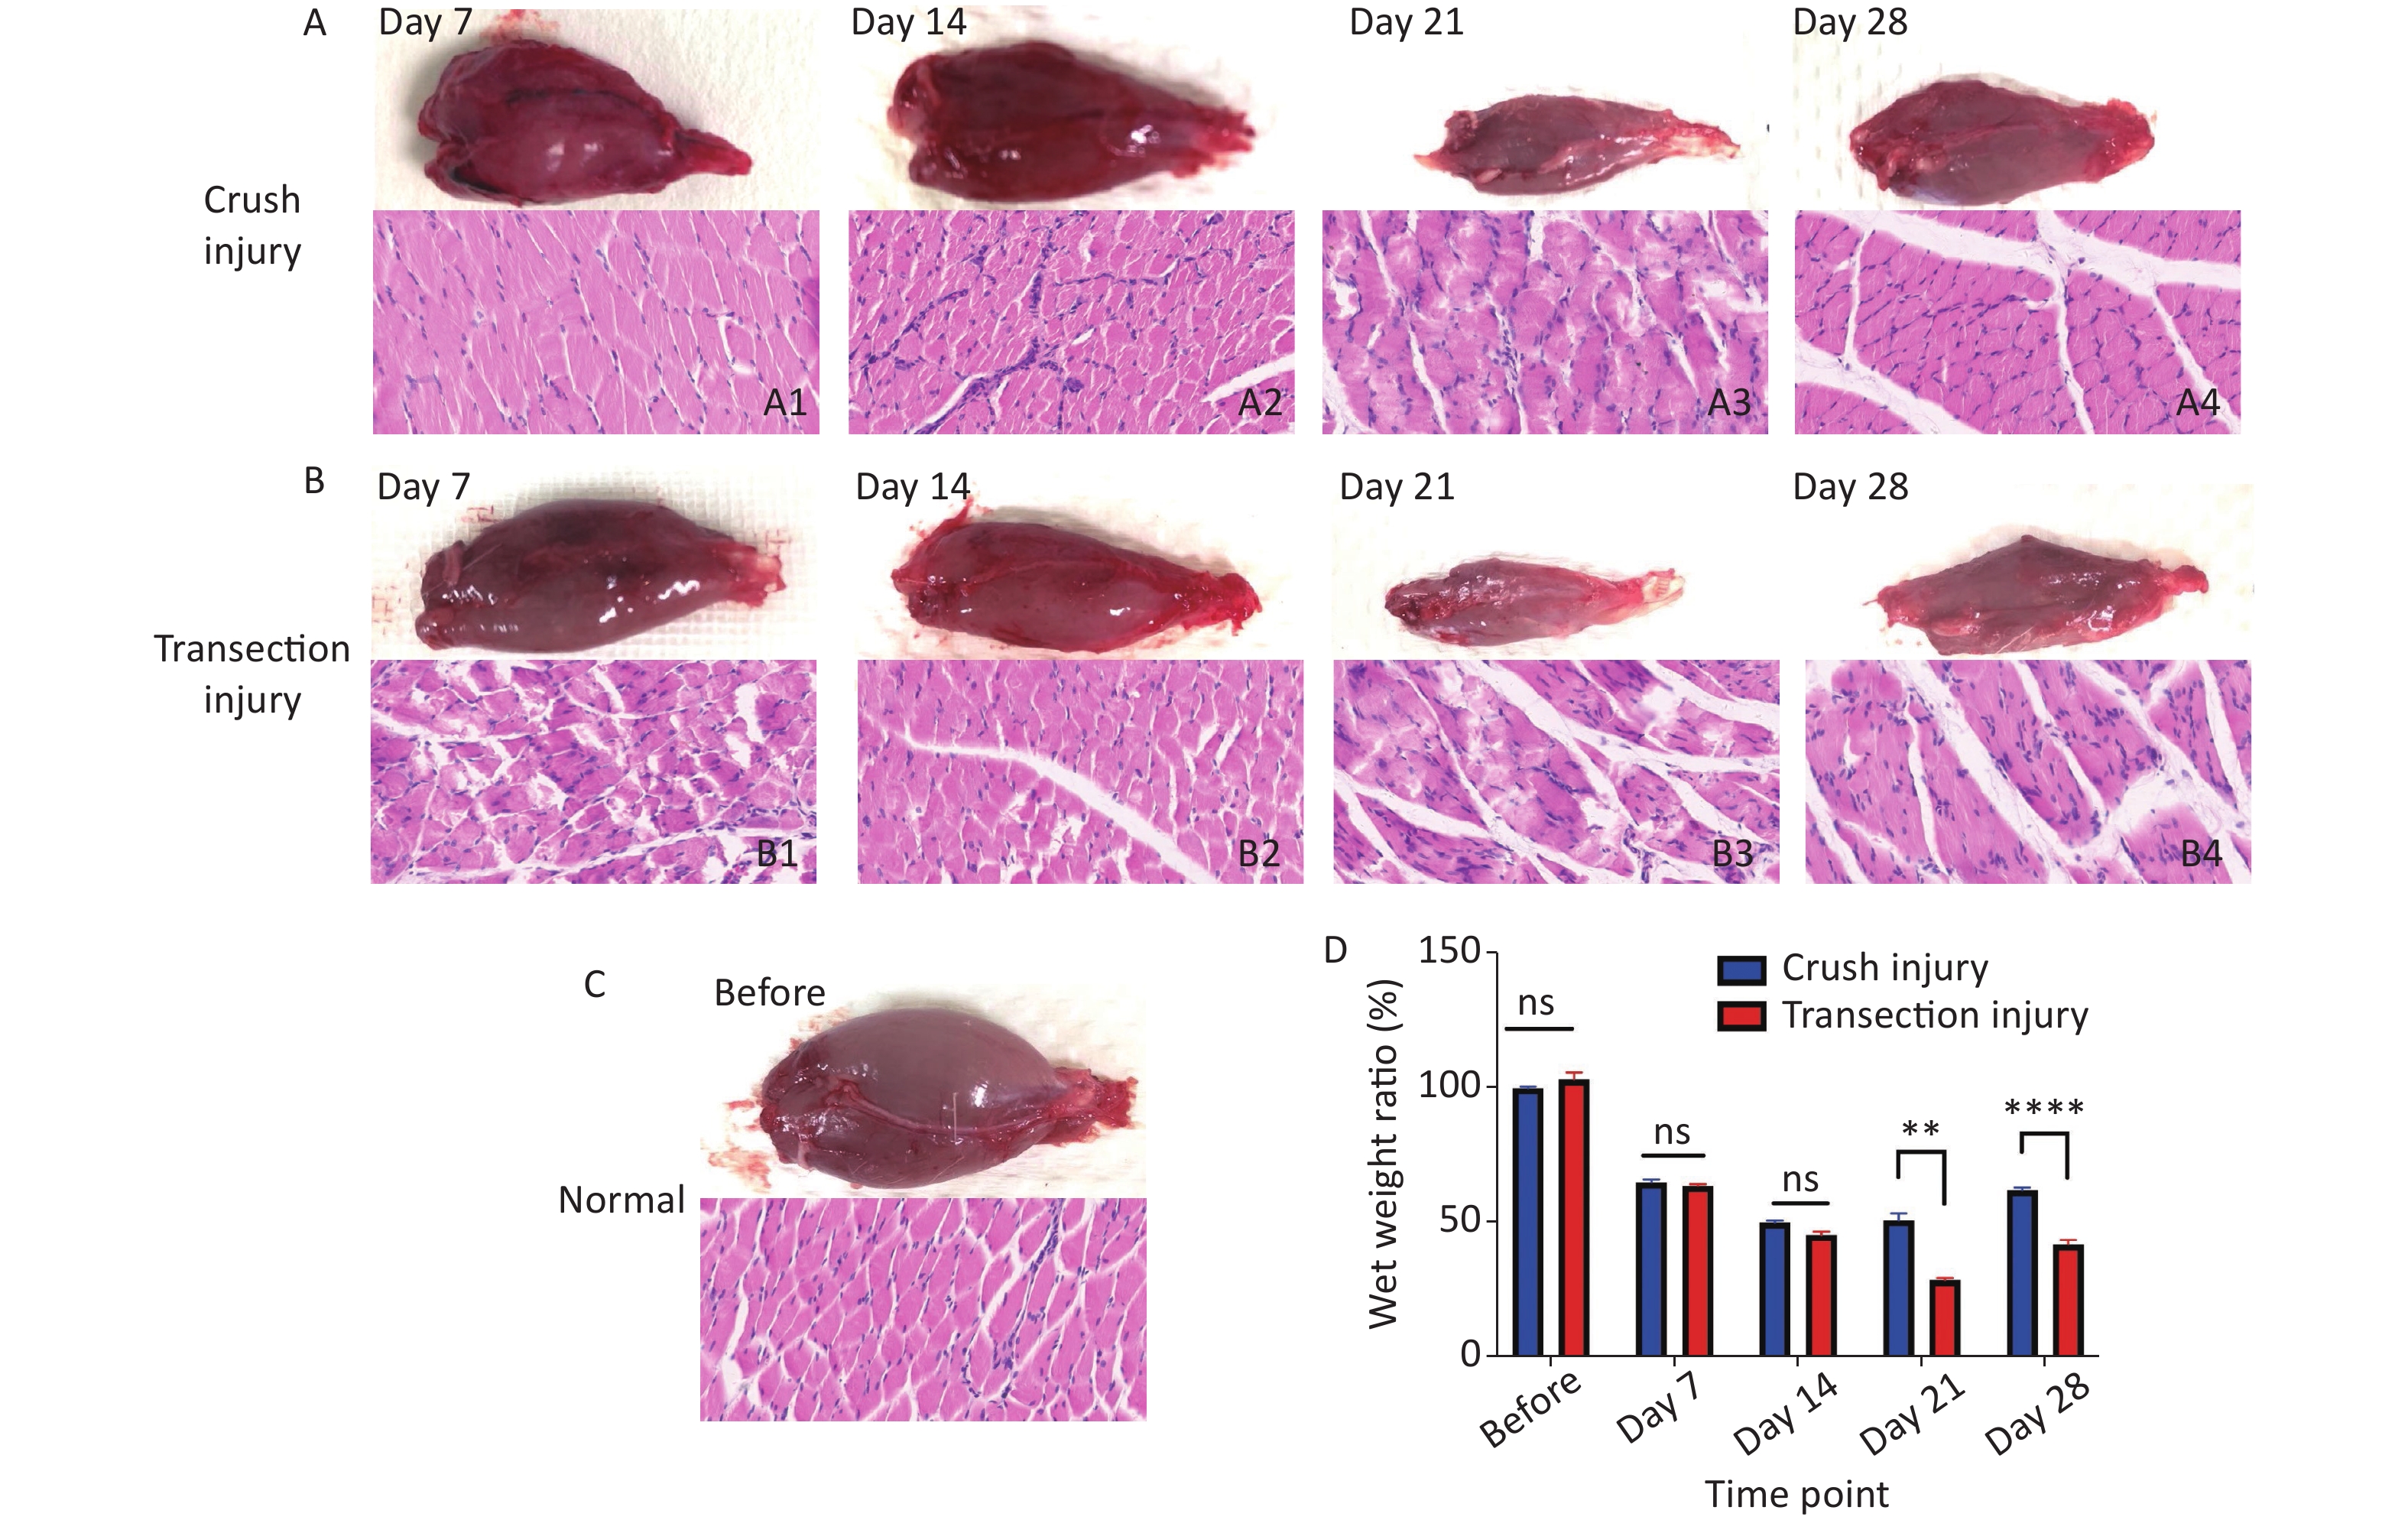
The morphology and function of the target muscle are reliable parameters for assessing nerve regeneration. In this study, H&E staining was used to reflect the form of the gastrocnemius; after sciatic nerve injury, the muscle begins to atrophy, and the muscle fiber structure gradually collapses. After 21 days, group B exhibited significant muscle fiber disintegration; the wet weight ratio of the gastrocnemius was significantly lower than that of group A (50.63 ± 6.3 vs. 28.43 ± 1.76, P < 0.01). From day 21 to day 28, the target muscle of the two groups exhibited obvious nerve regeneration (61.80 ± 2.52 vs. 41.71 ± 4.04, P < 0.0001) (Figure 4).
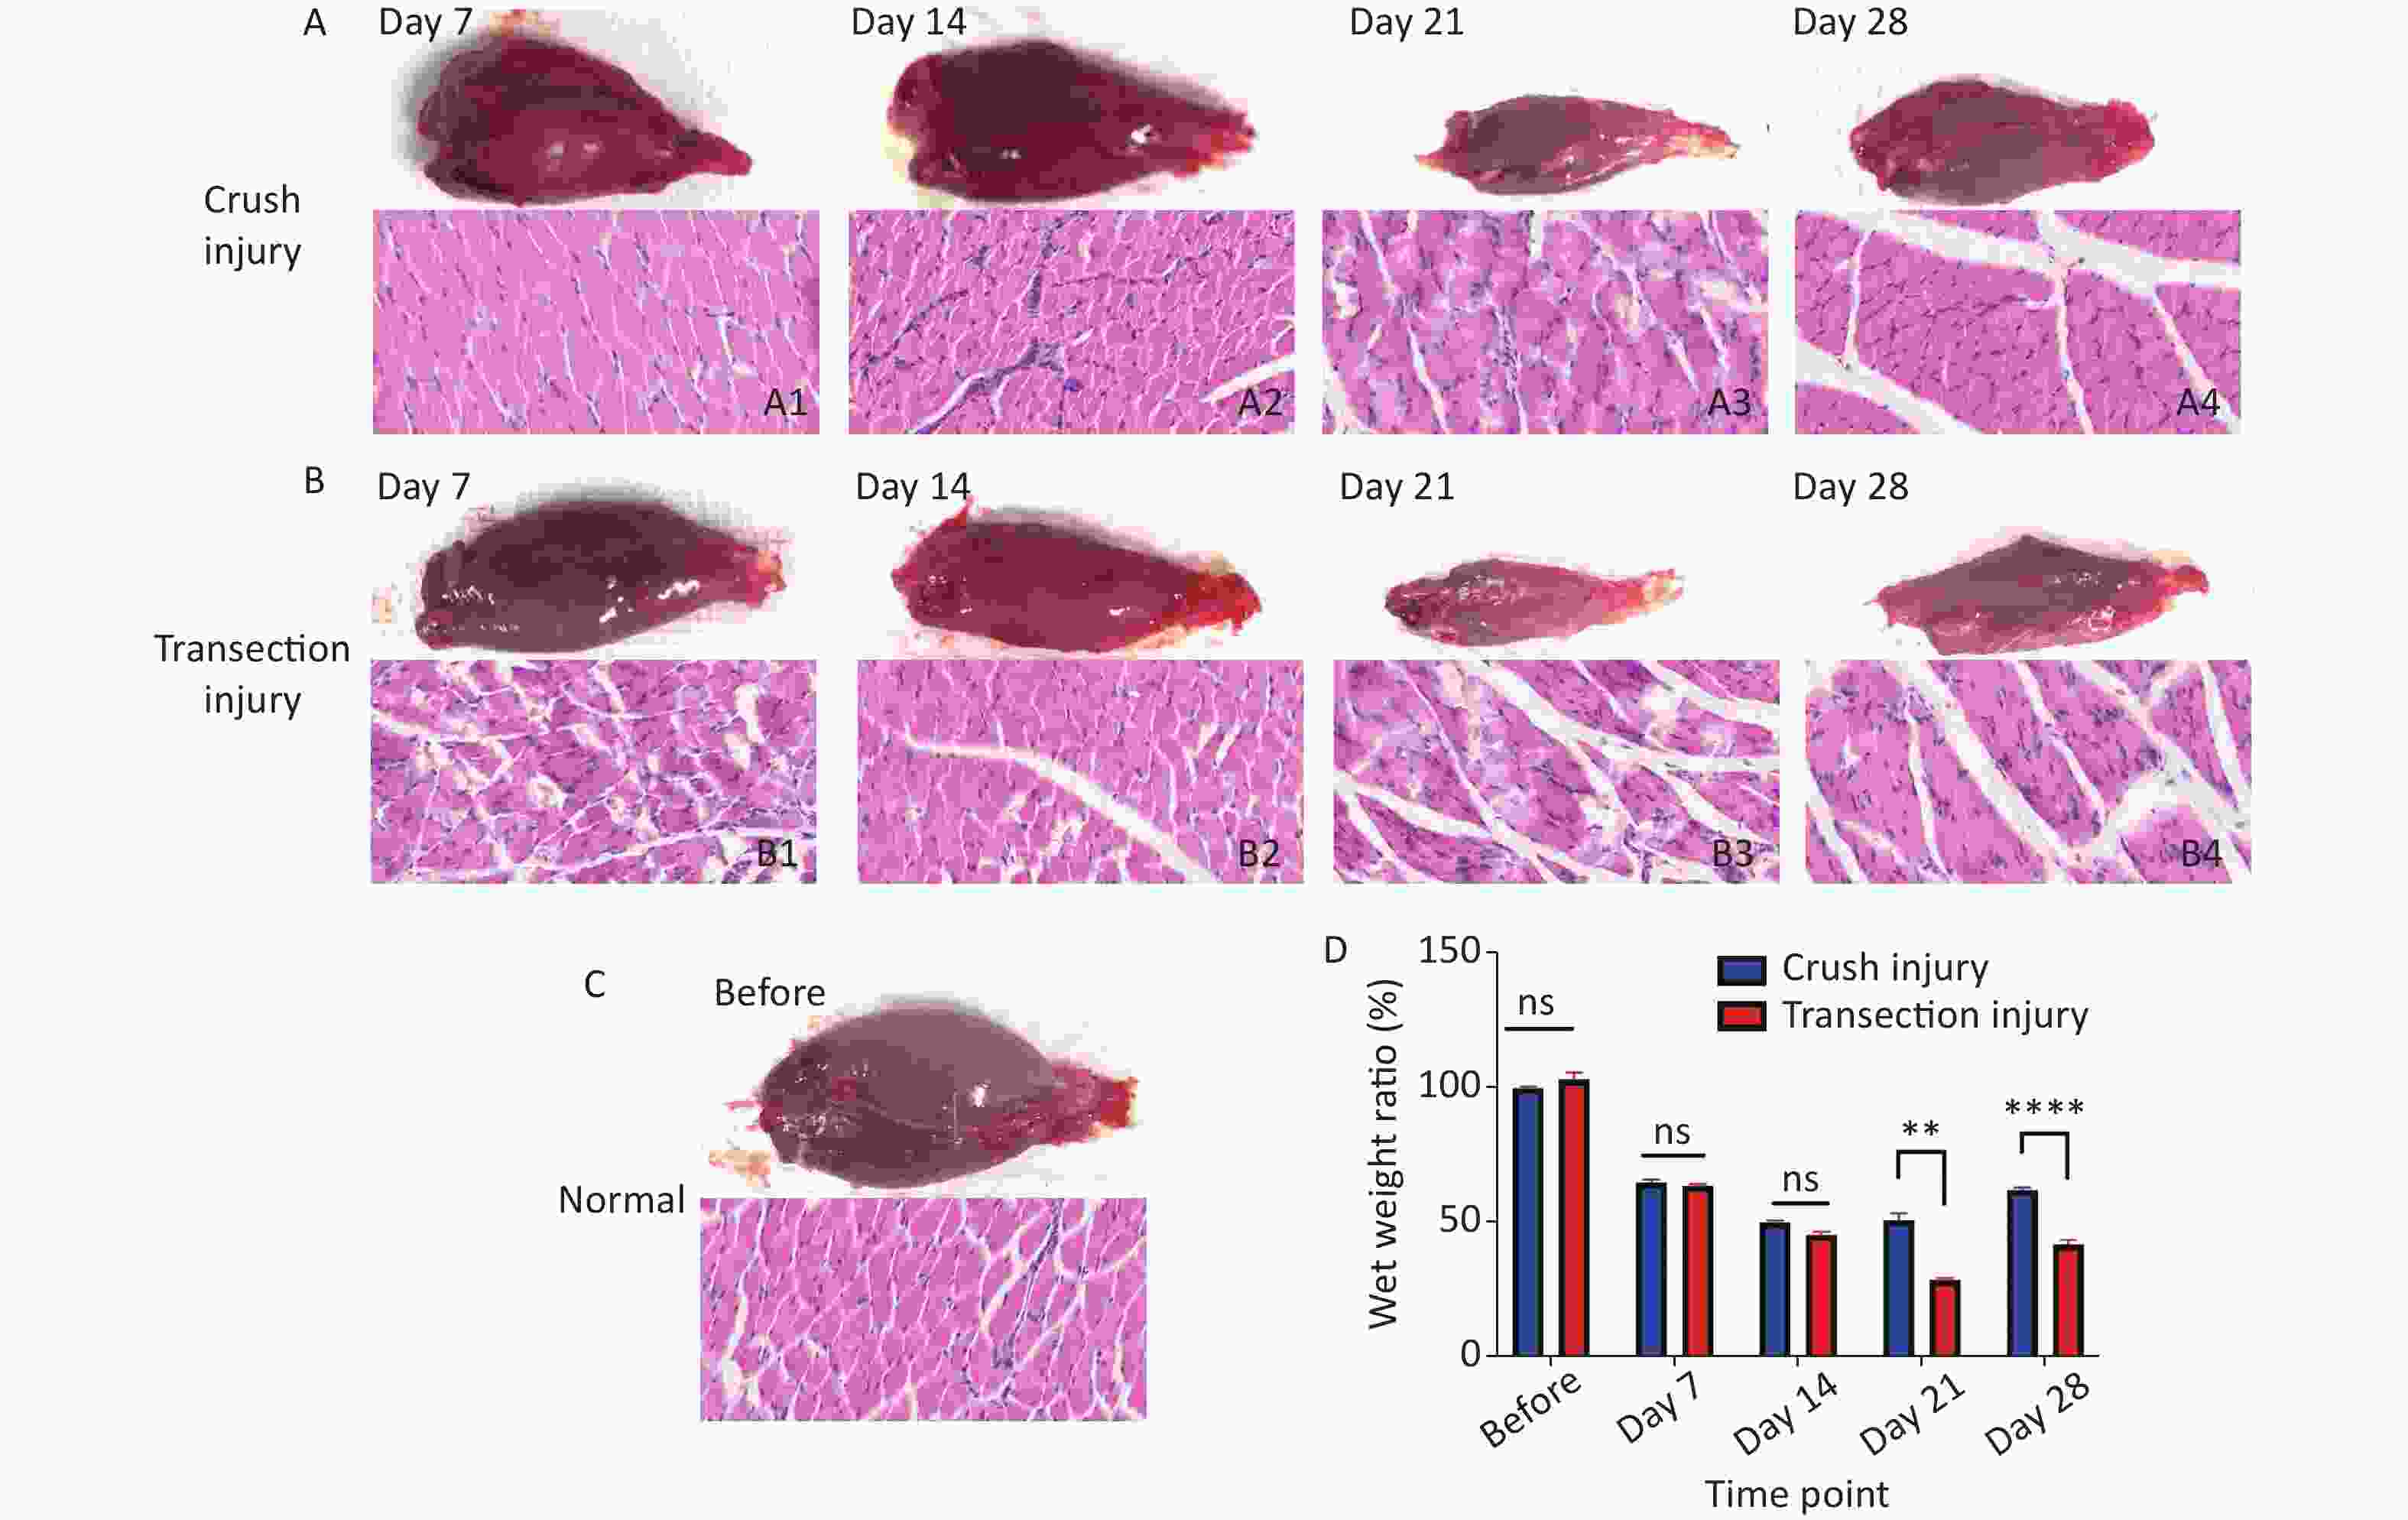
Figure 4. Morphology of the gastrocnemius. (A1–A4) Morphology and H&E staining of the gastrocnemius muscle 7, 14, 21 and 28 days after sciatic nerve injury in group A, bar = 20 µm. (B1–B4) Morphology and H&E staining of the gastrocnemius muscle 7, 14, 21 and 28 days after sciatic nerve injury in group B, bar = 20 µm. (C) Normal morphology of the gastrocnemius. (D) Wet weight ratio between the ipsilateral and contralateral muscles; two-way repeated-measures ANOVA: F4,50 = 24.73, P < 0.0001; day 21, P < 0.01; day 28, P < 0.0001. *Represents the post hoc test comparing the two groups at the same time point.
-
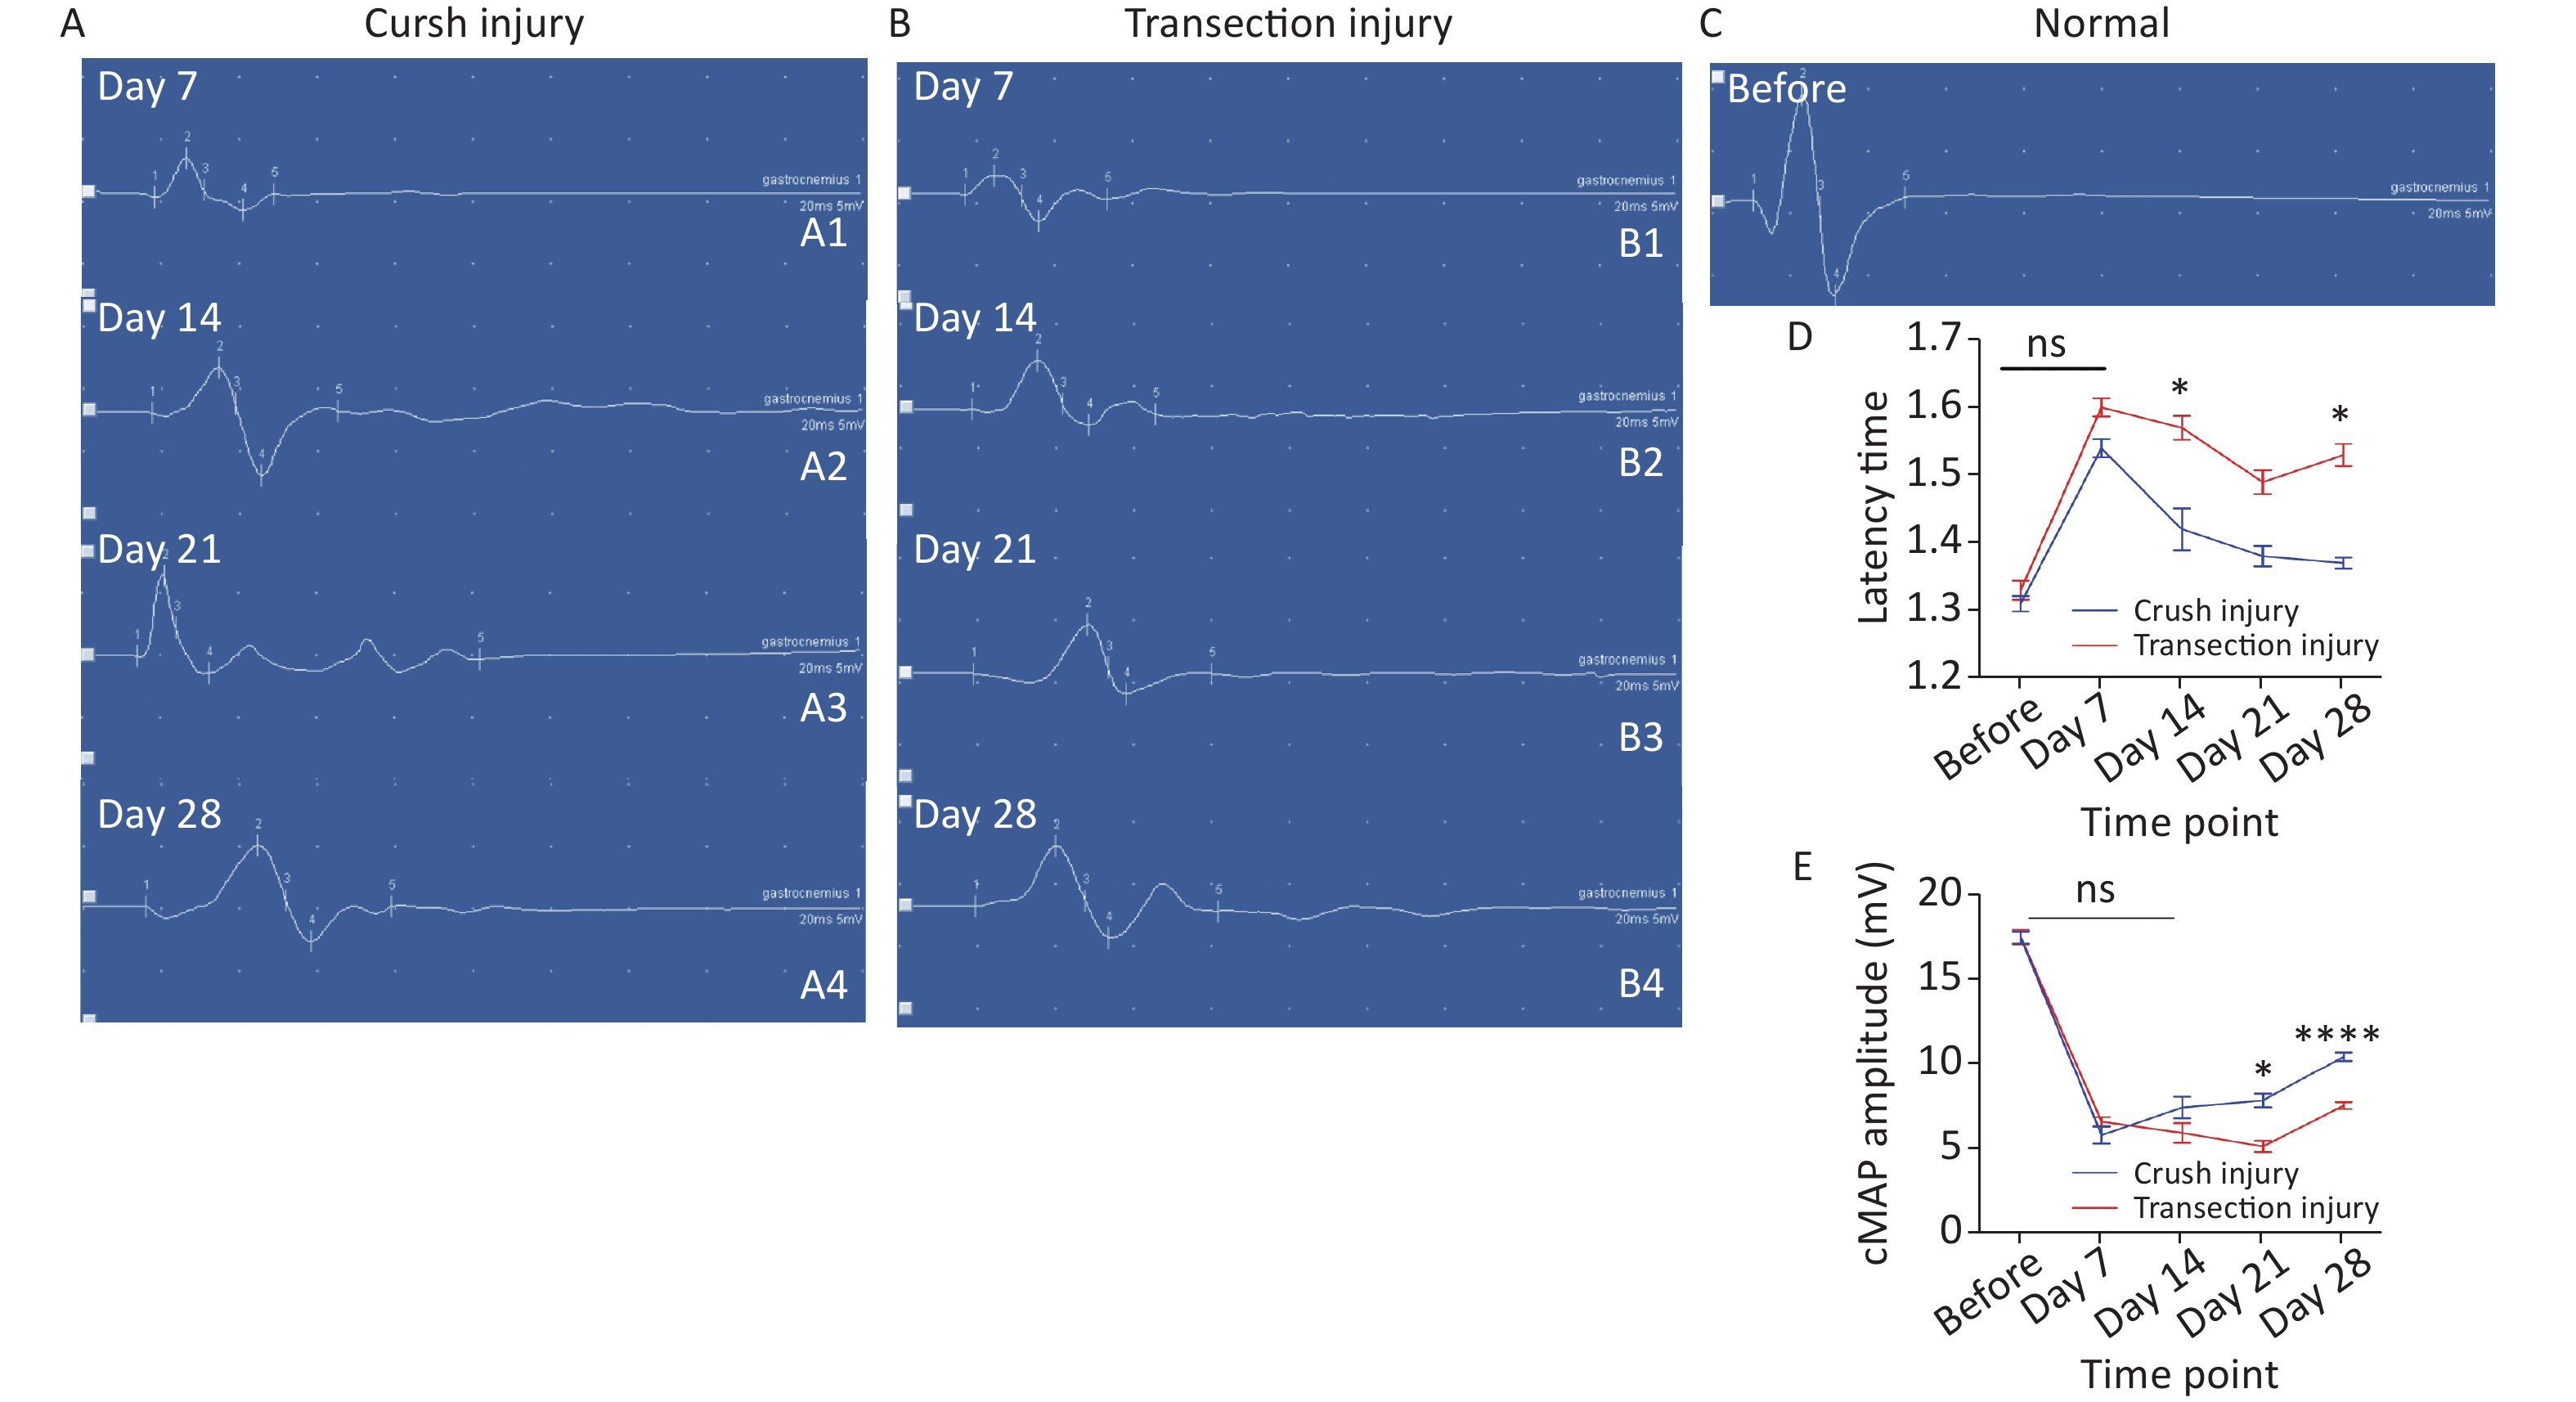
The latency time of the cMAP was measured to reflect the efficiency of the remyelination level. Two-way repeated-measures ANOVA revealed a significant interaction effect between injury mode and time (F4,39 = 4.639, P < 0.01). After sciatic nerve injury, there was a significant delay in cMAP latency time for both groups (before: 1.31 ± 0.04 vs. 1.33 ± 0.05; day 7: 1.54 ± 0.03 vs. 1.60 ± 0.03). Subsequently, the latency time of the crush injury group gradually shortened and was lower than that of the transection injury group. (day 14: 1.42 ± 0.07 vs. 1.57 ± 0.04, P < 0.05; day 21: 1.38 ± 0.03 vs. 1.49 ± 0.04; day 28: 1.37 ± 0.02 vs. 1.53 ± 0.04, P < 0.05) (Figure 5A). The amplitude of the cMAP was measured to evaluate conduction effectiveness. Two-way repeated-measures ANOVA revealed a significant interaction effect between injury mode and time (F4,33 = 7.057, P < 0.001). After sciatic nerve injury, there was a significant decrease in the cMAP amplitude for both groups (before: 17.48 ± 1.25 vs. 17.5 ± 1.51), but the number of axons, as exhibited by the cMAP amplitude from the two injury modes, did not differ on day 7 or day 14 (day 7: 5.78 ± 1.12 vs. 6.58 ± 0.6; day 14: 7.4 ± 1.44 vs. 5.9 ± 1.34), However, on days 21 and 28, the number of axons increased significantly and the cMAP amplitude was higher in group A than in group B (day 21: 7.83 ± 0.82 vs. 5.1 ± 0.78, P < 0.05; day 28: 10.44 ± 0.63 vs. 7.53 ± 0.5, P < 0.0001) (Figure 5B).
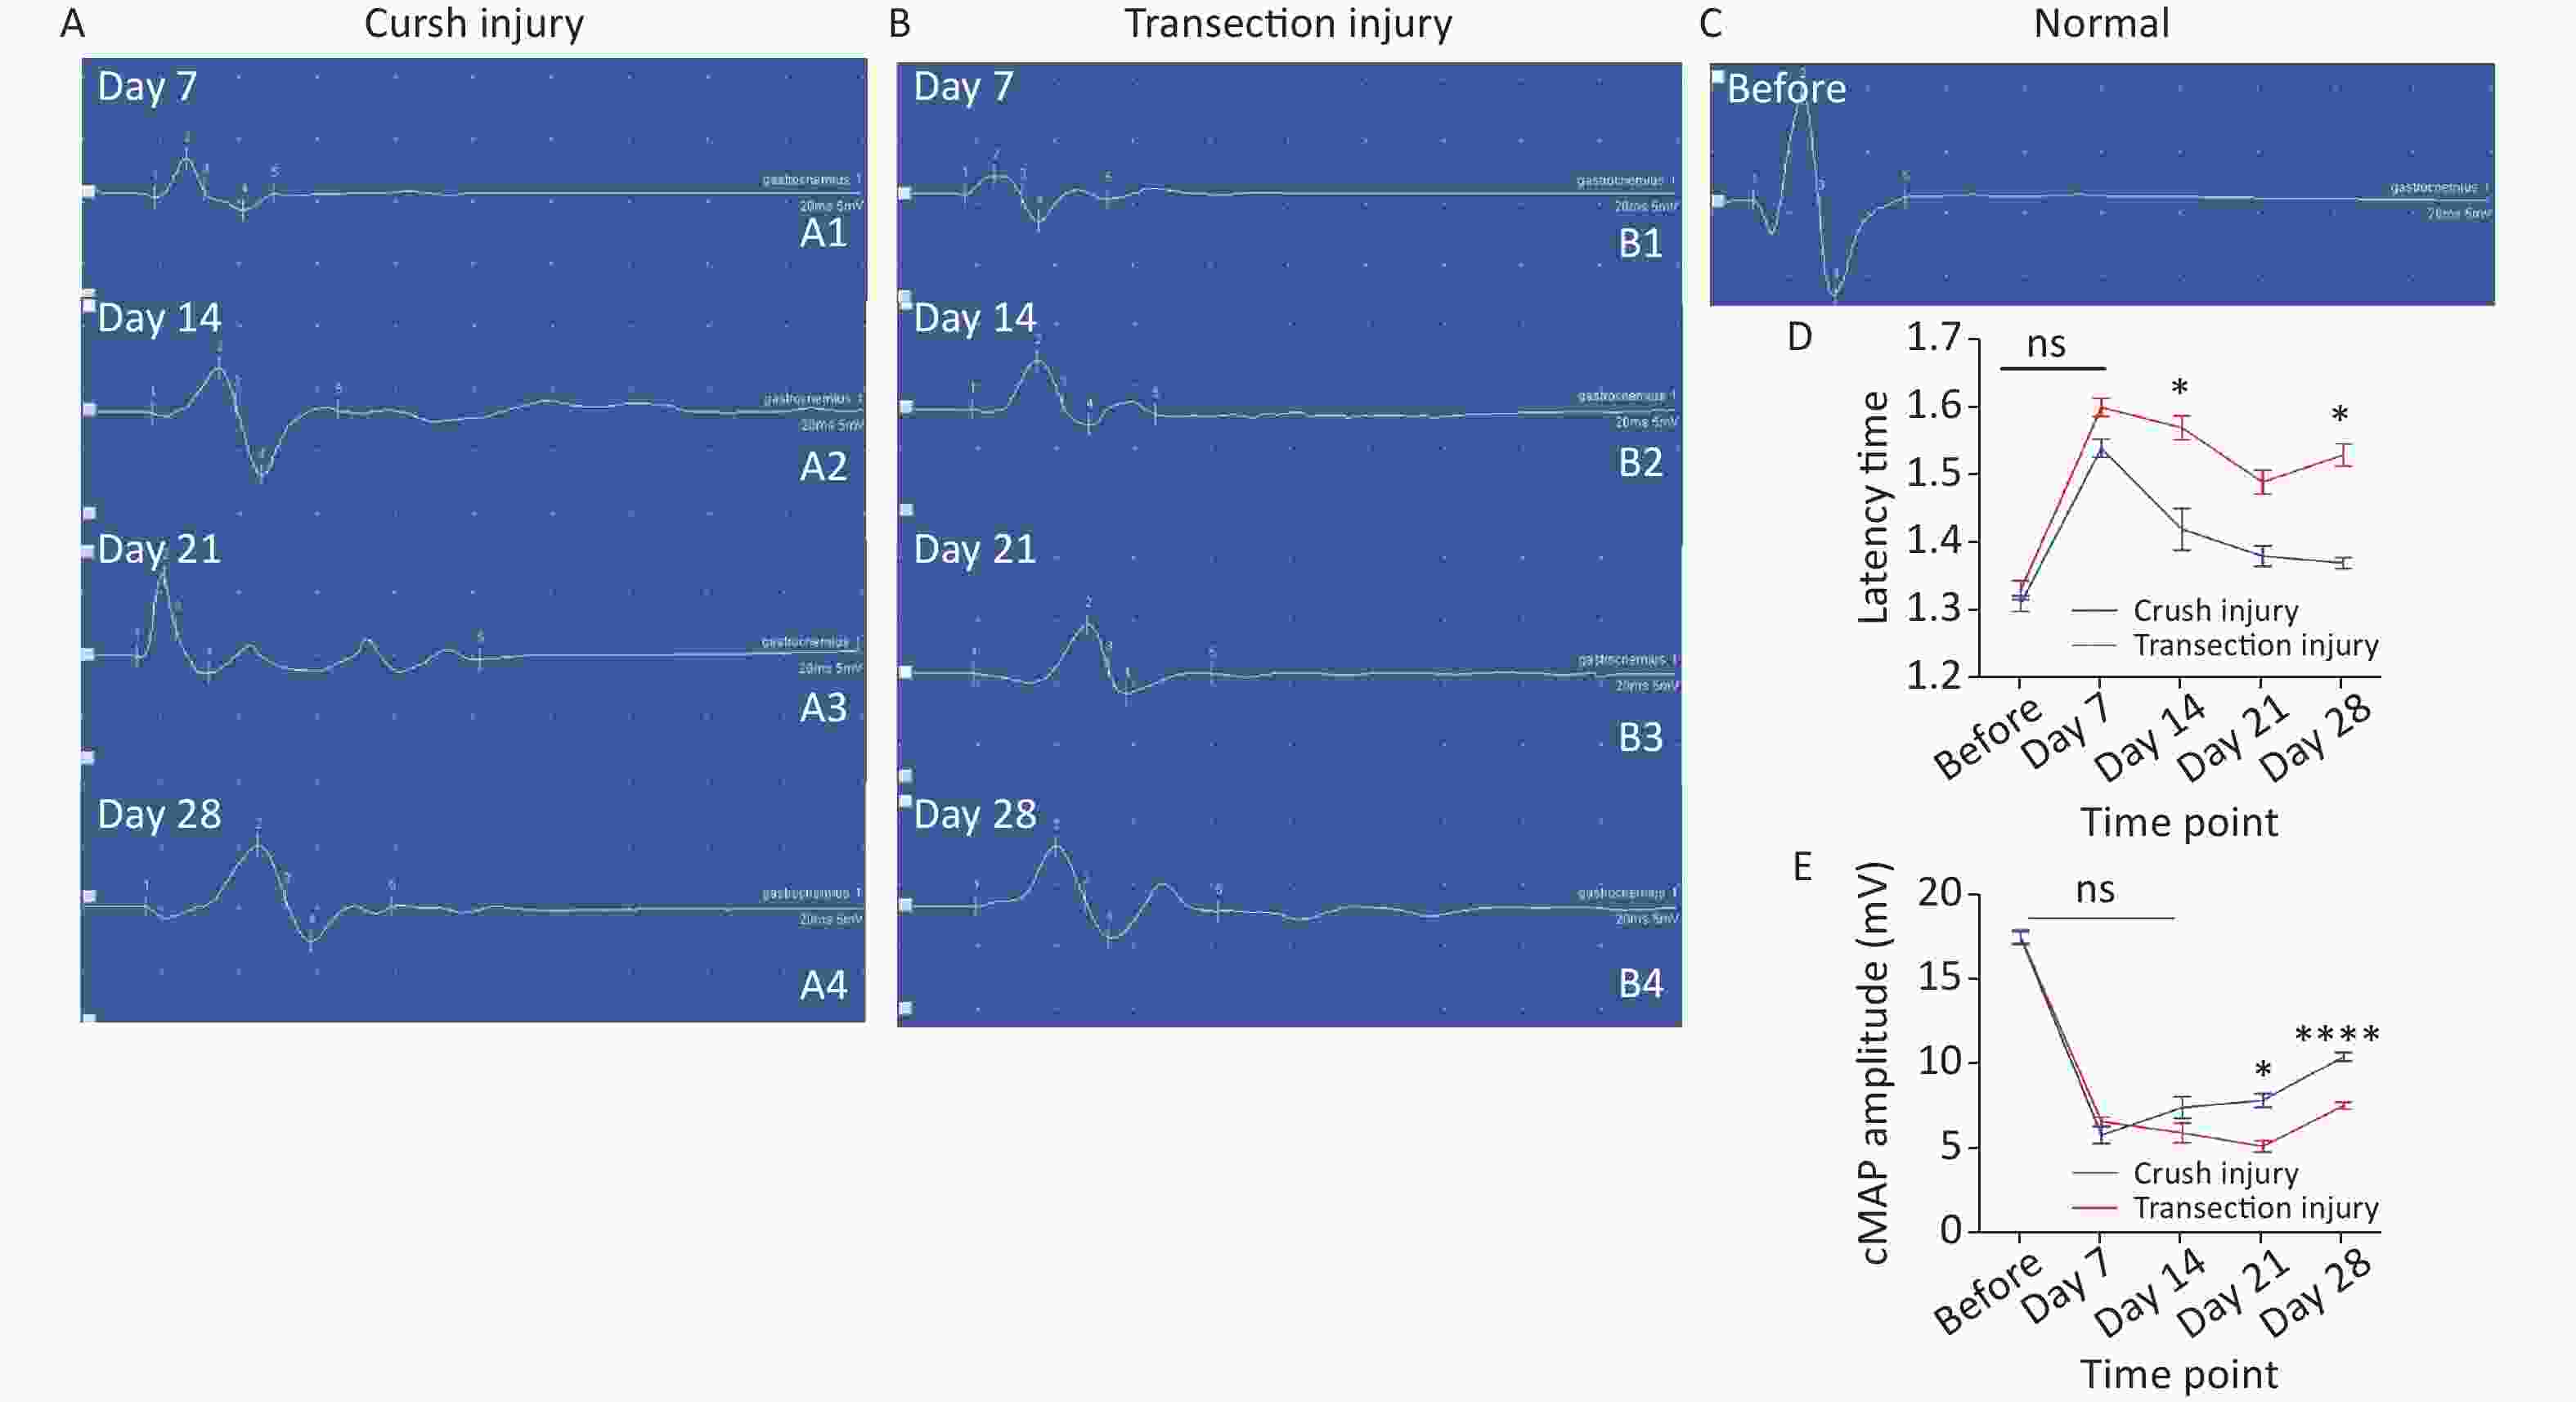
Figure 5. Representative quantitative results of the cMAP latency time and amplitudes. (A1–A4) Schematic diagram of amplitude and latency time at 7, 14, 21, and 28 days after sciatic nerve injury in group A (X-axis units: time course 20 ms, Y-axis unit: amplitude 5 mV), where the cMAP latency time is the position of number 1, the amplitude is the vertical distance between peaks (number 2) and troughs (number 3), and the other 3 and 5 represent the baseline position and the waveform end position. (B1–B4) Schematic diagram of the amplitude and latency time at 7, 14, 21, and 28 days after sciatic nerve injury in group B (the number marks are the same as in group A). (C) Schematic diagram of amplitude and latency time before sciatic nerve injury (the number marks are the same as in group A). (D) Quantitative results of the latency time changes in the two groups at different times. Two-way repeated-measures ANOVA: F4,39 = 4.639, P < 0.01; day 14, P < 0.05; day 28, P < 0.05; (E) Quantitative results of cMAP amplitudes in the two injury groups at different time points; two-way repeated-measures ANOVA: F4,33 = 7.057, P < 0.001; day 21, P < 0.05; day 28, P < 0.0001. *Represents the post hoc test comparing of the two groups at the same time point.
-
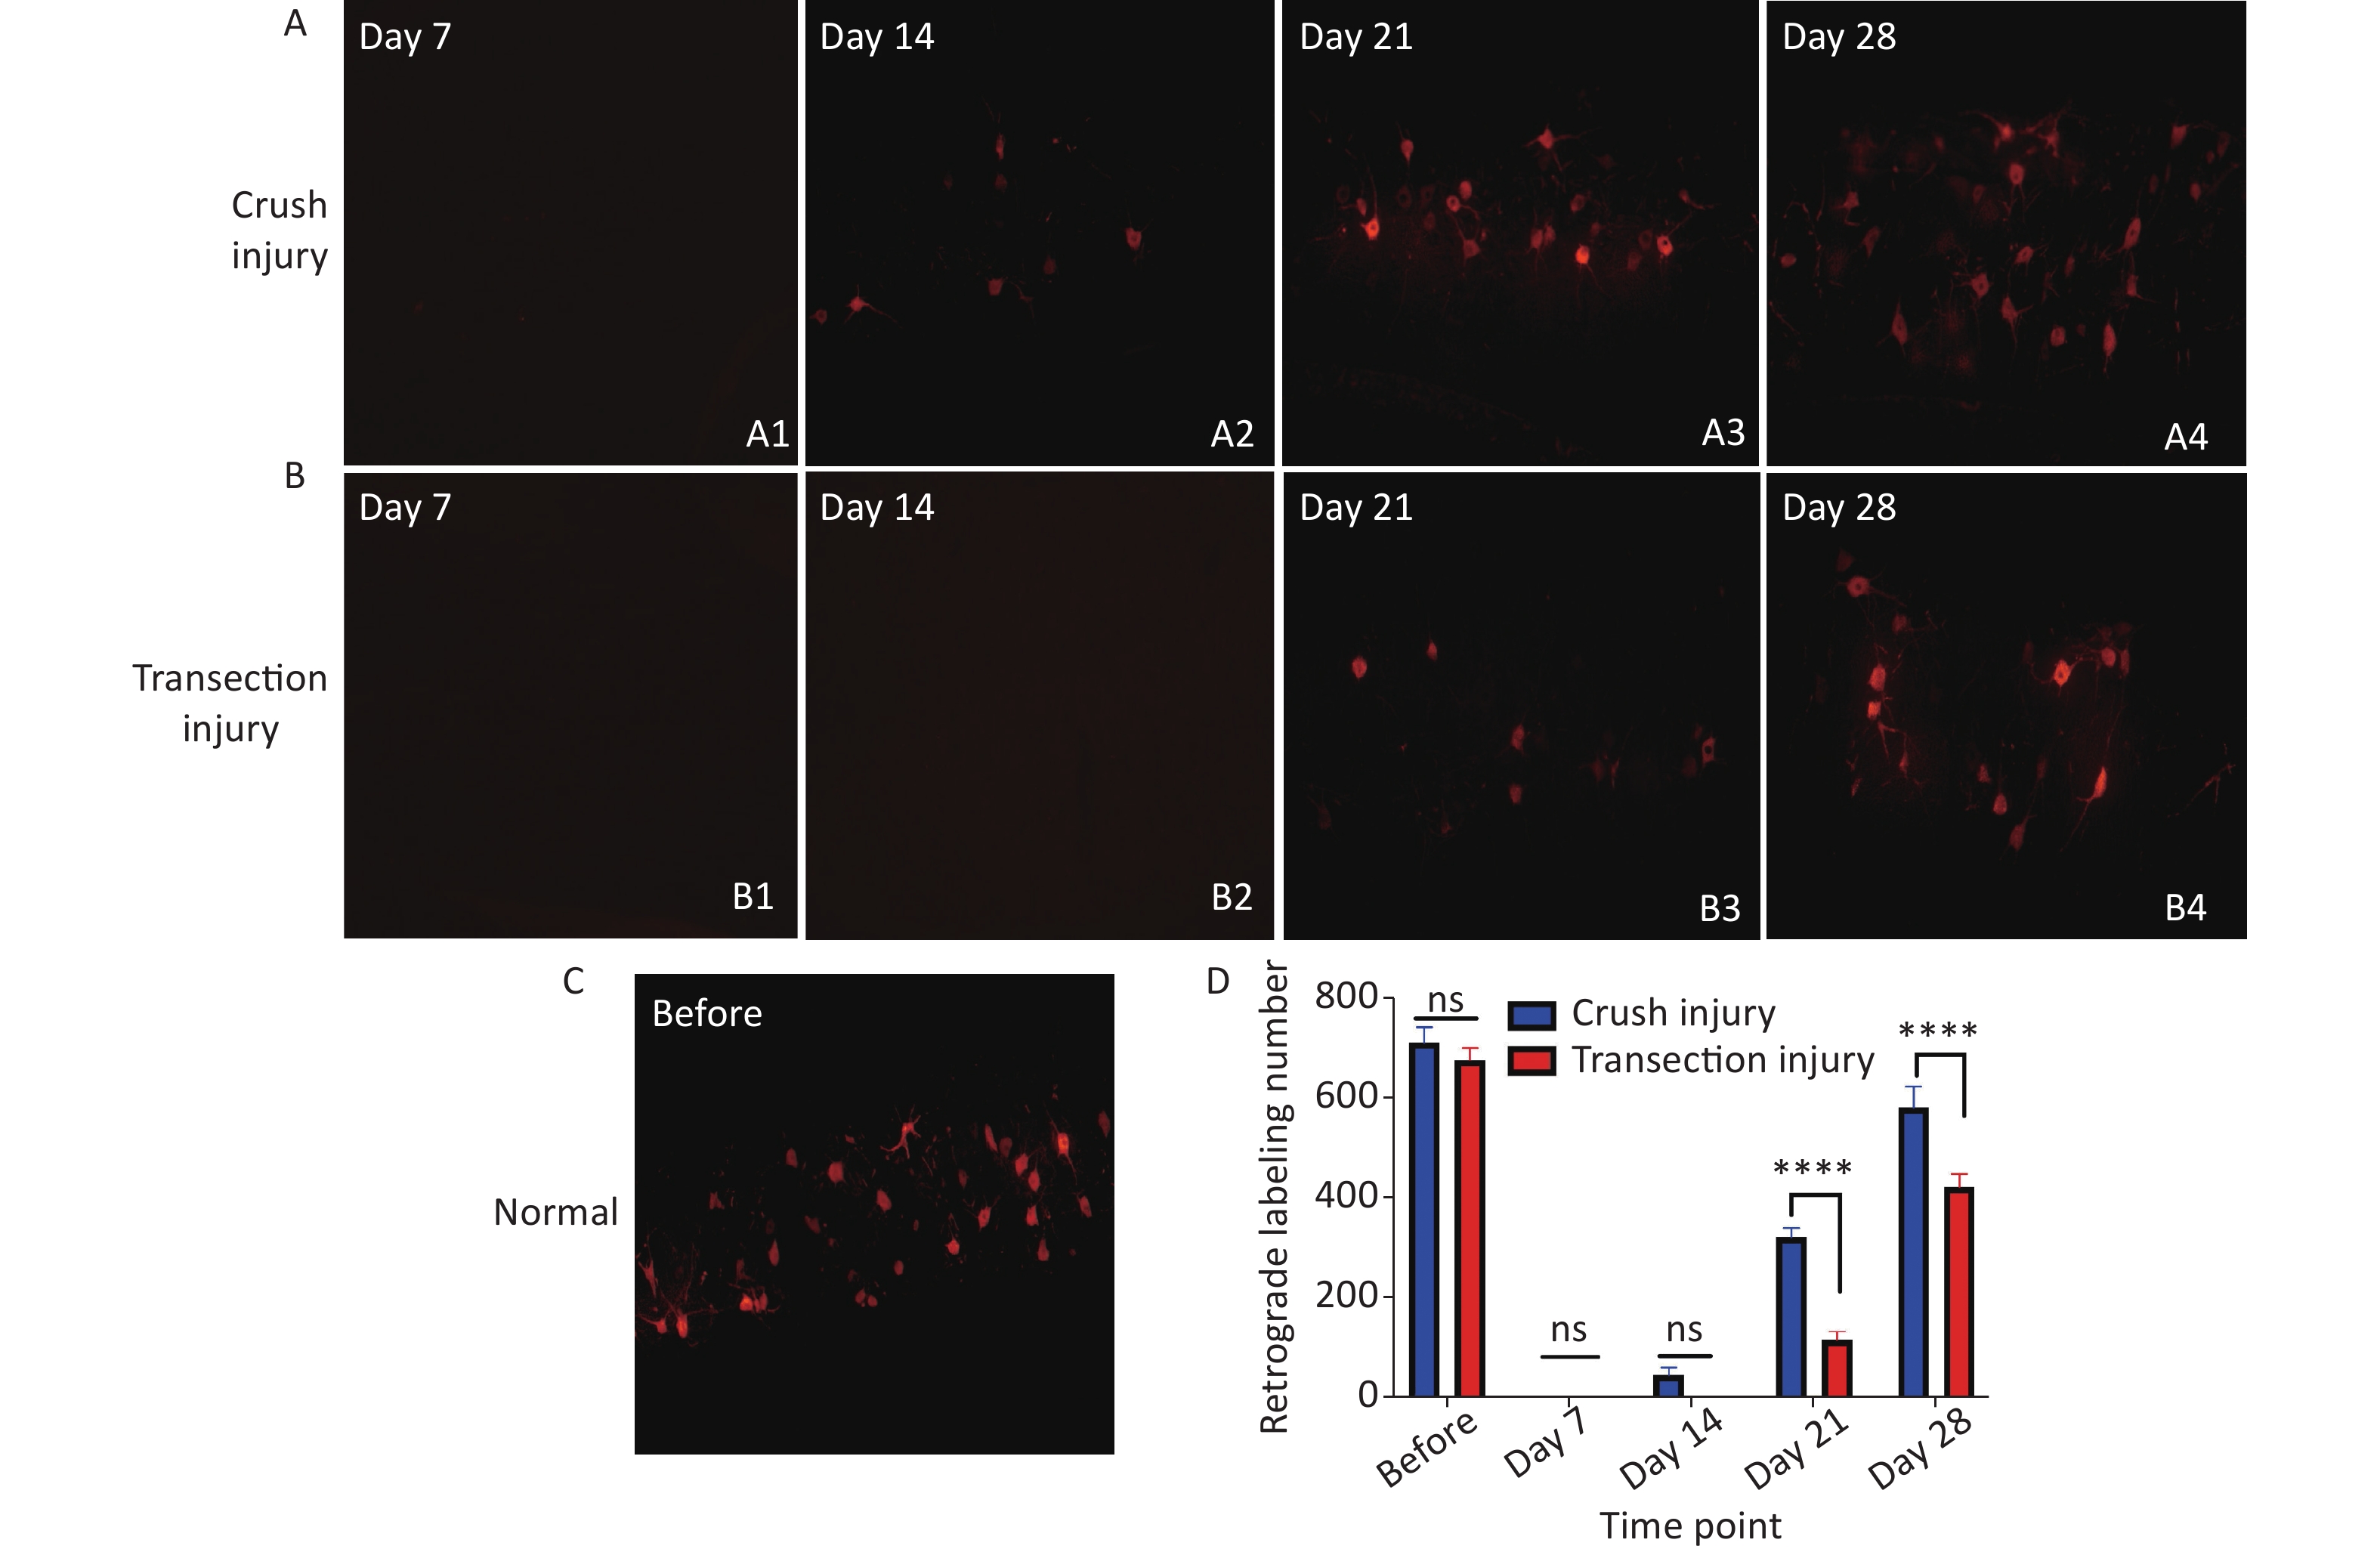
Retrograde labeling was performed by injecting CTB-Alexa 555 into the right gastrocnemius at different times. We counted retrograde labeled neurons in normal rats via axoplasmic transport through the sciatic nerve to the spinal cord. Nearly 700 neurons were labeled in both groups (709.5 ± 31.53 vs. 675 ± 23.62, P > 0.05). No labeled neurons were found at 7 days after injury, indicating that the injured nerve did not have any connections soon after the procedure. In contrast to day 14 (44 ± 15.12 vs. 0 ± 0, P > 0.05), many more CTB-Alexa 555-labeled neurons were observed in the right spinal cord on day 21, and significantly more neurons were labeled in group A (320 ± 18.02 vs. 114 ± 16.54, P < 0.0001), which indicates that there was obvious reinnervation. At 28 days, group B showed faster regeneration than group A, but the total number of labeled neurons was still lower (580.33 ± 41.97 vs. 421.33 ± 25.72, P < 0.0001) (Figure 6).
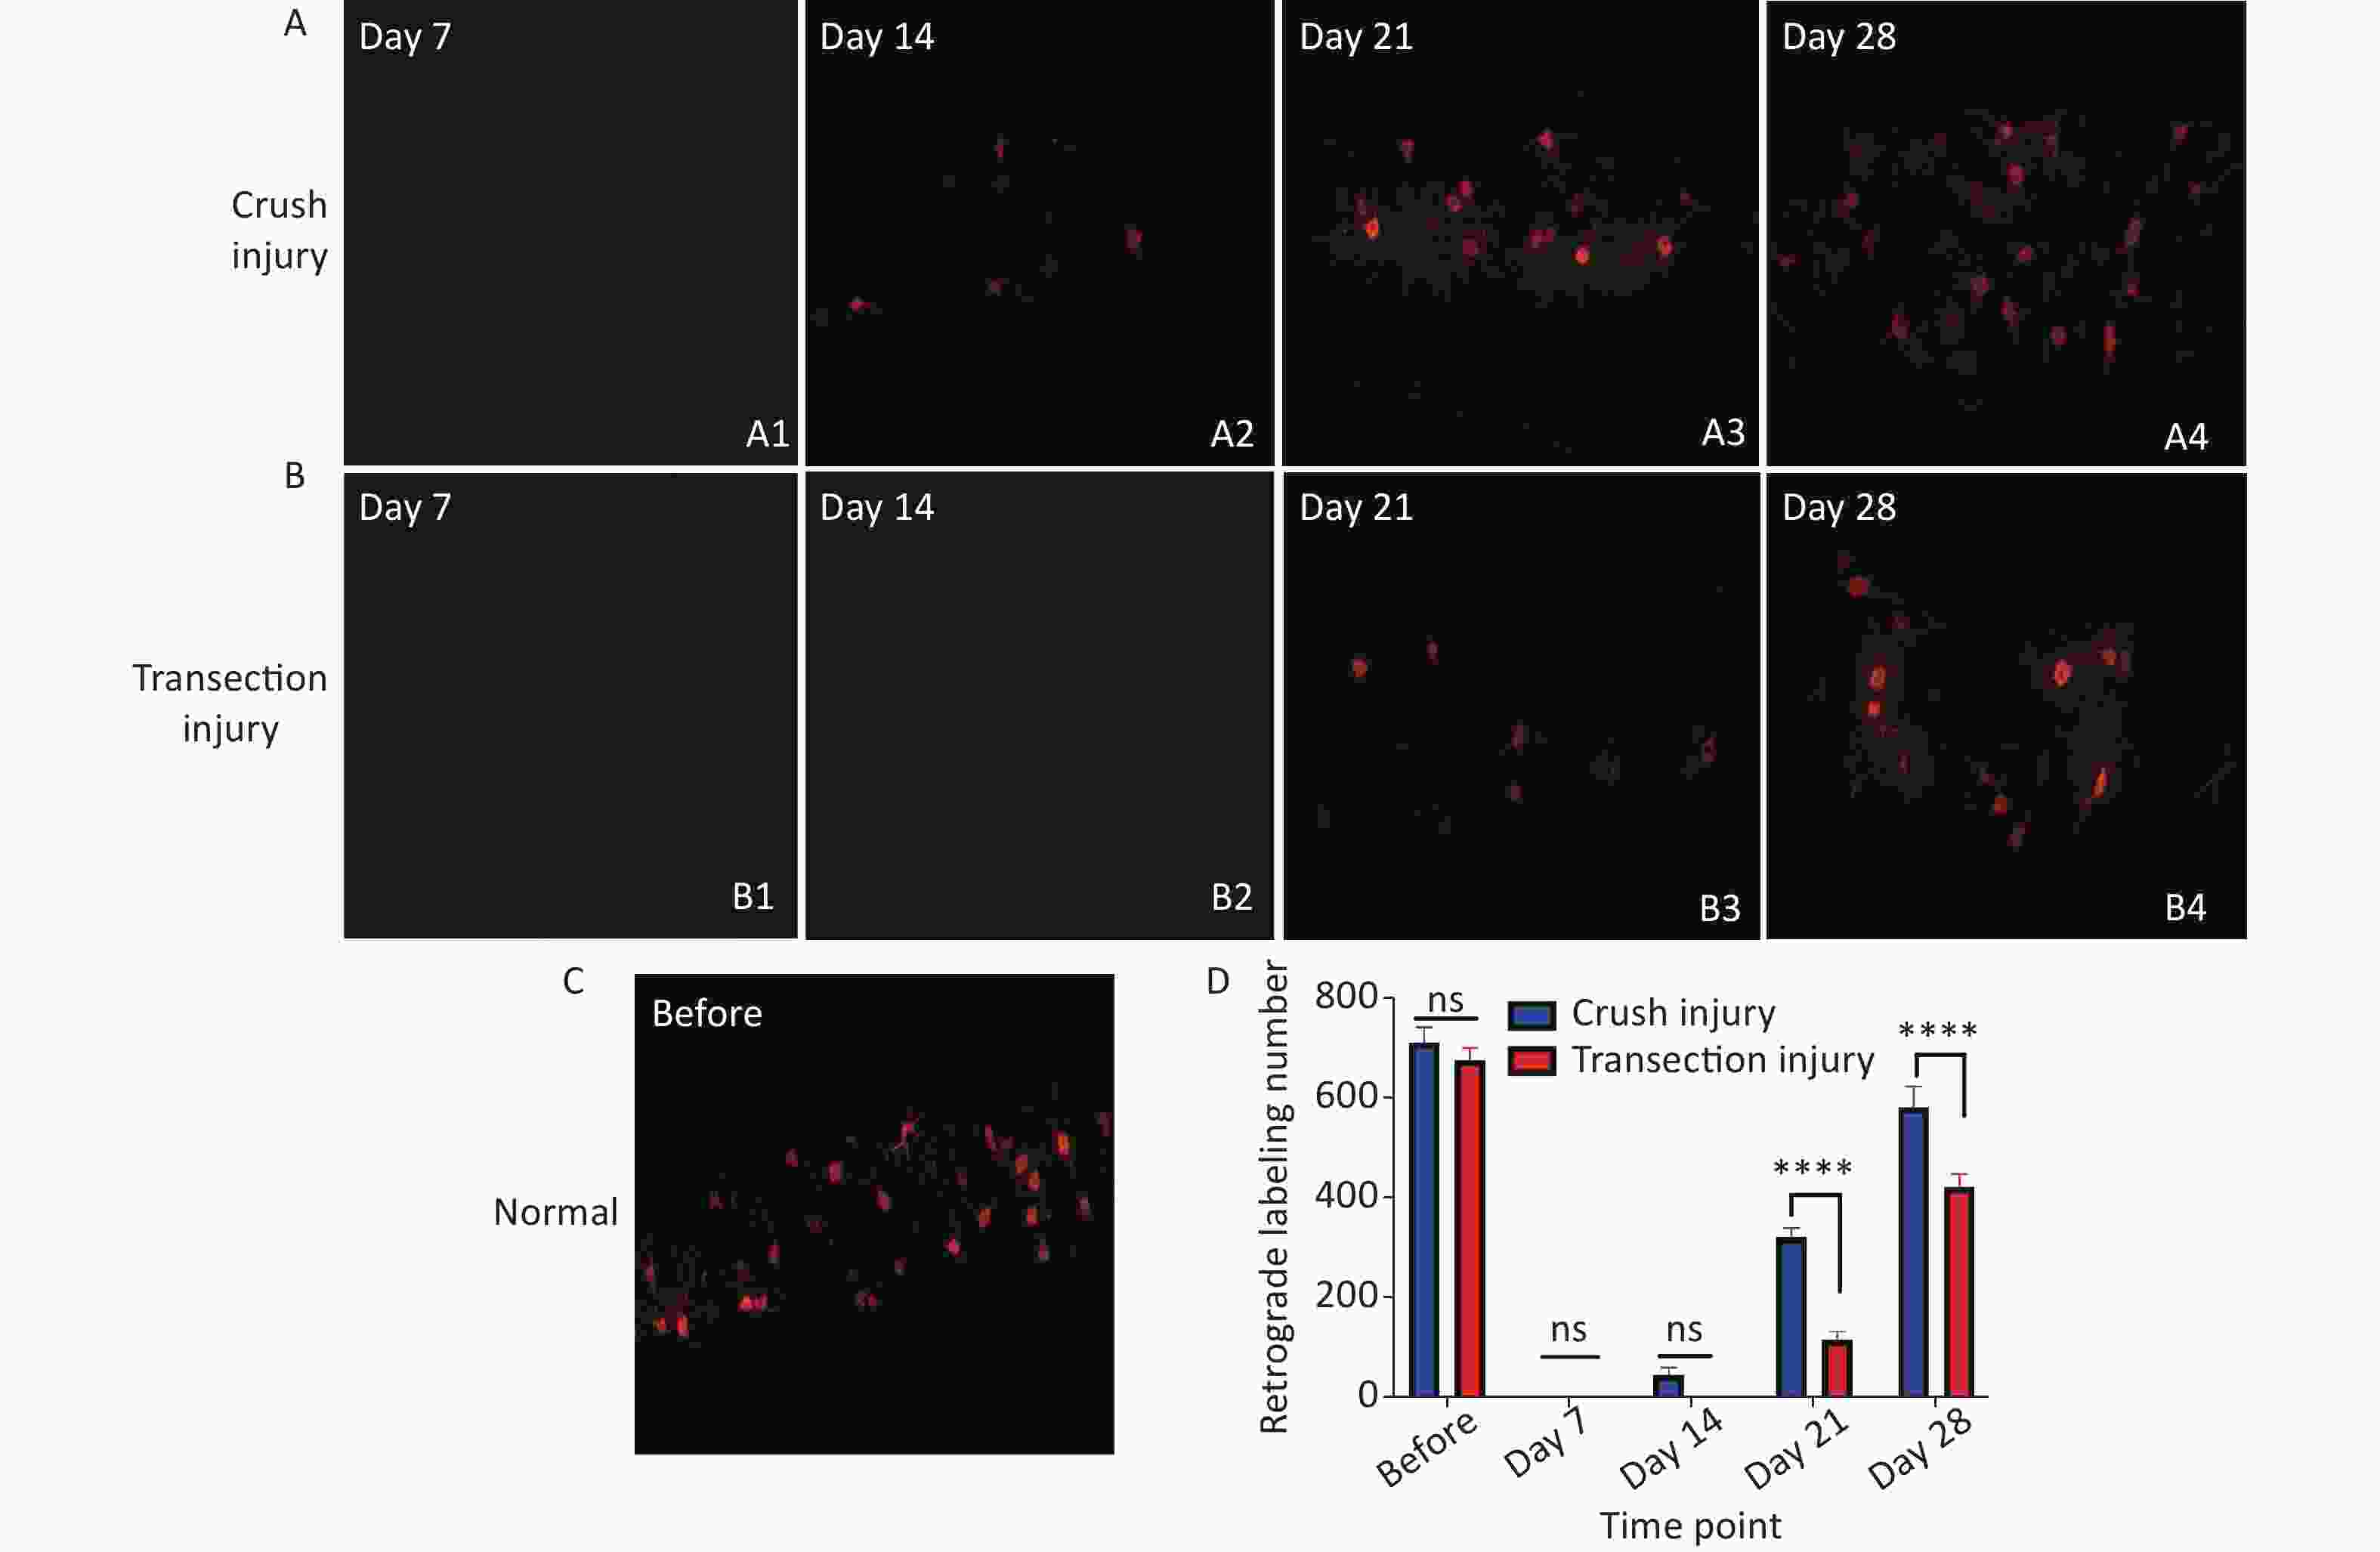
Figure 6. Quantitative results following CTB-Alexa 555 labeling of neurons in the right spinal cord. (A1–A4) Labeled neurons in group A 7, 14, 21, and 28 days after sciatic nerve injury, magnification = 10x. (B1–B4) Labeled neurons in group B 7, 14, 21, and 28 days after sciatic nerve injury, magnification = 10x. (C) CTB-Alexa 555-labeled neurons in the spinal cord of a rat before sciatic nerve injury, magnification = 10x. (D) Quantitative results of the two groups; two-way repeated-measures ANOVA: F4,22 = 17.54, P < 0.0001; day 21, P < 0.0001; day 28, P < 0.0001. *Represents the post hoc test comparing of the two groups at the same time point.
-
Semithin sections of the nerve graft were stained with thionin and observed under an optical microscope. A summary of the results is shown in Figure 7. Regenerated nerves showed the presence of small-caliber myelinated fibers and a thinner myelin sheath than normal nerves. Microfasciculation, typical of regenerated nerve fibers, was also clearly detectable. The normal structure of the myelin sheath is shown in Figure 7C (before: 9,214 ± 168 vs. 9,423 ± 135, P > 0.05). At 7 days after sciatic nerve injury, a large number of axons exhibited Wallerian degeneration and disintegration in both injury modes, and a small amount of new myelin growth was also found, but the difference between groups was not significant (452 ± 31 vs. 373 ± 12, P > 0.05). However, at 14 days after injury and later, significantly more new myelin sheaths had formed in group A than in group B, indicating a significantly higher rate of nerve regeneration in group A. Moreover, at day 28, the morphological structure of the myelin sheath in group A was closer to that of the normal myelin sheath (day 14: 1,381 ± 59 vs. 1,004 ± 44, P < 0.05; day 21: 3,743 ± 184 vs. 2,238 ± 227, P < 0.05; day 28: 6,313 ± 106 vs. 4,289 ± 94, P < 0.001).
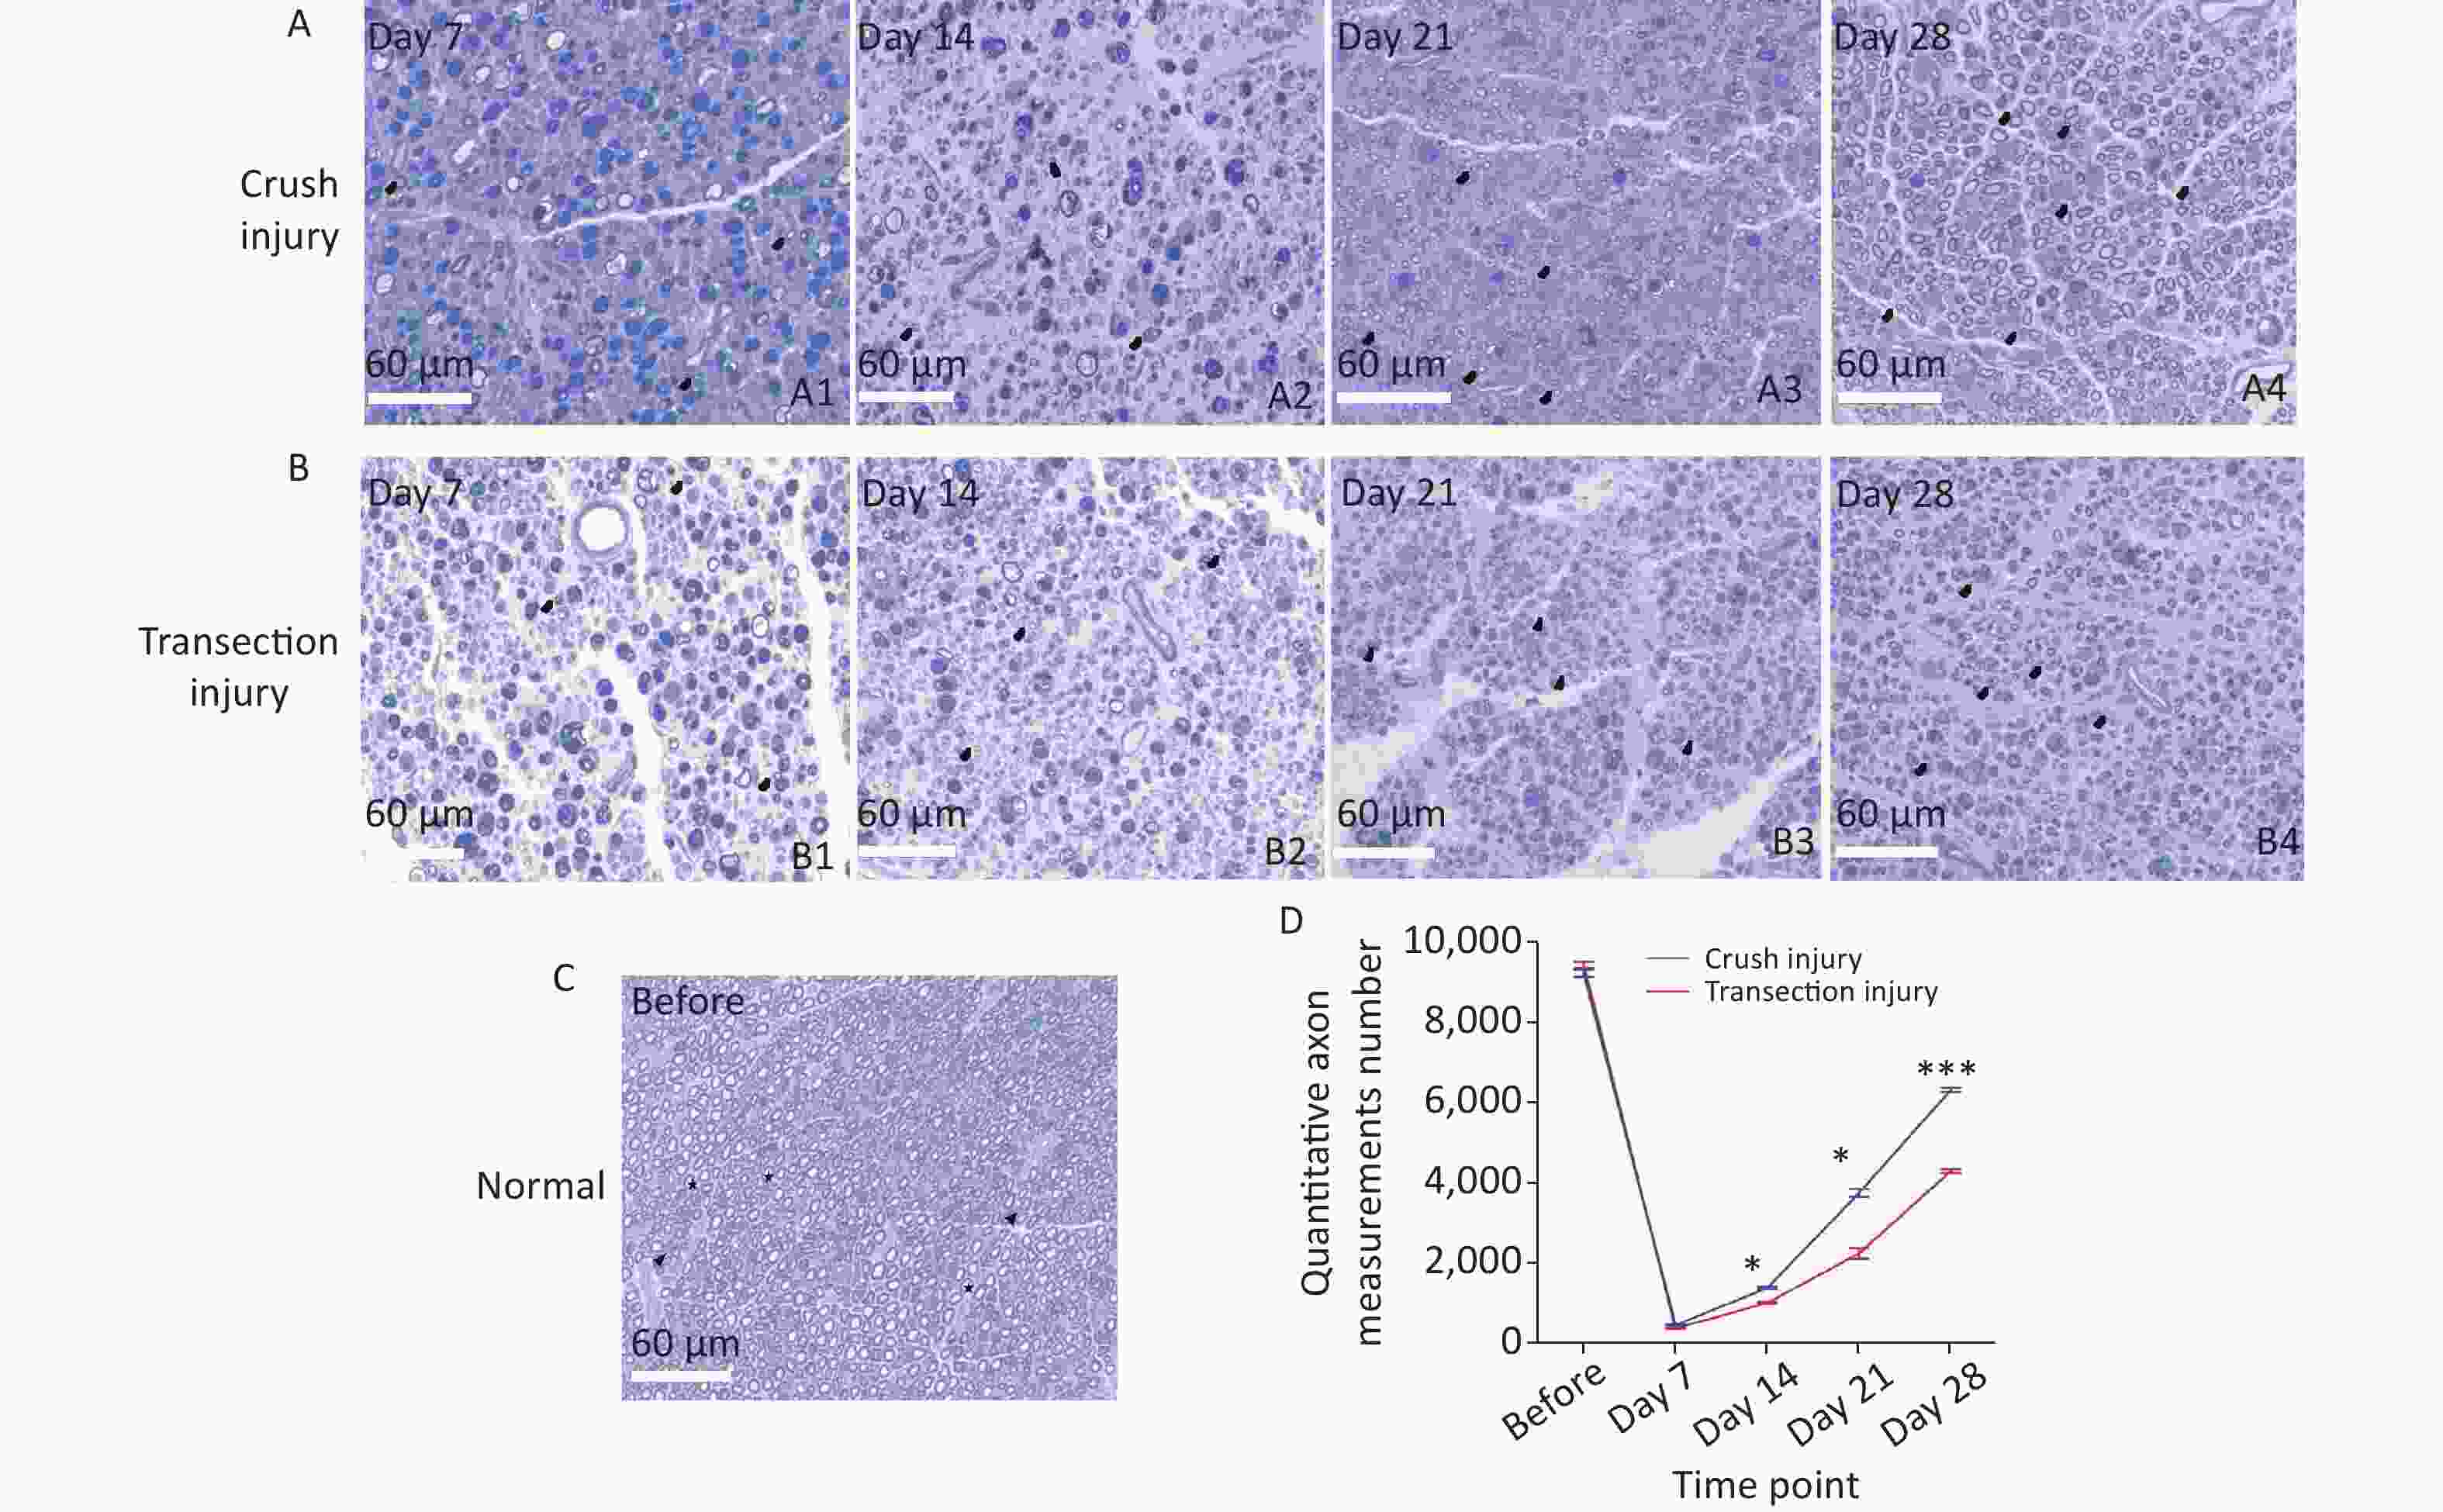
Figure 7. Representative photomicrographs showing myelinated axons in thionin-stained semithin sections of the sciatic nerve at different times. The black triangles indicate newly formed myelin sheaths, and the stars represent mature myelin sheaths. (A1–A4) Myelinated axons in group A 7, 14, 21, and 28 days after sciatic nerve injury, bar = 60 µm. (B1–B4) Myelinated axons in group B 7, 14, 21, and 28 days after sciatic nerve injury, bar = 60 µm. (C) Photomicrographs of myelinated axons before sciatic nerve injury, bar = 60 µm. (D) Numbers of myelinated axons for the two groups; two-way repeated-measures ANOVA: F4,20 = 49.69, P < 0.0001; day 14, P < 0.05; day 21, P < 0.05; day 28, P < 0.001. *Represents the post hoc test comparing of the two groups at the same time point.
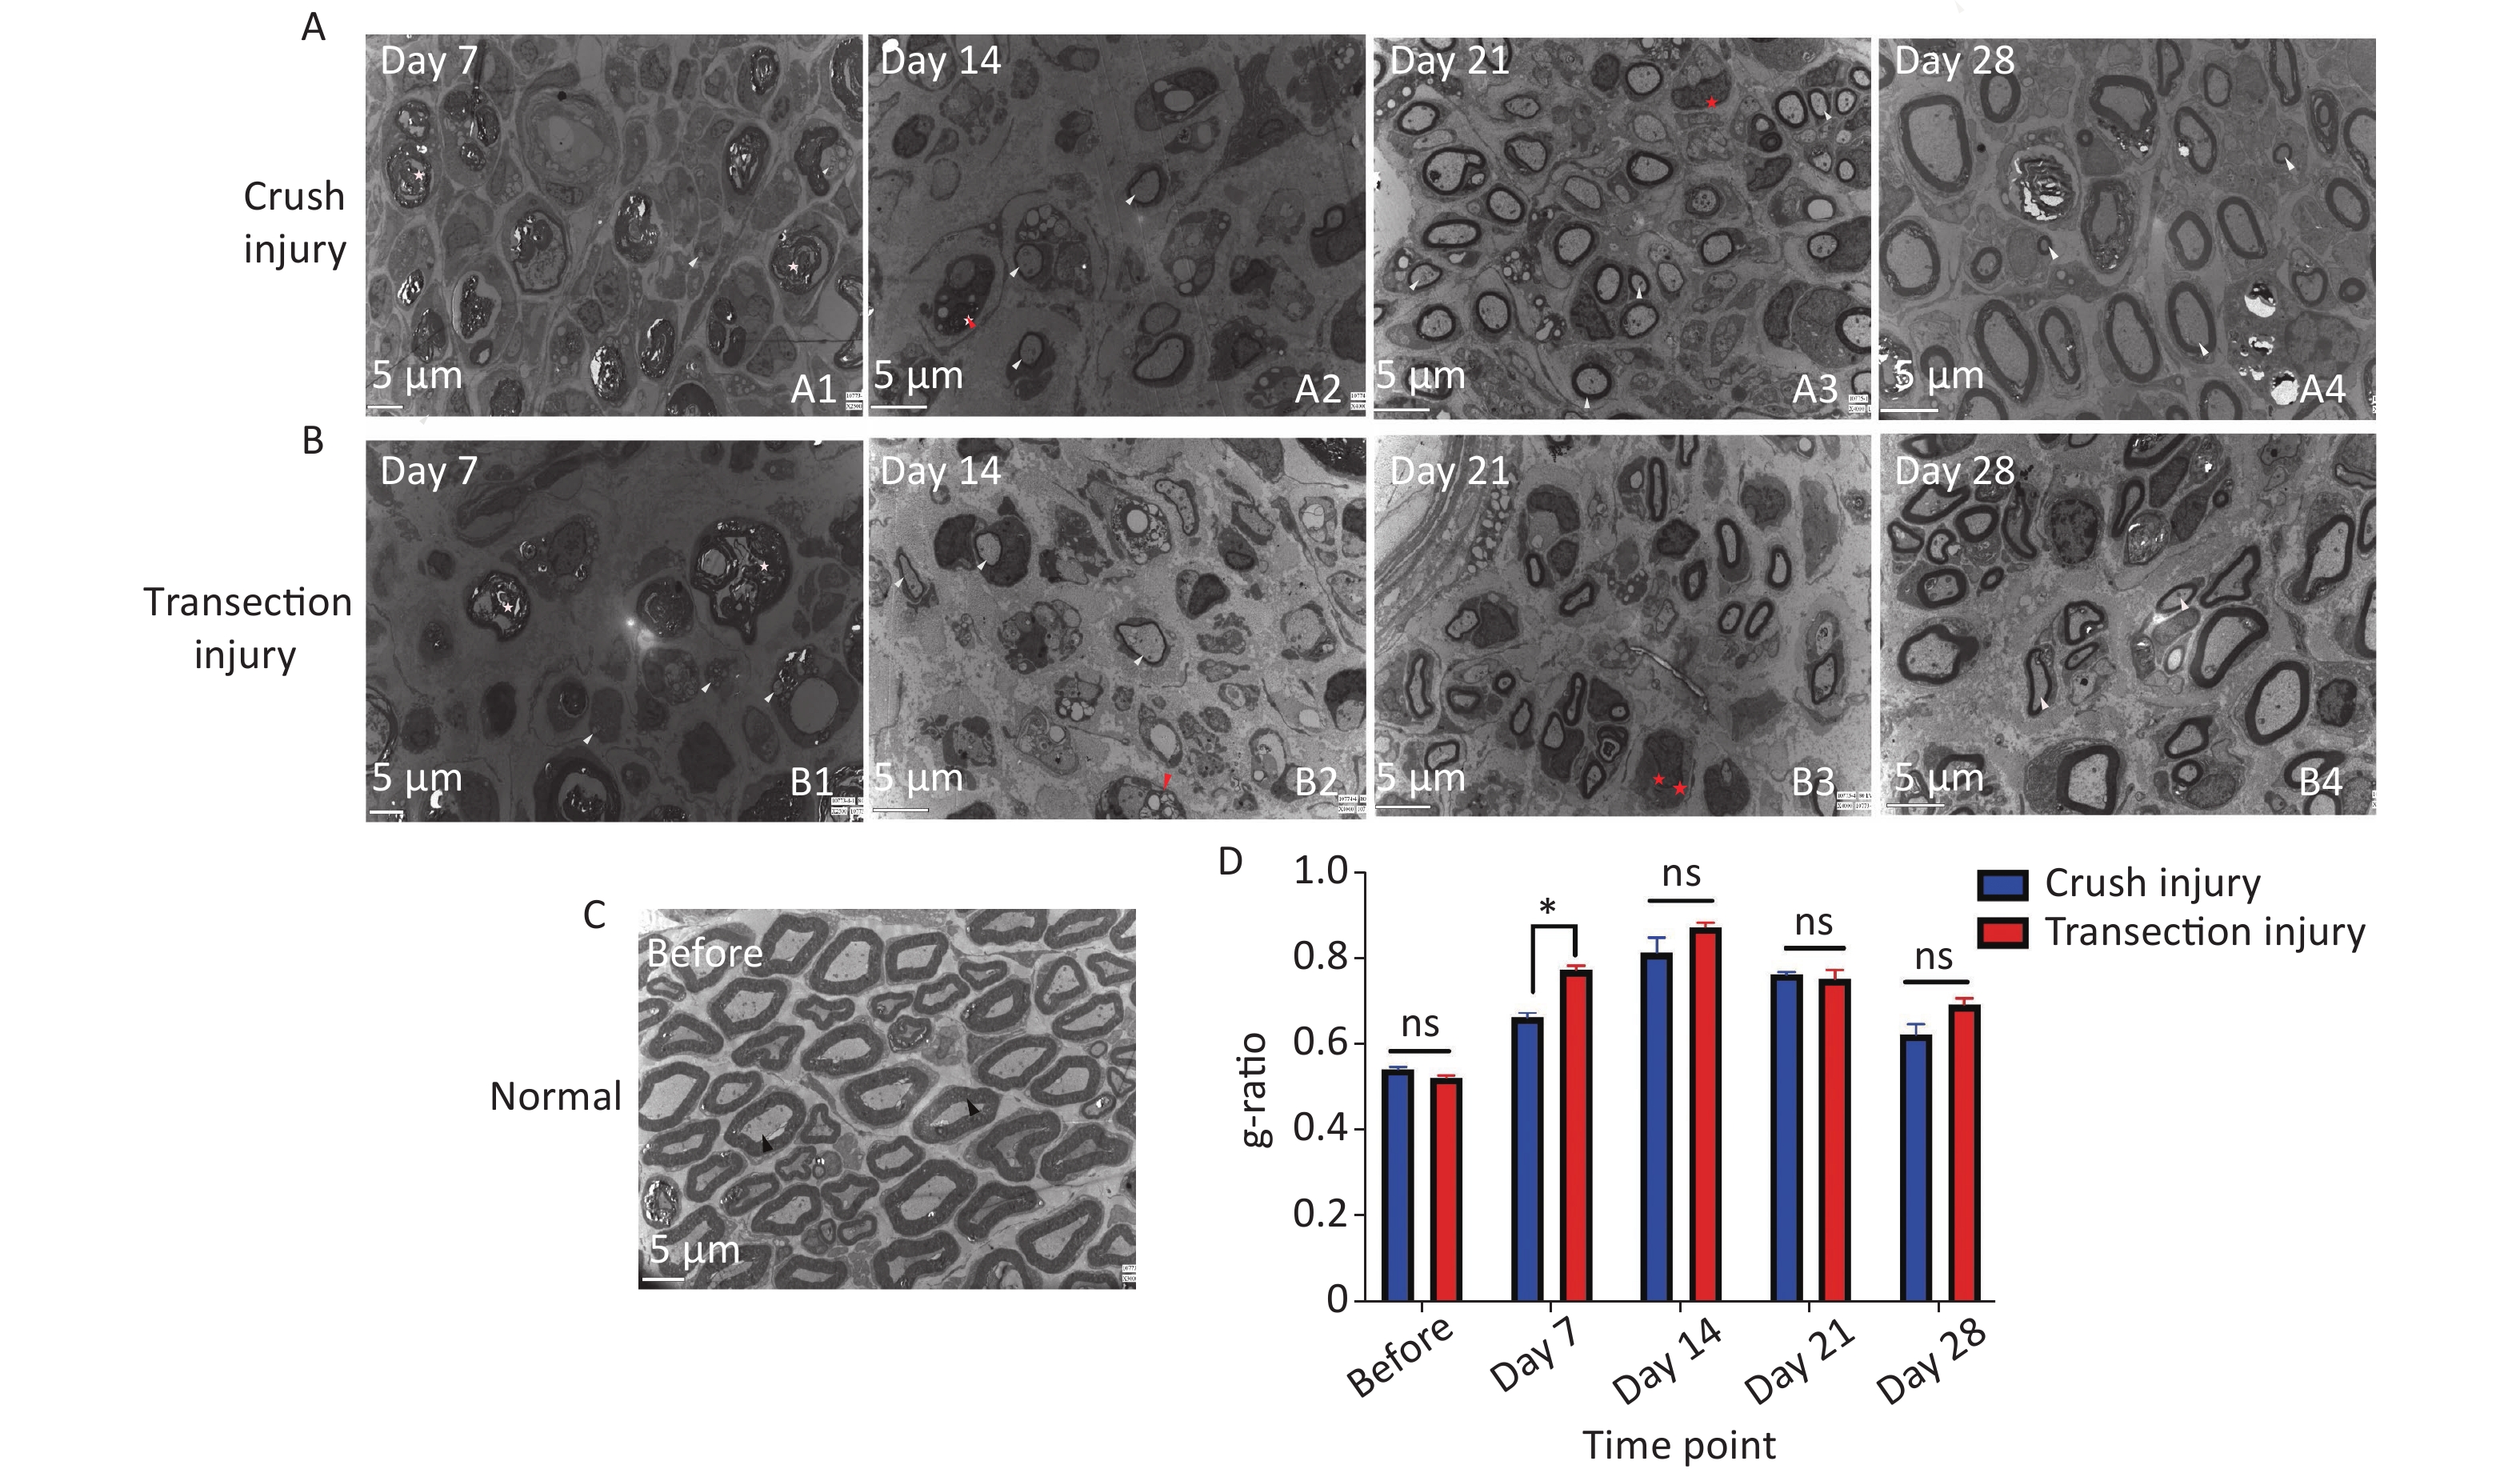
Ultrastructural analysis confirmed the observations made by optical microscopy. On day 7, two nerve samples showed structures typical of Wallerian degeneration (Figure 8A1, B1). After 14 days, some myelin sheaths were still undergoing disintegration, and many small nerve fibers with healthy, although still thin, neoplastic myelin sheaths were detectable, as well as macrophages completing phagocytosis (Figure 8A2, B2). At 14 to 21 days, axons were found to continuously undergo myelination, but were still in the early stages. At 28 days after the injury, the regenerating nerve fibers showed evidence of a continuous maturation process. Although the myelination process was very fast, the thickness of the myelin sheaths was also increased, but compared with normal nerves, the process was incomplete (Figure 8A3, A4, B3, B4). The fiber diameter to axon diameter ratio, which reflects the degree of nerve regeneration, was not significantly different between the two injury groups (Figure 8D).
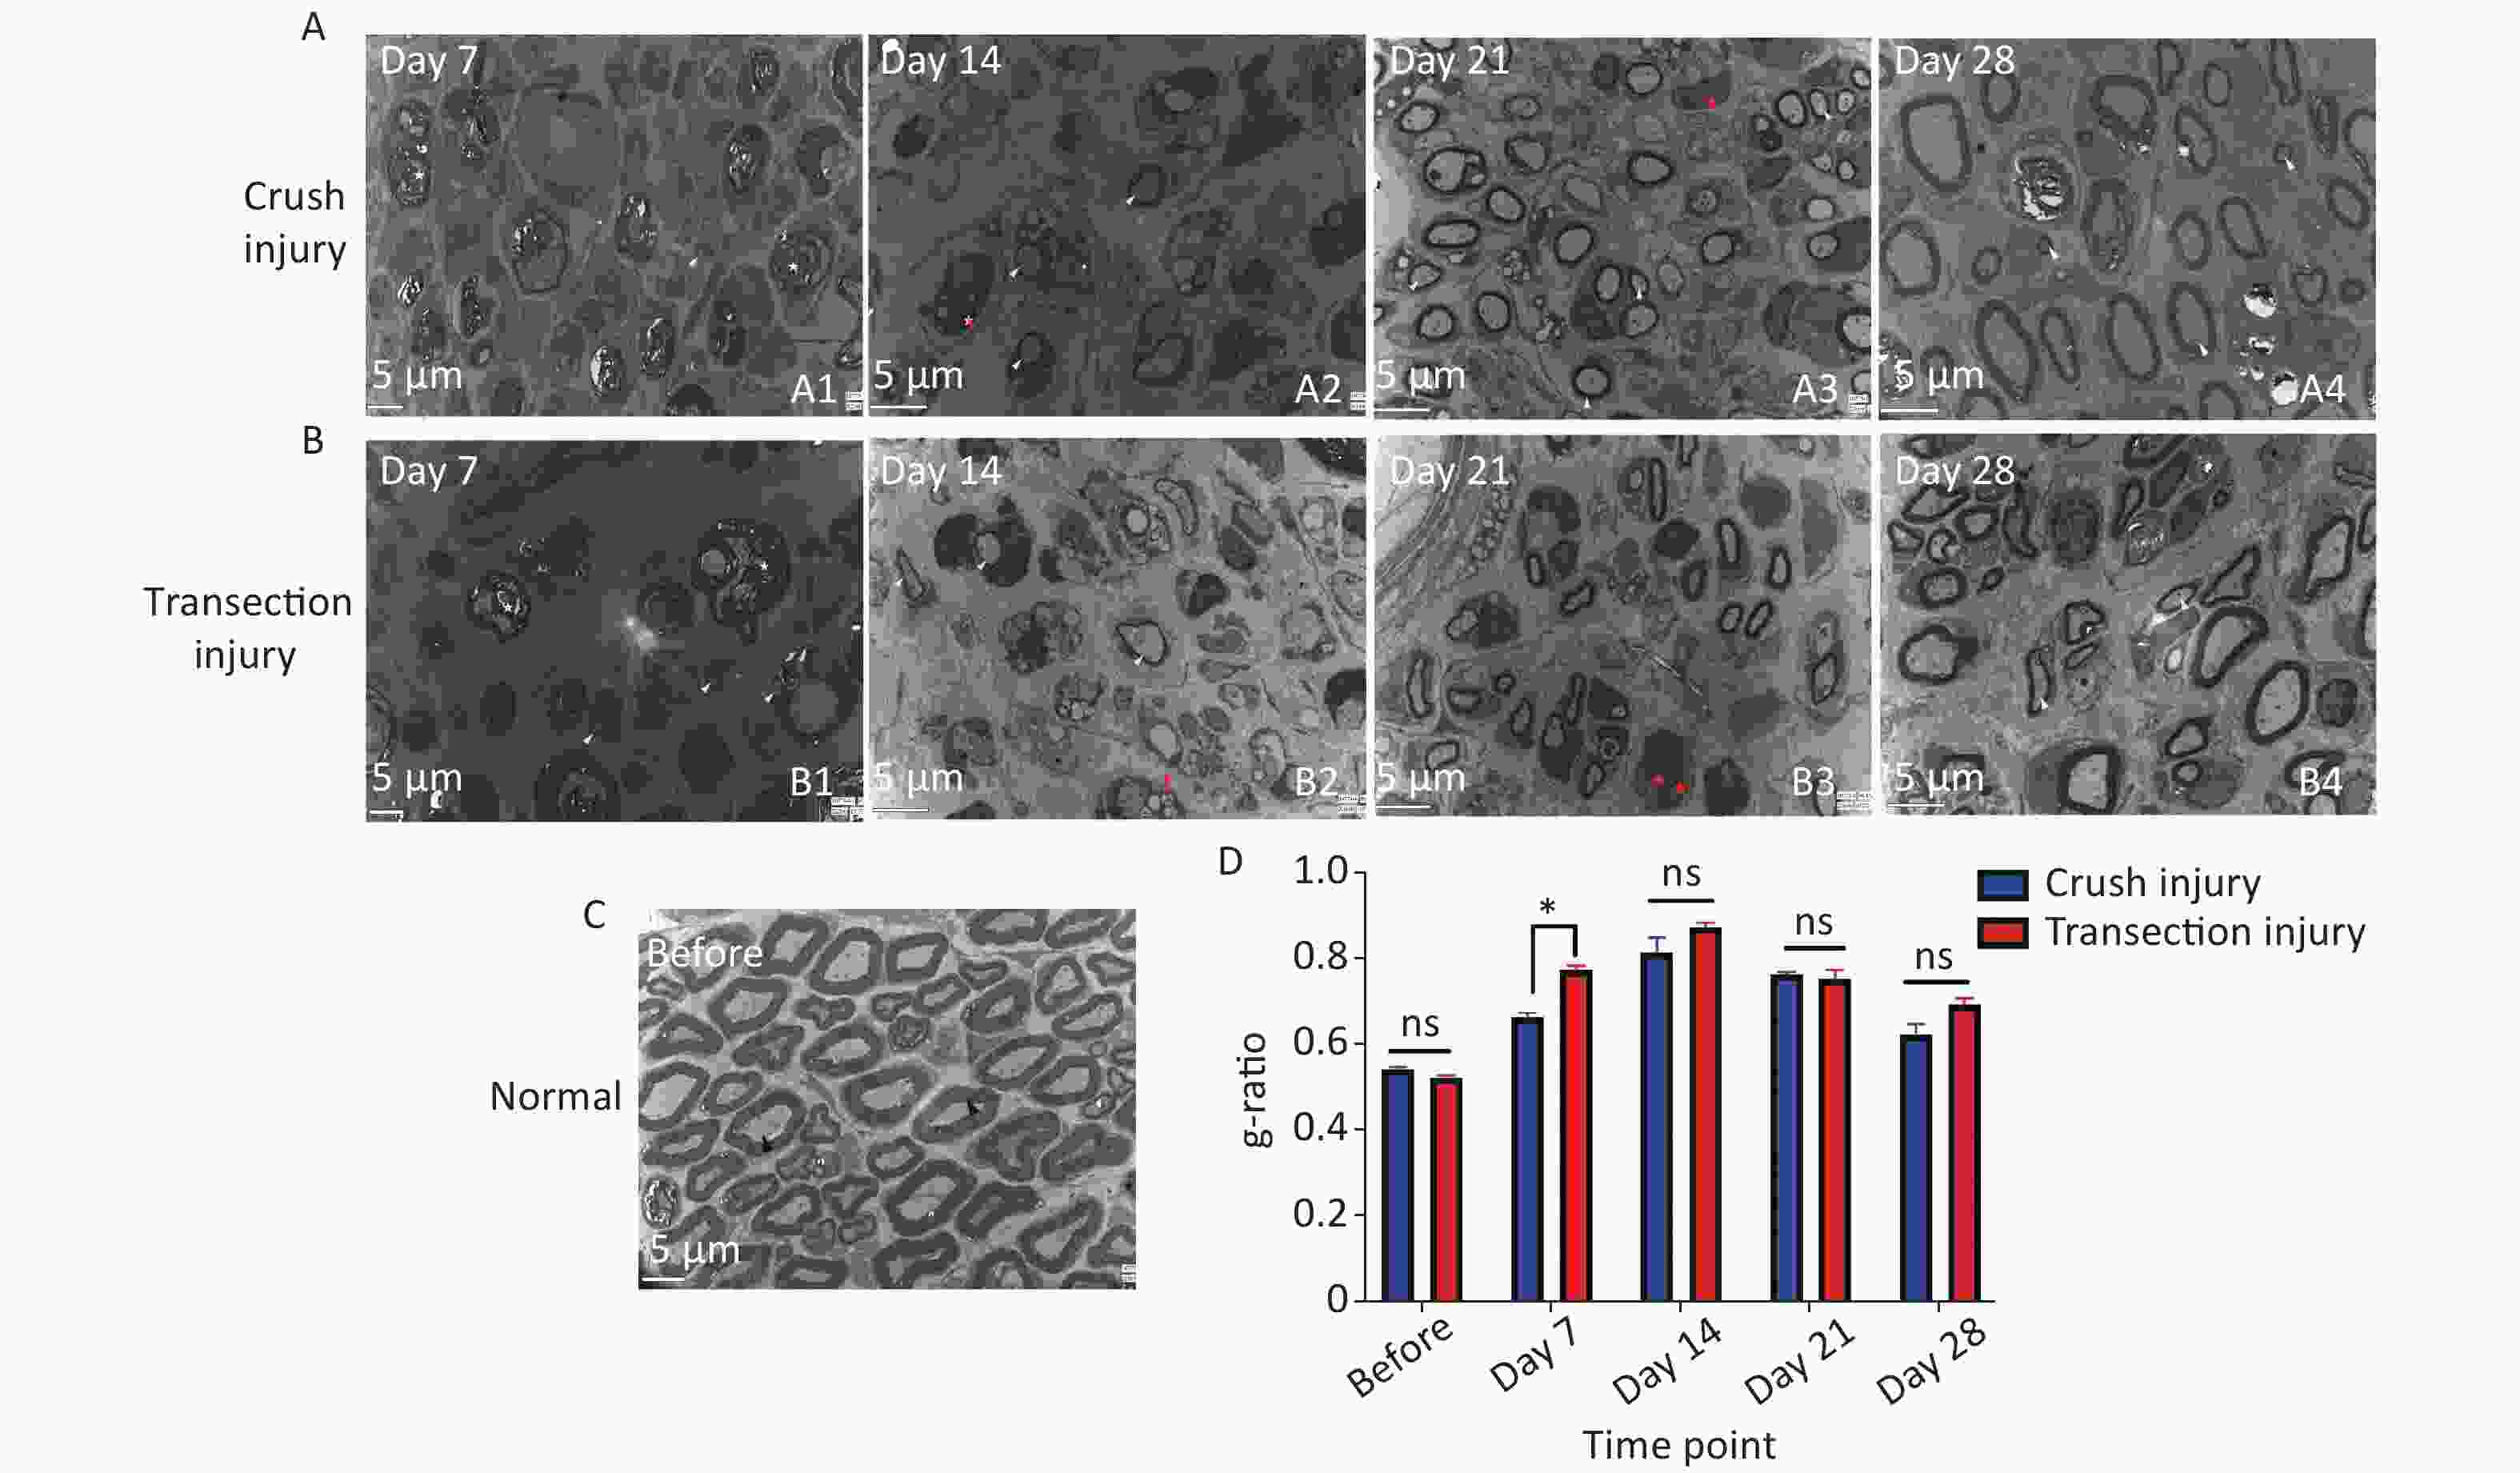
Figure 8. Representative electron micrographs showing myelinated axons in ultrathin sections of the sciatic nerve at different times. The white triangles indicate newly formed myelin sheaths, the red triangles indicate myelin sheaths undergoing disintegration, the red pentagrams represent Schwann cell nuclei, and the black triangles represent mature myelin sheaths. (A1–A4) Electron micrographs of myelinated axons in group A 7, 14, 21, and 28 days after sciatic nerve injury, bar = 5 µm. (B1–B4) Electron micrographs of myelinated axons in group B 7, 14, 21, and 28 days after sciatic nerve injury, bar = 5 µm. (C) Structure and morphology of myelinated axons before sciatic nerve injury, bar = 5 µm. (D) Quantitative results for the g-ratio (ratio between fiber diameter and axon diameter); two-way ANOVA: F4,26 = 3.583, P < 0.05, day 7 P < 0.05.
-
In research on PNI, models of crush injury and transection injury and repair are the most commonly used models. Different kinds of nerve injury models are used to study and answer different questions with respect to nerve injury and regeneration. In our study, severe Wallerian degeneration was observed in both groups at the myelin level and at the functional/behavioral level at 7 days after sciatic nerve injury, which indicated that the two injury types similarly caused severe degeneration. In the crush injury model, the performance of the injury model was relatively simple and suitable for basic research workers. Histopathologically, axons, the endoneurium and the perineurium are damaged after crush injury, but the epineurium is preserved; this degree of injury is also known as Sunderland Grade IV nerve injury, which is commonly studied by scholars researching peripheral nerve regeneration[15-18]. Exactly the continuity of the epineurium still exists, which is a favorable factor for spontaneous nerve regeneration, and many animal experiments have also confirmed the spontaneous regeneration of axons in the crush model [19-22]. In the transection injury model, nerve regeneration is relatively slow and the surgical performance requires a good ability to realize surgical anastomosis between the two stumps of transected nerve to reconstruct the nerve under a microscope, which requires an operator with surgical experience. In addition, transection injury also known as Sunderland grade V nerve injury involves complete nerve transection[23]. Transection injury may result in the formation of more obstacles to nerve regeneration than crush injury. As shown in our results, the two groups of injuries achieved rapid improvement in functional behavior and morphology after 21 days, but the regeneration rate of the transection injury group was significantly lower than that of the crush injury group, which may also be because the transection injury group needs to overcome more repair barriers, and this regenerative state persisted until 28 days of the study.
An important factor responsible for the difference in regeneration between the two injury models, we speculate that vascular factors are involved. The vascular system plays a key role in nerve regeneration by providing nutrients, oxygen, and other blood-borne factors to support the growth of nerve protrusions and the activity of cell populations that support regeneration[24]. The degree of neovascularization after nerve injury is related to the degree of nerve regeneration and ischemia[25, 26]. Axonal growth is an important determinant of neovascularization after trauma, while nerve ischemia leads to a delay in neovascularization and nerve regeneration[27]. The difference in the time point of revascularization between the transection injury model, in which vessels need to re-establish vascular connections, and the crush injury model, in which the original vascular bridge is repaired, may be an important cause of the difference in regeneration between the two models. Additionally, during nerve regeneration, regenerated axons must travel from the proximal end of the nerve to the distal end along with the vasculature through the newly created nerve bridge and then to the target muscle[28, 29]. Unlike the process of transection injury that requires reconnection of blood vessels, the continuity of the outer membrane of the vascular system around the crushed nerve tissue is retained, contributing to the restoration of blood circulation and the acquisition of nutrients to promote nerve regeneration. As our results showed, at 14 days, the number of new myelin sheaths in the crush injury group was significantly higher than that in the transection injury group, indicating that the crush injury group showed a faster regeneration rate than the transection injury group in terms of tissue morphology. However, there was no difference in functional performance such as sciatic nerve function and electrophysiological examination, because the nerve has not yet achieved complete functional connectivity, and the muscle has not achieved reinnervation, which can also be reflected in the results of wet weight ratio and retrograde labeled neurons.
Nerves usually undergo three stages of change after injury. The functional and morphological changes in the crush injury and transection injury models were reflected in the three stages. Through the observation of these three stages, especially in the regeneration stage, there was a gap in the regeneration rate between the two groups, and the difference in the regeneration efficiency was nearly 7 days. The following are the three stages: 1) Degeneration: Wallerian degeneration is a unique structural form of axonal degeneration[30]. During the first stage of Wallerian degeneration, a large number of axon and myelin fragments are produced, and macrophages and circulating monocytes residing in the neural tissue differentiate into activated macrophages that help to remove them[15, 31-34]. This process can last at least 2 weeks[35, 36]. Electron microscopy clearly revealed that unlike the normal the myelin sheath, the injured myelin sheath underwent Wallerian degeneration and that there was an increase in the aggregation of macrophages and swollen mitochondria and an increase in the vascular diameter in the early phase. cMAPs can also be used to determine axon continuity and number; the decrease in the cMAP amplitude and the delayed latency time are proportional to the degree of axonal loss[37]. There was no difference in the motor wave amplitude, used to verify the rate of self-regeneration, between the two groups at 7 days, indicating that both injury models were undergoing a severe degeneration process. However, in the transection injury group, the hind limb stance width was abnormally large at 7 days, possibly due to the stress response. 2) Regeneration: Schwann cells (SCs), endoneurial fibroblasts and macrophages produce a microenvironment that supports axonal regeneration after injury, allowing successful regeneration of proximal nerve fiber ends. After 14 days of nerve injury, SCs secrete a large amount of growth factors to promote cell proliferation, forming a "Büngner band", which forms a physical guide for axonal regeneration and participates in endoneurial regeneration[38]. From a functional behavioral standpoint, the crush injury model showed significantly better motor function than the transection injury model group, with a steady increase in gait control. Mechanical stimulation of the injured hind paws with calibrated forceps revealed that the crush injury model showed faster and better recovery of sensory function, which may be related to neuropathic pain associated with severed nerves[39] via retrograde labeling, it was found that unlike the crush group, no neuromuscular junctions had formed in the transection injury group at 14 days. The rate of new myelin sheath generation in the crush group was significantly higher than that in the transection group, but there was no difference in myelin thickness or fiber thickness (g-ratio), indicating that the difference in the number of axons is an important factor causing the different regeneration rates in the two injury models. Differences in nerve regeneration occur at this stage and continue thereafter. 3) Myelination: Three to 4 weeks after injury, SCs redifferentiate into myelinated SCs and remyelinate regenerating axons. Maturation is required before functional connections can be completed, which includes myelin regeneration, axon enlargement, and finally functional nerve regeneration. Several factors that determine the extent of nerve regeneration after nerve injury: the amount and route of nerve axon regeneration, the rate of nerve regeneration, the retention of target tissue structure and the reformation of synaptic connections[40]. Twenty-one days after injury, the motor current amplitude was significantly higher in the crush injury group, and the changes in latency time resulted in the opposite motor wave amplitude, indicating that there were many regenerated axons. Regarding the wet weight of the gastrocnemius muscle and retrograde labeling neuron counts in the transection injury group both had been reinnervated and regenerated significantly but still at a lower rate than in the crush group.
At the same time, a scar can form inside the crushed nerve bundle and within the anastomosed nerve bridge of the transection injury, hindering the nerve regeneration process and leading to misorientation and abnormal regeneration of the new axon[2]. Leila et al. confirmed the formation of scar tissue around the sciatic nerve after laceration, crush, mince and burn injury models by histological Masson trichrome staining analysis in an animal model of induced scar formation[41]. Also, a study of rabbit sciatic nerve injury showed that the accumulation of collagen rich material and nerve scar formation in the nerve bundle membrane could be observed after 1 week of crush injury, which may alter nerve regeneration and hinder its function[42]. Another optic nerve crush injury experiment demonstrated that extracellular molecules and monocytes are key factors in the pathogenesis of optic nerve fibrosis scar formation[43]. Geraldo and Gordon-Weeks showed that the nerve regeneration process is also inhibited by the collagen component of the scar tissue, while the axonal growth process leads to the release of proteases and fibrinogen activators that promote scar tissue degradation[44], and the outcome may vary depending on the mode of injury.
Based on our results and literature reports, we suggest that crush injury models can be used to more quickly and efficiently study the role of a single gene, growth factor, or inflammatory factor or the effects of external stimulation or pharmacological methods. However, nerve injury and repair involve the use of grafts from different sources, such as autografts, biomaterials used as nerve guide catheters (tubular conduits) or internal filler. Most of the in vivo experiments were performed in a rat transection injury model, which allowed us to quantitatively assess nerve regeneration (i.e., myelin thickness, axon density and number, g-ratio and so on), functional recovery, and evaluation of target reinnervation[45, 46]. Therefore, the transection injury model can be used to study the entire nerve regeneration process after nerve injury to evaluate the self-nerve regeneration rate, neurovascular reconstruction, changes in the nerve regeneration microenvironment, and the efficiency of artificial nerve conduits, which can simulate the injury repair process observed in the clinic more accurately and promote the preclinical research.
One shortcoming of this study is that the relevant factors involved in the synthesis and secretion of the microenvironment after injury were not verified. However, the results of this study confirmed the differences between the two models, and it realized the purpose of our research. The results at the cellular level may provide an added bonus. However, certain pathological and functional alterations are necessarily determined by the up- and downregulation of genes at the cellular level. The spontaneous axonal regeneration observed after crush injury or section injury and repair in experimental animals is uncommon in humans, as extensive fibrosis often occurs at the lesion site. Although they cannot fully mimic clinical nerve regeneration, these models can provide a basis for clinical treatment through early intervention based on differences in the rate of nerve regeneration.
-
Based on the above findings, we concluded that at 14 days, the rate of nerve axon regeneration was significantly faster in the crush group than in the section injury and repair group, and at 21 days, a significant neuromuscular connection could be established in the section injury and repair group. Additionally, we inferred the factors affecting the 7-day time difference in nerve regeneration between the two groups: the vascular system, the basement membrane-associated "Büngner band" and the formation of scar tissue. In addition, on this basis, we suggest that the transection injury and repair model be used to study the entire self-nerve regeneration process after nerve injury to evaluate the nerve regeneration rate, neurovascular factors and changes in the nerve regeneration microenvironment and the efficiency of autografts or biomaterials. In contrast, crush injury models can be used to more quickly and efficiently study a single gene, growth factor or inflammatory factor; the effect of external stimulation or pharmacological methods; and pathological changes.
HTML
Animals
Surgical Procedures
Behavioral Tests
Evaluation of the Gastrocnemius
Calibrated Forceps
Electrophysiological Examination
Retrograde Labeling
Evaluation of Myelinated Axons
Statistical Analysis
CatWalk Gait Analysis
Calibrated Forceps
Evaluation of the Gastrocnemius
Electrophysiological Examination
Retrograde Labeling
Quantitative Axon Measurements
CONFLICT OF INTEREST No conflict of interest to declare.

 Quick Links
 DownLoad: