


-
The occurrence and development of tuberculosis (TB) result from the struggle between Mycobacterium tuberculosis (Mtb) and human immune defenses, mainly pulmonary tuberculosis (PTB). Approximately 5% of the infected people will develop PTB in a short time, and approximately 95% of the infected people will enter a long-term latent tuberculosis infection (LTBI) state; approximately 5% of these people will develop active PTB in a few years to decades. The lifetime risk of individuals with Mtb infection developing active diseases is approximately 5%–10% [1]. TB is a major public health challenge worldwide. Although China has made significant progress in the prevention and control of TB in the past [2,3], until 2020, China still had the second-highest TB burden in the world, with an estimated number of new cases of 842,000 (833,000 in 2019) and an incidence rate of 59/100,000 (58/100,000 in 2019) [4]. Furthermore, except for a few countries such as Kenya, South Africa, and China, most countries have not reached the End TB Strategy milestone by 2020 and will not achieve the control target by 2035 on current downward trends [4].
From 1990 to 2010, China halved the prevalence of TB [5]. However, recent research shows that the decline rate of the TB burden in China slowed down after 2010 [6,7]. Previous studies on PTB trends have mainly focused on analyzing overall trends. We used the Joinpoint regression model to reveal specific trends in the different periods. This method has been widely used to treat both infectious and chronic diseases. Previous studies have analyzed the trend of TB morbidity or mortality in the United States, India, Iran, Canada, and other countries [8-11]. At present, only a few studies have used this method to analyze changes in TB in China, and there is still a lack of refined analysis based on age, sex, and region[5,12].
In the past few decades, China has developed and improved TB prevention and control strategies [13], established and transformed service systems [14], developed and upgraded monitoring systems [15], and implemented other significant processes. National TB prevention and control plans, implementation guidelines, and technical standards at different stages have been issued [16-20]. The social process, economy, culture, and education may play a vital role in the decline in the prevalence of TB. Therefore, it is necessary to explore the possible factors influencing the epidemic trend of PTB during different periods.
This study analyses the notified incidence trend of PTB in different regions and populations in China, reflecting the trend change characteristics of the different periods and refining the direction and magnitude of the changes. This study provides a basis for formulating more accurate TB prevention and control strategies.
-
The TB Management Information System (TBIMS) is a web-based database launched nationwide in 2005 that covers all TB control institutions (health care centers dedicated to TB prevention, treatment, and research). Through this system, the information of patients with PTB is entered in real-time, including basic information, diagnosis, treatment, management, and outcome. The entry process requires proofreading electronic medical case information, and then epidemic management personnel analyze the quality indicators to grasp quality control strictly. TBIMS and the Infectious Diseases Reporting System (IDRS) exchange data in real-time [21], and epidemic reporting personnel follow up and confirm suspected cases as required based on information cards. We pooled the reported cases of PTB with onset dates between 2005 and 2020 and aggregated them annually by county-level regions (because of the accessibility of data, this study did not include Hong Kong, Macao, and Taiwan), age, and sex (male/female). The different age groups were divided into children (0–14 years), youth (15–34 years), middle-aged (35–64 years), and older (65 years and older).
We used demographic data aggregated annually by age and sex in county-level regions from 2005 to 2020 derived from the Integrated Management Information System for Disease Prevention and Control. The regional code table for infectious disease reports included each county-level region’s urban or rural classification for each year, based on which the regional categories (urban/rural) of PTB cases and population data were determined.
Standard population data were derived from China’s 2010 census data, edited by the Census Office of the State Council and the Department of Population and Employment Statistics of the National Bureau of Statistics [22]. In addition, we used aggregated provincial data grouped by urban and rural areas (cities and towns merged into urban areas, while townships were rural), sex, and age.
-
We divided the 31 provinces of mainland China into seven geographical regions: [23] North (Beijing, Tianjin, Hebei, Inner Mongolia, and Shanxi), Northeast (Liaoning, Jilin, and Heilongjiang), East (Shanghai, Jiangsu, Zhejiang, Fujian, Shandong, Anhui, and Jiangxi), Central (Henan, Hubei, and Hunan), South (Guangdong, Hainan, and Guangxi), Southwest (Chongqing, Sichuan, Guizhou, Yunnan, and Tibet), and Northwest (Shaanxi, Gansu, Qinghai, Ningxia, and Xinjiang), the percentage of the rural population was calculated based on the permanent population data from 2005 to 2020, which were 45.0%, 27.0%, 39.8%, 55.1%, 36.6%, 55.2%, and 59.8%, respectively (Figure 1).
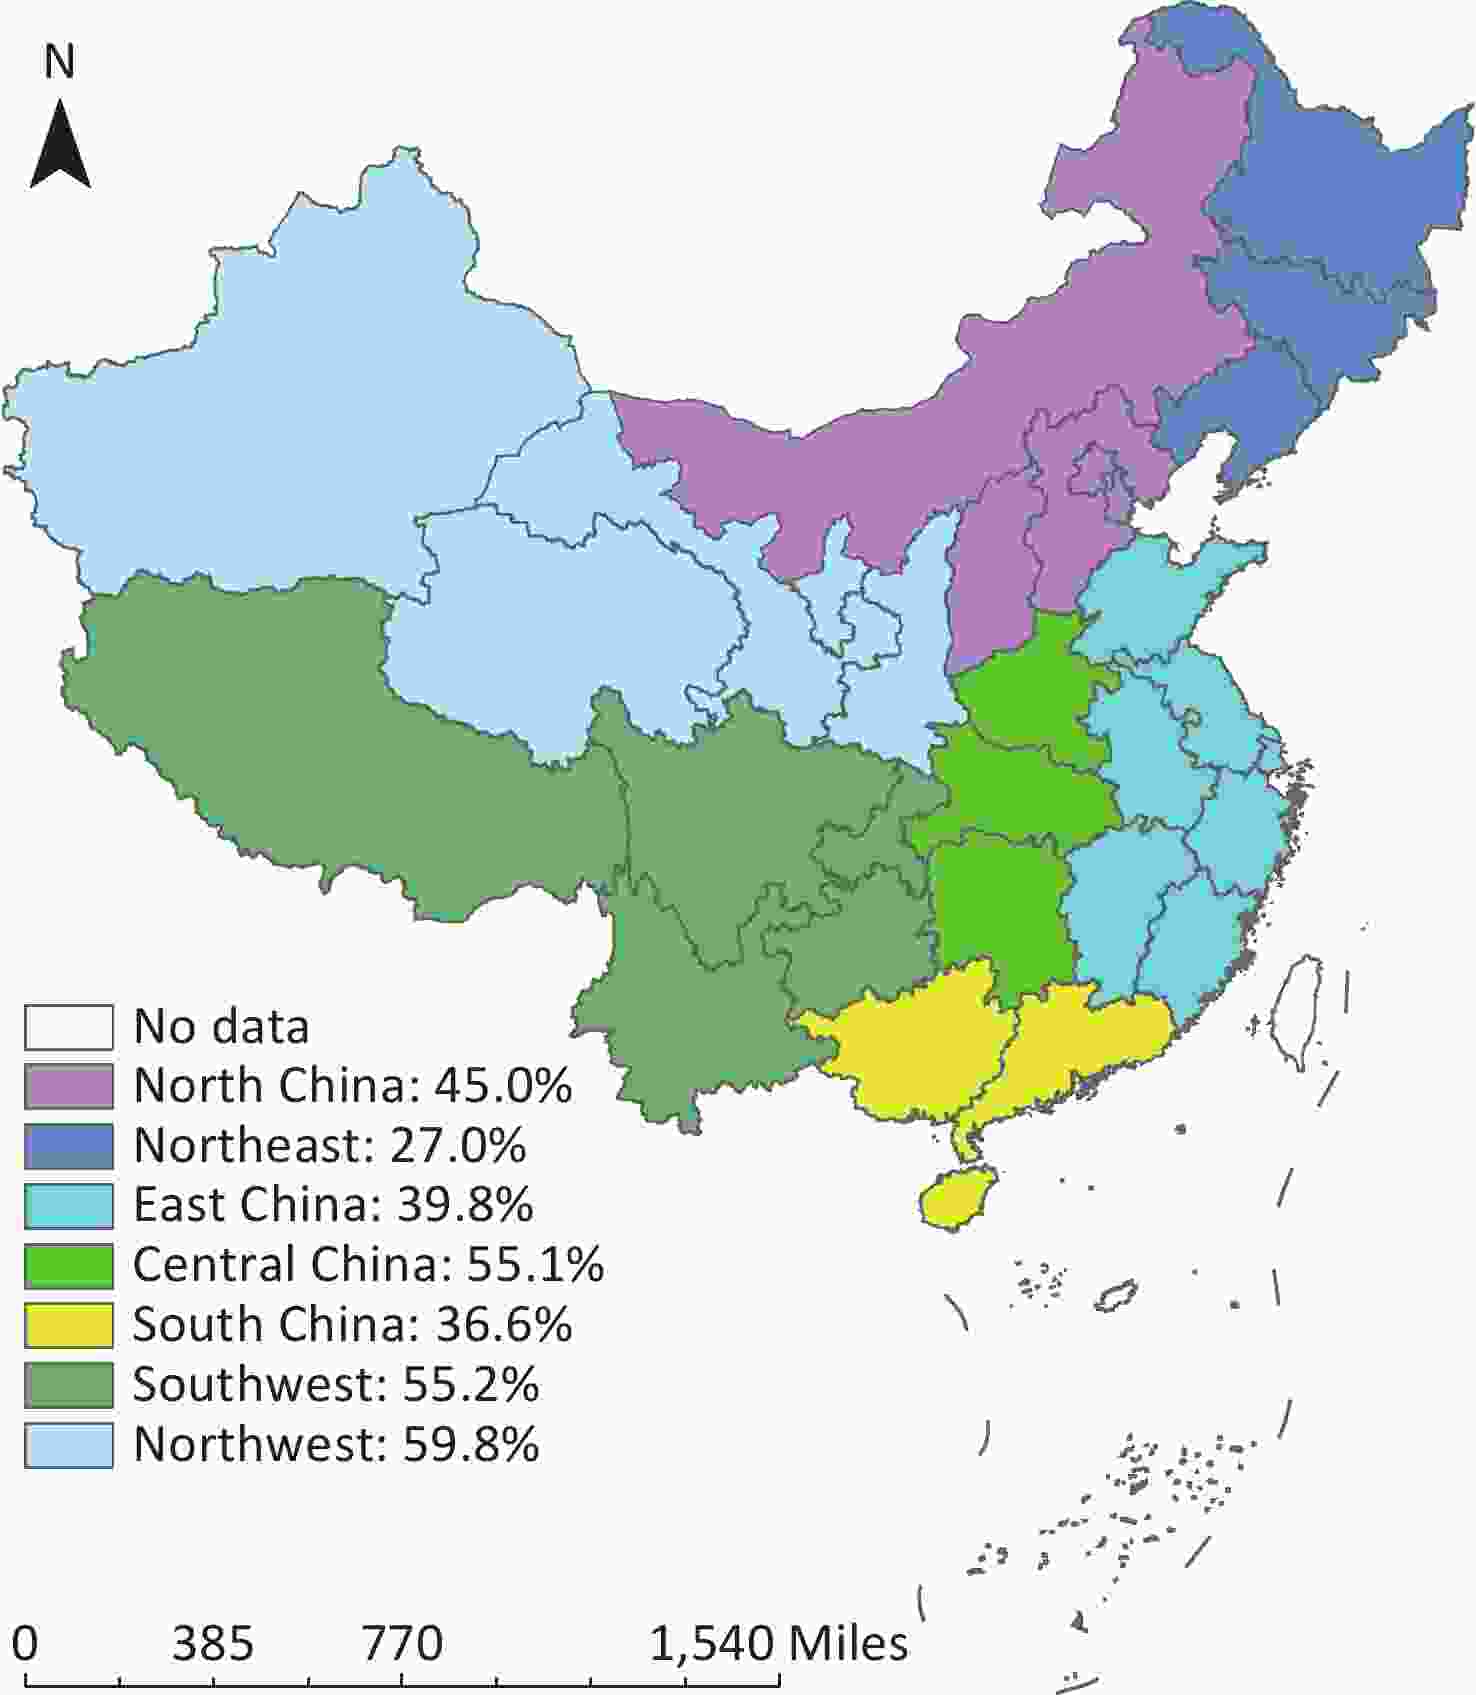
Figure 1. Proportion of rural population in seven regions of China, 2005–2020.
Age-standardized rates (ASRs) were calculated based on the standard population grouped by 5 years to assess the differences between sex, urban and rural areas, and geographic regions of PTB.
The Joinpoint regression model based on natural logarithmic conversion was applied to analyze the fragment trend of notified cases to identify rising or falling trends and their statistical significance. We used grid search method (GSM) modeling, the Monte Carlo permutation test, and Bayesian information criterion methods for model optimization. We selected the final model based on the mean squared error (MSE) obtained from the model estimate (the smaller the MSE value, the better the fitting) [24]. The average annual percentage change (AAPC), annual percentage change (APC), and 95% confidence interval (CI) were calculated. When the 95% CI did not contain a 0, the AAPC and APC indicators were statistically significant, describing the trend as “rising” or “falling” according to the plus or minus of the indicator. The absolute value size reflected the magnitude of the change, and the indicators without statistical difference represented a “stable” trend. The analysis was conducted using the Joinpoint regression program (version 4.9.0.0, released March 2021) developed by the National Cancer Institute at the National Institutes of Health.
-
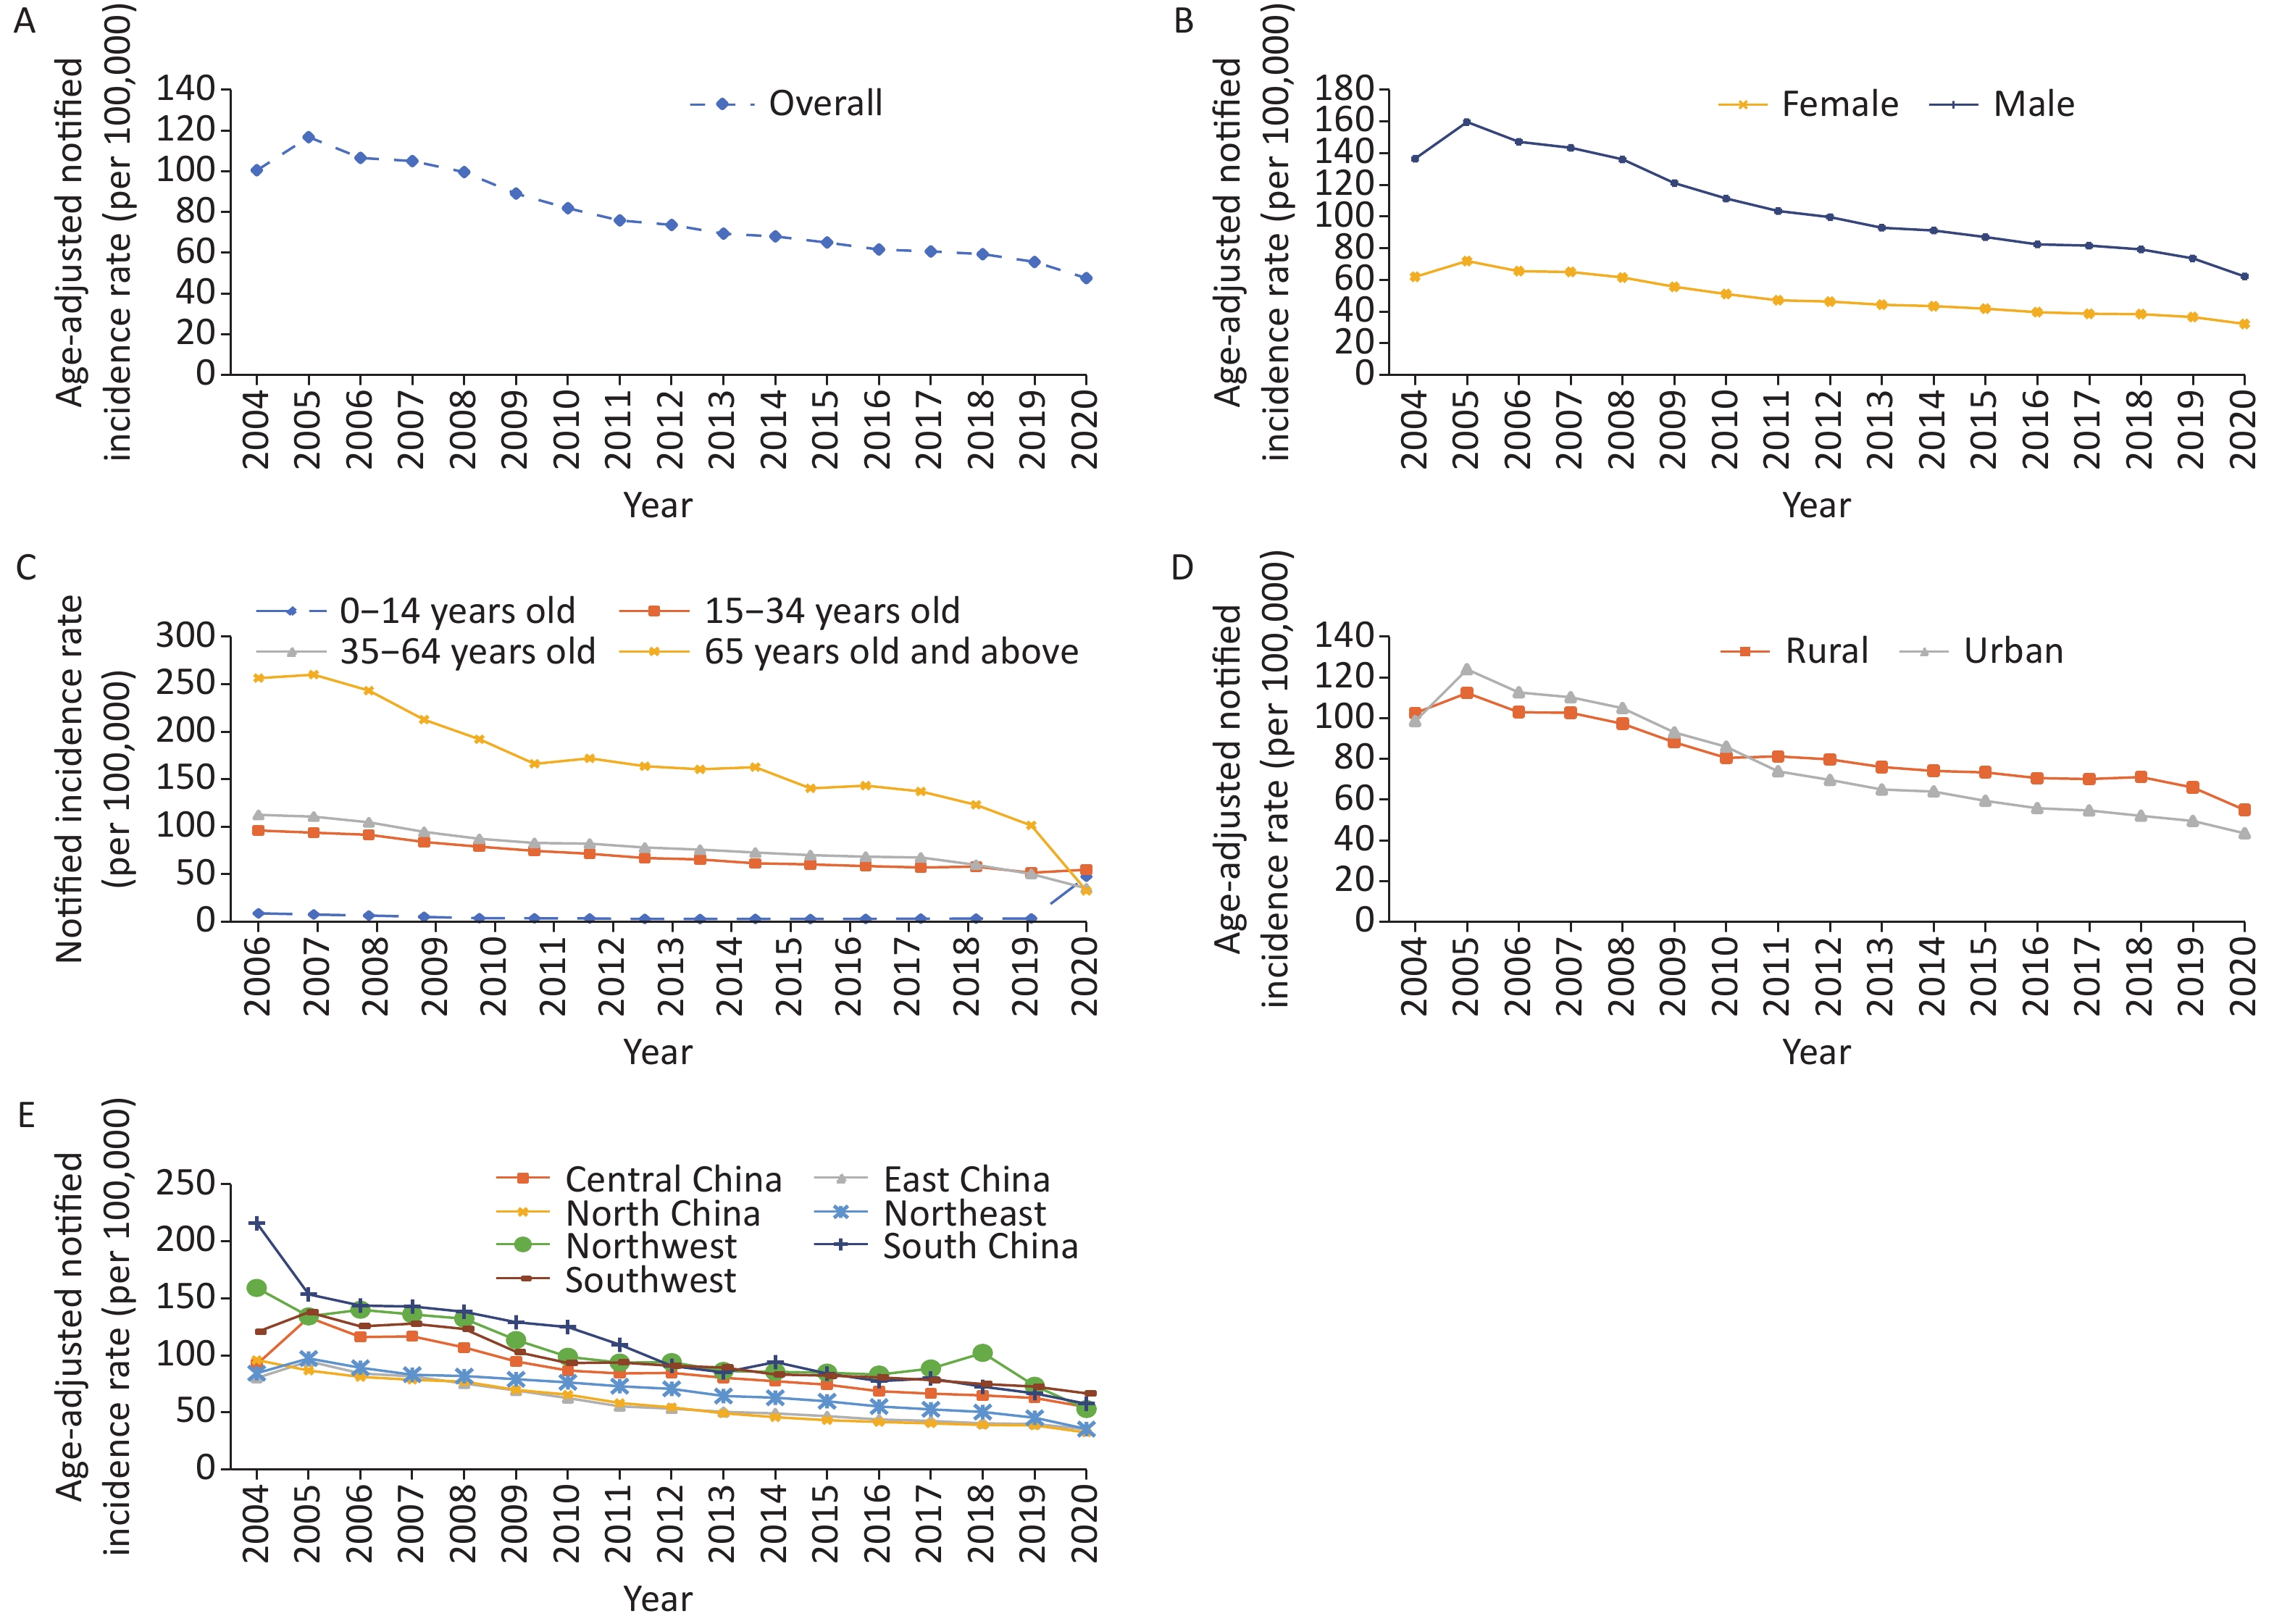
From 2005 to 2020, a total of 16.2 million PTB cases were reported, with an average reported incidence of 75.5 per 100,000 population, and the notified incidence declined by 55% from 2005 (1.4 million cases, 108.3 per 100,000 population) to 2020 (0.7 million cases, 49.2 per 100,000 population). The average ASR is per 100,000 individuals. The ASR was the highest in 2005 (116.9 per 100,000 population) and the lowest in 2020 (47.6 per 100,000 population), with a slower rate of decline after 2011 (Figure 2A).
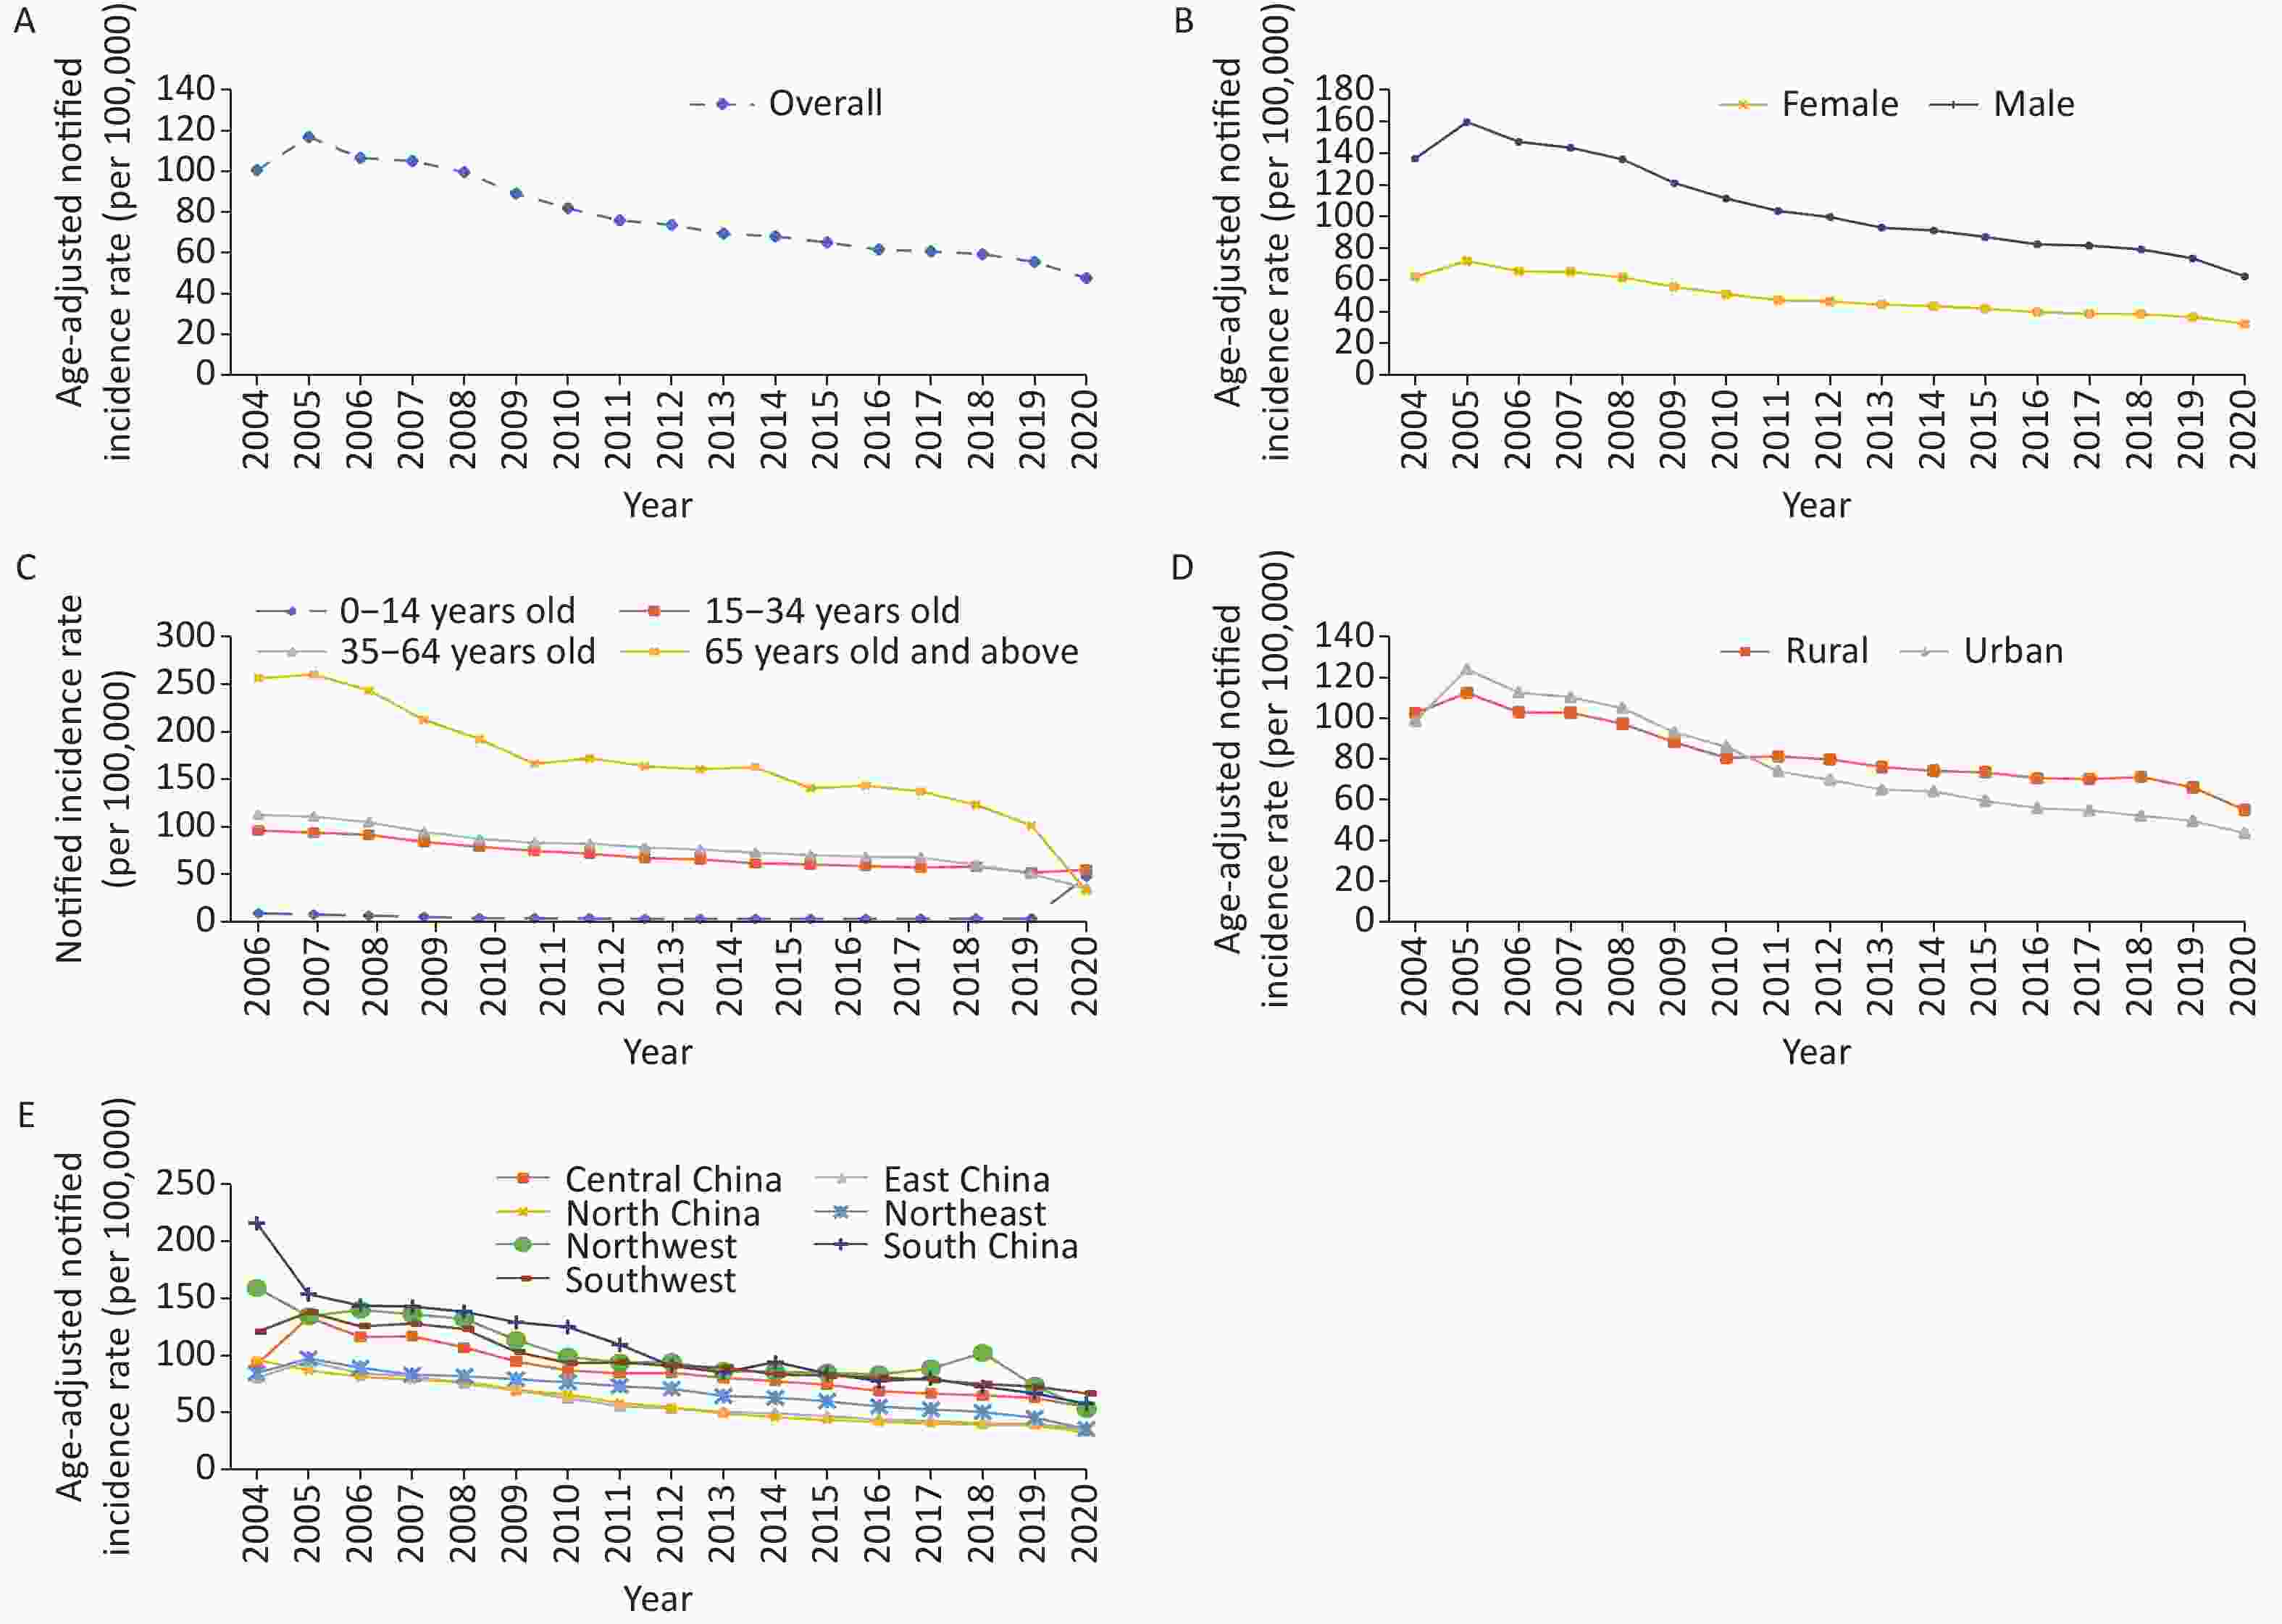
Figure 2. Changes in the notified incidence of PTB rate in China. (A) overall; (B) female vs. male; (C) 4 age groups: (D) urban vs. rural; (E) 7 geographic areas.
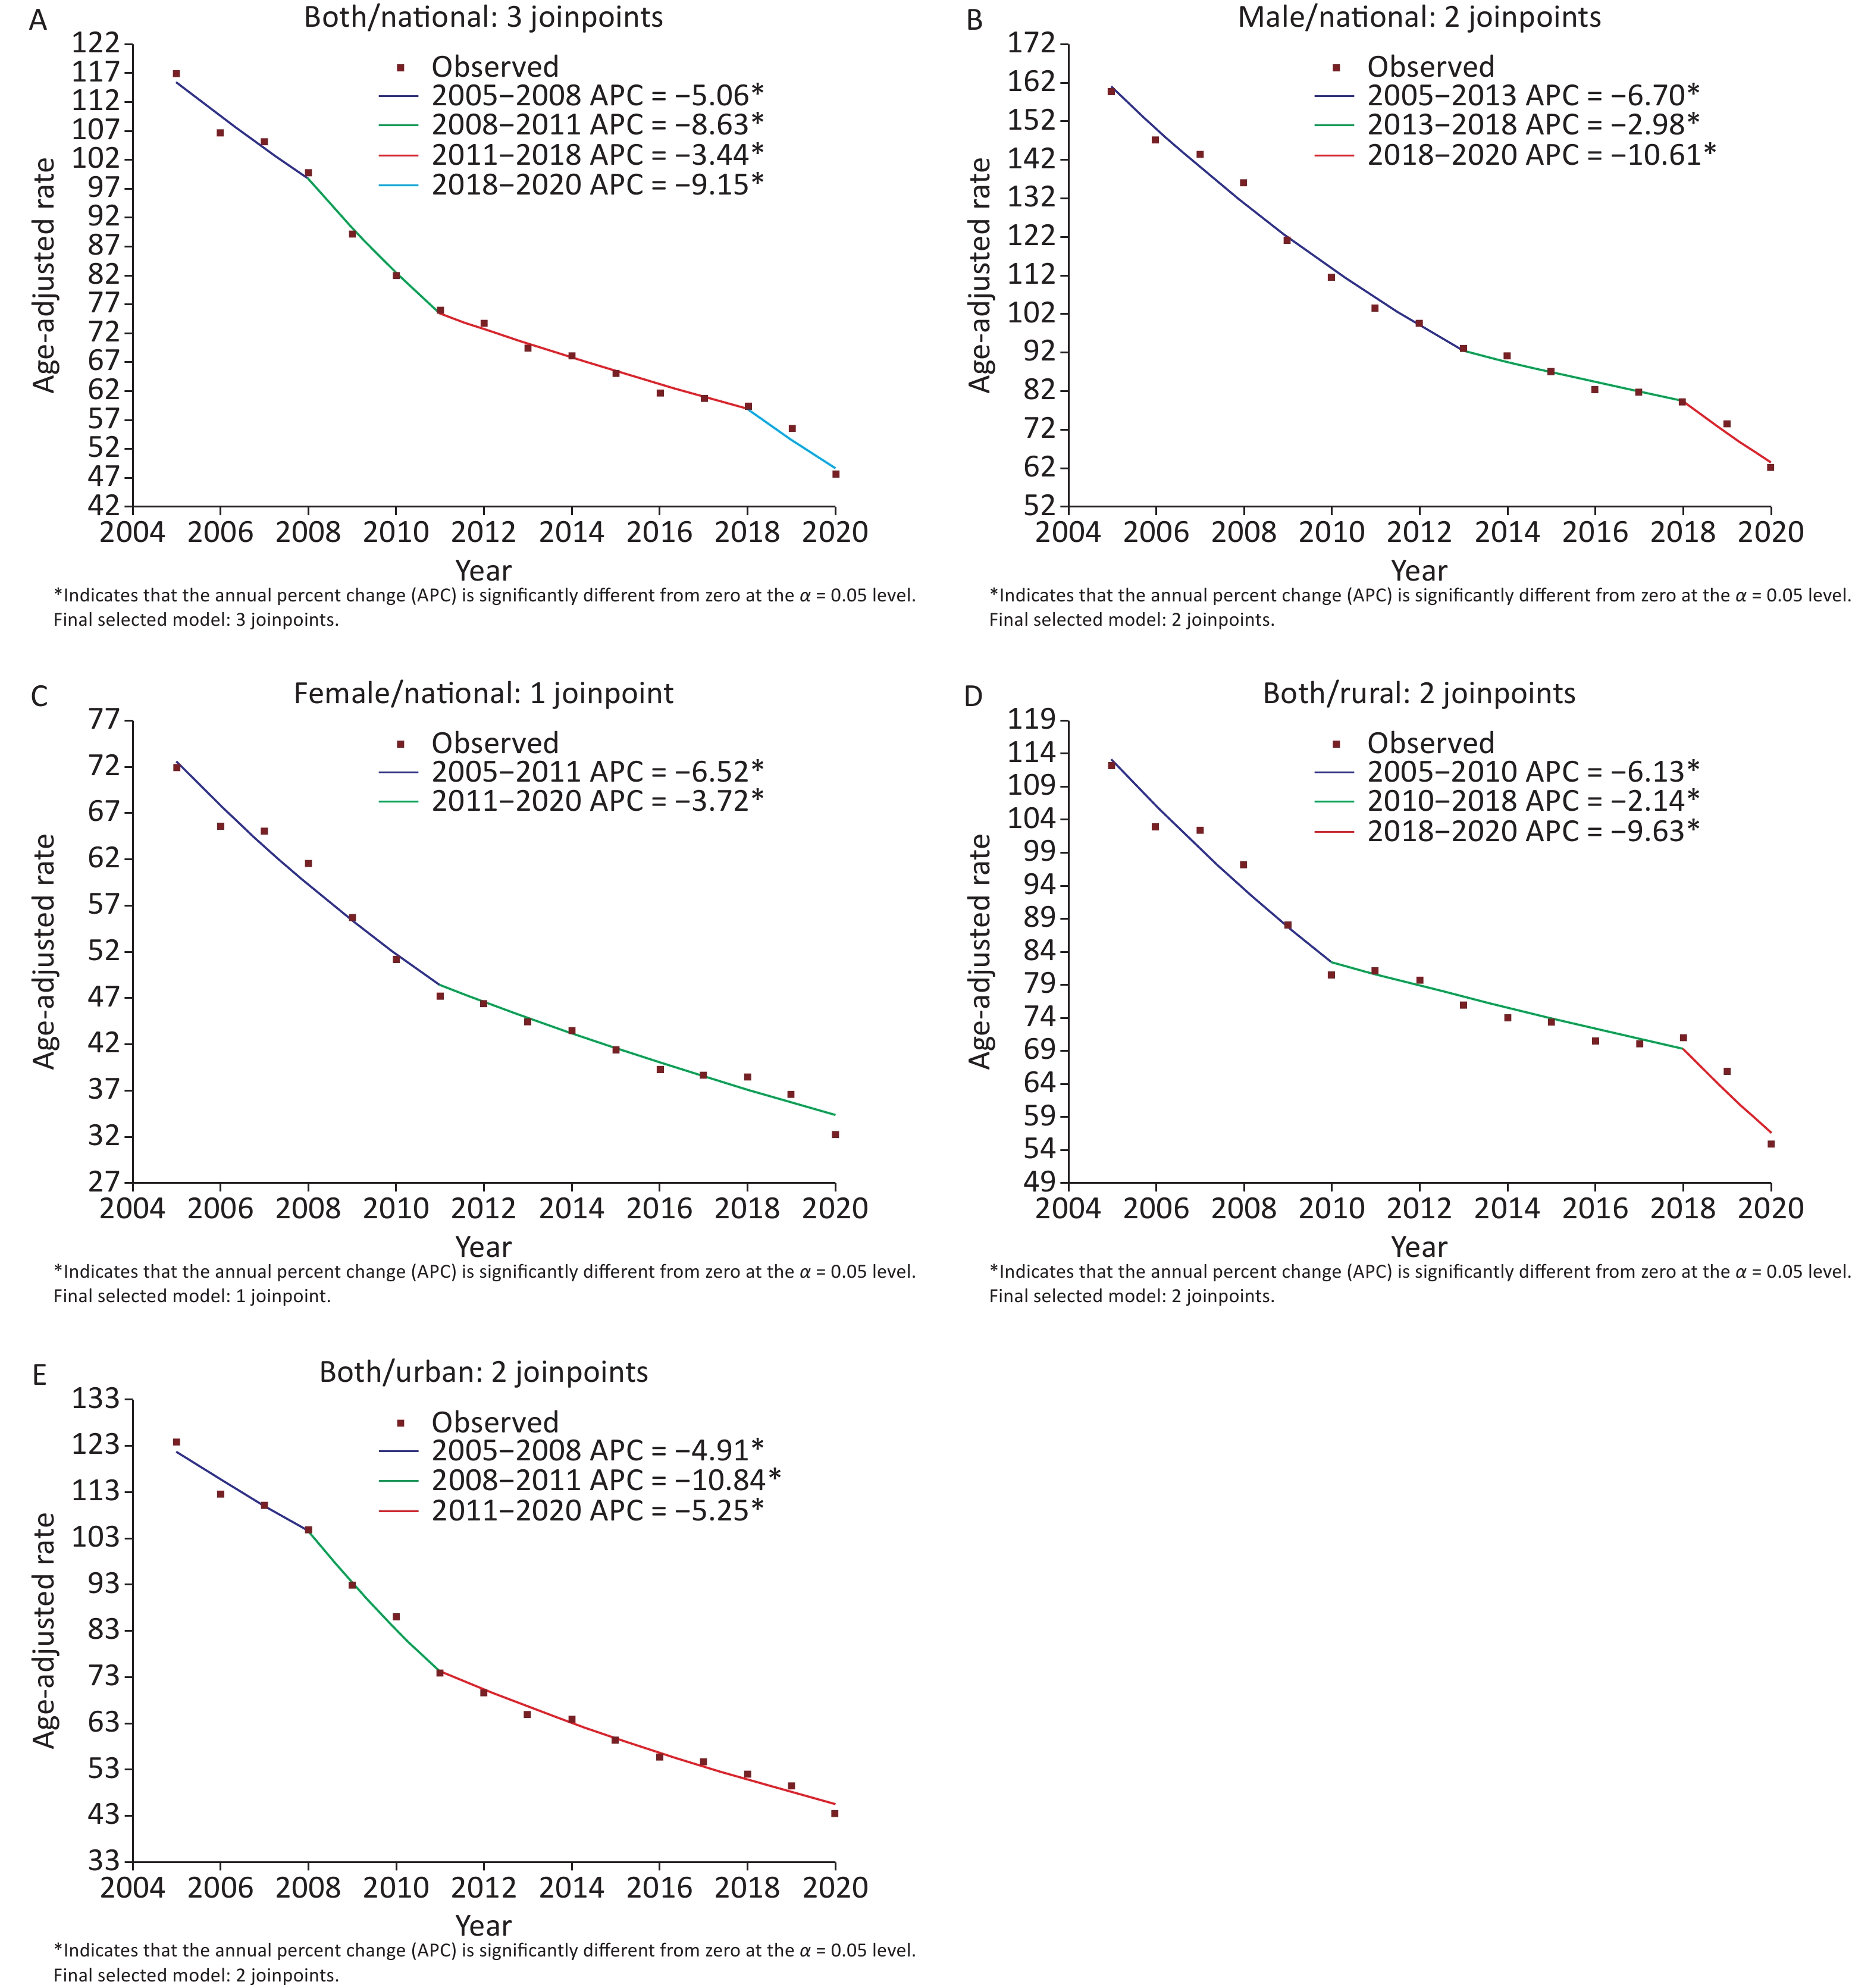
Joinpoint regression analysis showed that the reported incidence rate of TB in China decreased by 5.6% annually from 2005 to 2020 (APC = −5.6, 95% CI: −7.0 to −4.2), showing different trends in four periods. The largest changes occurred in 2018. (Table 1 and Supplementary Figure S1, available in www.besjournal.com). Segment analysis showed a 5.1% decline from 2005 to 2008 (APC = −5.1, 95% CI: −7.9 to −2.2), a larger decline occurred in 2008–2011 (APC = −8.6, 95% CI: −14.5 to −2.4), the smallest decline occurred in 2011–2018 (APC = −3.4, 95% CI: −4.6 to −2.3), and the largest decline occurred in 2018–2020 (APC = −9.2, 95% CI: −16.4 to −1.3).
Characteristics Year Notification rates of PTB cases# Annual percent change (95% CI) AAPC (95% CI) Overall 2005–2008 108.3–94.6 −5.1* (−7.9, −2.2) −5.6* (−7.0, −4.2) 2008–2011 94.6–75.6 −8.6* (−14.5, −2.4) 2011–2018 75.6–61.6 −3.4* (−4.6, −2.3) 2018–2020 61.6–49.2 −9.2* (−16.4, −1.3) Sex Female 2005–2011 67.7–46.7 −6.5* (−7.8, −5.3) −4.9* (−5.5, −4.2) 2011–2020 46.7–31.8 −3.7* (−4.6, −2.9) Male 2005–2013 146.6–93.9 −6.7* (−7.5, −5.9) −6.0* (−7.3, −4.7) 2013–2018 93.9–82.9 −3.0* (−5.5, −0.3) 2018–2020 82.9–65.9 −10.6* (−18.8, −1.5) Age group 0–14 2005–2010 10.8–3.9 −17.4* (−18.6, −16.1) −7.3* (−8.6, −6.0) 2010–2014 3.9–3.0 −9.1* (−13.8, −4.0) 2014–2020 3.0–3.5 3.3* (1.4, 5.2) 15–34 2005–2015 101.3–61.6 −4.9* (−5.4, −4.4) −4.2* (−4.8, −3.6) 2015–2020 61.6–51.8 −2.6* (−4.5, −0.8) 35–64 2005–2011 125.4–83.0 −6.5* (−7.5, −5.5) −5.8* (−6.8, −4.7) 2011–2018 83.0–67.8 −3.0* (−4.2, −1.9) 2018–2020 67.8–50.4 −12.7* (−19.4, −5.3) ≥ 65 2005–2011 280.6–166.3 −7.3* (−9.9, −4.5) −6.4* (−9.2, −3.5) 2011–2020 166.3–101.4 −4.9* (−6.5, −3.2) Rural or urban Rural 2005–2010 100.9–75.3 −6.1* (−7.4, −4.9) −4.5* (−5.5, −3.5) 2010–2018 75.3–71.8 −2.1* (−3.1, −1.2) 2018–2020 71.8–56.3 −9.6* (−16.7, −1.9) Urban 2005–2008 117.3–100.1 −4.9* (−8.3, −1.4) −6.3* (−7.7, −4.9) 2008−2011 100.1−74.2 −10.8* (−17.5, −3.6) 2011−2020 74.2−44.8 −5.3* (−6.0, −4.5) Region Central China 2005−2010 122.9−84.4 −7.4* (−9.2, −5.5) −5.2* (−6, −4.5) 2010−2020 84.4−57.4 −4.1* (−4.9, −3.3) East China 2005−2011 86.5−54.5 −8.2* (−9.1, −7.3) −6.1* (−6.5, −5.6) 2011−2020 54.5−36.4 −4.6* (−5.3, −4) North China 2005−2008 79.6−72.0 −4.0* (−7.7, −0.1) −5.9* (−6.9, −4.8) 2008−2014 72.0−46.0 −8.0* (−9.8, −6.1) 2014−2020 46.0−32.6 −4.6* (−6.3, −2.9) Northeast 2005−2018 89.3−53.0 −4.6* (−5, −4.3) −6.2* (−7.3, −5.1) 2018−2020 53.0−37.4 −15.8* (−23.4, −7.4) Northwest 2005−2014 124.7−90.3 −6.3* (−8, −4.6) −6.4* (−10, −2.7) 2014−2018 90.3−113.2 5.2 (−5.5,17) 2018−2020 113.2−58.7 −26.4* (−42.9, −5.1) South China 2005−2020 136.3−60.3 −5.9* (−6.5, −5.3) −5.9* (−6.5, −5.3) Southwest 2005−2011 132.6−93.4 −6.6* (−8.6, −4.7) −4.5* (−5.5, −3.5) 2011−2020 93.4−70.1 −3.0* (−4.3, −1.8) Note. #Per 100,000 people notified in the first and last years of the segment. *Indicates that APCs (annual percentage change) and AAPCs (average annual percentage change) are significantly different from 0 at an alpha level of 0.05. PTB: pulmonary tuberculosis. Table 1. Joinpoint regression analysis results of notified incidence of PTB in China
-
The ASR of males was perennially higher than that of females, with an average of 104.6 (/100,000) and 48.8 (/100,000), respectively (Figure 2B). From 2005 to 2020, the average annual percentage change for males and females decreased by 6.0% and 4.9%, respectively. In 2005, the ASR of males was 159.8 (/100,000), and that of females was 72.0 (/100,000). In 2020, the ASR of males was 62.2 (/100,000), and that of females was 32.3 (/100,000). The decline for males narrowed between 2013 and 2018, with the maximum downtrend between 2018 and 2020 (APC = −10.6, 95% CI: −18.8 to −1.5). The decline for females was the largest between 2005 and 2011 (APC = −6.5, 95% CI: −7.8 to −5.3).
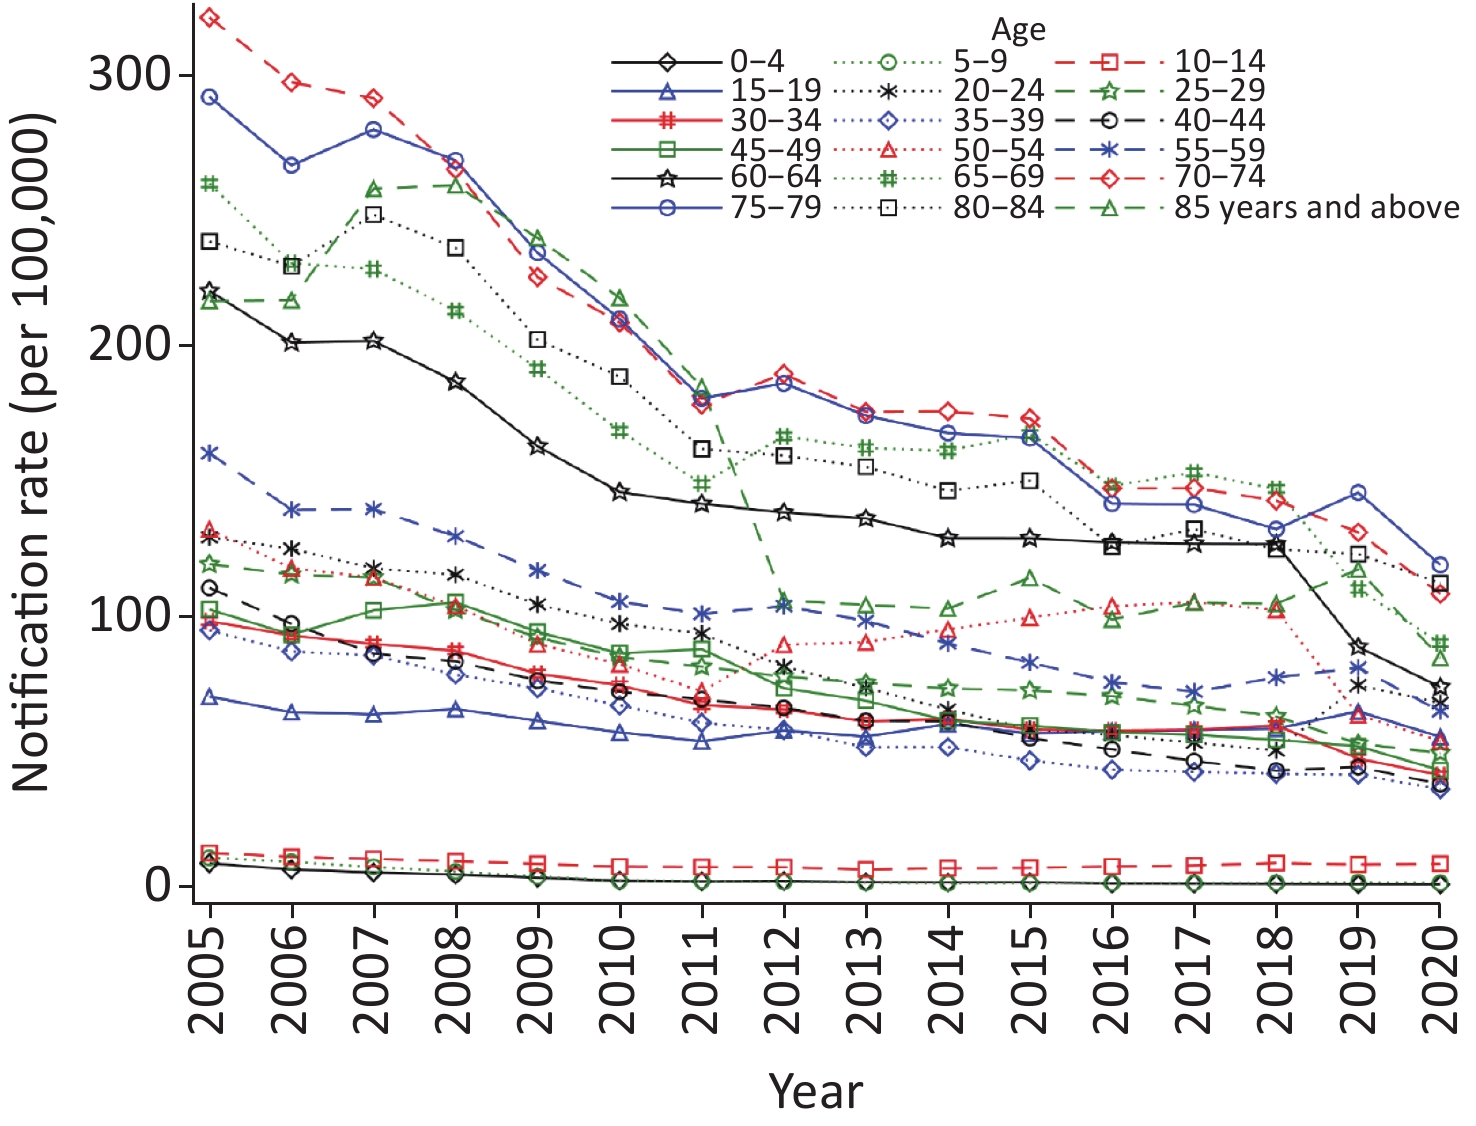
Among the different age groups, the average notification rate was the highest among older adults (65 years and older) (182.3/100,000), followed by middle-aged (35–64 years) (84.1/100,000), young people (15–34 years) (73.3/100,000), and children with the lowest (0–14 years) (4.8/100,000). From 2005 to 2020, the different age groups showed a downward trend, but the changes were noticeable (Table 1, Figure 2C, and Supplementary Figure S2, available in www.besjournal.com). The percentage change for children declined by 7.3% annually, with the most significant decline between 2005 and 2010 (APC = −17.4, 95% CI: −18.6 to −16.1) and a smaller decline from 2010 to 2014. However, it increased significantly by 3.3% between 2014 and 2020 (95% CI: 1.4 to 5.2). For young people, the average annual decline was 4.2%, with the smallest decline between 2015 and 2020 (APC = −2.6, 95% CI: −4.5 to −0.8). For middle-aged adults, the average annual decline was 5.8%, with the smallest decline between 2011 and 2018 and the largest decline between 2018 and 2020 (APC = −12.7, 95% CI: −19.4 to −5.3). For older adults, the average annual decline was 6.4%, with the smallest decline between 2011 and 2020 (APC = −4.9, 95% CI: −6.5 to −3.2).
-
The average ASR in rural areas (81.3 per 100,000) is higher than that in urban areas (76.1 per 100,000). From 2005 to 2010, the ASR in urban areas was slightly higher than that in rural areas. After 2011, it was continuously higher in rural areas than in urban areas (Figure 2D). From 2005 to 2020, the ASR in urban and rural areas continued to decline, with average annual decreases of 6.3% and 4.5%, respectively. In urban areas, the decline was the largest from 2008 to 2011 (APC = −10.8, 95% CI: −17.5 to −3.6) and smaller after 2011. In rural areas, the decline was the smallest from 2010 to 2018 and the largest between 2018 and 2020 (APC = −9.6, 95% CI: −16.7 to −1.9).
The average ASRs of the seven geographical regions ranged from high to low, as follows: South (103.2/100,000), Northwest (100.1/100,000), Southwest (95.3/100,000), Central (85.9/100,000), Northeast (67.4/100,000), East (57.9/100,000), and North China (56.5/100,000). South, Northwest, and Southwest China were perennially higher, while the East and North China were perennially the lowest (Figure 2E). From 2005 to 2020, all seven regions showed a downward trend with distinct changes during different periods (Table 1). The northwestern region had the maximum overall decline (AAPC = −6.4, 95% CI: −10.0 to −2.7), with a 26.4% decline from 2018 to 2020. The average annual fall was 6.2% (95% CI: −7.3 to −5.1) in the northeast region, with a maximum decline from 2018 to 2020. In East China, the average annual fall rate was 6.1% (95% CI: −6.5 to −5.6), with the most significant decline from 2005 to 2011. In North China, the average annual decline was 5.9% (95% CI: −6.9 to −4.8), with a maximum decline between 2008 and 2014. In South and Central China, the average annual decline was 5.9% (95% CI: −6.8 to −5.3) and 5.2% (95% CI: −6.0 to −4.5), respectively. The lowest annual decline was in the southwest (AAPC = −4.5, 95% CI: −5.5 to −3.5), dropping only 3.0% between 2011 and 2020.
-
This analysis comprehensively reflects the changes in notified incidence of PTB in China from 2005 to 2020. PTB declined by 5.6% annually, with a 55% reduction in the reported incidence rate. Some studies have also found a faster downward trend in China than that in other countries [5,7,25,26]. From 1992 to 2017, the ASR of TB in China (APC = −4.52) decreased more than that in the United States (APC = −3.71) and India (APC = −1.23) [25]. Fragment analysis revealed that the decline changed after 2008, 2011, and 2018. The different magnitudes of the decline may be due to a series of public health policies and measures in China, which will be discussed separately below.
We found that the highest number of cases was reported in 2005, followed by a continuous decline, consistent with the report by Wang et al. [5, 26]. There may be several reasons for this finding. First, in 1994, the World Health Organization (WHO) applied the directly observed treatment of short-course strategy (DOTS) to global TB control. China implemented DOTS in 13 provinces in 1992 through the World Bank loan program. In 2001, the State Council launched a new 10-year plan for TB control. Governments at all levels actively performed their duties and continuously increased funding, and nationwide coverage was achieved in 2005[27]. DOTS effectively reduced the spread of TB in China [28] and improved patient compliance and treatment success rates (the rate in 2010 was estimated to be 85%) [29]. The implementation of this strategy helped China achieve its global TB control goal in 2005[2]. Second, the Law on the Prevention and Control of Infectious Diseases, revised in 2004, requires all health institutions to report diagnosed or suspected cases of TB through the IDRS within 24 hours. The TBIMS, launched in 2005, requires specialized TB hospitals to report information on the diagnosis, treatment, management, and outcome of patients with active TB. These policies have significantly improved the ability to detect patients, shorten the diagnosis delay, and improve the treatment compliance and success rate of patients, thus effectively controlling TB in China.
The more significant decline from 2008 to 2011 (−8.6% vs. −5.1%) may be due to the following: (1) TB is a chronic infectious disease with a longer course of treatment and the possibility of relapse and a series of free testing and treatment policies were released in 2005; thus, the larger reduction in cases observed took some time; (2) since the implementation of the Stop TB Strategy in 2006, halting the increase in the incidence of TB had been one of the main objectives, and challenges such as Mtb and human immunodeficiency virus (HIV) co-infection and multidrug-resistant TB (MDR-TB) had to be addressed. In 2008, China proposed a strategy to prevent, diagnose, treat, and manage TB, thereby further reducing morbidity and mortality [13]. In addition, the decline from 2005 to 2011 was mainly due to the successful application and implementation of multiple rounds of the Global Fund TB program, which effectively promoted TB control in China [30].
However, the rate of decline from 2011 to 2018 was slower than before, and similar results have been reported in other countries [31, 32]. This may be because China’s control strategies have effectively reduced the number of new cases caused by transmission, increased the proportion of active patients treated, and reduced the number of patients. In recent years, the reported cases may have been mainly caused by the reactivation of LTBI, including some high-risk groups such as Mtb and HIV co-infection [33]. The proportion of MDR-TB cases has increased, making treatment more difficult. Delay in diagnosis remains the main obstacle to effective disease management. A survey found that in 2017, more than 60% of cases in China experienced a diagnosis delay, and the median interval from symptom to diagnosis was 23 days [34]. In addition, in 2011, the TB program of the Global Fund in China was almost stopped after its funding was drastically cut, which harmed the implementation of the TB program, which may also be the reason for the slower decline during this period [35].
Notably, the annual decline reported after 2018 was far more extensive than that in the previous period (3.4% vs. 9.2%), with similar changes in other countries [36,37]. On the one hand, mitigation strategies adopted in response to the coronavirus disease 2019 (COVID-19) pandemic have also been effective in reducing the incidence of TB, such as wearing masks and social distancing, which has reduced the transmission of TB [38]. However, the rapid decline might also be due to inadequate diagnosis and reporting of cases. The WHO first reported an increase in TB deaths globally in 2020 since 2005, possibly due to disruptions in the availability and use of essential TB diagnosis and treatment services [4]. An investigation found that the COVID-19 pandemic significantly disrupted TB reporting and follow-up screening in China and might have more long-term effects [39]. We found that the decline in the northeast, northwest, and rural areas, as well as the middle-aged and male groups, increased significantly from 2018 to 2020, suggesting that the COVID-19 pandemic may have mainly disturbed these regions and groups, which requires further research.
The stop TB strategy promoted by the WHO includes patient-centered comprehensive treatment and prevention, and systematic screening and preventive treatment for high-risk groups were core strategies. Therefore, the feature identification of high-risk groups is a significant prerequisite. From 2005 to 2020, the reported incidence of PTB in males was more than twice that in females perennially, although the decline was more extensive in males. Consistent with previous reports, the highest incidence was reported in older adults, consistent with previous reports [40]. This may be mainly due to weakened immunity and comorbidities in the older adult population. In addition, in combination with essential public health services, China has initiated TB screening for older adults aged 65 years and above, which has improved the capacity to detect and report patients. However, due to the aging population, PTB among older adults in China is still high, and the decline rate is slow, consistent with the United States and Japan [41]. Children reported the lowest level (4.8/100,000) and the largest decline, consistent with previous reports [42]. This may be due to the control effect of bacilli Calmette-Guérin (BCG) vaccination. In addition, insufficient case detection and a high under-reporting rate in children are possible reasons. Most notably, PTB among children increased by 3.3% between 2014 and 2020, and the study also reported high-risk and rising trends among 10–14 years old [42,43]. This may be due to the limited duration of BCG protection and the high risk of exposure caused by school agglomeration.
The reported incidence of PTB varies in different areas of China, and control strategies are complicated. However, we found that high-risk clusters shifted from cities to rural areas, and the gap gradually increased, similar to Yang’s conclusion [44]. Before 2011, PTB was reported to be higher in urban areas than that in rural ones. This might be due to better DOTS promotion in urban areas during the study period, which improved the ability of patients to detect TB and the subsequent larger decline, reflecting the effectiveness of control in urban areas.
In the long run, urbanization can effectively reduce the risk of infectious diseases[45]. The reported incidence in rural areas was significantly higher than that in cities after 2011, which may have been influenced by poor socioeconomic and health service levels. Rural areas face challenges, such as delayed diagnosis and referral [46] and an increased proportion of MDR-TB [47]. A survey found that the diagnosis delay of patients in rural areas with TB was 1.44 times longer than those in urban areas [34]. Moreover, the treatment compliance of patients in rural areas was low [48], and more than half of them were hospitalized for at least 10 days, which cost 9%–29% of the per capita income, leading to a catastrophic economic burden [49]. On the other hand, the higher reported incidence in recent years might be a sign of improved healthcare in rural areas. With economic development, the construction of rural medical and health service systems has been continuously strengthened, and patients’ diagnoses and treatment conditions have improved, thus increasing the number of case reports. However, the underlying factors need to be further studied.
The reported incidence in South, Northwest, and Southwest China is higher than that in East and North China. This might be related to social economy, infrastructure, and health services. Studies have reported a higher incidence and a smaller decline in the western region [50-52]. We further confirmed that Southwest China had the smallest decline, whereas Northwest China had the largest decline, signifying that more attention should be paid to Southwest China. A survey found that DOTS implementation in Western China was complex [53], and poor adherence to treatment was due to patients’ lack of health knowledge and insufficient self-management ability [54]. There are many rural residents and ethnic groups in Western China; thus, the control strategies need to be further improved, such as finding feasible DOTS substitution strategies (video observation treatment and SMS reminder medication) [27] and using simple and cost-effective detection methods [55].
-
This study has certain limitations. First, the data on the incidence of PTB potential are under-reported, and the degree of under-reporting could vary between different regions and years. Therefore, there were likely deviations in the comparison of reported levels and trends, and incidence of PTB in China could be underestimated. Second, since 2005, the monitoring system has continuously improved. During this period, diagnostic techniques and reporting standards may also differ, which may significantly affect the reported incidence rate of PTB. Finally, this study did not analyze incidence trends in areas below the provincial level. We will clarify these regional differences in the future.
-
Long-term trend analysis revealed that the reported incidence of PTB in China continued to decline from 2005 to 2020, with a 55% reduction in the reported rate. Among them, the decline has slowed down since 2011 and accelerated in 2019. The decline was greater in males than that in females, but the reported levels were consistently higher. Older adults reported the highest levels, but the decline was slow. Children reported the lowest level and maximum decline, but increased significantly after 2014. Since 2011, high-risk clusters have shifted from urban to rural areas. The southwest reported high levels and minimum declines. Comprehensive intervention strategies should be developed for these high-risk groups and regions, and the cause of the rapid decline after 2018 should be further studied.
-
We thank staff members at the county, prefecture, provincial, and national levels of the Center for Disease Control and Prevention across China for assistance in field investigation, administration, and data collection.
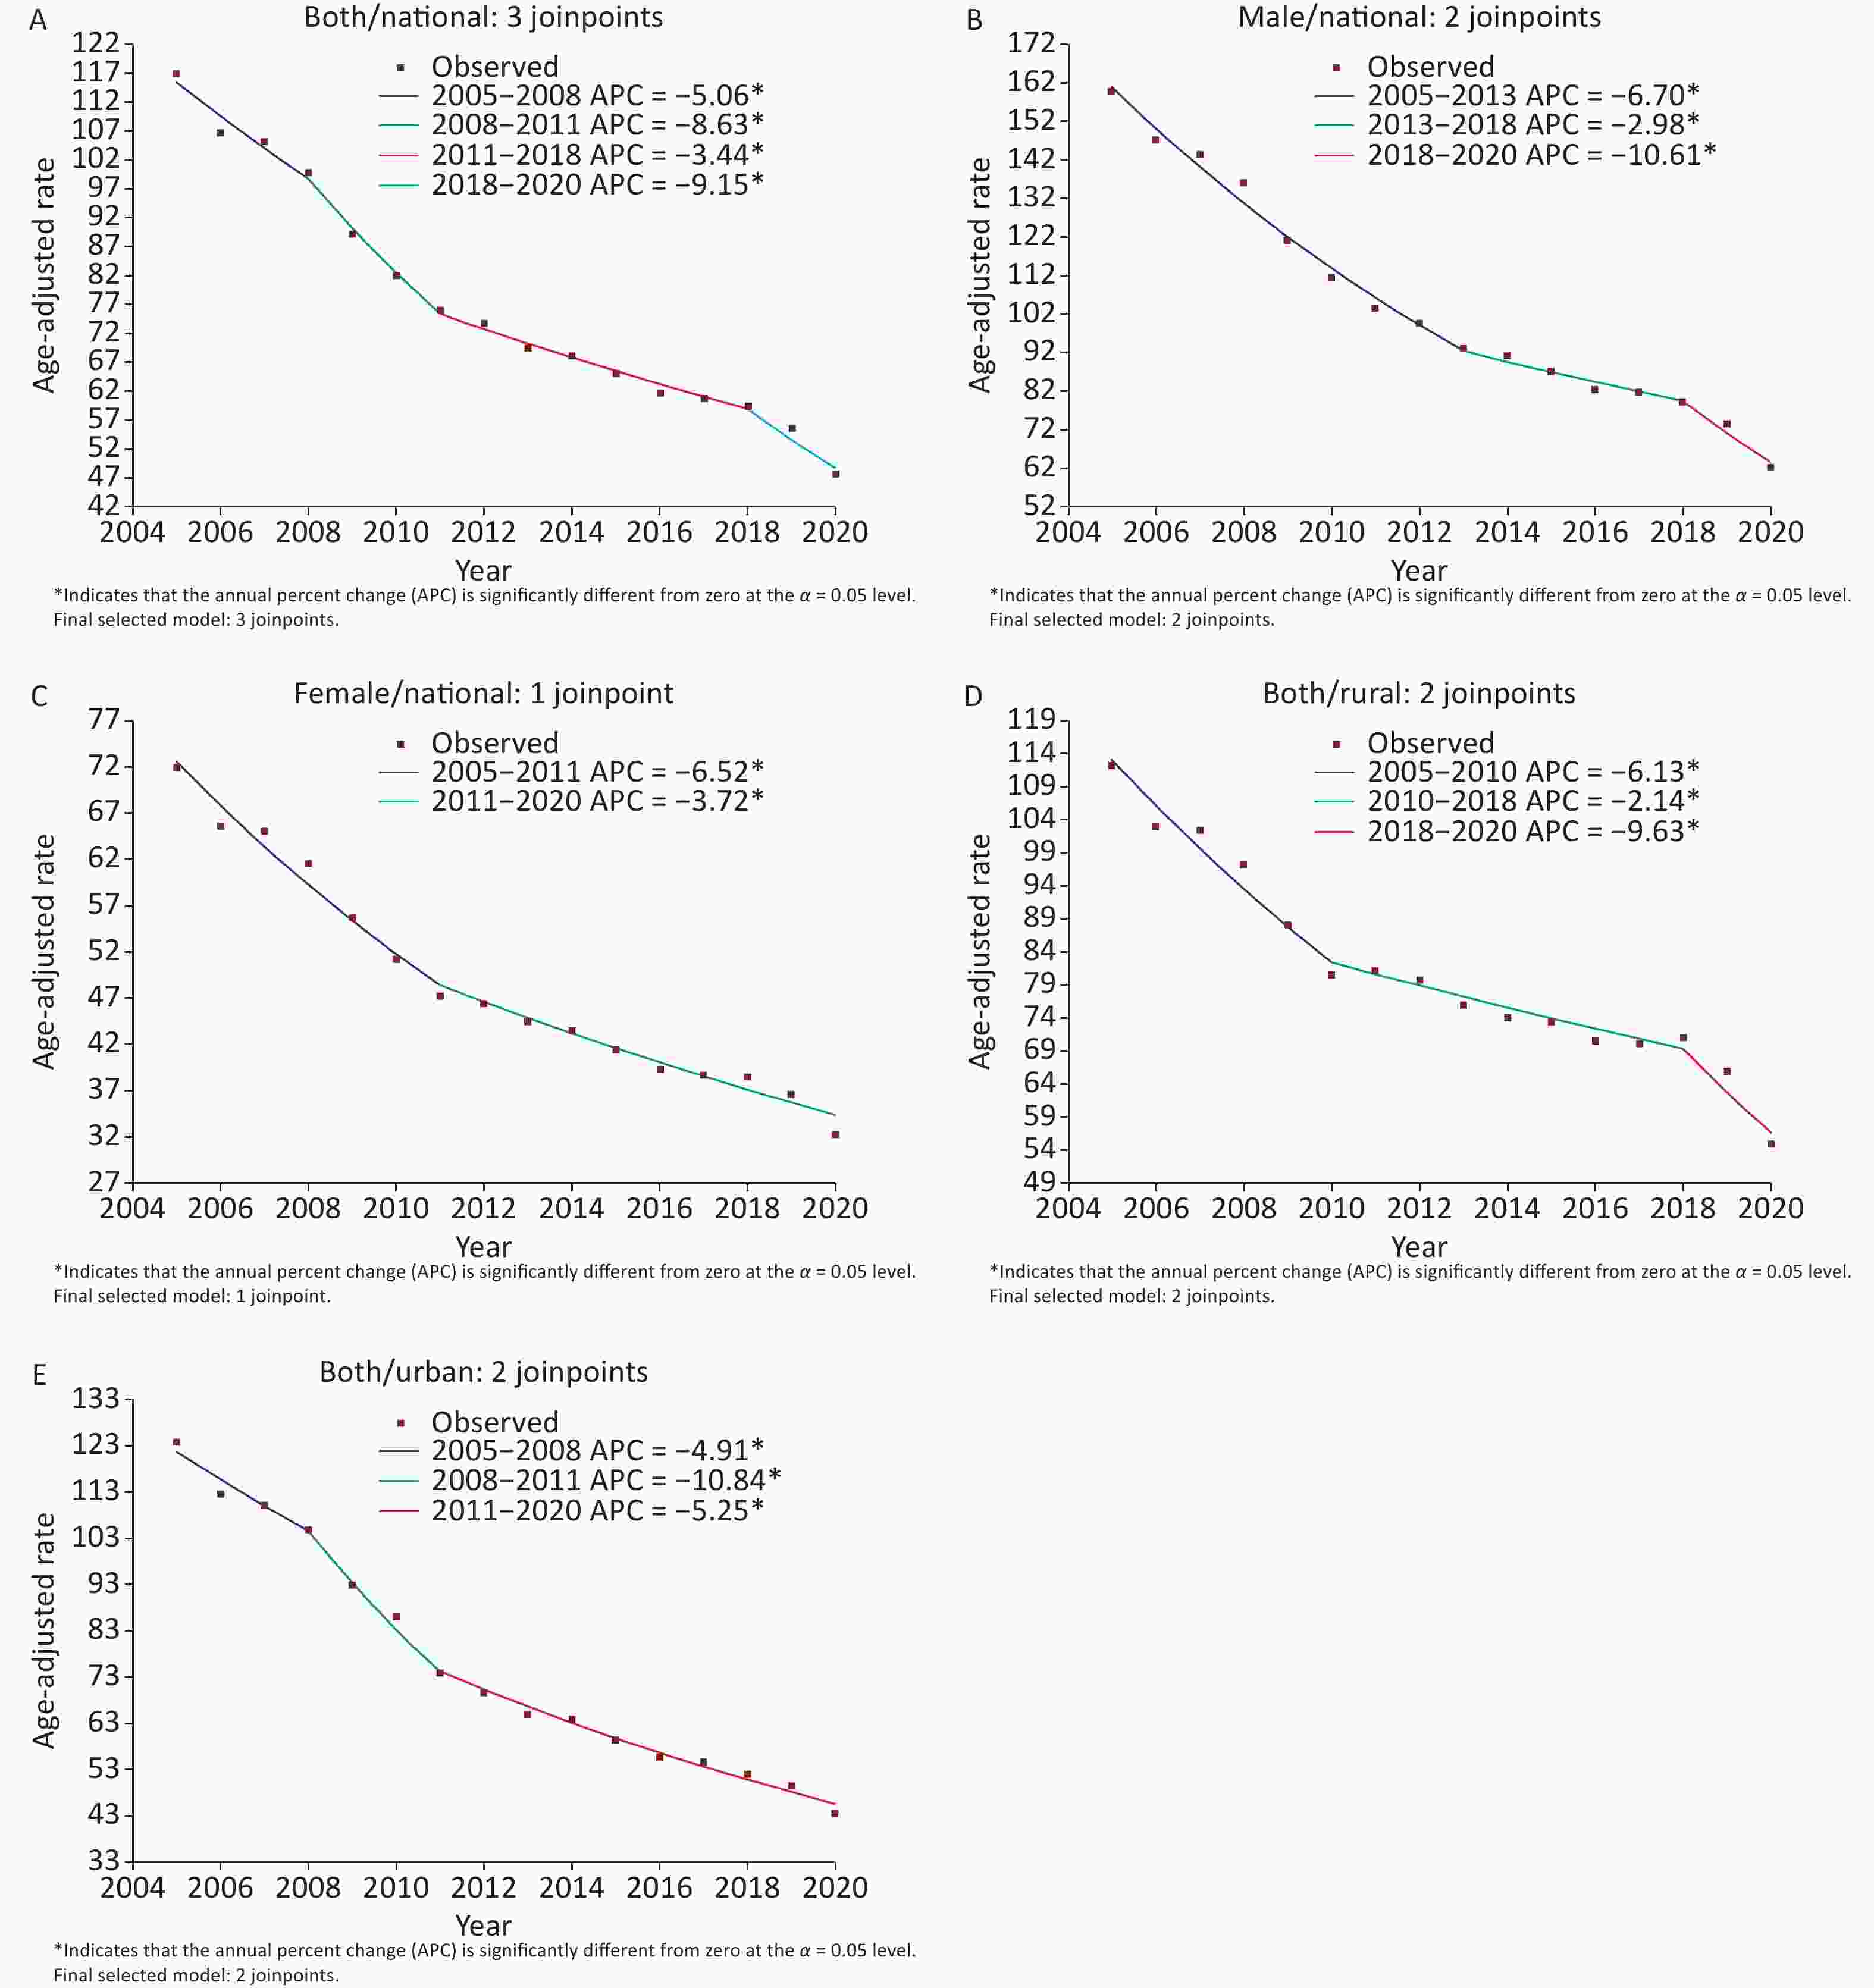
Figure S1. Joinpoint regression analysis of the reported incidence of Pulmonary Tuberculosis in China. (A) Overall; (B) Male; (C) Female; (D) Rural; (E) Urban
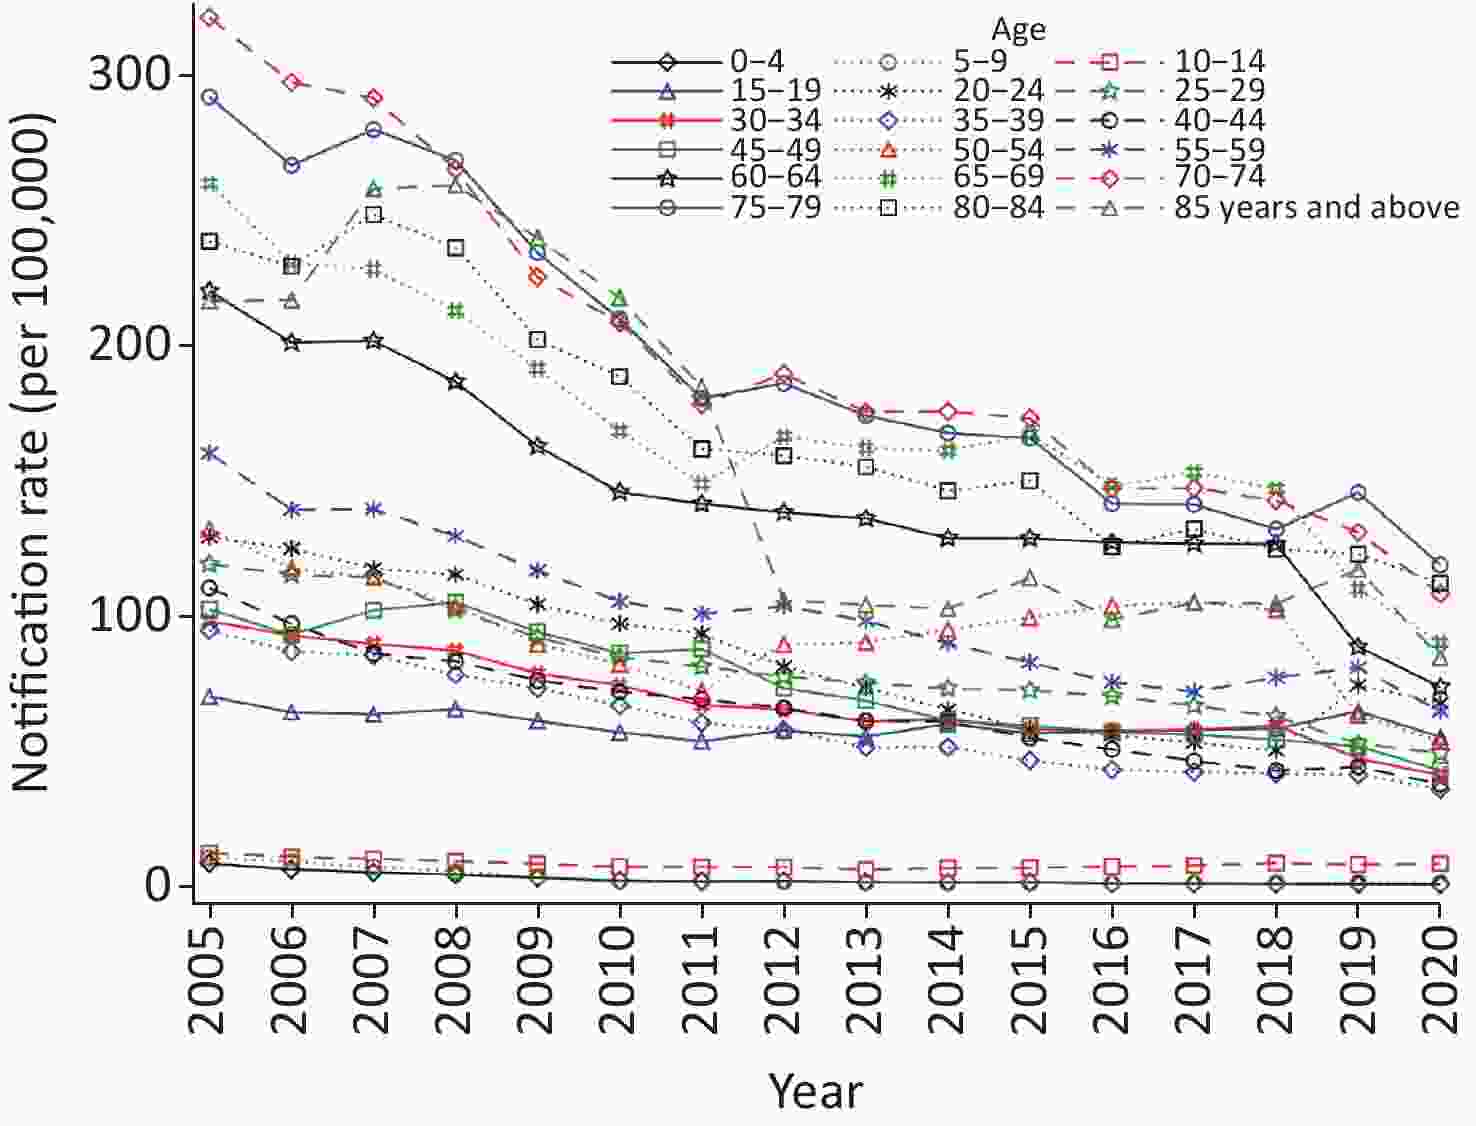
Figure S2. The reported incidence of age-specific PTB in China, 2005−2020.
HTML
Data Collection
Statistical Analysis
Changes in Notified PTB Incidence Nationwide
Changes in Notified Incidence of PTB in Different Sex and Age Groups
Changes in Notified Incidence of PTB in Urban/Rural Areas and Seven Geographical Regions
Limitations
CONFLICT OF INTEREST The authors declare that they have no conflict of interest.
ETHICS APPROVAL AND CONSENT TO PARTICIPATE Not applicable.
 22158Supplementary Materials.pdf
|

|

 Quick Links
 DownLoad: