


-
Hypertension (HTN) and type 2 diabetes mellitus (T2DM) are interconnected metabolic diseases [1, 2] that considerably increase susceptibility to microvascular and macrovascular disorders. In many patients, HTN and diabetes comorbidity (HDC) is caused by mutual pathogenic pathways, such as endothelial dysfunction, atherosclerosis, oxidative stress, and vascular inflammation [1]. Hence, it is crucial to identify risk factors, especially ones that can be treated, for HDC and provide essential information for further health management. Based on previous research, generalized and abdominal obesity are linked to a higher risk of HDC. In individuals with obesity, adipocyte dysfunction can lead to vascular and systemic insulin resistance and renin-angiotensin-aldosterone system and sympathetic nervous system dysfunction[2]. A possible indicator of HDC is dyslipidemia, which includes hypertriglyceridemia (HTG), and abnormal levels of high-density lipoprotein cholesterol (HDL-C), low-density lipoprotein cholesterol (LDL-C), and total cholesterol (TC).
In addition to modifiable indicators of HDC, including unhealthy diet, low levels of physical activity, and overweight or obesity, nonmodifiable risk factors, such as genetic polymorphisms and family history, should be addressed. One example is the vitamin D receptor (VDR) gene, which consists of 14 exons and is situated on human chromosome 12q13.11. Previous studies [3] found that VDR mutations may hasten the disease process of HTN and T2DM. However, few studies have focused on the relationship between VDR single nucleotide polymorphisms (SNPs) and HDC predisposition. Therefore, this study aimed to assess the potential correlations between VDR SNPs, HTG, abnormal waist-hip ratio (WHR), and HDC to show the physiological relevance of the combined effects. This can aid in the development of new treatment approaches to prevent HDC in Chinese populations.
Stratified random cluster sampling was used to recruit a total of 1,364 individuals in this cross-sectional study (Figure 1). The Zhengzhou University Life Science Ethics Committee approved the study protocol. We collected demographic and anthropometric data from the subjects and conducted a biochemical analysis (Supplementary Table S1, available in www.besjournal.com). We chose four associated SNPs based on the selection criteria of the minor allele frequency (MAF) > 0.01, linkage disequilibrium (r2 > 0.8), and position in major gene functional and nonfunctional areas (rs2228570, rs3847987, rs2239179, and rs739837). Assuming additive, dominant, and recessive models of inheritance, logistic regression models were used to appraise the associations between VDR or metabolic factors (i.e., obesity and dyslipidemia) and HDC susceptibility. In the dominant model, the additive interaction model was applied to evaluate the effect of interaction between gene and environmental factors on HDC risk.
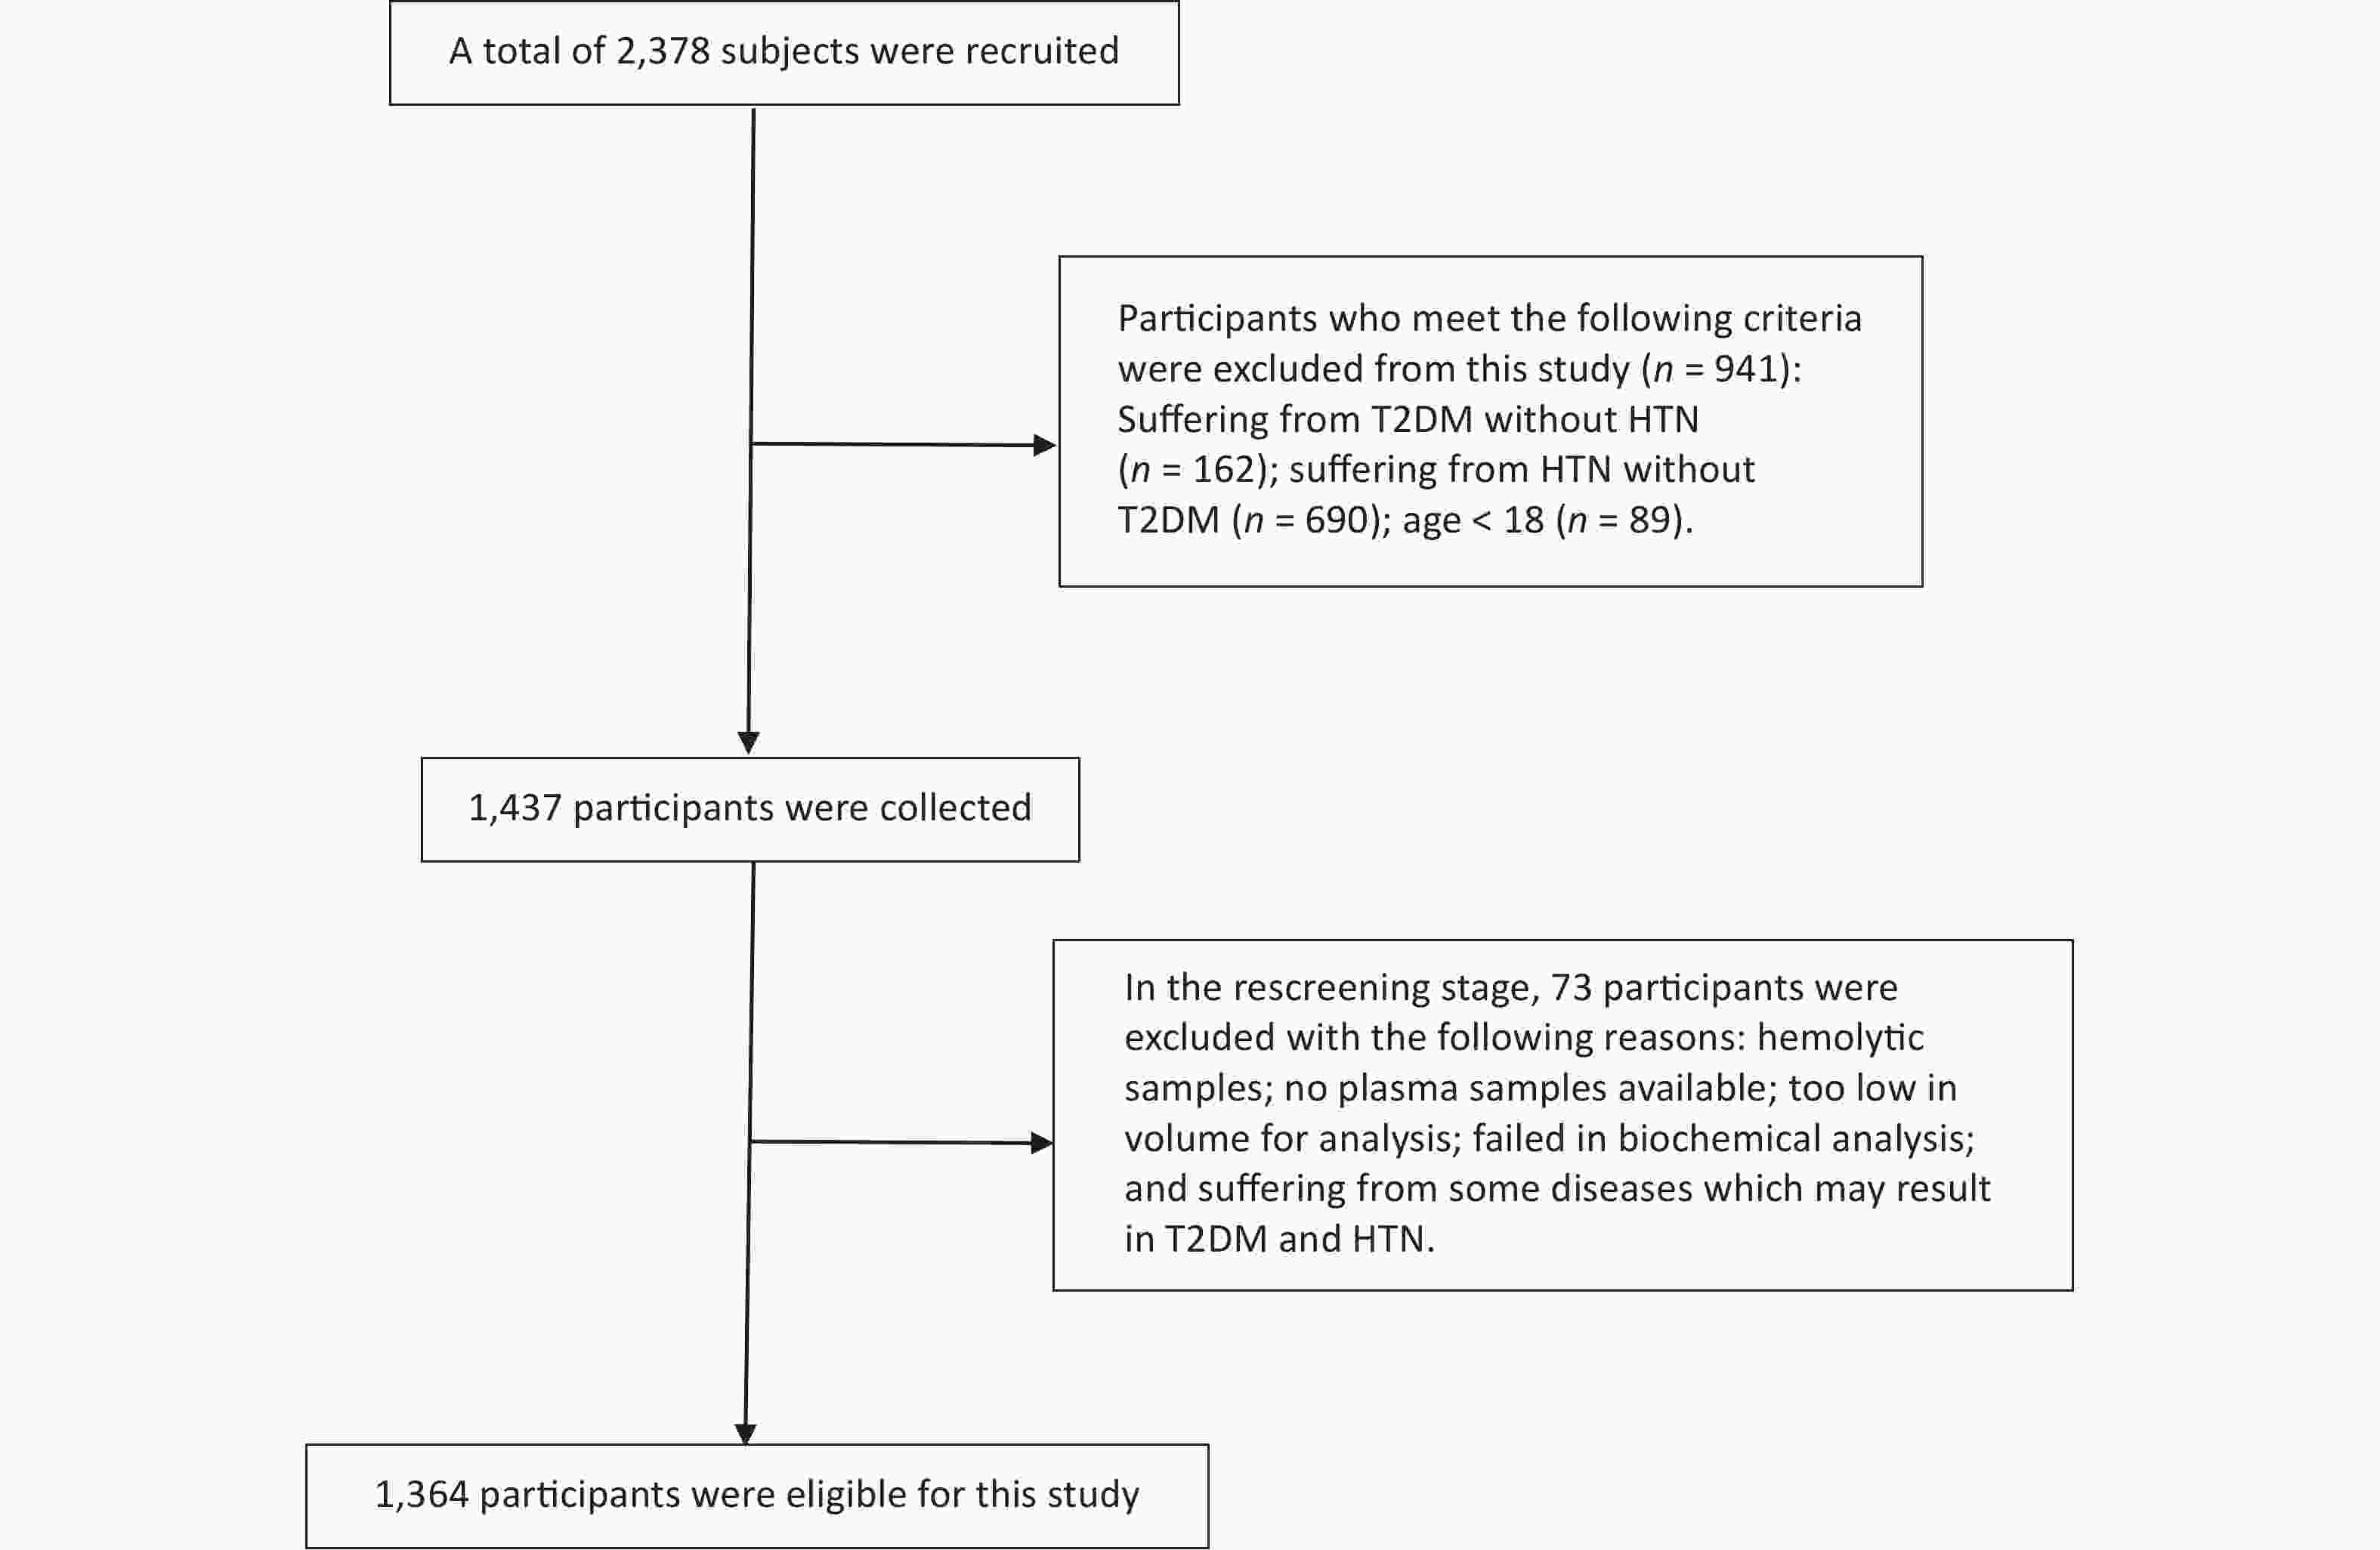
Figure 1. Flow diagram of the screening process. A total of 1,014 subjects who met the exclusion criteria were excluded, and 1,364 participants were finally included in this study. HTN, Hypertension; T2DM, type 2 diabetes mellitus
Multiple logistic regression analysis showed that rs3847987 and rs7398379 polymorphisms were associated with HDC risk after adjusting for age, sex, smoking, drinking, and family history of diabetes and HTN (Table 1). Participants with the “CA” and “AA” genotypes of rs3847987 were more likely to develop HDC (1.559, 95% CI 1.133–2.146 and 1.972, 95% CI 1.043–3.730) when compared with the “CC” genotype. Furthermore, subjects with the “GT+TT” genotype of rs7398379 had higher HDC susceptibility compared with the “GG” genotype (OR = 1.451, 95% CI 1.072–1.963). Our findings are in line with numerous studies [3, 4] that found a correlation between VDR mutations and an increase in the prevalence of T2DM and HTN. The 3’ untranslated region of VDR is where the SNPs rs3847987 and rs739837 are both found. This region has little effect on the amino acid sequence and is unlikely to affect gene function. However, through the modification of mRNA stability, this region is implicated in the control of gene expression. Variations in rs739837 may affect the levels of VDR mRNA and protein, which may be linked to a decreased risk of developing diabetes.
SNPs No-HDC HDC χ2 P OR (95% CI)a P HWE rs2228570 0.276 0.871 0.267 TT 236 (20.92%) 53 (22.46%) 1 CT 580 (51.42%) 119 (50.42%) 0.874 (0.597−1.279) 0.487 CC 312 (27.66%) 64 (27.12%) 0.766 (0.497−1.182) 0.228 TT/CT+CC 0.835 (0.582−1.198) 0.328 TT+CT/CC 0.843 (0.599−1.186) 0.327 rs3847987 10.108 0.006 0.805 CC 725 (64.27%) 128 (54.24%) 1 CA 357 (31.65%) 91 (38.56%) 1.559 (1.133−2.146) 0.006 AA 46 (4.08%) 17 (7.20%) 1.972 (1.043−3.730) 0.037 CC/CA+AA 1.610 (1.186−2.185) 0.002 CC+CA/AA 1.664 (0.893−3.100) 0.109 rs2239179 0.095 0.954 0.342 AA 685 (60.73%) 144 (61.02%) 1 AG 395 (35.02%) 83 (35.17%) 0.940 (0.683−1.294) 0.706 GG 48 (4.26%) 9 (3.81%) 0.946 (0.433−2.068) 0.889 AA/AG+GG 0.941 (0.691−1.281) 0.699 AA+AG/GG 0.967 (0.446−2.097) 0.932 rs739837 6.232 0.044 0.691 GG 637 (56.47%) 113 (47.88%) 1 GT 418 (37.06%) 102 (43.22%) 1.412 (1.029−1.937) 0.033 TT 73 (6.47%) 21 (8.90%) 1.681 (0.954−2.962) 0.072 GG/GT+TT 1.451 (1.072−1.963) 0.016 GG+GT/TT 1.441 (0.834−2.488) 0.190 Note. CI, confidence interval; HWE, Hardy-Weinberg equilibrium; OR, odds ratio. aAdjusted for age, sex, smoking, alcohol drinking, family history of HTN, and family history of diabetes. Table 1. Genotypic distribution of vitamin D receptor polymorphisms and their association with HDC risk
In Table 1, we found that rs2228570 polymorphisms were not associated with HDC risk after adjusting for confounding factors. The rs2228570 is located at the 5’ end of the gene, close to the promoter region. The T→C mutation at this position will result in a mutation of the first start codon from ATG to ACG, which may interfere with the binding effectiveness of vitamin D and VDR and restrict the complete function of vitamin D. Ultimately, this may affect the course of T2DM by influencing the function of vitamin D. However, rs2228570 and HDC were not found to be associated in this study. One study [5] discovered that the rs2228570 was not related to diabetes in the Chinese Han population. Conversely, another study [6] indicated an inverse association between rs2228570 and a greater chance of developing HTN. Thus, further research is required to establish the correlation between rs2228570 and HDC. Another gene, Rs2239179, is located in the VDR coding region, where the variation from A to G may impact the amino acid sequence. Similarly, we discovered no connection between rs2239179 and HDC risk. Future research should verify the findings and investigate the mechanisms of activation.
We used logistic regression analysis to examine the relationships between metabolic indicators (TC, TG, HDL-C, BMI, WC, and WHR) and HDC risk (Supplementary Table S2, available in www.besjournal.com). Except for the level of HDL-C, significant associations between other indicators and HDC susceptibility were found after adjusting for confounding factors. Compared with participants with normal weight, those with overweight and obesity presented an elevated risk of HDC (OR = 3.396, 95% CI 2.258–5.106 and OR = 7.553, 95% CI 4.799–11.889, respectively). HDC susceptibility was positively correlated to TG level with an OR of 3.673 (95% CI 2.676–5.041). Similarly, abnormal WC, WHR, and TC increased the risk of HDC (OR = 4.368 [3.004–6.352], 4.138 [2.724–6.284], and 1.710 [1.230–2.378], respectively; P < 0.001). Consistent with other findings [7], high blood pressure and decreased sensitivity to insulin are linked to complicated and uncomplicated obesity.
Indicator OR (95% CI)a P BMI < 18.50 0.873 (0.192−3.974) 0.861 18.50−23.99 1 24.00−27.99 3.396 (2.258−5.106) < 0.001 ≥ 28.00 7.553 (4.799−11.889) < 0.001 HTGb 3.673 (2.676−5.041) < 0.001 Abnormal WCc 4.368 (3.004−6.352) < 0.001 Abnormal WHRc 4.138 (2.724−6.284) < 0.001 Abnormal TCd 1.710 (1.230−2.378) 0.001 Abnormal HDL-Ce 1.352 (0.972−1.879) 0.073 25(OH)D3f VDD (< 20) 1.204 (0.820−1.768) 0.343 VDI (20−30) 0.827 (0.527−1.299) 0.411 VDS (> 30) 1 Note. aAdjusted for age, sex, smoking, alcohol drinking, family history of HTN, and family history of diabetes. bHTG, hypertriglyceridemia (TG ≥ 2.26 mmol/L). cWC > 85 cm or waist-hip ratio WHR ≥ 0.90 for men and > 80 cm or ≥ 0.85 for women are defined as abnormal WC and abnormal WHR. d TC ≥ 5.18 mmol/L was determined to be abnormal TC. eHDL-C < 1.04 mmol/L was defined as abnormal HDL-C. fVDD-vitamin D deficiency (< 20 ng/mL); VDI-vitamin D insufficient (20−30 ng/mL); VDS-vitamin D sufficient (≥ 30 ng/mL). Table S2. Results of association analysis of metabolic indicators with HDC risk
Lipolysis, which triggers the release of free fatty acids and causes metabolic irregularities, oxidative stress, and vascular dysfunction, is not prevented by postprandial hyperinsulinemia. In earlier research, abdominal obesity increased the risk of HDC more than general obesity, presumably due to the significant link between visceral and abdominal obesity [8]. Two mechanisms may be at play in the connection between obesity, metabolic syndrome, and their sequelae [9]. First, increased free fatty acids may cause insulin resistance by favoring highly sensitive visceral adipose tissue lipolysis in hypertrophied areas. Second, higher levels of free testosterone and lower levels of sex hormone-binding globulin may stimulate the accumulation of belly fat and decrease the proportion of insulin extracted by the liver. Consequently, the increased visceral fat depot that drains free fatty acids into the portal vein and systemic circulation may influence the relationship between adiposity and HDC. In other words, weight control is of great importance for patients with T2DM and HTN, especially those with abdominal obesity.
As a dietary factor, vitamin D is also crucial for the development of HDC. Theoretically, vitamin D can affect insulin sensitivity in several ways. The expression of insulin receptors appears to be stimulated by 1,25(OH)2D and, therefore, influences insulin sensitivity. In insulin-responsive cells, 1,25(OH)2D enters and interacts with VDR, boosting the transcriptional activity of insulin receptor genes and the number of insulin receptors overall without changing their affinity. As 1,25(OH)2D activates the peroxisome-activated receptor delta, it may also improve insulin sensitivity. Patients with 25(OH)D levels of < 21 ng/mL in the National Health and Nutrition Examination Survey had a 1.3-fold increased risk of developing HTN than those with levels of ≥37 ng/mL. Currently, no experimental trials support a correlation between vitamin D intervention and HDC risk. Additionally, we were unable to detect a significant relationship between 25(OH)D3 level and HDC risk (Supplementary Table S2).
Both HTN and T2DM are chronic systemic disorders caused by the combination of various genes and environmental risk factors [10]. In both T1DM and T2DM, only a minority of cases are caused by either genetic or environmental factors alone. Moreover, 95% of these cases are multifactorial, induced by the interaction of environmental, genetic, and behavioral risk factors. Individuals with genetic susceptibility are more likely to develop T2DM owing to metabolic factors, such as obesity, reduced physical activity, high-sucrose diet, and low physical activity. In this study, the interaction of VDR with obesity and dyslipidemia was analyzed (Supplementary Table S3, available in www.besjournal.com), and we found that the interaction of rs3847987 with TG and WHR can increase the risk of developing HDC.
SNPs RERI AP SI rs2228570 BMI −3.27 (−9.03−2.48) −0.42 (0.99−0.14) 0.67 (0.44−1.04) WC −2.39 (−6.19−1.40) −0.44 (−1.04−0.17) 0.65 (0.40−1.06) WHR −0.80 (−3.51−1.90) −0.16 (−0.67−0.35) 0.83 (0.49−1.41) TC −0.04 (−1.59−1.50) −0.02 (−0.76−0.72) 0.96 (0.25−3.71) TG 0.61 (−1.43−2.65) 0.19 (−0.41−0.79) 1.37 (0.43−4.41) HDL-C −0.08 (−0.99−0.82) −0.11 (−1.34−1.12) 1.49 (0.01−281.05) 25(OH)D3 0.18 (−0.53−0.88) 0.18 (−0.61−0.97) 0.13 (0.01−1.91) rs3847987 BMI −0.58 (−3.28−2.12) −0.08 (−0.48−0.31) 0.91 (0.60−1.39) WC 0.96 (−1.04−2.97) 0.17 (−0.15−0.48) 1.25 (0.78−2.01) WHR 2.54 (0.53−4.55) 0.41 (0.18−0.64) 1.96 (1.14−3.39) TC 1.33 (−0.04−2.69) 0.43 (0.11−0.75) 2.76 (0.85−8.97) TG 2.67 (0.05−5.29) 0.48 (0.18−0.77) 2.37 (1.11−5.07) HDL-C −1.10 (−3.12−0.93) −0.42 (−1.13−0.29) 0.60 (0.30−1.19) 25(OH)D3 −0.59 (−1.97−0.78) −0.28 (−0.92−0.36) 0.65 (0.29−1.46) rs2239179 BMI −1.03 (−3.05−0.98) −0.23 (−0.69−0.23) 0.77 (0.49−1.23) WC −1.47 (−3.63−0.69) −0.32 (−0.81−0.18) 0.71 (0.45−1.13) WHR −2.82 (−6.23−0.60) −0.43 (−0.94−0.07) 0.66 (0.44−0.99) TC −1.33 (−2.68−0.01) −0.79 (−1.81−0.24) 0.34 (0.10−1.21) TG −0.34 (−2.30−1.61) −0.10 (−0.72−0.51) 0.87 (0.40−1.91) HDL-C 0.01 (−0.88−0.91) 0.01 (−0.63−0.65) 1.03 (0.10−10.48) 25(OH)D3 0.17 (−0.55−0.89) 0.13 (−0.41−0.66) 1.93 (0.02−152.78) rs739837 BMI −1.44 (−4.58−1.71) −0.19 (−0.60−0.23) 0.82 (0.55−1.22) WC 0.58 (−1.48−2.64) 0.10 (−0.23−0.43) 1.13 (0.72−1.77) WHR 1.70 (−0.22−3.63) 0.28 (0.01−0.55) 1.50 (0.92−2.45) TC 1.10 (−0.18−2.38) 0.38 (0.03−0.73) 2.40 (0.74−7.76) TG 2.01 (−0.37−4.38) 0.38 (0.05−0.72) 1.91 (0.92−3.97) HDL-C −0.10 (−2.96−0.97) −0.36 (−1.01−0.28) 0.64 (0.34−1.20) 25(OH)D3 −0.58 (−1.90−0.74) −0.28 (−0.88−0.33) 0.66 (0.31−1.40) Note. SNPs: Single nucleotide polymorphisms; RERI, relative excess risk due to interaction; AP, attributable proportion due to interaction; SI, synergy index; BMI, body mass index; WC, waist circumference; WHR, waist–hip ratio; TC, total cholesterol; TG, triglyceride; HDL-C, high-density lipoprotein cholesterol. Table S3. The interactions between VDR variants and environment indicators on the HDC risk
HDC risk in participants with HTG having the “CC” allele of rs3847987 increased by 203% (OR = 3.026, 95% CI 1.913–4.788; P < 0.001), whereas HDC risk in those carrying the mutational allele of rs3847987 increased by 675% (OR = 7.749, 95% CI 4.685–12.817; P < 0.001, Table 2). For participants with abdominal obesity, those who carried “CC” or “TT+TC” of rs3847987 showed an increased risk of HDC by 203% (OR = 3.028, 95% CI 1.800–5.094; P < 0.001) or 474% (OR = 5.742, 95% CI 3.355–9.828; P < 0.0001) compared to wild-type gene carriers with regular WHR. The additive interaction analysis provided more proof that VDR-HTG or gene-WHR interaction may be a crucial factor in the rising HDC susceptibility among the Chinese population. Although we conducted a gene-environment interaction study, future research should confirm the interactions of other genes and environmental variables on HDC risk.
SNPs Status OR (95% CI) P rs3847987 CC Normal TGa 1 AA+CA Normal TG 1.338 (0.911−1.966) 0.137 CC HTG 3.026 (1.913−4.788) < 0.001 AA+CA HTG 7.749 (4.685−12.817) < 0.001 RERI 2.666 (0.045−5.286) AP 0.475 (0.183−0.766) SI
rs38479872.367 (1.106−5.065) CC Non-abdominal obesity 1 AA+CA Non-abdominal obesity 0.849 (0.382−1.890) 0.689 CC abdominal obesityb 3.028 (1.800−5.094) < 0.001 AA+CA
RERI
AP
SIabdominal obesity 5.742 (3.355−9.828)
2.544 (0.534−4.554)
0.412 (0.179−0.644)
1.964 (1.137−3.392)< 0.001 Note. RERI, relative excess risk due to interaction; AP, attributable proportion due to interaction; SI, synergy index. aNormal TG (< 2.26 mmol/L); HTG (≥ 2.26 mmol/L). bAbdominal obesity was diagnosed as having a waist-hip ratio (WHR) of ≥ 0.90 for men and ≥ 0.85 for women. Table 2. Interactions between VDR variants and HTG and abdominal obesity and HDC risk
Characteristics Non-HDC (n = 1,128) HDC (n = 236) P Male 513 (45.48%) 82 (34.75%) 0.003 Age (years) 48.00 (37.00−60.00) 61.00 (54.50−68.00) < 0.001 Smoking 386 (34.22%) 60 (25.42%) 0.009 Alcohol drinking 252 (22.42%) 33 (14.04%) 0.004 Family history of diabetes 214 (18.97%) 43 (18.22%) 0.932 Family history of hypertension 391 (34.66%) 83 (35.17%) 0.833 FPG (mmol/L) 4.66 (4.14−5.15) 8.37 (6.59−10.62) < 0.001 SBP (mm Hg) 116.67 (108.33−123.33) 143.17 (133.33−153.33) < 0.001 DBP (mm Hg) 75.67 (70.00−80.00) 86.00 (80.00−91.67) < 0.001 TC (mmol/L) 4.27 (3.68−4.97) 4.71 (4.07−5.52) < 0.001 TG (mmol/L) 1.14 (0.76−1.79) 1.87 (1.26−2.94) < 0.001 HDL-C (mmol/L) 1.24 (1.04−1.46) 1.17 (1.00−1.39) 0.018 LDL-C (mmol/L) 2.40 (1.89−2.93) 2.57 (2.00−3.17) 0.028 BMI (kg/m2) 24.16 (21.65−26.60) 26.86 (24.93−28.98) < 0.001 WHR 0.88 (0.83−0.93) 0.94 (0.90−0.98) < 0.001 WC (cm) 83.00 (75.90−90.50) 92.00 (86.00−98.00) < 0.001 25(OH)D3 0.080 VDD (< 20 ng/mL) 550 (48.76%) 133 (56.36%) VDI (20−30 ng/mL) 279 (24.73%) 54 (22.88%) VDS (> 30 ng/mL) 299 (26.51%) 49 (20.76%) Note. HDC, hypertension and diabetes comorbidity; FPG, fasting plasma glucose; SBP, systolic blood pressure; DBP, diastolic blood pressure; TC, total cholesterol; TG, triglyceride; HDL-C, high-density lipoprotein cholesterol; LDL-C, low-density lipoprotein cholesterol; BMI, body mass index; WHR, waist–hip ratio; WC, waist circumference; VDD, vitamin D deficiency; VDI, vitamin D insufficiency; VDS, vitamin D sufficiency. Data are given as the mean ± SD, n (%) or median (interquartile range), with the significance of differences between groups evaluated using t test, the χ2 test, or Wilcoxon ranks teat, respectively. Table S1. Demographic and clinical characteristics of the study participants
No potential conflicts of interest were disclosed.
SUN Hua Lei and ZHAO Tong substantially contributed to the study design, gathered the data, and wrote the manuscript; ZHANG Dong Dong conducted data collection and established the methodology; FENG Ming Ming, XU Ze, HUANG Hao Yue, and ZHANG Luo Ya conducted data collection; LI Wen Jie, LI Xing, and DUAN Jia Yu supervised the study and contributed to data curation. Li Jia and DUAN Jia Yu reviewed and revised the manuscript.
HTML
Reference
 22358Supplementary Materials.pdf
|

|

 Quick Links
 DownLoad: