


-
Arsenic and fluoride are two of the most common elements contaminating groundwater resources worldwide. Arsenic and fluoride levels in groundwater in some regions of Shanxi, Inner Mongolia, Xinjiang Province of China are known to exceed the maximum contaminant level (MCL) set by the World Health Organization (WHO) [1]. In addition, due to the special geological structure of China, arsenic and fluoride are two major contaminants in groundwater that occur together. In recent years, epidemiological reports have shown that arsenic exposure can cause not only suspected growth retardation in infants but also neurological and cognitive dysfunction in children[2, 3]. A study showed that higher fluoride levels are associated with a lower IQ in children[4]. Moreover, previous studies by our research group have shown that early life exposure to arsenic and fluoride alone or in combination impaired spatial learning and memory abilities in rats[5]. However, the mechanisms underlying the impairment of learning and memory caused by arsenic and fluoride exposure alone or in combination remain unclear.
Exogenous chemicals, including arsenic, fluoride, cadmium, lead, and penicillin, can cause imbalances in the gut microbiome[6-9]. An increasing number of researchers believe that the gut microbiome enables two-way communication through the gut brain axis (GBA) and the central nervous system (CNS). Furthermore, gut microbial dysbiosis is associated with several diseases, such as autism, depression, parkinsonism, Alzheimer’s disease, obesity, and diabetes. Previous studies have suggested that commensal microbes located in the gastrointestinal system may influence neurodevelopmental and social behavioral programming[10]. In a study based on the autism spectrum, the Firmicutes/Bacteroides ratio was found to be significantly reduced in fecal samples from patients with autism spectrum disorder (ASD) and the expression of glial and neuronal molecules was also reduced, especially synaptic proteins involved in neuronal connection[11]. Similarly, a study indicated that the fragile X syndrome (FXS) model, characterized by neurodevelopmental disorders, alters the composition and diversity of gut microbes compared to the wild type, accompanied by an increase in seven bacterial genera and a decrease in three bacterial genera[12]. Researchers have been pursuing effective means of mitigating nerve damage through altering specific microflora. Their findings suggest that potential complement inhibitors could be developed to prevent Campylobacter jejuni-mediated autoantibodies by triggering changes in nerve structure, which could ultimately limit the extent of nerve damage and improve symptoms in patients with Guillain-Barré syndrome[13]. In addition, altering the gut microbial composition could represent a new preventive/therapeutic option for autism disorder, administered by consuming foods rich in probiotics[14]. Importantly, changes in the diversity of the microbial profile can be translated into potential biomarkers for the development of therapies and the follow-up of patients with neurological conditions.
Indeed, microbiome alterations identified by 16S rRNA high-throughput sequencing have provided limited insights into the gut composition and function. Metabolomics is used to study the overall biological functional status, which changes the study target from micro-genes to macro-metabolites and macro-metabolic phenotypes, thus making the study scope more comprehensive. Metabolomic analysis provides an additional approach to revealing changes in metabolic pathways in diseases. Arsenic and/or fluorine exposure also alters the levels of various metabolites, such as indole compounds, bile acids[15], and lipid and amino acid metabolism disorders[16], including tyrosine, AA, and citric acid. Similarly, changes in urea and N2-acetyl-l-ornithine may be used as potential metabolite markers of fluorosis[17]. Metabolites produced by gut bacteria can act as precursors for neurotransmitters, ultimately affecting neurotransmitter signalling in the brain[18]. Metabolites, which represent microbiota-derived compounds, may directly affect brain function and behavior. In fact, significantly elevated levels of kynurenic acid (KYNA) have been found to be associated with cognitive impairment in patients with schizophrenia (SCZ)[19]. Cognitive disorders can be treated by increasing the levels of certain metabolites that have protective effects. A recent study found that alpha-lipoic acid may be a potential therapy for tauopathies by inhibiting neuronal loss[20]. In addition, Wang et al. observed that arachidonic acid represents a potential biomarker for SCZ, providing a new perspective for antipsychotic treatment[21]. These results suggest that endogenous small-molecule gut metabolites may provide a basis for disease prevention and diagnosis.
While it is important to study the effects of arsenic and/or fluoride exposure on neurodevelopment, exploring the relationship between microbiota disruption and altered metabolic profiles in arsenic and/or fluoride exposure causing learning memory impairment is not only important in scientific research but is also critical for disease diagnosis, prevention, and treatment in public health. Currently, there is a lack of research on the mechanisms of arsenic and/or fluoride exposure, the gut microbiome, metabolic status, and learning memory impairment. In the present study, we established intrauterine to adult SD rat models to study arsenic and fluoride exposure alone and in combination, assessed the neurodevelopmental performance of rats using the Morris water maze, investigated the two-by-two correlation of differential gut microbes, differential metabolites, and learning memory impairment, and explored the mechanisms of arsenic and/or fluoride-induced learning memory impairment at the multi-omics level using liquid chromatograph mass spectrometer (LC-MS) and 16SrRNA sequencing.
-
Sodium fluoride (NaF) and sodium arsenite (NaAsO2) were purchased from Nanjing Shengqinghe Chemical Co. Ltd. and Shanghai Kanglang Biotechnology Co. Ltd., respectively.
-
Sixty SD rats (6–7 weeks old, 40 female rats weighing 160 ± 10 g, and 20 male rats weighing 200 ± 10 g) were purchased from Beijing SiPeiFu Biotechnology Co. The rats were housed at SPF level in a controlled environment (temperature, 24 ± 1 °C; relative humidity, 50%) with unrestricted access to food and water. All experiments were performed in accordance with the guidelines of the Animal Experimentation Center and approved by the Ethics Committee of Shanxi Medical University.
-
After one week of adaptation in separate cages for male and female rats, the rats were randomly divided into control (Con, drinking water only), arsenic (As, 70 mg/L NaAsO2), fluoride (F, 100 mg/L NaF), and arsenic-fluoride group (AsF, 70 mg/L NaAsO2 and 100 mg/L NaF). Rats were exposed to free water drinking according to the grouping described above, from first day of mating (female: male = 2:1) until the end of the gestation period. Subsequently, offspring were exposed to arsenic and/or fluoride through parental lactation during the 21-day lactation period. Afterwards, the weaned rats were continued to be exposed to the chemicals in similar manner until postnatal day (PND) 90.
-
Feces and urine were collected from six rats per group on the day of PND 90 before euthanasia. The urine was cryogenically centrifuged, and the supernatant was removed and stored at ‒80 °C. Urinary arsenic and fluoride levels were measured as described in later context. Meanwhile, the feces were collected under the principle of asepsis, rapidly frozen in a liquid nitrogen tank for 30 s, and stored at a ‒80 °C. The fecal samples were used for 16S rRNA sequencing to detect gut microbiomes and LC-MC to detect gut nontargeted metabolomics. Finally, the hippocampal region of the brain tissue was collected after intraperitoneal injection of 20% Uratan in anesthetized littermates, and pathological changes in the CA1 region of the hippocampus were observed by hematoxylin and eosin (H&E) staining.
-
The Morris water maze test, consisting of a spatial navigation training and a spatial exploration task, was used to evaluate their spatial learning and memory abilities. The water maze testing tank was 150 cm in diameter and 50 cm in depth. The circular water maze test chamber divided the pool into equal quadrants I, II, III, and IV. Black ink was added to the water before the experiment to prevent the camera from being able to track the white rats. The white rats were transferred to darkroom for at least 30 min before the experiment to adapt to the darkroom environment to reduce stress. The Morris water maze test was divided into two phases: spatial navigation training (days 1–5) and spatial exploration task (day 6). In the first phase, the rats were placed in the water from the appropriate position facing the wall of the pool each time and allowed to swim for up to 120 s. The escape latency was recorded for rats that found the platform and stayed on it for at least 5 s; otherwise, it was recorded for 120 s, and the rats were finally guided to find the platform and stay there for 5 s. The experiment was performed four times per day per rat for five consecutive days. In the second phase, the rats’ metrics (time spent in the target quadrant, swimming distance in the target quadrant, and number of crossing the platform) were recorded using a behavioral video tracking system (Hayward) after removal of the platform for subsequent analysis. Consistency of the experimental conditions was maintained throughout the experiments.
-
Following preconditioning of cardiac perfusion, hippocampal CA1 regions of rat brain tissues were collected and fixed in 4% paraformaldehyde for 24 h at room temperature. After continuous ethanol dehydration (70%, 80%, 90%, and 100% alcohol), it was embedded in paraffin and sectioned, followed by rehydration, H&E staining, and sealing. Lastly, the sections were observed under an inverted microscope and photographed for neuronal and nuclear analysis.
-
The urinary arsenic and fluorine levels were measured to assess the in vivo metabolism of arsenic and fluorine. First, urine was mixed with total ionic strength adjustment buffer (TISAB) in equal volumes, and the urinary fluorine content was measured using a fluoride ion meter (Shanghai Xianfan Instruments Co., Ltd.) with reference to the fluorine standard curve. While urine arsenic content was measured by digestion at low- temperature after centrifugation and dilution. Then, thiourea-vitamin C solution was added, and the volume was fixed using 5% dilute hydrochloric acid. Finally, urinary arsenic content was determined with an ASF-8530 atomic fluorescence photometer (Beijing Haiguang Instrument Company) using the arsenic standard curve as a reference.
-
Total genomic DNA extraction, PCR amplification, and library construction for fecal samples were performed by Shanghai Obio Technology Co. DNA was extracted using the MagPure Soil DNA LQ Kit. Next, primer 343F (5’-TACGGRAGGCAGCAG-3’) and 798R (5’-AGGGTATCTAATCCT-3’), targeting the high variability region V3V4 were selected for PCR amplification.
The original image data file obtained by high-throughput sequencing was transformed into raw data using base-calling analysis. Raw data processing flow: quality filtering, sequence splicing, base sequence removal, chimera removal to obtain valid tags for later operational taxonomic units (OTU) delineation. The average length of valid tags ranged from 408.87 to 420.07 bp, and the number of OTUs in each sample ranged from 1,838 to 2,514. Subsequently, the OTU classification of the quality sequence valid tags was performed according to 97% similarity using Vsearch2.4.2 software (Oslo, Norway) to obtain the representative sequences. Following OTU cluster analysis, the species were annotated and the relative abundance was calculated at the phylum, class, order, family, and genus levels.
The alpha and beta diversities were analyzed reflecting microbial community differences within and between samples. Principal coordinate analysis (PCoA) using the unweighted UniFrac distance metric can simplify complex multidimensional data into intuitive two-dimensional data to identify similarities or differences between communities. Finally, linear discriminant analysis effect size (LEfSe) was used to reveal the composition of different species in two or more groups of biomes. The results of LEfSe analysis are presented as differential species contribution to the magnitude of differences analysis and differential species annotation analysis, respectively.
-
Fecal metabolomics analysis was performed using a QE high-resolution mass spectrometer (Thermo Fisher World Technology Corporation) and Nexera ultra-performance liquid chromatography (UPLC) (Shimadzu Corporation). The gut metabolites were extracted as follows: First, 20 μL of the internal standard, 600 μL of methanol, and water were added to 60 mg of the sample. After grinding, sonication (10 min), resting (‒20 °C, 30 min), and low-temperature centrifugation (4 °C), 300 μL of supernatant was obtained and evaporated dry. The dried extract was redissolved in 400 μL of methanol/water (v:v = 1:4), vortexed for 30 s, sonicated (2 min), and centrifuged. Finally, 50 μL of the supernatant was aspirated for onboard LC-MS analysis.
Metabolites were quantified with UPLC. Chromatographic separation was carried out on a column (ACQUITY UPLC HSST3, 100 mm × 2.1 mm, 1.8 um) at 45 °C. The mobile phase consisted of water and acetonitrile and separation was achieved using a gradient (Supplementary Table S1, available in www.besjournal.com). The flow rate was 0.35 mL/min, and the injection volume was 2 μL. The mass range was m/z 125 to 1,000. The resolution was set at 70,000 for full MS scans and 17,500 for HCD MS/MS scans. The mass spectrometer operated as follows: spray voltage, 3,500 V (+) and 3,000 V (−); capillary temperature, 350 °C.
Time A% B% 0.01 95 5 2 95 5 4 70 30 8 50 50 10 20 80 14 0 100 15 0 100 15.1 95 5 16 95 5 Note. A-water (0.1% formic acid), B-acetonitrile (0.1% formic acid). Table S1. Elution gradient of mobile phase
Raw data were collected using UNIFI software (version 1.8.1) and analyzed qualitatively using the metabolomics processing software Progenesis QI (version 2.3) (Nonlinear Dynamics, Newcastle, UK). The positive and negative ion data (30-point scale) were combined into a data matrix table for subsequent analysis. Data analysis included univariate (Student’s t-test and fold-change analysis) and multivariate analyses. Multivariate statistical analyses included principal component analysis (PCA), supervised partial least squares analysis (PLS-DA), and orthogonal partial least-squares analysis (OPLS-DA). In this study, Variable important in projection (VIP) > 1 and P < 0.05 were adopted to screen for differential metabolites. Finally, screening of differential metabolites was enriched to a complete set of metabolic pathways using KEGG enrichment analysis.
-
Data analysis was conducted using SPSS24.0 software (IBM, USA). All values are presented as the mean ± standard error of the mean (SEM). Statistical analysis of multiple comparisons was performed by analysis of variance (ANOVA) or Wilcoxon’s test. After ANOVA, the least significant difference (LSD) test was used between the two groups. Escape latency was analyzed using repeated measures ANOVA. Correlations between the microbiome, metabolome, and learning memory metrics were analyzed using the Spearman correlation test. The interaction between As and F was analyzed by single variable statistical method of general linear model. The determination of arsenic and fluorine contents was calculated from the regression equation of the standard curve. Statistical significance was set at P < 0.05.
-
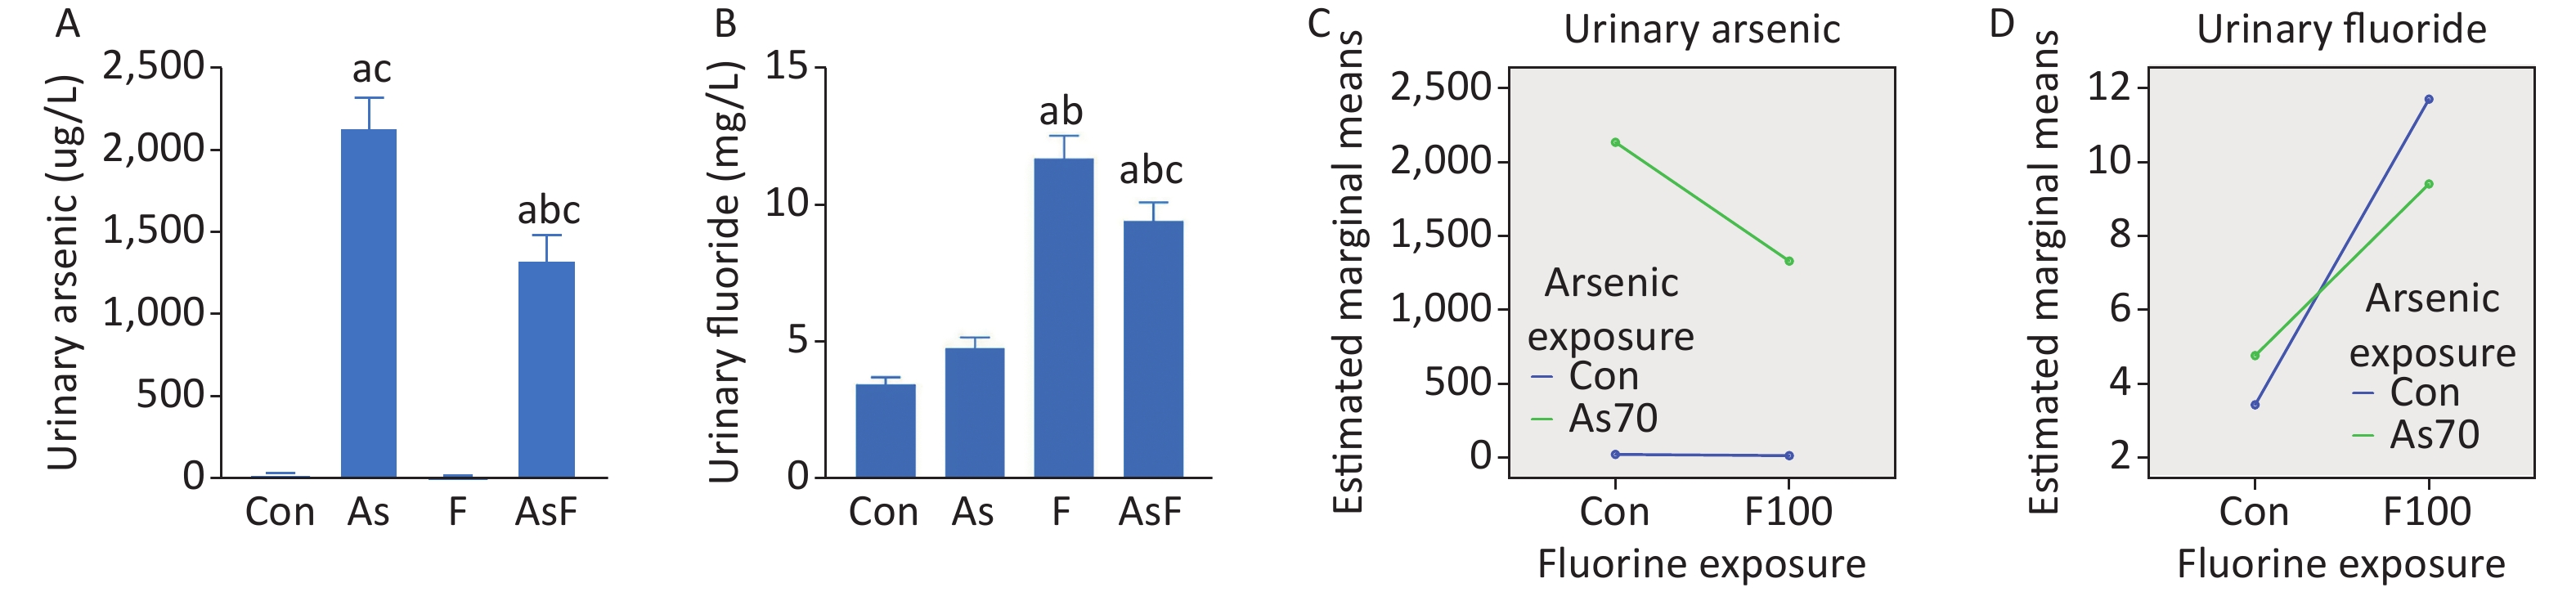
Urinary arsenic and fluoride content showed an increasing trend in all exposed groups compared with the control group. In the AsF exposure group, significant differences were observed in urinary arsenic levels compared to those in the Con, As, and F groups (P < 0.05) (Figure 1A). We also noticed a similar phenomenon in the urinary fluoride content assay (Figure 1B). Further exploration of the combined effect, on the existing urinary arsenic and urinary fluoride contents, the interaction results showed that arsenic and fluoride had antagonistic effects (Figure 1C, D), but the effect of specific doses on urinary arsenic and fluoride still needs further experiments.
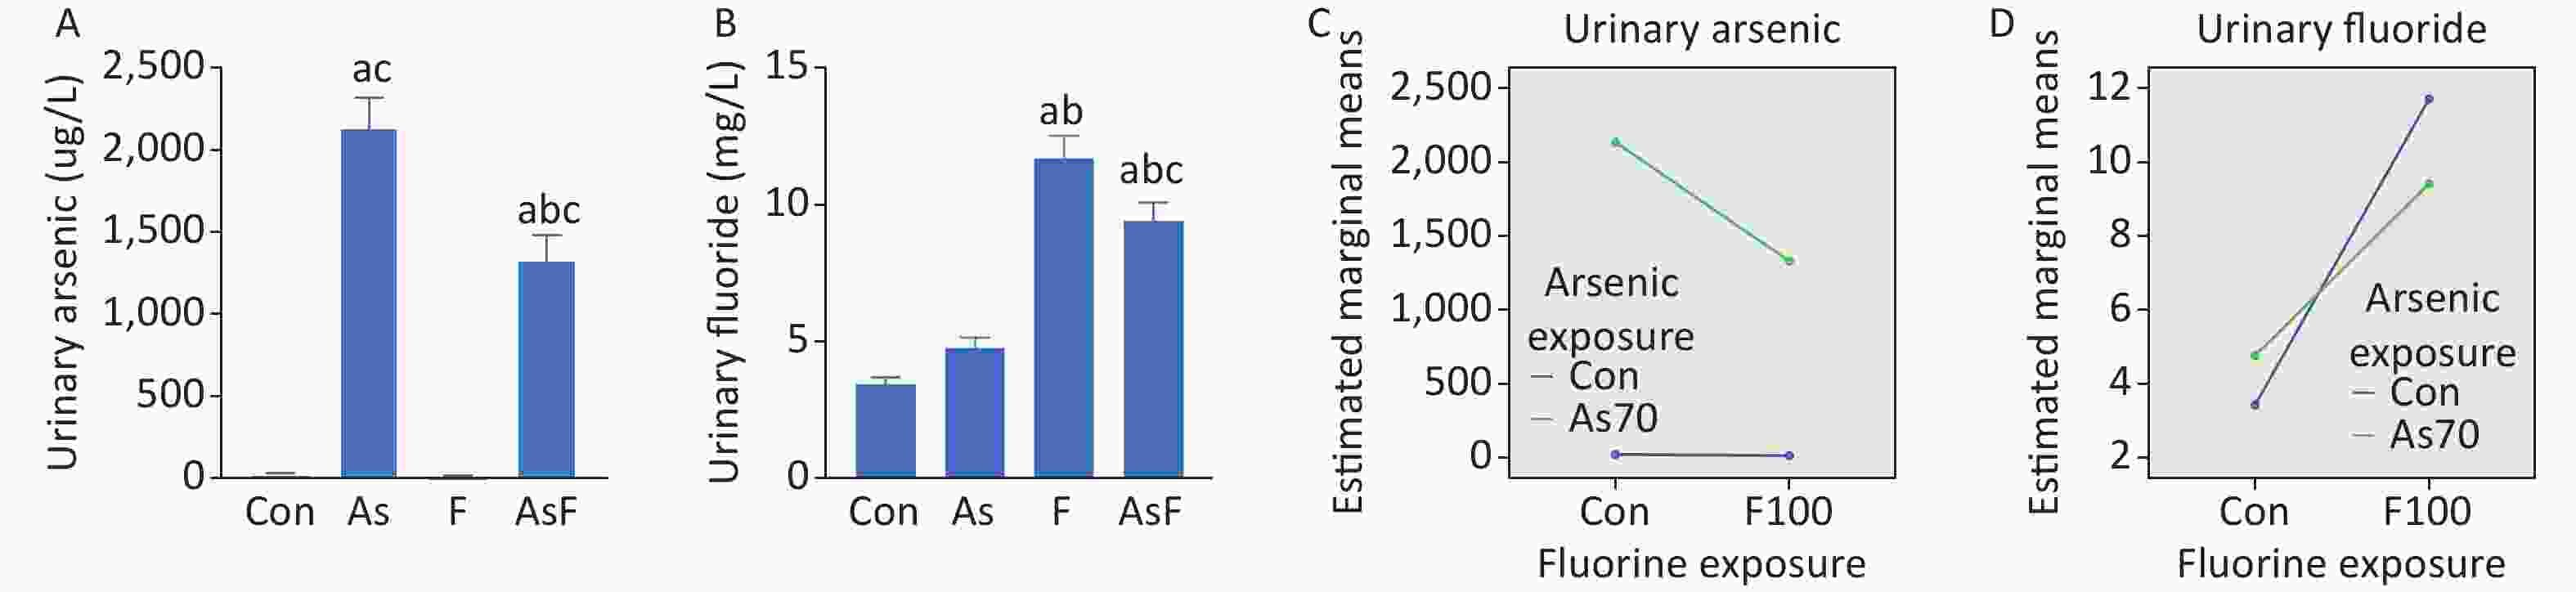
Figure 1. Internal exposure and interaction of As and/or F. Urinary arsenic content (A). Urinary fluoride content (B). Interaction of urinary arsenic (C). Interaction of urinary fluoride (D). The values are expressed as the mean ± SEM; n = 6; aP < 0.05 vs. Con group; bP < 0.05 vs. As group; cP < 0.05 vs. F group.
-
The effects of As and/or F on spatial learning and memory in rats, including spatial navigation training and spatial exploration tasks, were evaluated using the Morris water maze test. On the first day of spatial navigation training, the Con group took the shortest time to find the platform than the other groups of rats. As the duration of training increased, the time taken by the rats to find the platform gradually decreased. On day 5 of training, escape latency was significantly longer in the AsF group than in the other groups (P < 0.05) (Figure 2A). No other statistically significant differences were observed between the groups.
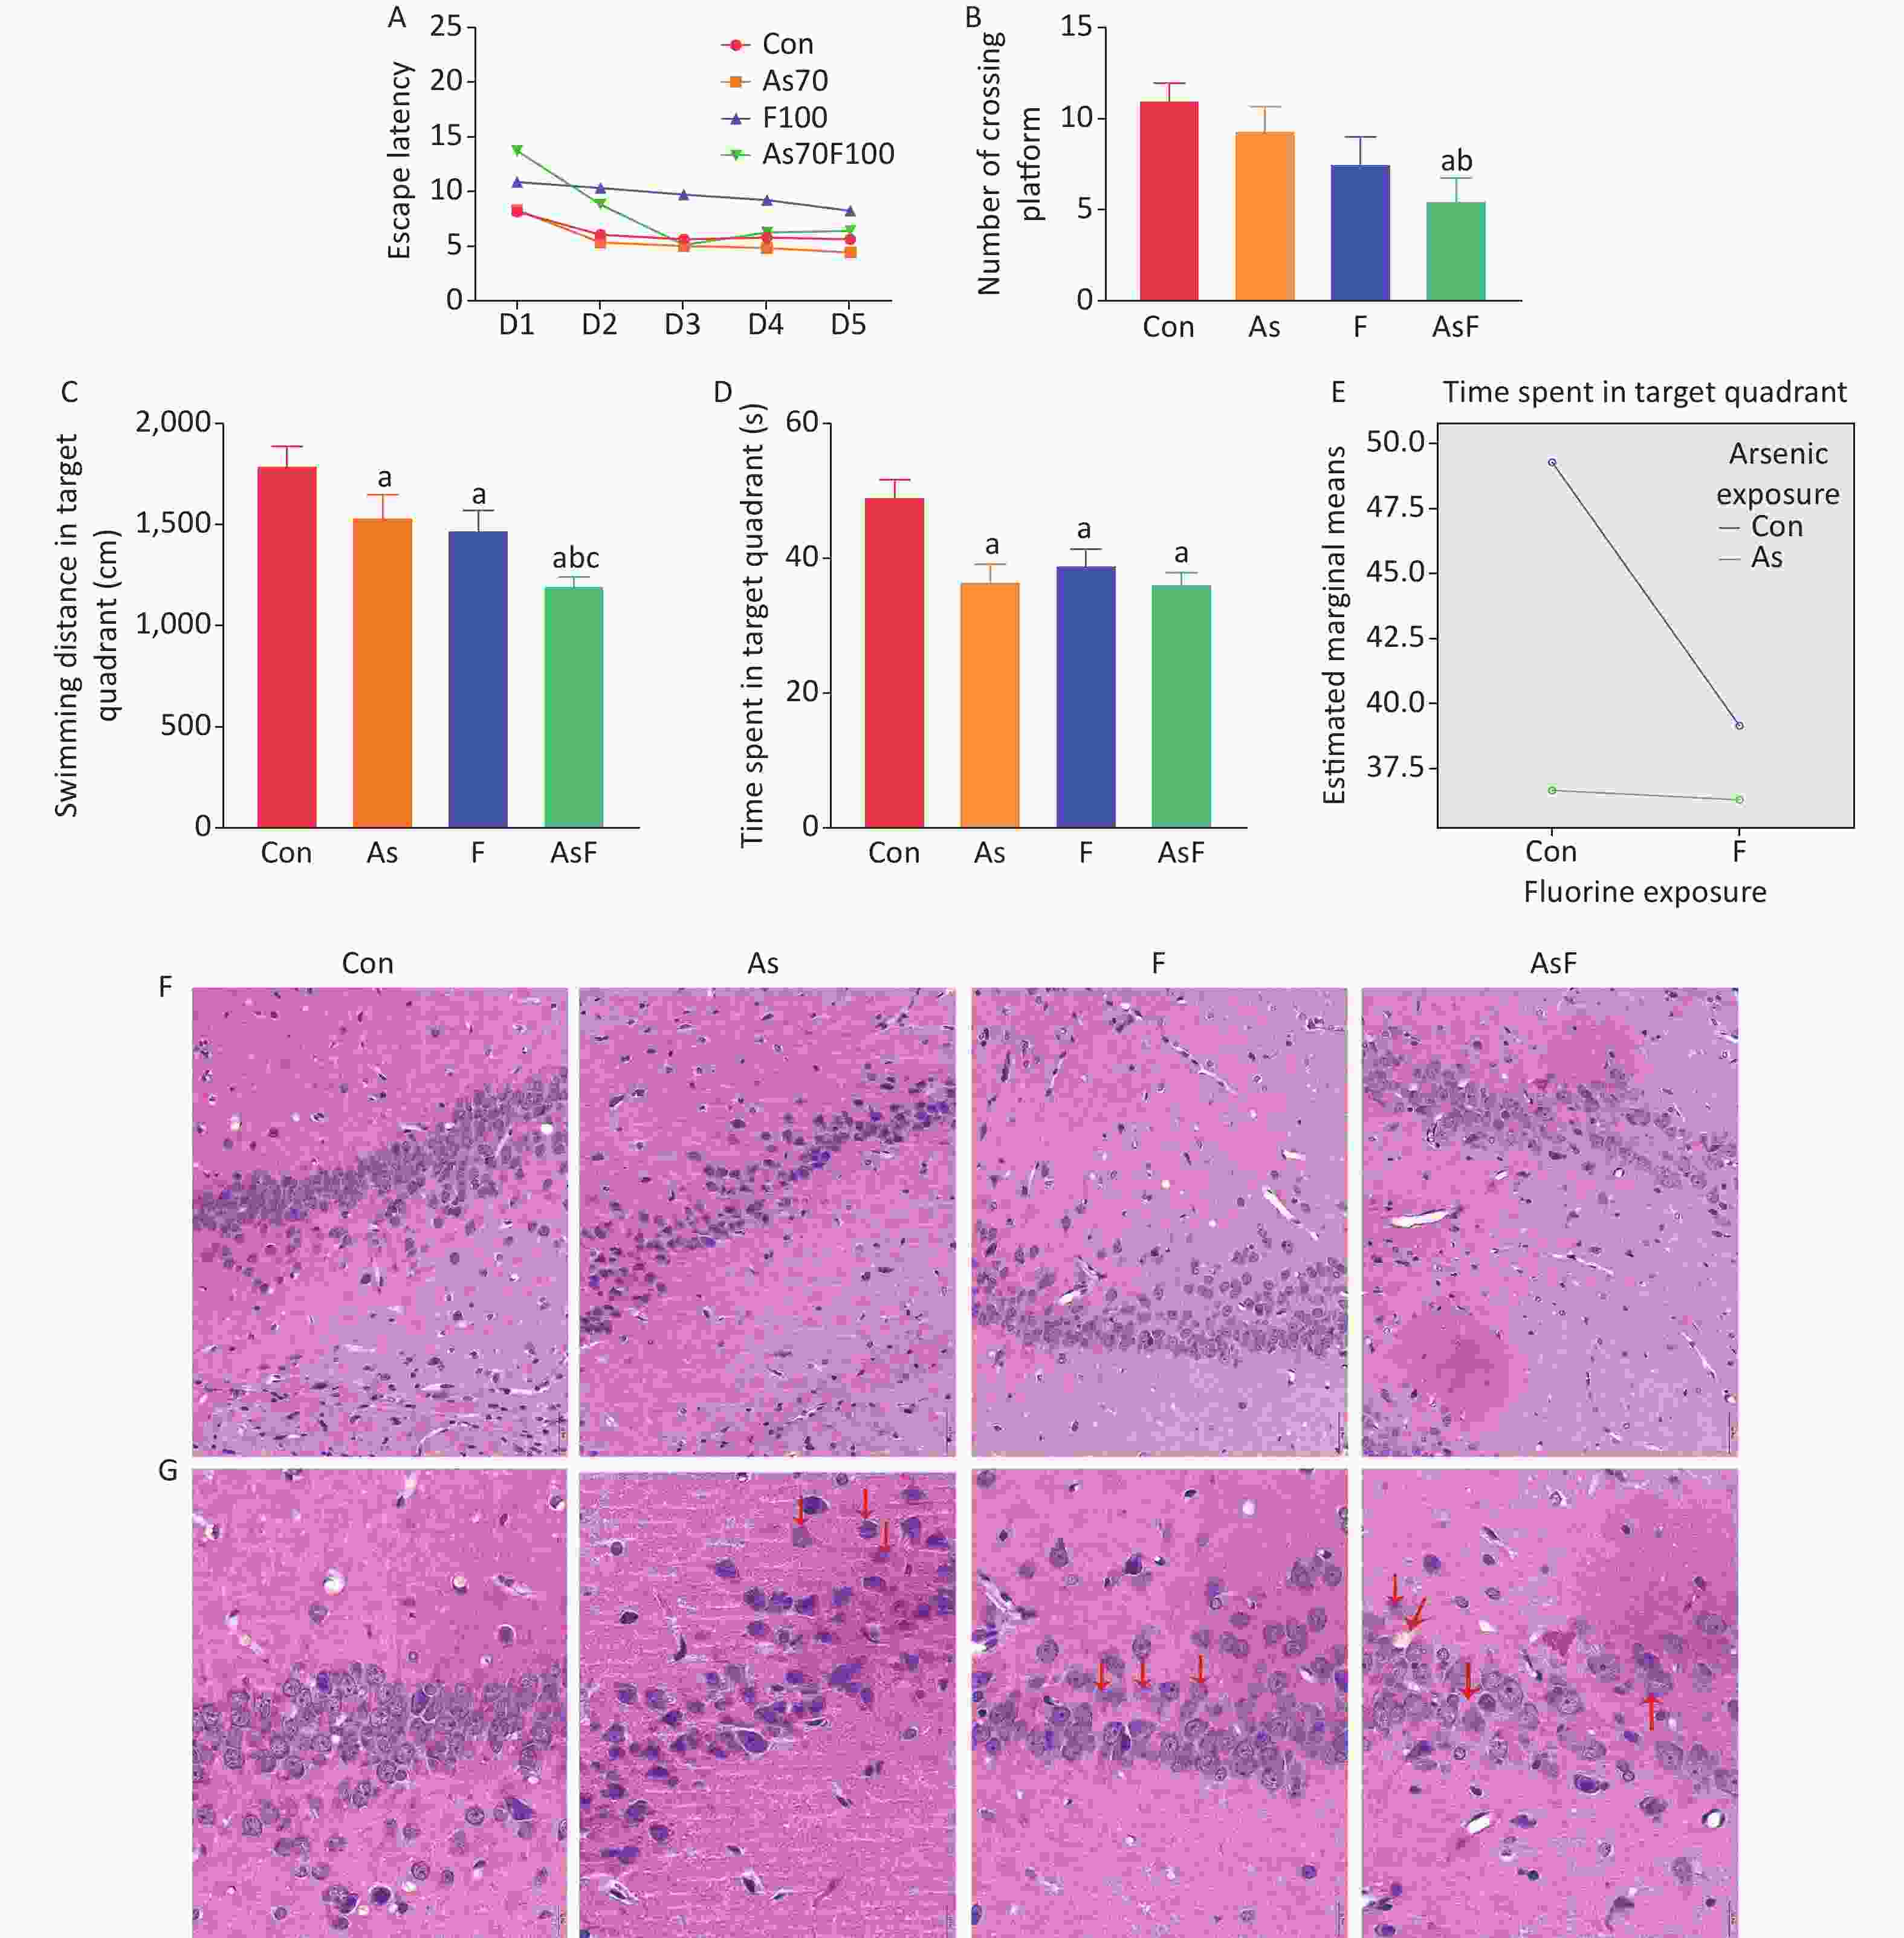
Figure 2. Effects of As and/or F exposure on spatial learning and memory and pathological changes. Escape latency (A). Number of crossing platform (B). Swimming distance in target quadrant (C). Time spent in target quadrant (D). Interaction of time spent in target quadrant (E). Histopathological changes of hippocampal CA1 area after H&E staining (scale bar, 50 µm) (F). Histopathological changes of hippocampal CA1 area after HE staining (scale bar, 20 µm) (G). The red arrow markers indicate nerve cells with pathological changes. The values are expressed as the mean ± SEM; n = 6; aP < 0.05 vs. Con group; bP < 0.05 vs. As group; cP < 0.05 vs. F group.
Data from rats on day 6 of the spatial exploration task showed that a low number of crossing platform, shorter time spent in the target quadrant, and shorter swimming distance in the target quadrant among rats in the exposed group. Although rats in the As and F groups traversed relatively fewer platforms, no statistically significant difference was detected between groups. Moreover, rats in the AsF group had the lowest number of crossing platform (P < 0.05) (Figure 2B). As shown in Figure 2C and 2D, the results indicated that the swimming distance in the target quadrant and the time spent in the target quadrant were significantly lower in the As, F, and AsF groups than in the control group (P < 0.05). Despite spending relatively less time in the target quadrant, the AsF group did not show statistically significant differences compared with the As or F groups alone. In the spatial exploration task, the results of the analytical design showed a synergistic effect of arsenic and fluorine on the time spent in the target quadrant (Figure 2E). However, no interaction between arsenic and fluorine was observed in relation to the number of crossing platforms and the swimming distance in the target quadrant.
In the control group, neurons in the CA1 region of the hippocampus were sequentially arranged and morphologically normal with clear nucleoplasmic staining and no obvious lesions. In the As group, mainly irregularly arranged and loosely packed cells were observed, with obvious nuclear lysis and nuclear destruction. In the F group, the neuronal cells were not only loosely arranged but also had enlarged cytosolic gaps. In addition, in the AsF group, the number of neuronal cells was significantly reduced compared to that in the control group, and the arrangement of neurons was more loosely disorganized. Meanwhile, obvious vacuolization and pathological changes were observed, with nuclear cleavage and nuclear destruction (Figure 2F and G). Thus, As and/or F exposure caused alterations in neuronal cell numbers and pathology to varying degrees.
-
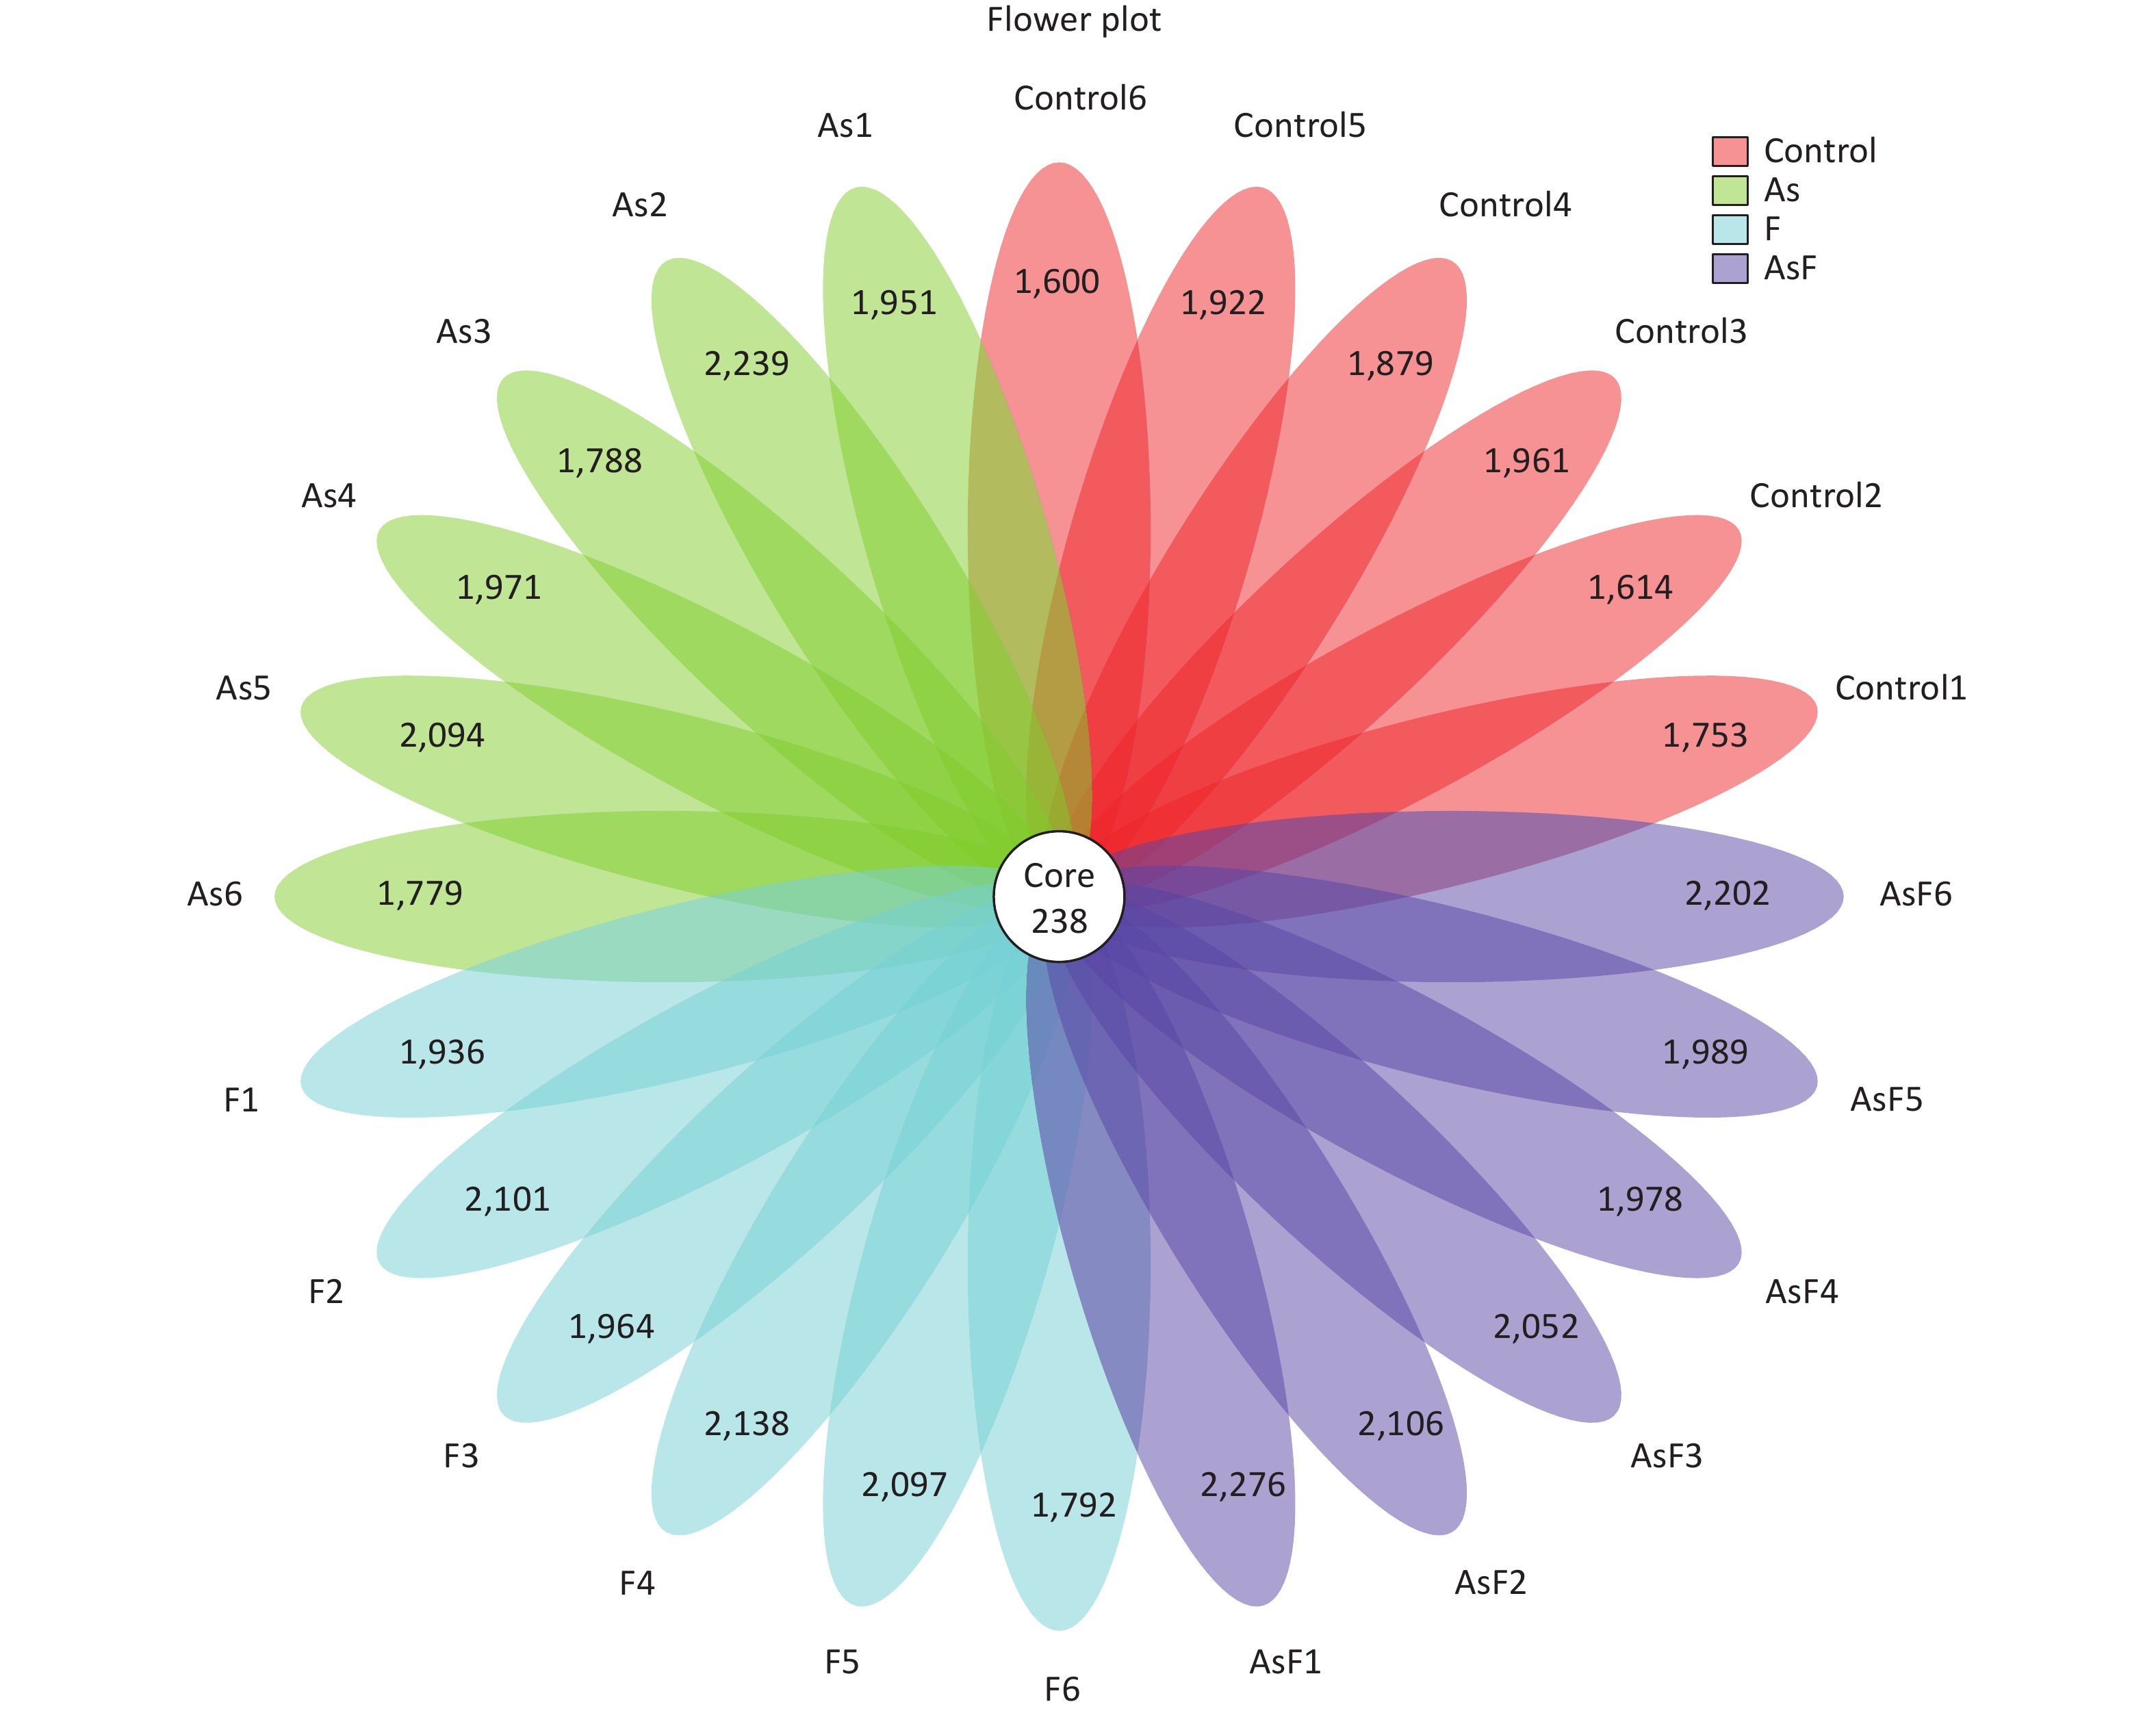
From the Con, As, F, and AsF groups, 2,026, 2,208, 2,243, and 2,339 OTUs were obtained, respectively, with 238 shared OTUs (Supplementary Figure S1, available in www.besjournal.com). OTU annotations at the phylum, class, order, family, and genus levels were assigned to 18, 32, 73, 128, and 256, respectively. At the phylum level, as shown in Figure 3A, Firmicutes, Bacteroides, Proteobacteria, Tenericutes, and Actinobacteria were the top five phyla ranked by relative abundance. Similarly, at the genus level, the dominant bacteria in the control group were Bacteroides and Lactobacillus, whereas Lachnospiraceae_NK4A136_group played an important role in the As group, and Lactobacillus was more abundant in the F and AsF groups (Figure 3B). Krona analysis also showed that the main genus level bacteria were Lactobacillus, especially Murinus Lactobacillus, in the AsF group (Figure 3C).
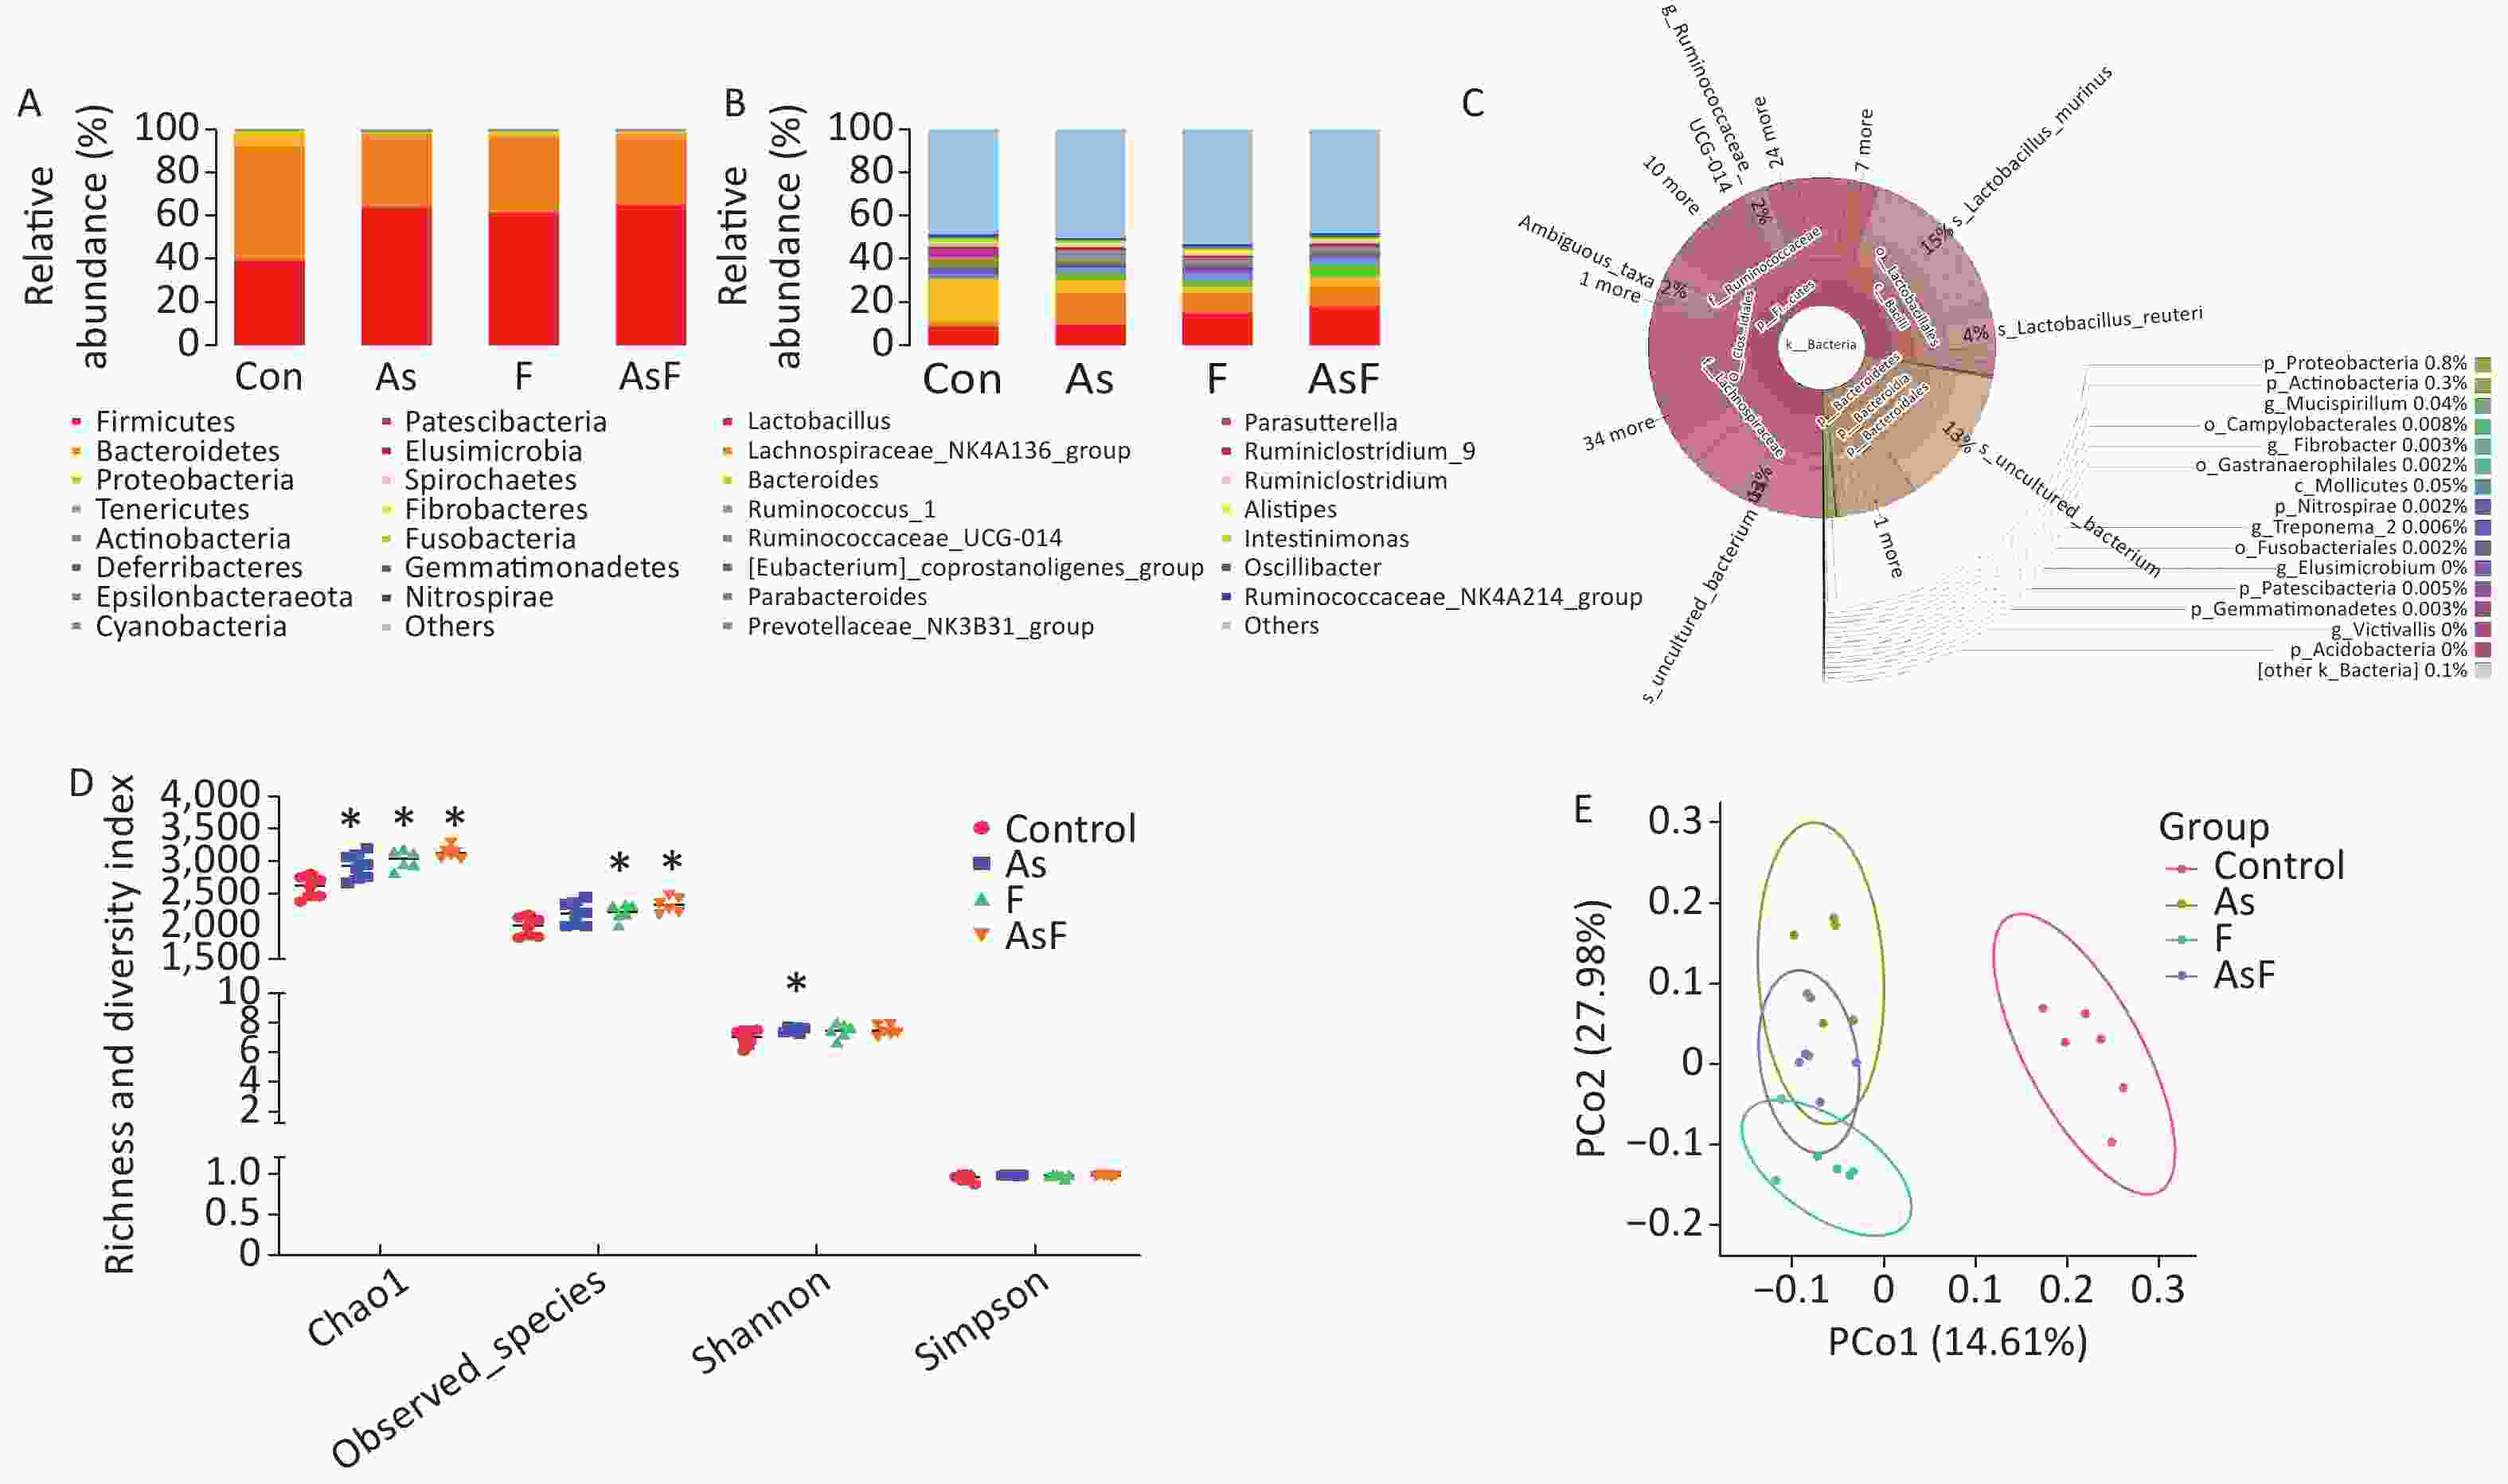
Figure 3. As and/or F exposure alters microbiome community structure and diversity. Histogram of relative abundance of the top 15 bacterial phyla (A). Histogram of the relative abundance of the top 15 bacterial genera (B). Community structure Krona plots were used to visualize the annotation results performed on the species, with the size of the sectors representing the relative proportions of the different OTU annotation results (C). Alpha diversity of bacterial communities (D). Microbiome patterns were distinguished between control and exposed groups by unsupervised principal coordinate analysis (PCoA) based on unweighted Unifrac distance (E). *P < 0.05 vs. Con group
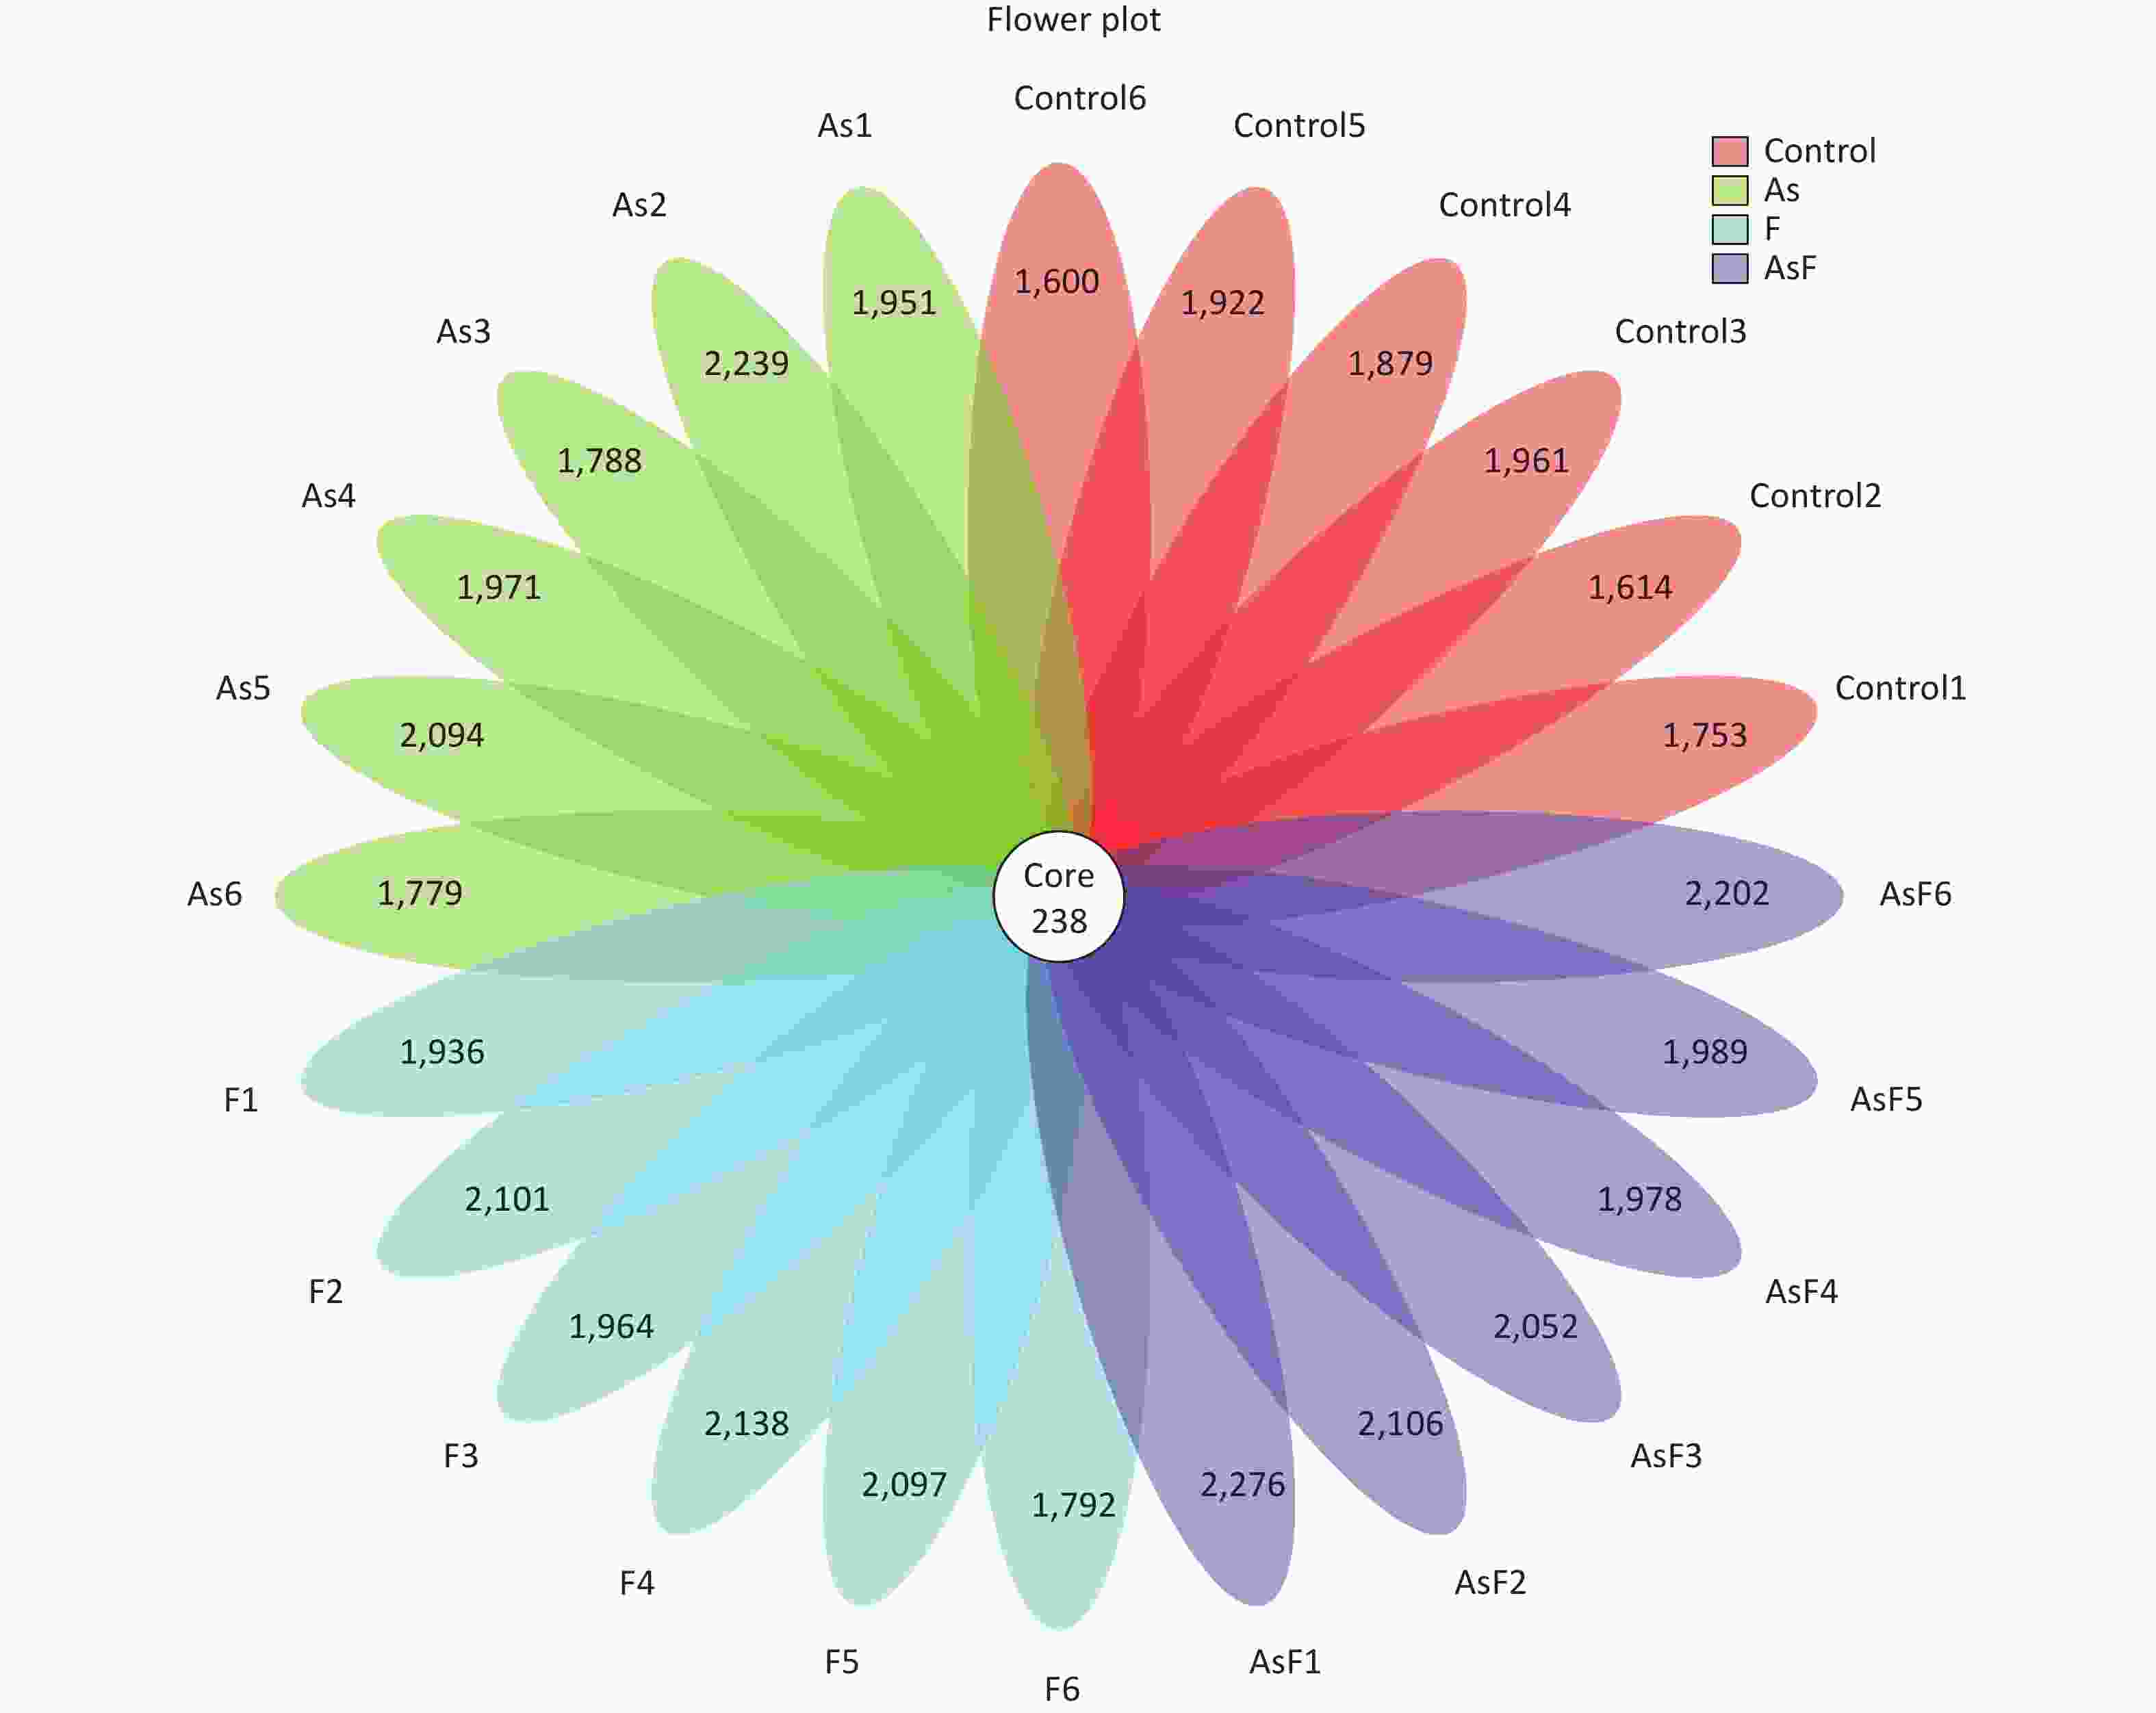
Figure S1. Flower plot of OTUs for each sample. The 238 in Core represents the OTUs common to all samples (Core OTUs), and the number on the flower petal represents the total OTUs of each sample minus the number of common OTUs.
The results of the observed species index showed that the species abundance was significantly higher (P < 0.05) in the F and AsF groups than that one of the control group, suggesting a higher species richness. The same trend was observed for the Chao1 index in the exposed group, causing a significant increase in relative abundance compared to the control group. In contrast, the Shannon diversity index only increased significantly in the As group compared to the C group. However, no significant differences were observed between the F and AsF groups (P > 0.05). Similarly, no change in diversity was detected in the Simpson diversity index (Figure 3D). Based on unweighted UniFrac distances, differences among individuals or groups caused by As and/or F exposure were assessed using a PCoA analysis of beta diversity. Principal coordinates 1 and 2 (PCo1 and PCo2) explained 14.61% and 27.98% of the variance between groups, respectively, indicating that their composition was significantly different among the exposed and control groups (Figure 3E).
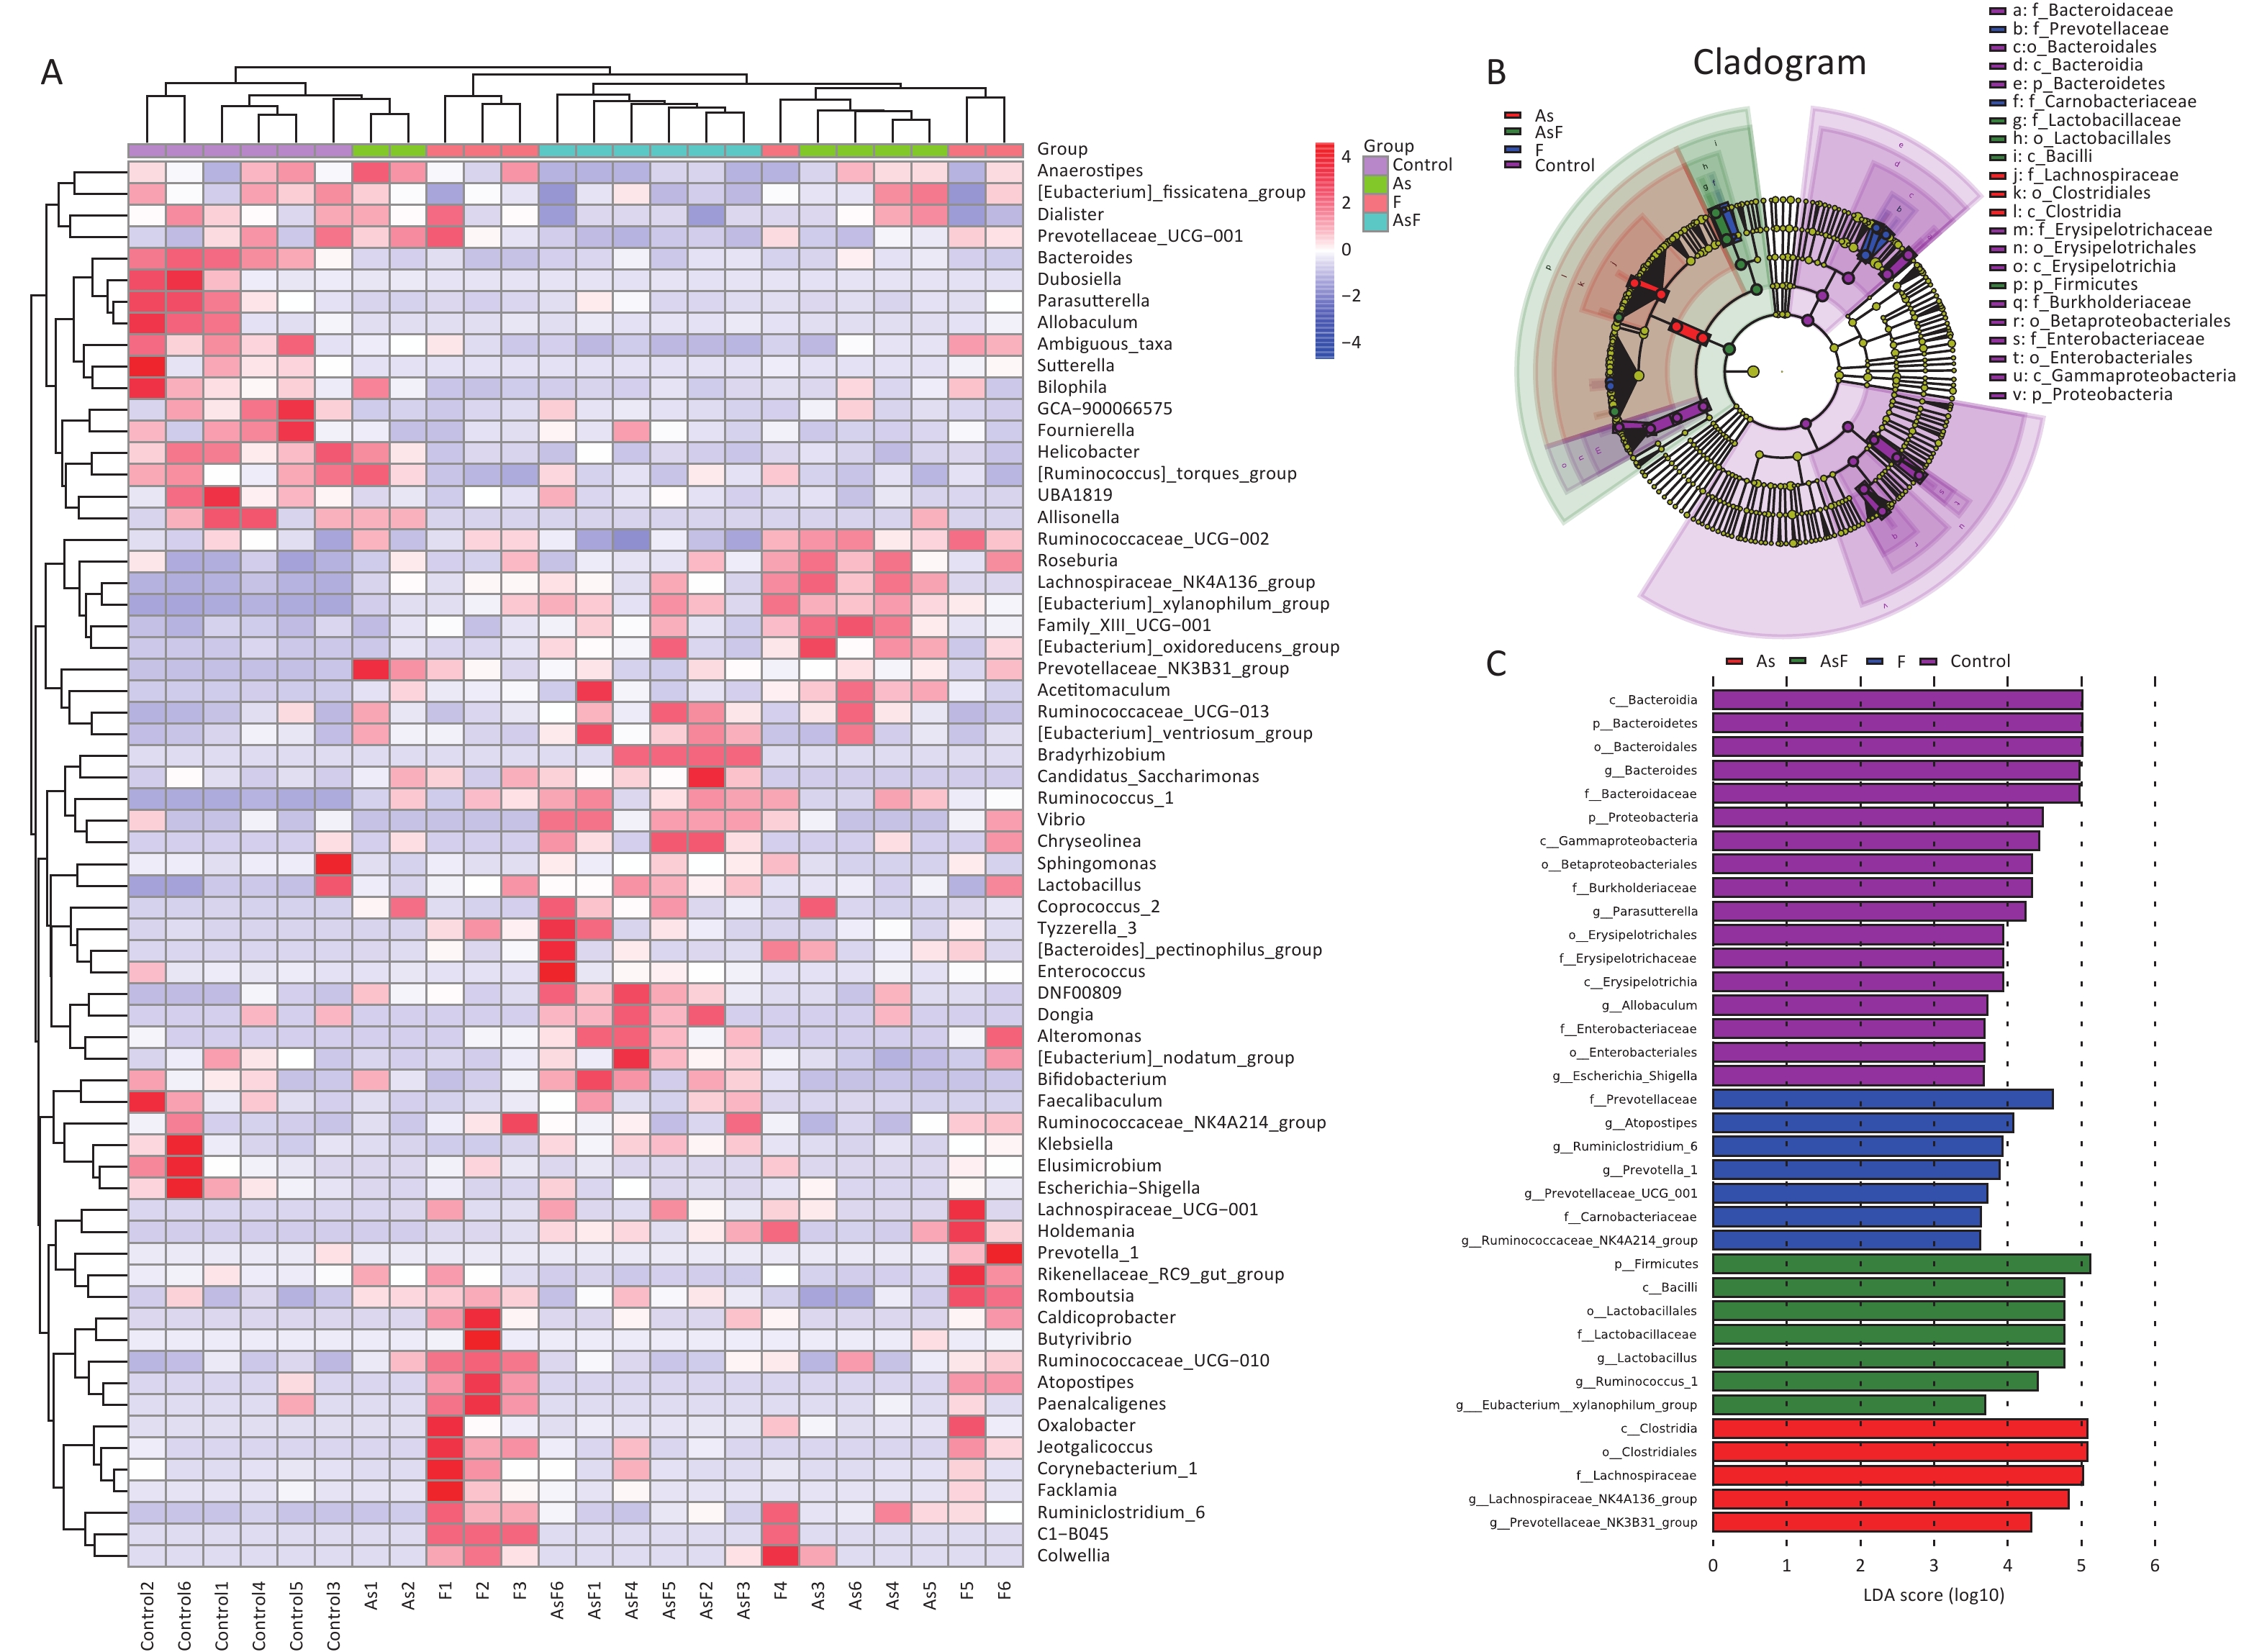
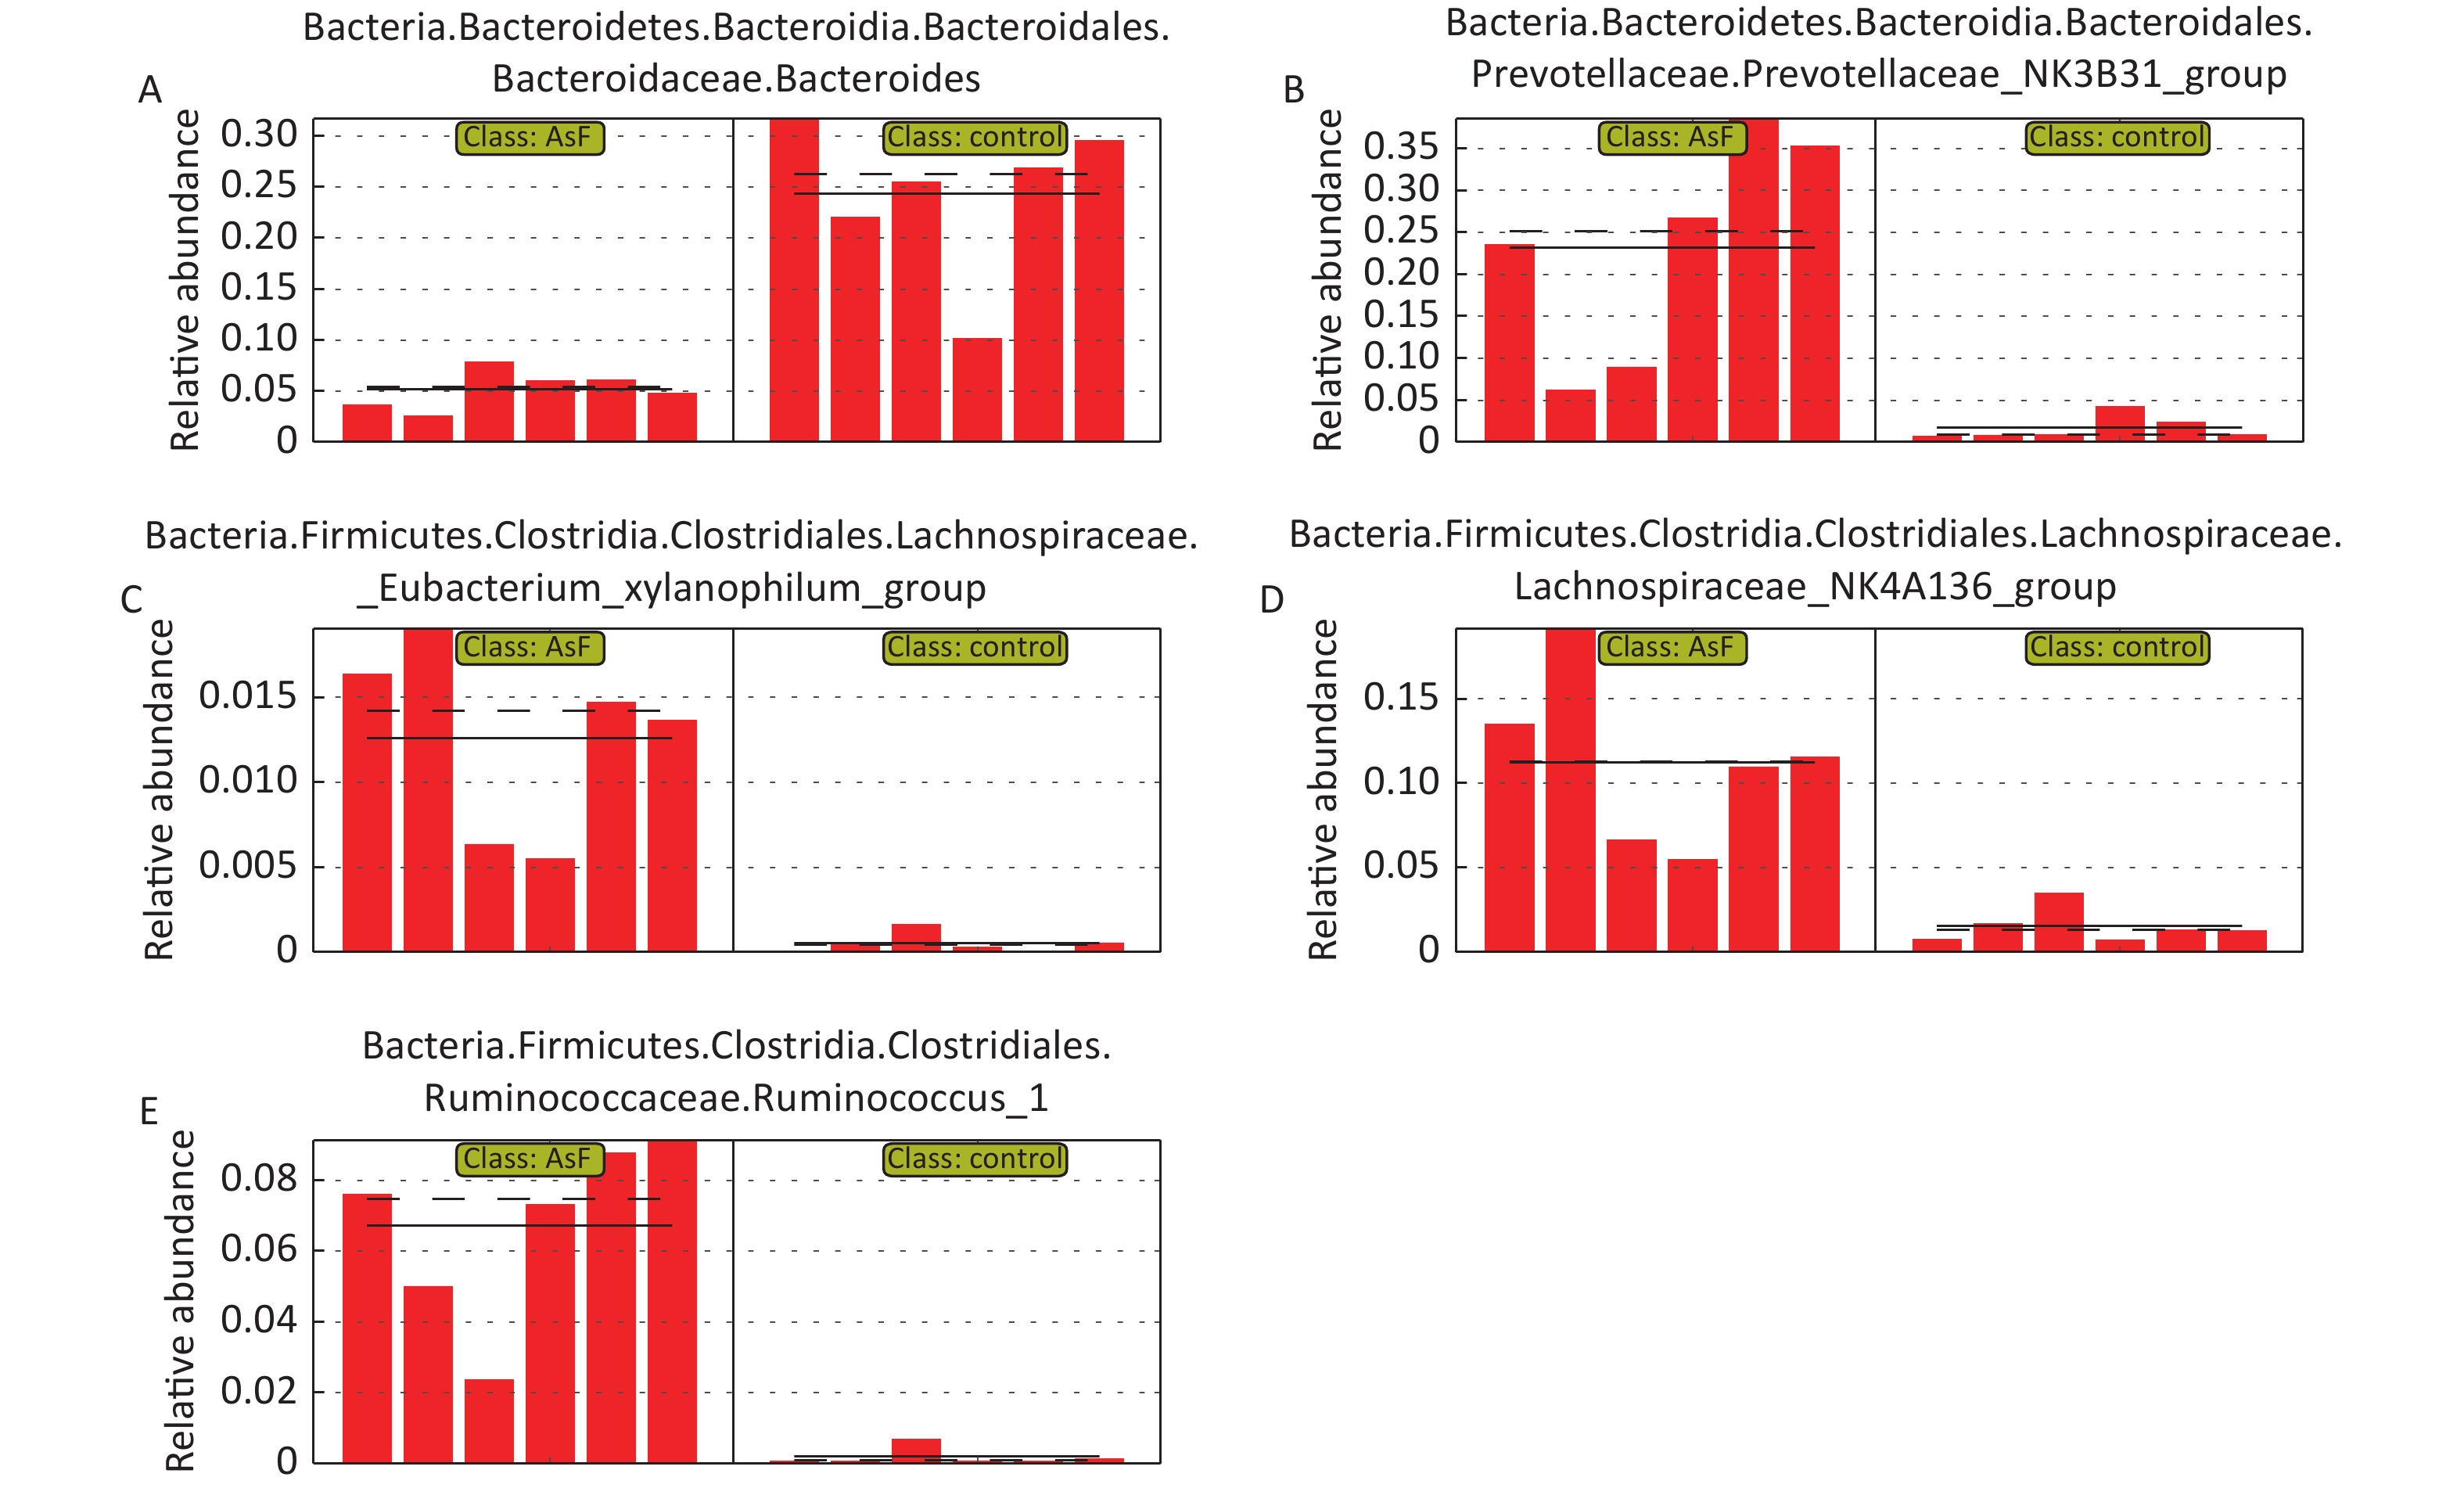
LEfSe Analysis to Identify the Composition of Differential Species As shown in Figure 4A, significant differences were observed among the groups at the genus level for representative species. Among these, 65 differential genera were identified between the control and the three exposed groups, with 20, 26, and 23 differential genera in As, F, and AsF, respectively, compared with the control group. The annotated branching example diagram of differential species showed that the nodes of each layer represented the phylum/class/order/family/genus from inside to outside, revealing the branching and characteristic groups of the microbial community structure (Figure 4B). Only the taxa meeting a linear discriminant analysis (LDA) significant threshold > 2 are presented for assessing differential effects between groups (Figure 4C). The relative abundance of these differential microbial species was significantly higher and more easily distinguishable than that of the other groups. In accordance with the LEfSe plots, Bacteroides and Parasutterella were abundant in the control group; Prevotellaceae_NK3B31_group and Lachnospiraceae_NK4A136_group could effectively distinguish the As group. Atoprostipes was more enriched in the F group; Lactobacillus, [Eubacterium]_xylanophilum_group, and Ruminococcus_1 were more abundant in the samples exposed to the AsF combination. In particular, five characteristic genera can effectively distinguish the control and AsF group with respect to changes in relative abundance levels, including the Lachnospiraceae_NK4A136_group, Ruminococcus_1, Prevotellaceae_NK3B31_group, [Eubacterium]_xylanophilum_group, and Bacteroides (Supplementary Figure S2, available in www.besjournal.com).
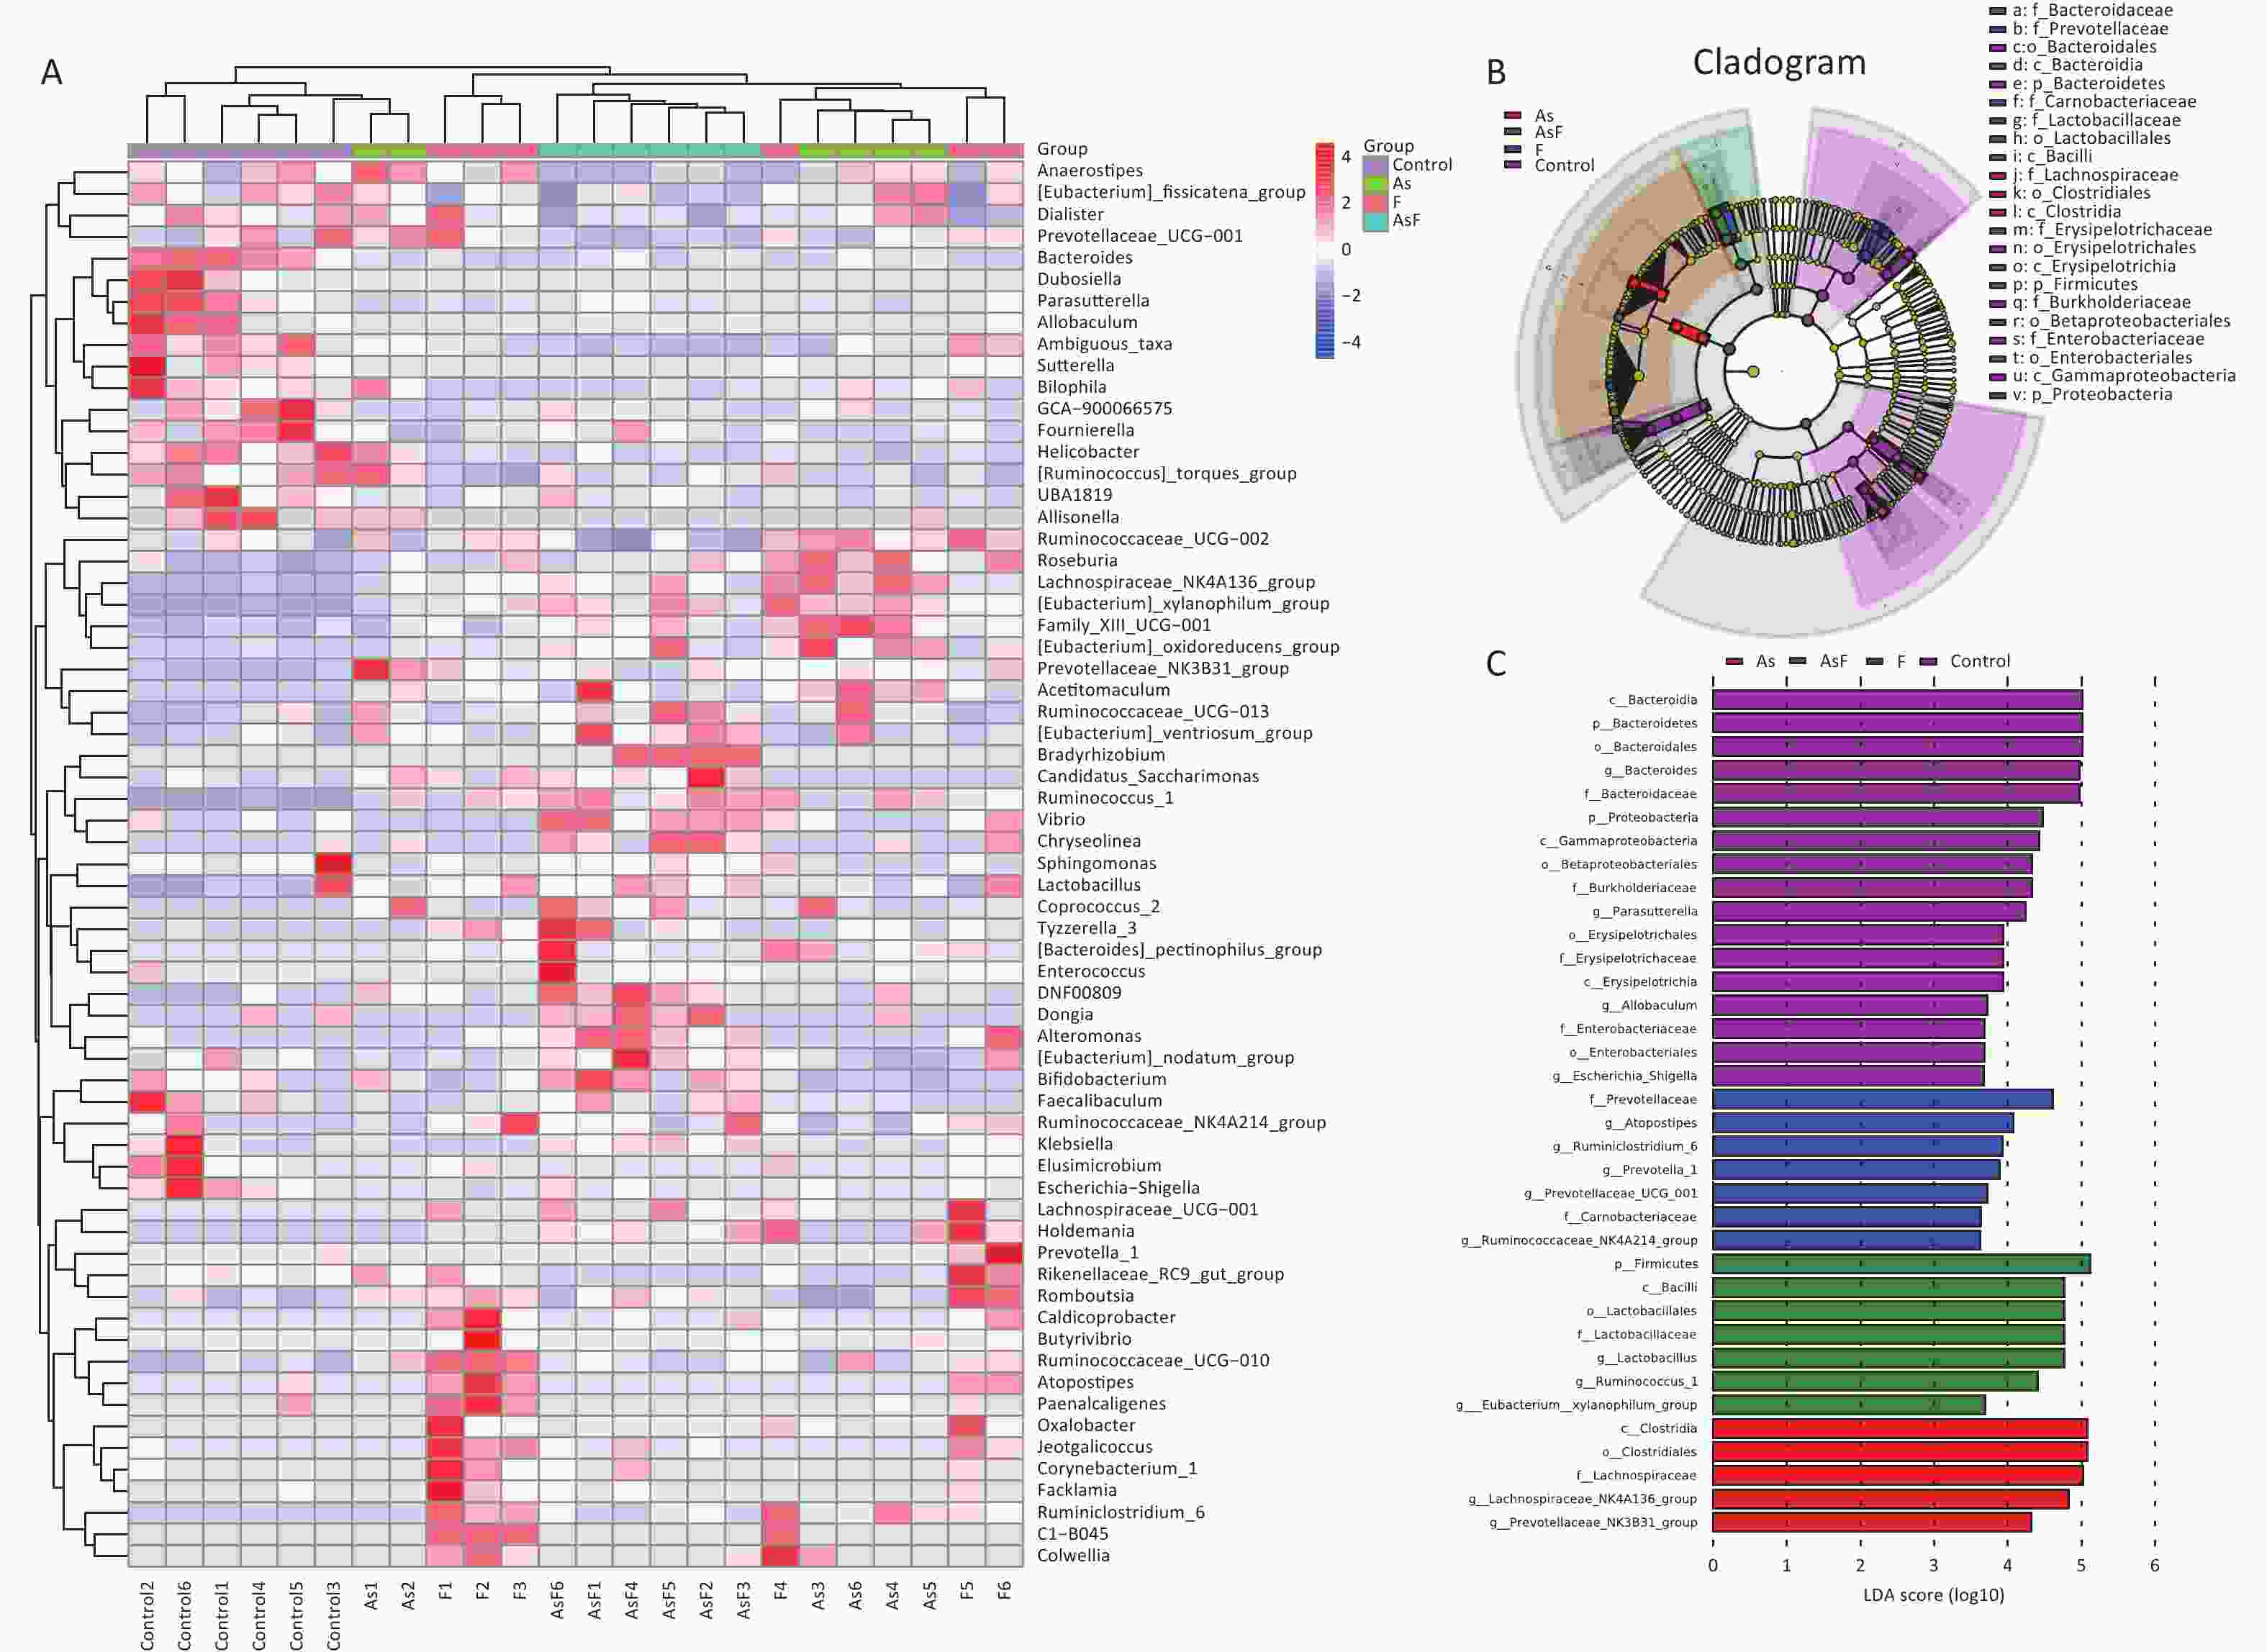
Figure 4. Differential microbial species identified by linear discriminant analysis effect size (LEfSe) analysis. Heatmap of the relative abundances carried out by differential microbial species between groups at the genus level (Use the scale parameter to improve the comparability of data) (A). Example maps of differential species annotated branches constructed based on LEfSe analysis between groups (B). Differential microbial species meeting the linear discriminant analysis (LDA) score significance threshold > 3.6 (C). Red indicates high relative abundance of species; blue indicates low relative abundance of species.
-
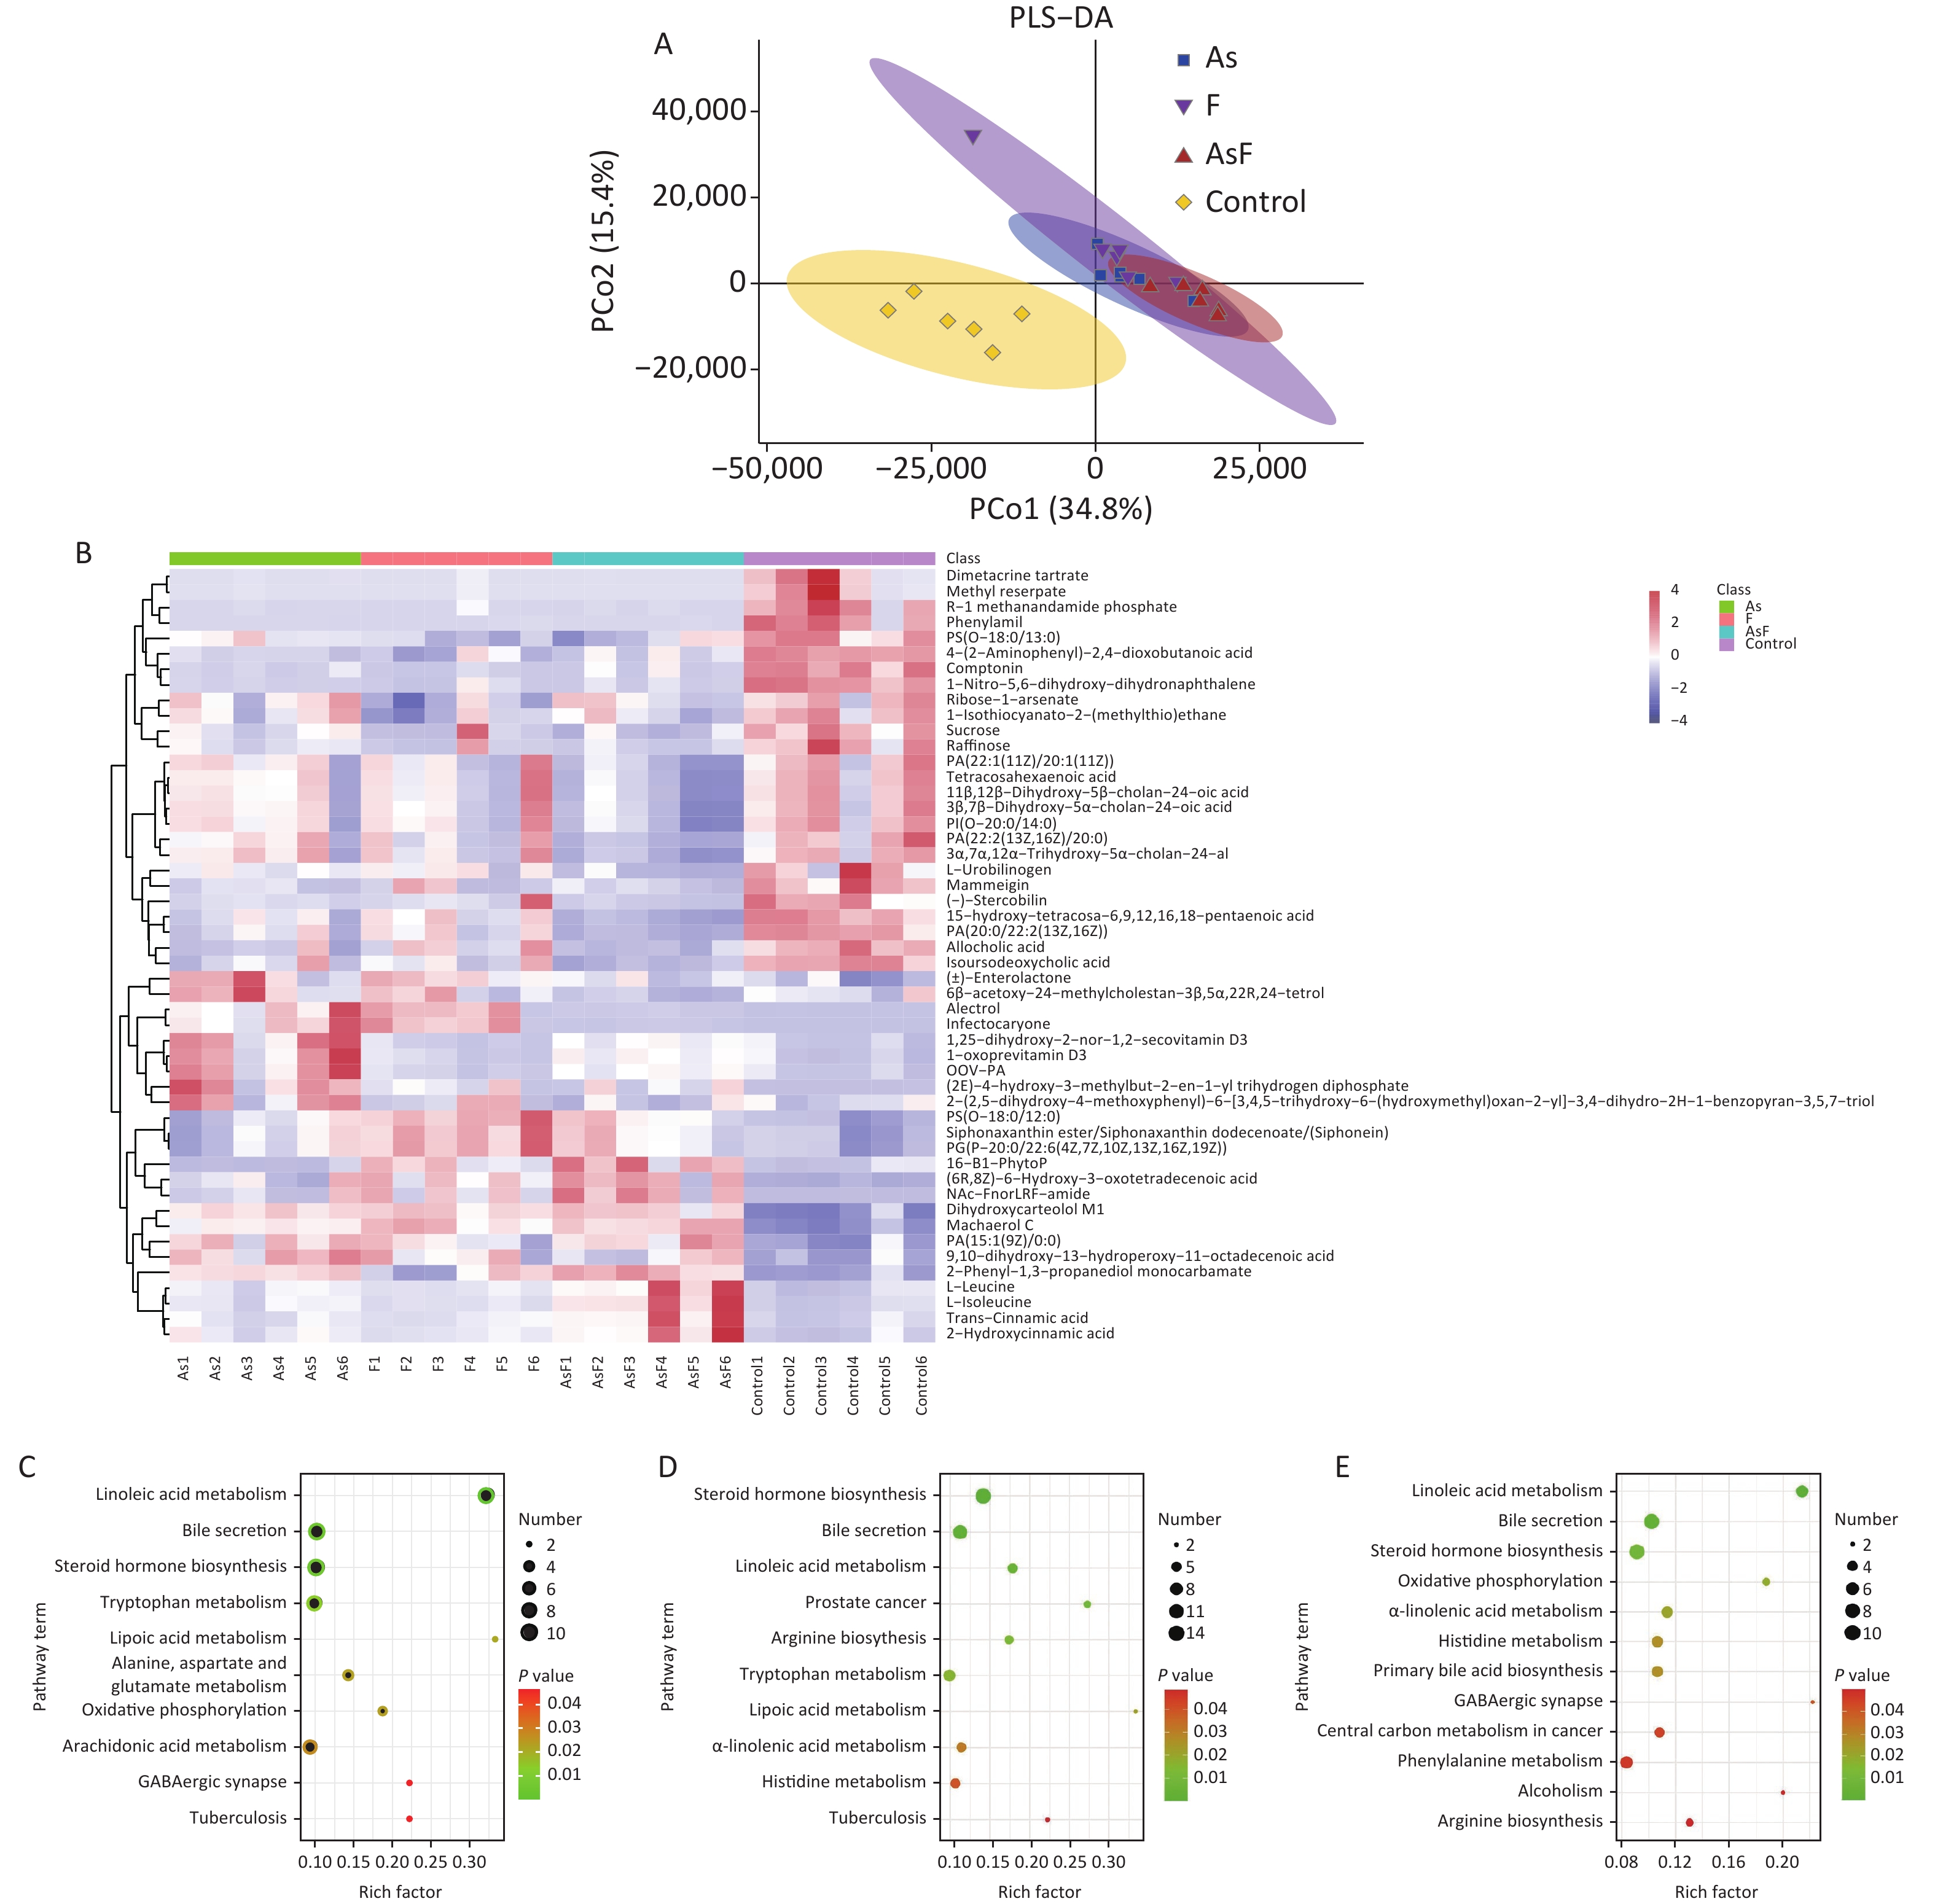
In the supervised partial least squares-discriminant analysis (PLS-DA), principal coordinates 1 and 2 (PCo1 and PCo2) accounted for 34.8% and 15.4% of the overall differences in metabolic profiles between the groups, respectively (Figure 5A). Among them, the elliptical regions of fecal metabolites were relatively far away in the exposed group compared to those in the control group, indicating significant differences occurred in the samples of the As and/or F exposed groups. Subsequently, the PLS-DA model was performed for permutation test, and the results showed that the model was not overfitted (Supplementary Figure S3, available in www.besjournal.com).
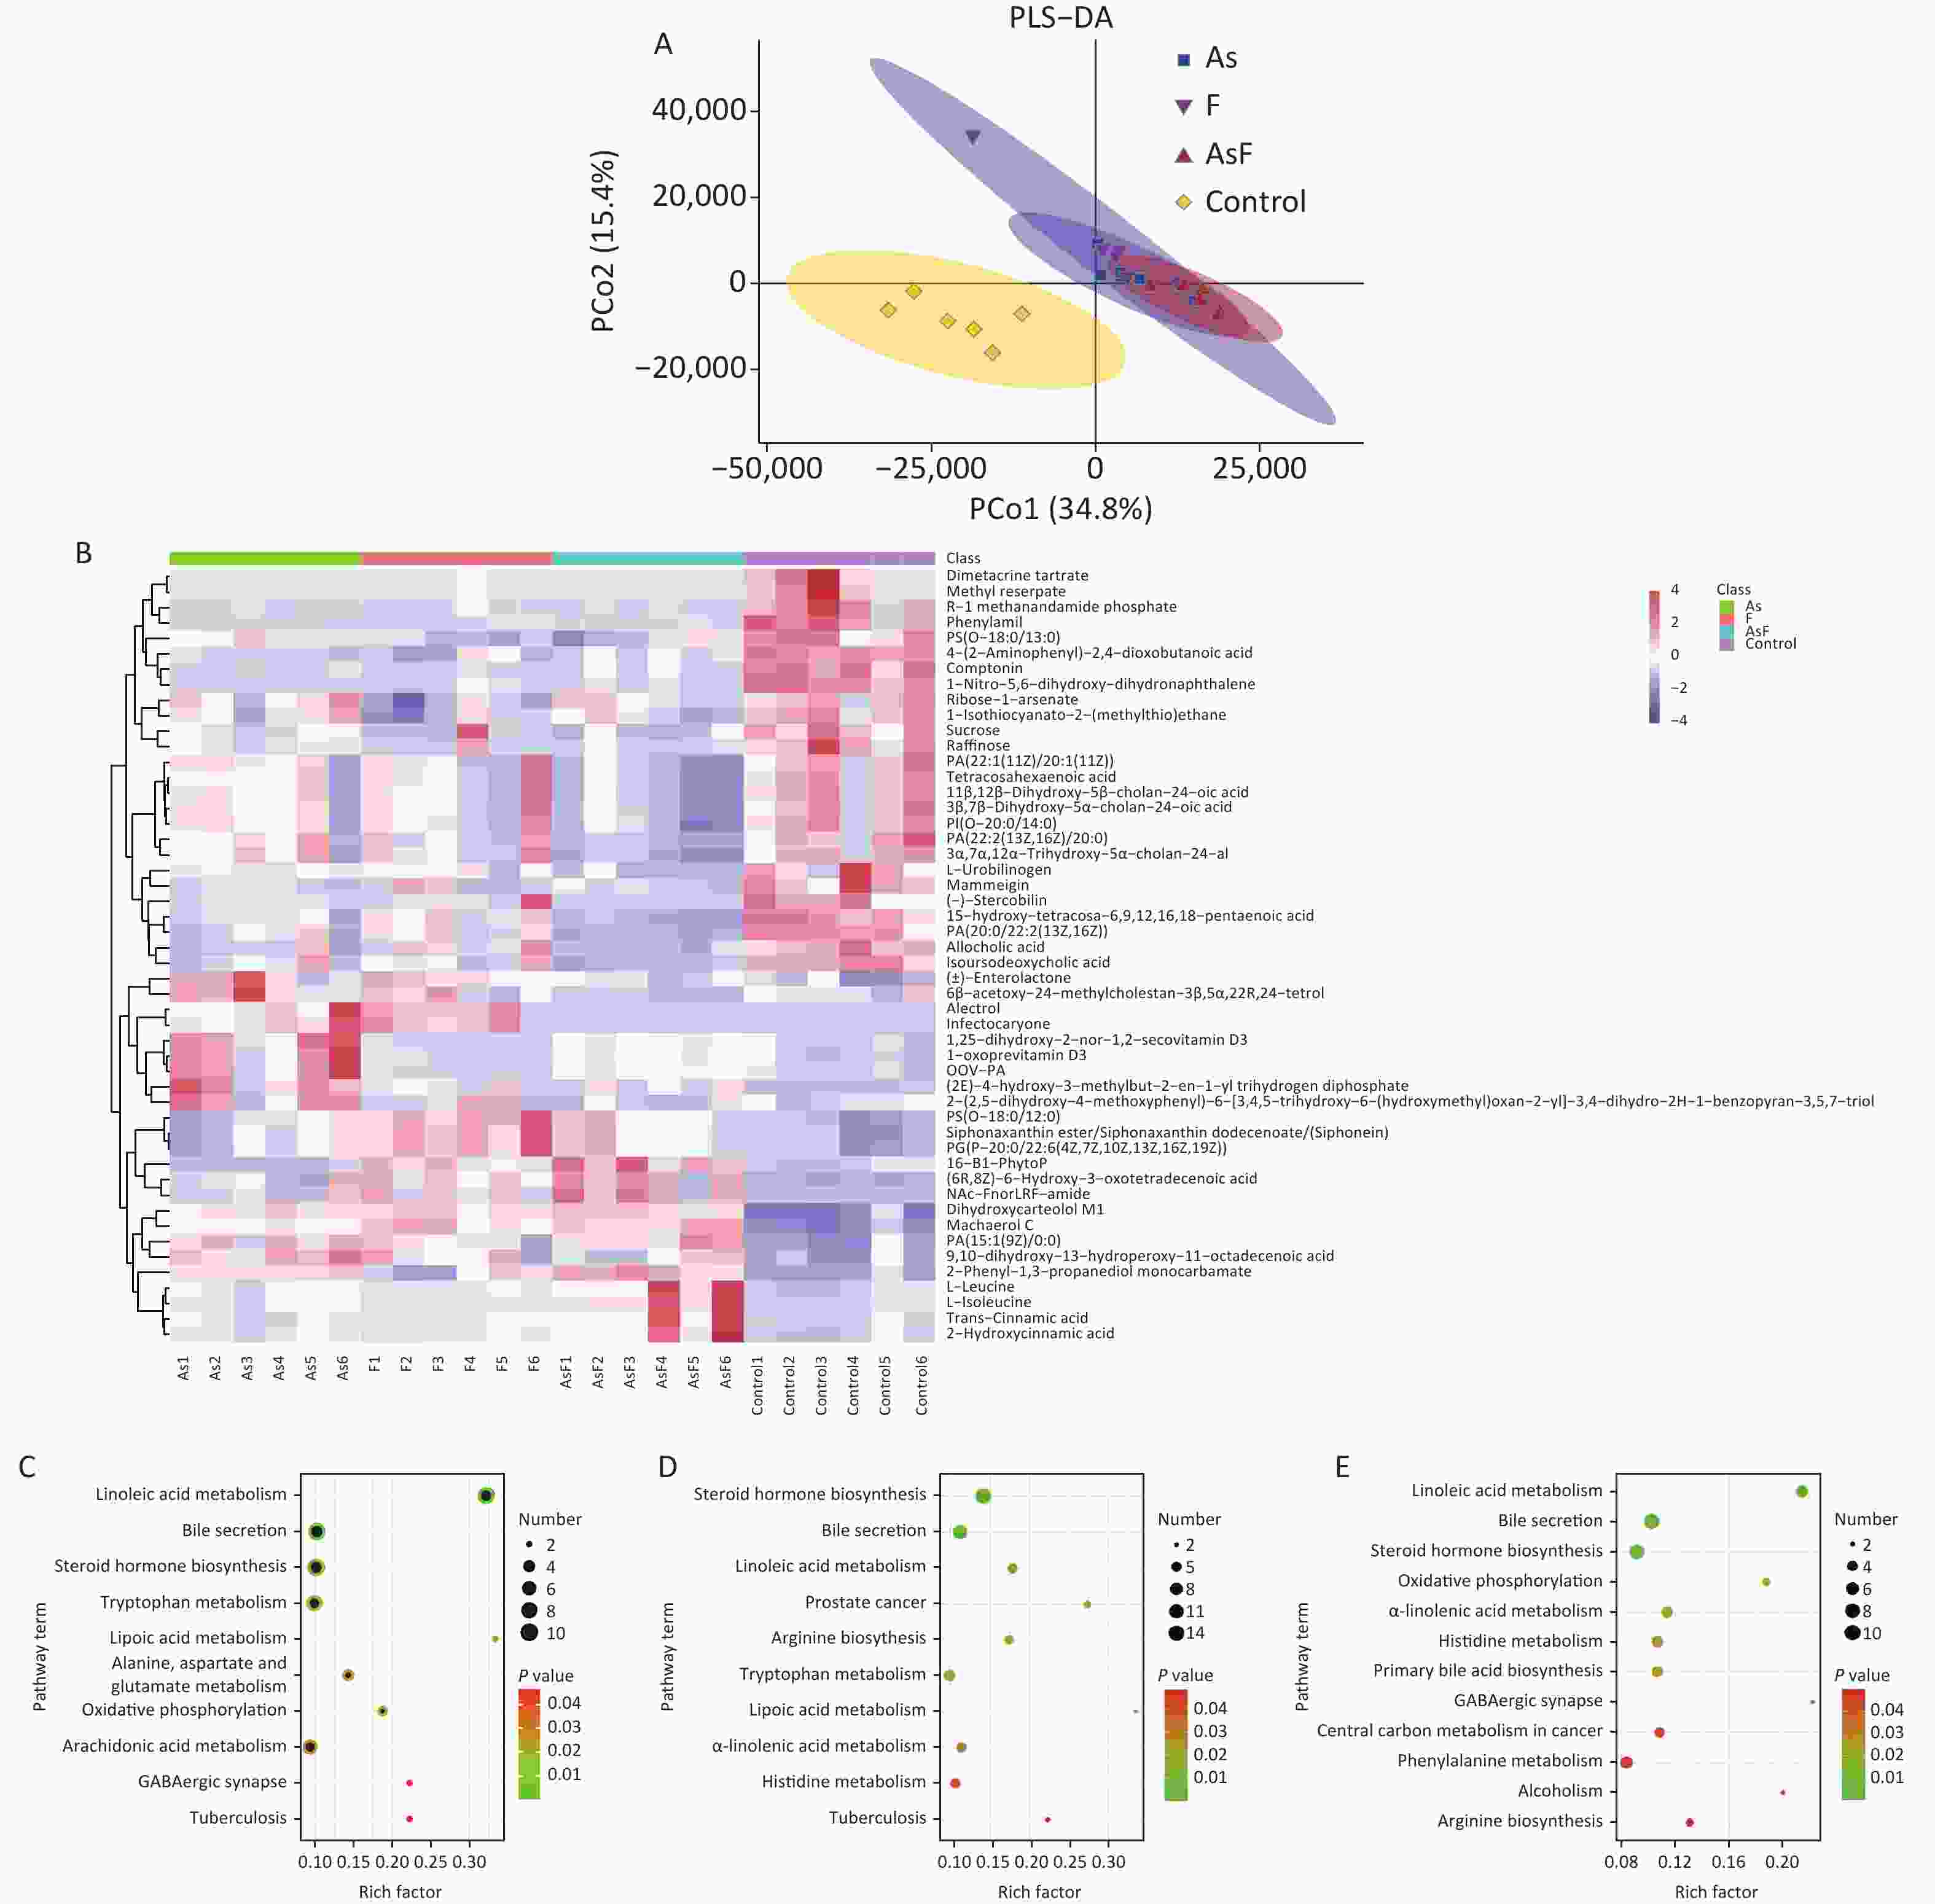
Figure 5. LC/MS untargeted metabolome analysis. PLS-DA diagram based on all groups (A). Heat map of differential metabolite expression abundance based on all groups (Use the scale parameter to improve the comparability of data) (B). Path bubble diagram of based on group As and Con (C), F and Con (D), and AsF and Con (E), P < 0.05. The abscissa is the enrichment factor (number of significantly different metabolites/total metabolites in the pathway). Red indicates high metabolite expression abundance;blue indicates low metabolite expression abundance. The ordinate is the name of metabolic pathway. The color scale (red to green) indicates a decreasing P-value. The larger the point, the more metabolites enriched on the metabolite.
Based on this criteria, 1,553, 1,572, and 1,462 different metabolites were enriched in the As, F, and AsF groups, respectively, compared to the control group. Next, all significantly differentially expressed metabolites were subjected to hierarchical clustering, and the top 50 differentially expressed metabolites were visualized according to VIP values (Figure 5B). Compared with the control group, 736 metabolite levels were elevated and 817 metabolite levels were decreased in the As group. Significantly higher and lower levels of the same number of metabolites (786) were detected between the control and F groups. Surprisingly, the gut metabolic profile showed 1,462 differential metabolites, 613 upregulated and 849 downregulated, in the combined exposure group compared to the control group (Supplementary Figure S4, available in www.besjournal.com).
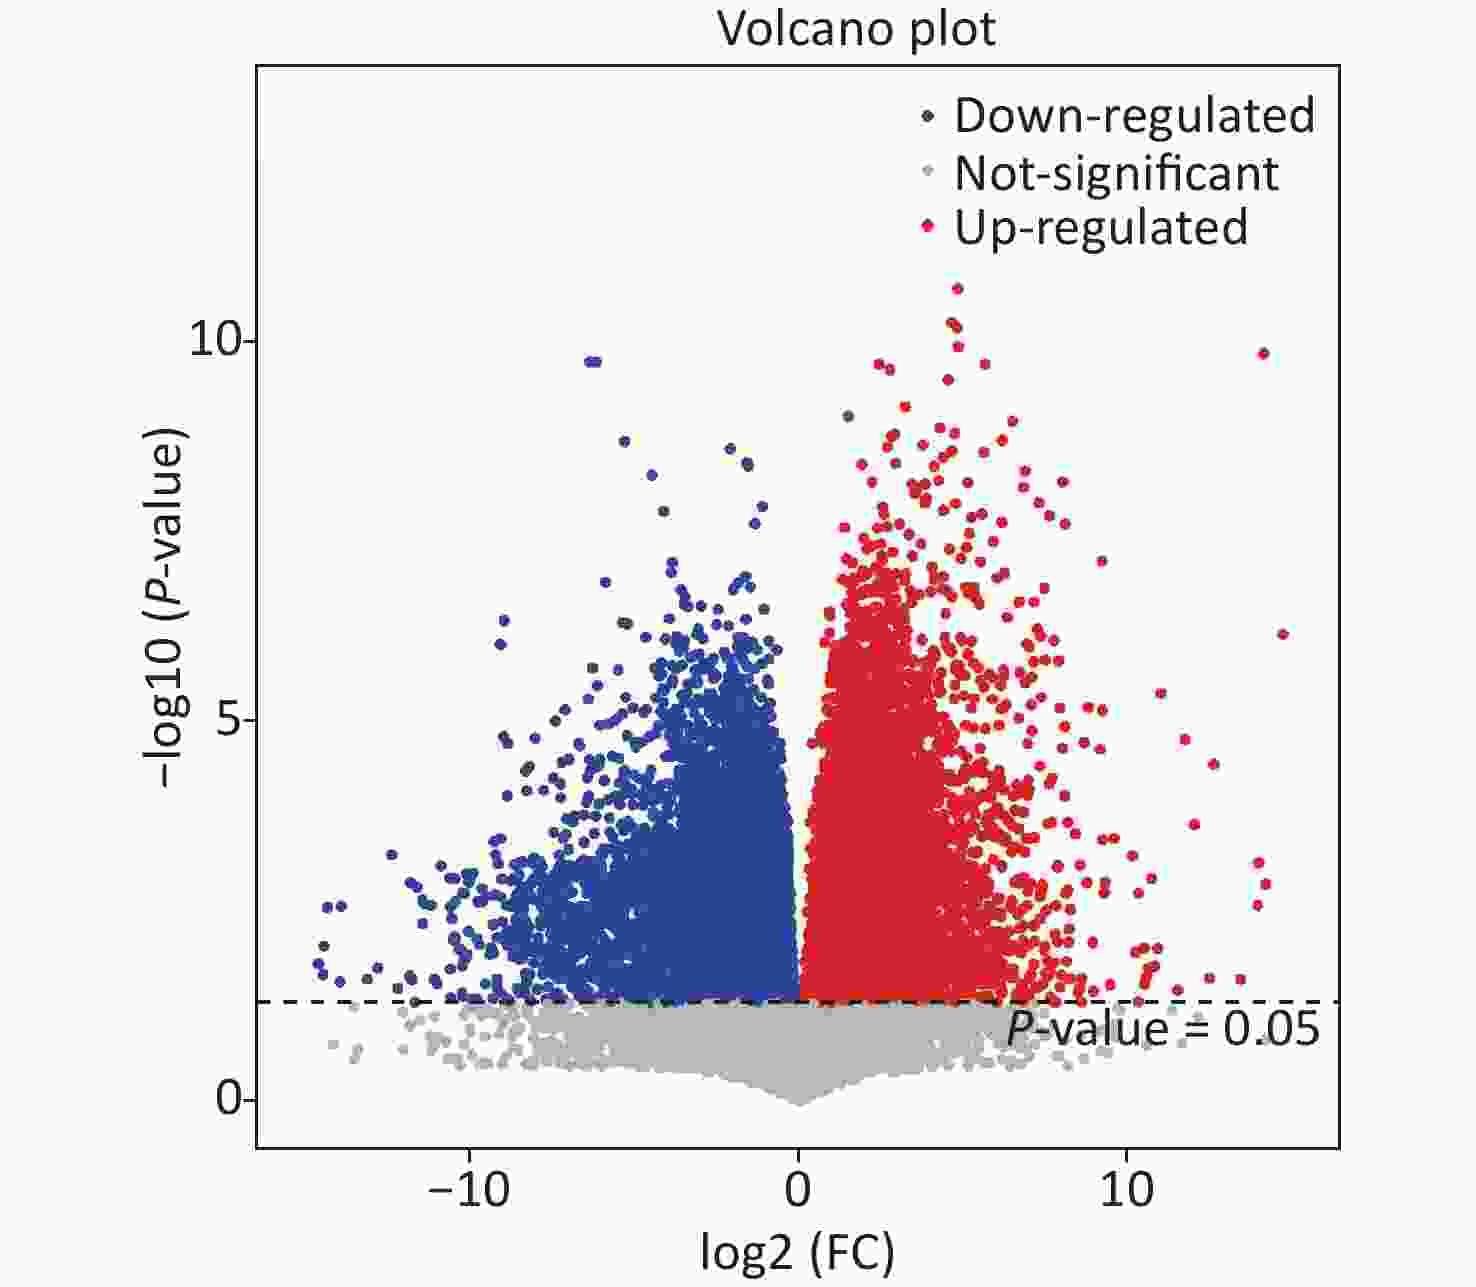
Figure S4. Volcano plot of differential metabolites based on group AsF and Con. Red and blue dots indicate the differential metabolites that are significantly up- and down-regulated in the two groups of comparisons, respectively, and gray dots represent metabolites that are not significantly different.
As shown in Figure 5C, As exposure causes a variety of metabolic disorders, including linoleic acid metabolism, steroid hormone synthesis, tryptophan metabolism, lipoic acid metabolism, aspartate and glutamate metabolism, oxidative phosphorylation, AA metabolism, and GABAergic synapses. Similarly, differential metabolites of pathways, such as linoleic acid metabolism, tryptophan metabolism, lipoic acid metabolism, and α-linolenic acid metabolism, were also enriched with F exposure (Figure 5D). Metabolic pathways were also observed in the AsF-combined exposure, with metabolic disturbances involving linoleic acid metabolism, oxidative phosphorylation, GABAergic synapses, and α-linolenic acid metabolism (Figure 5E). These results suggest that arsenic and fluorine exposure not only altered the gut microbiome but also had a significant impact on metabolic pathways in parallel.
-
As shown in Figure 6, significant correlations between differential gut microbes induced by As and/or F exposure and differential metabolites were analyzed, mainly involving the tryptophan, GABAergic, AA, and lipoic acid metabolic pathways.
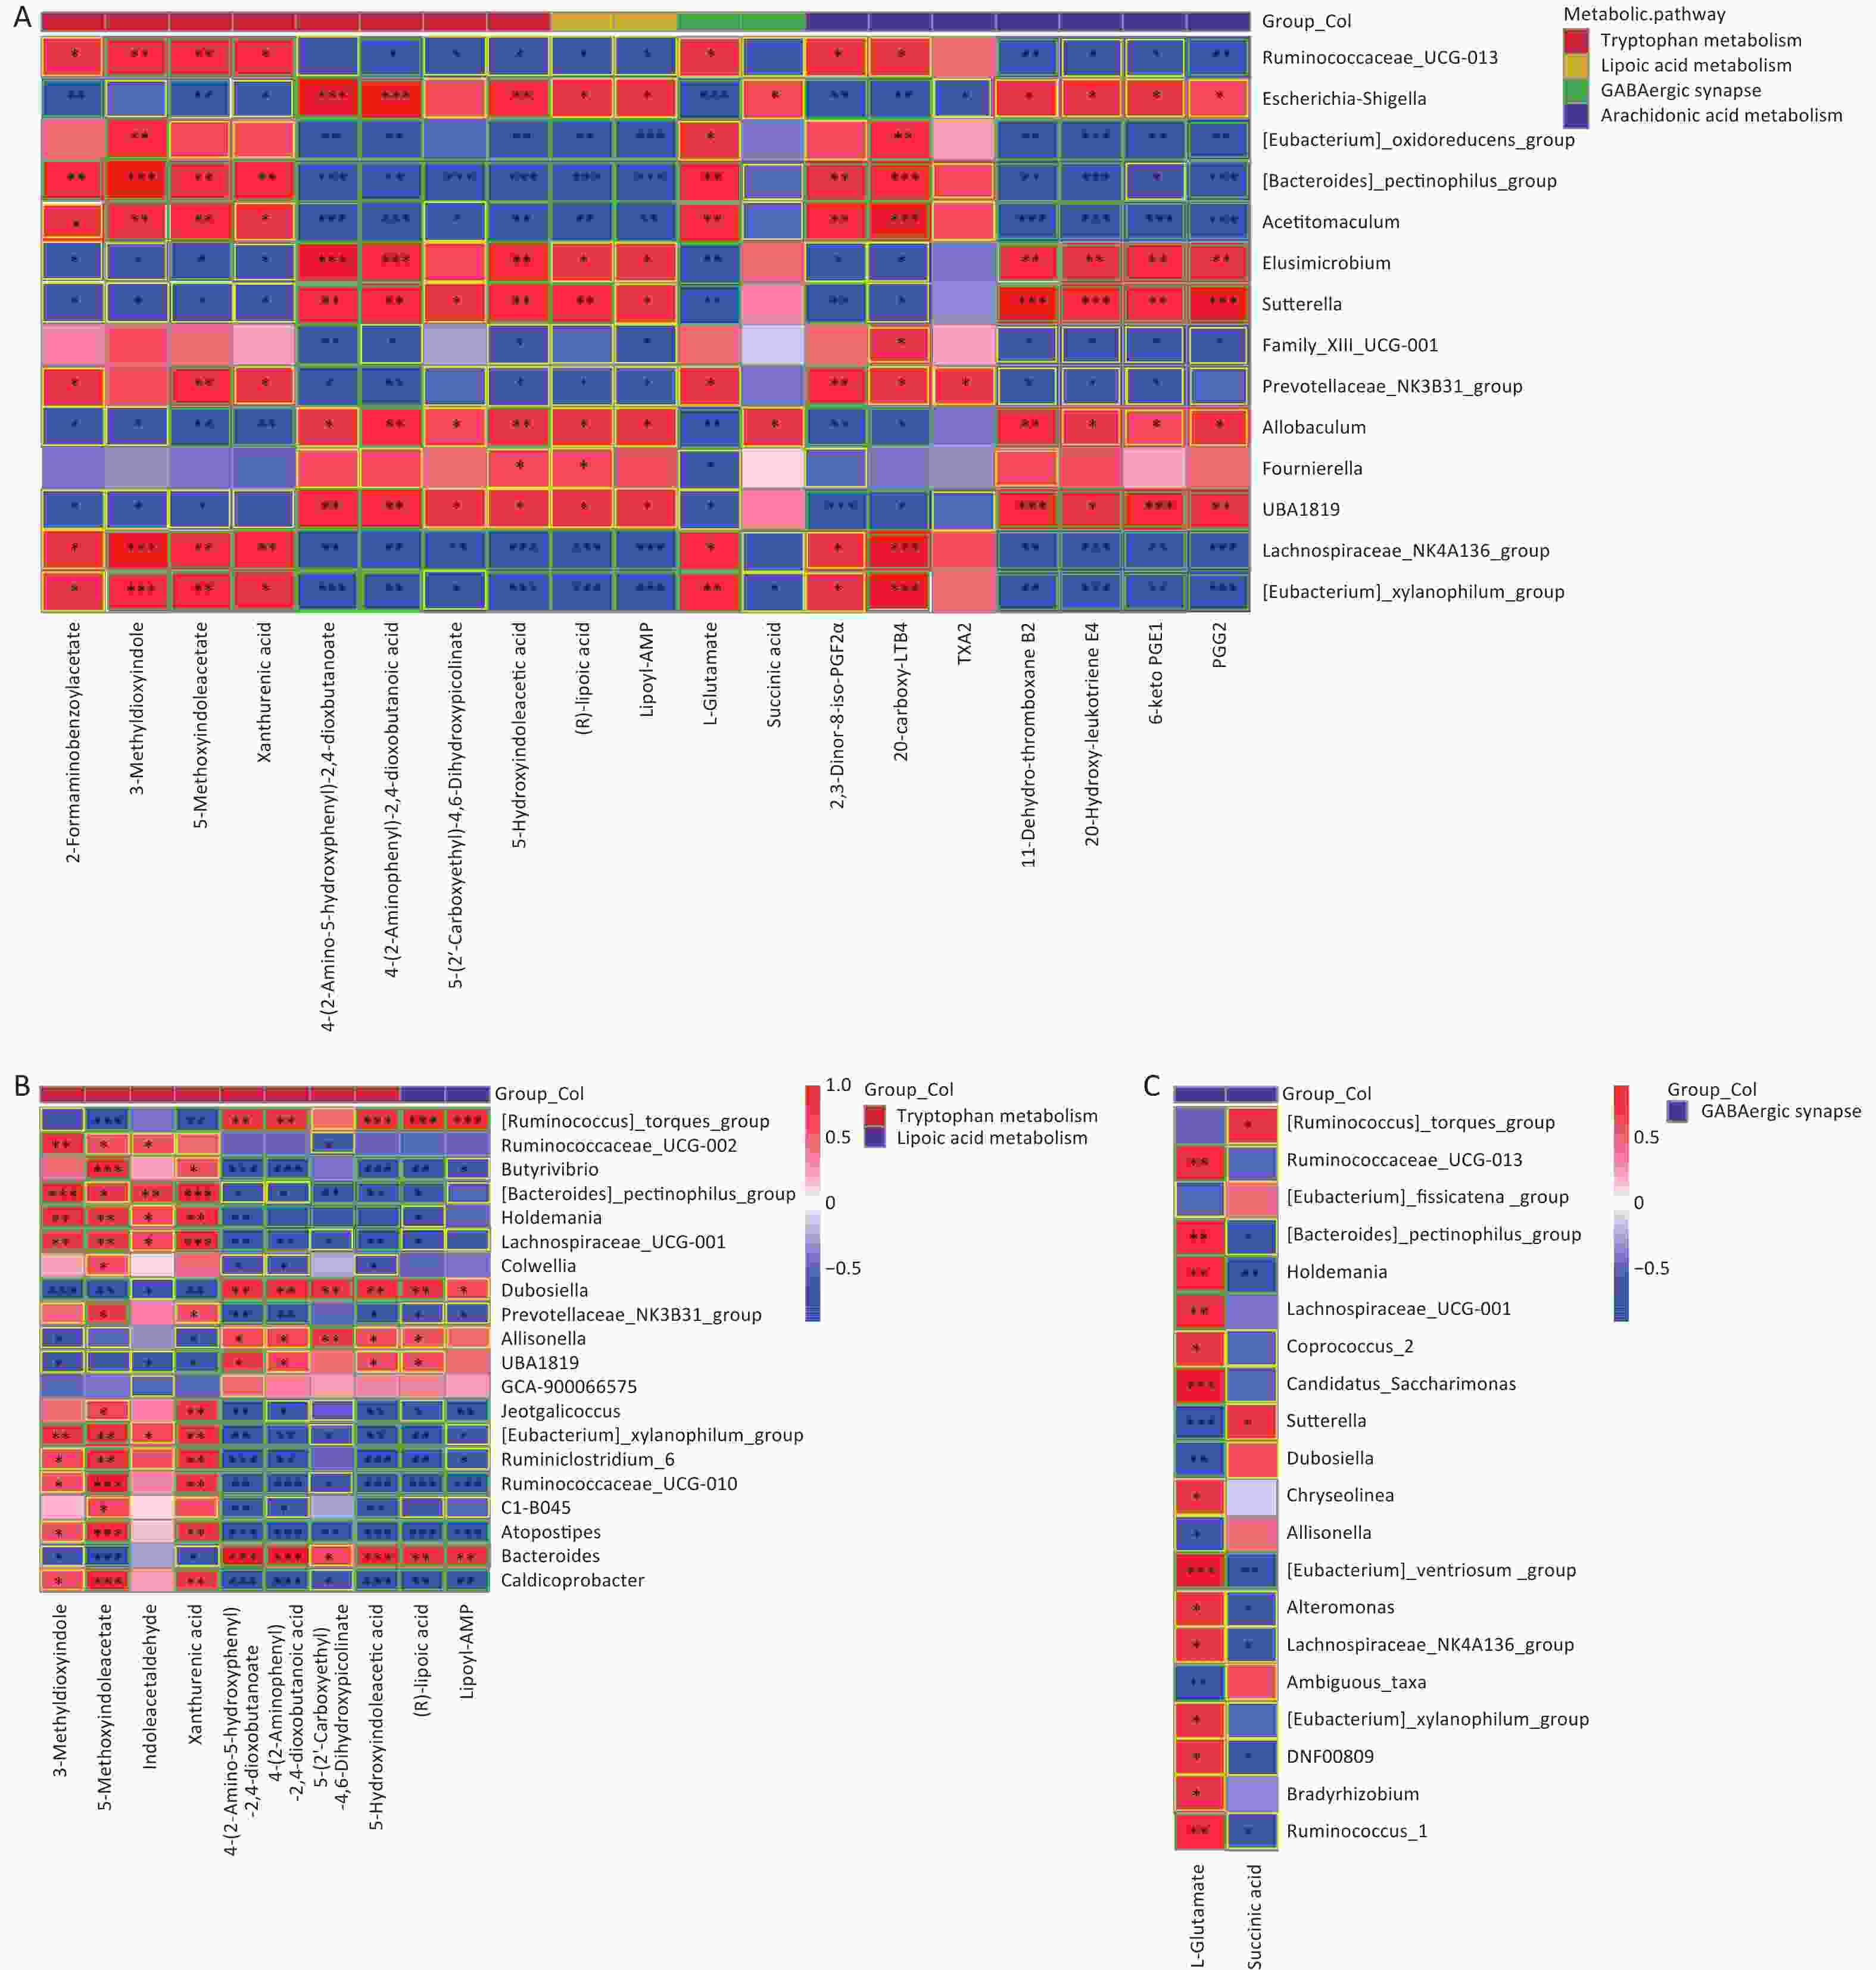
Figure 6. Heat map of correlation matrix for differential gut microbiome and differential metabolites. Tryptophan, lipoic acid, GABA, and AA pathways based on group As and Con (A). Tryptophan and lipoic acid pathways based on group F and Con (B). GABA pathway based on combined AsF and Con (C). Moderate correlations (0.5 ≤ |r| < 0.7) are highlighted as yellow-outline squares; strong correlations (|r| ≥ 0.7) are highlighted as green-outline squares. *, **, and *** P < 0.05, 0.01, and 0.001, respectively, versus the Con group.
The results showed that most of the Prevotellaceae_NK3B31_group and [Eubacterium]_xylanophilum_group were positively correlated with xanthinic acid, whereas they were negatively associated with 5-hydroxyindoleacetic acid, Lipoyl-AMP, and (R)lipoic acid (Figure 6A and B). Meanwhile, in the GABAergic and AA metabolic pathways, as the relative abundance of [Eubacterium]_xylanophilum_group and Lachnospiraceae_NK4A136_group increased, correspondingly, the expression abundance of L-glutamate (Figure 6A and C), 20-carboxy-LTB4 and 2,3-dinor-8-iso-PGF2alpha (Figure 6A) was also elevated. Nevertheless, the comparative data were inconsistent across groups. Taking the GABAergic metabolic pathway as an example, succinic acid was significantly negatively correlated only with the [Eubacterium]_xylanophilum_group (Figure 6A), whereas succinic acid was negatively correlated with a variety of metabolites, including the Lachnospiraceae_NK4A136_group (Figure 6C). Overall, these results revealed that changes in the gut microbiota are associated with alterations in metabolites. These results also suggest that the gut microbiota can regulate biochemical properties and alter the expression of the corresponding metabolites. Metabolites can predict the state of a microbial community.
-
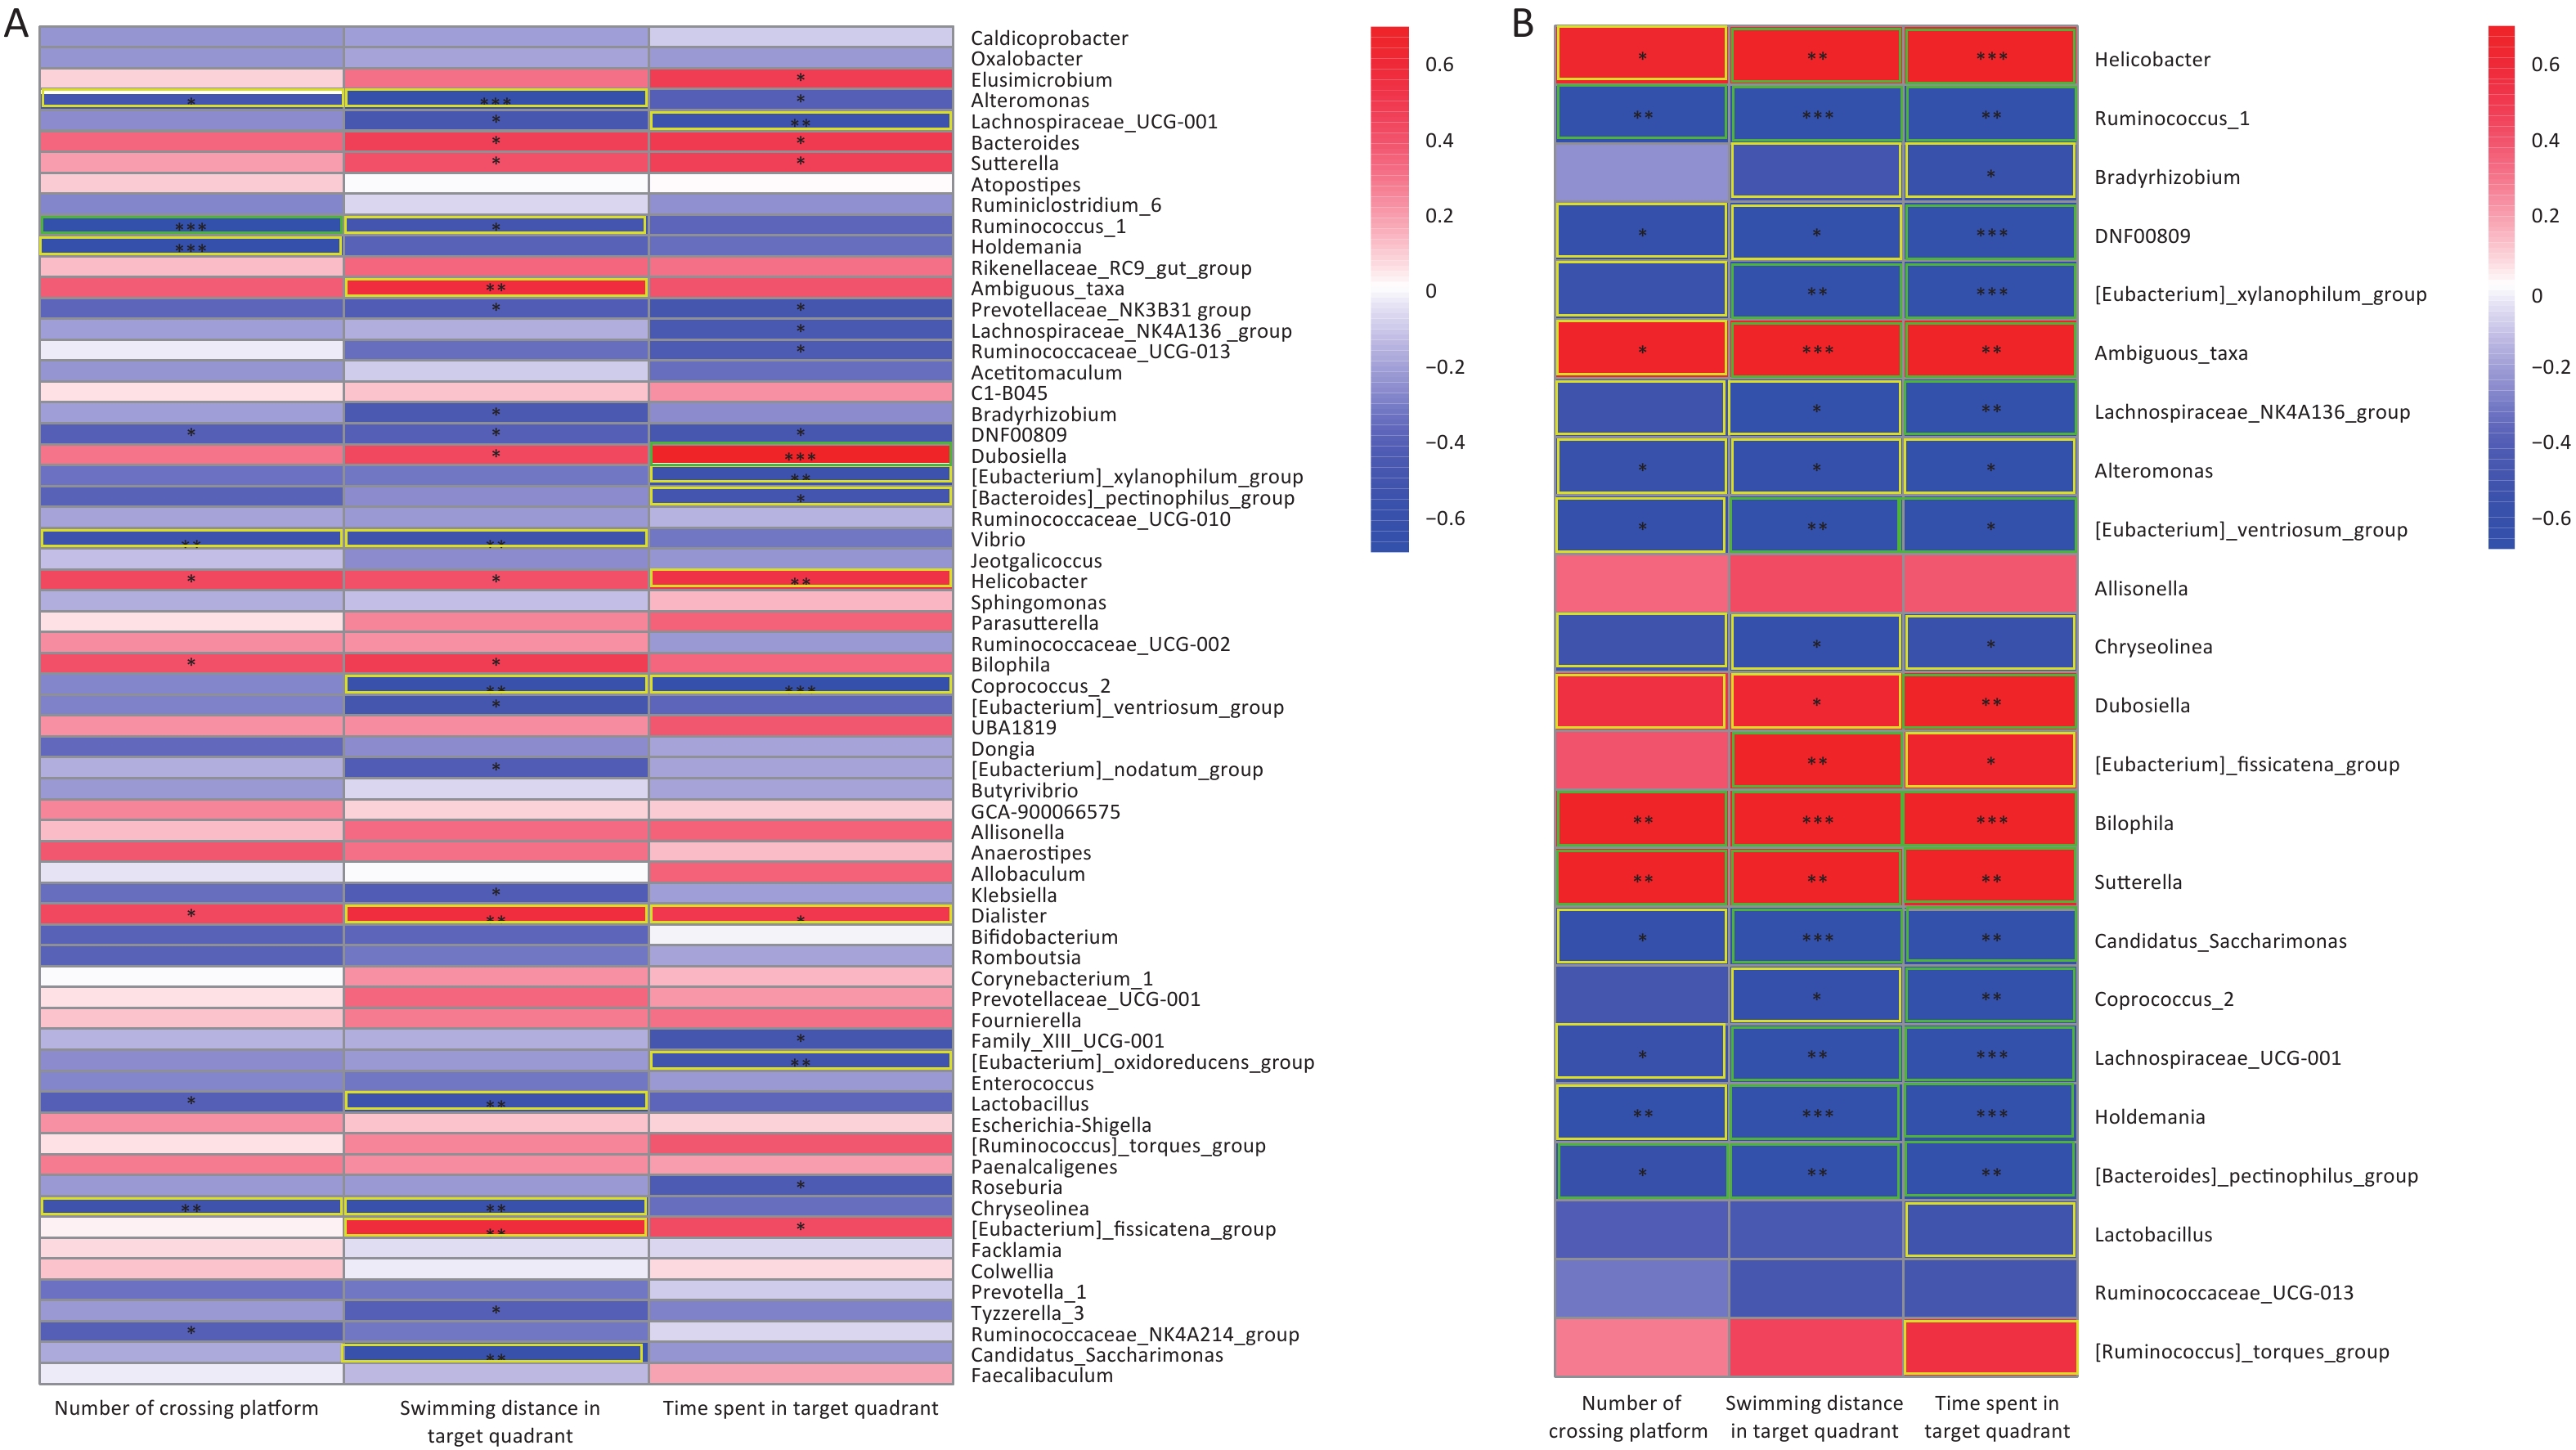
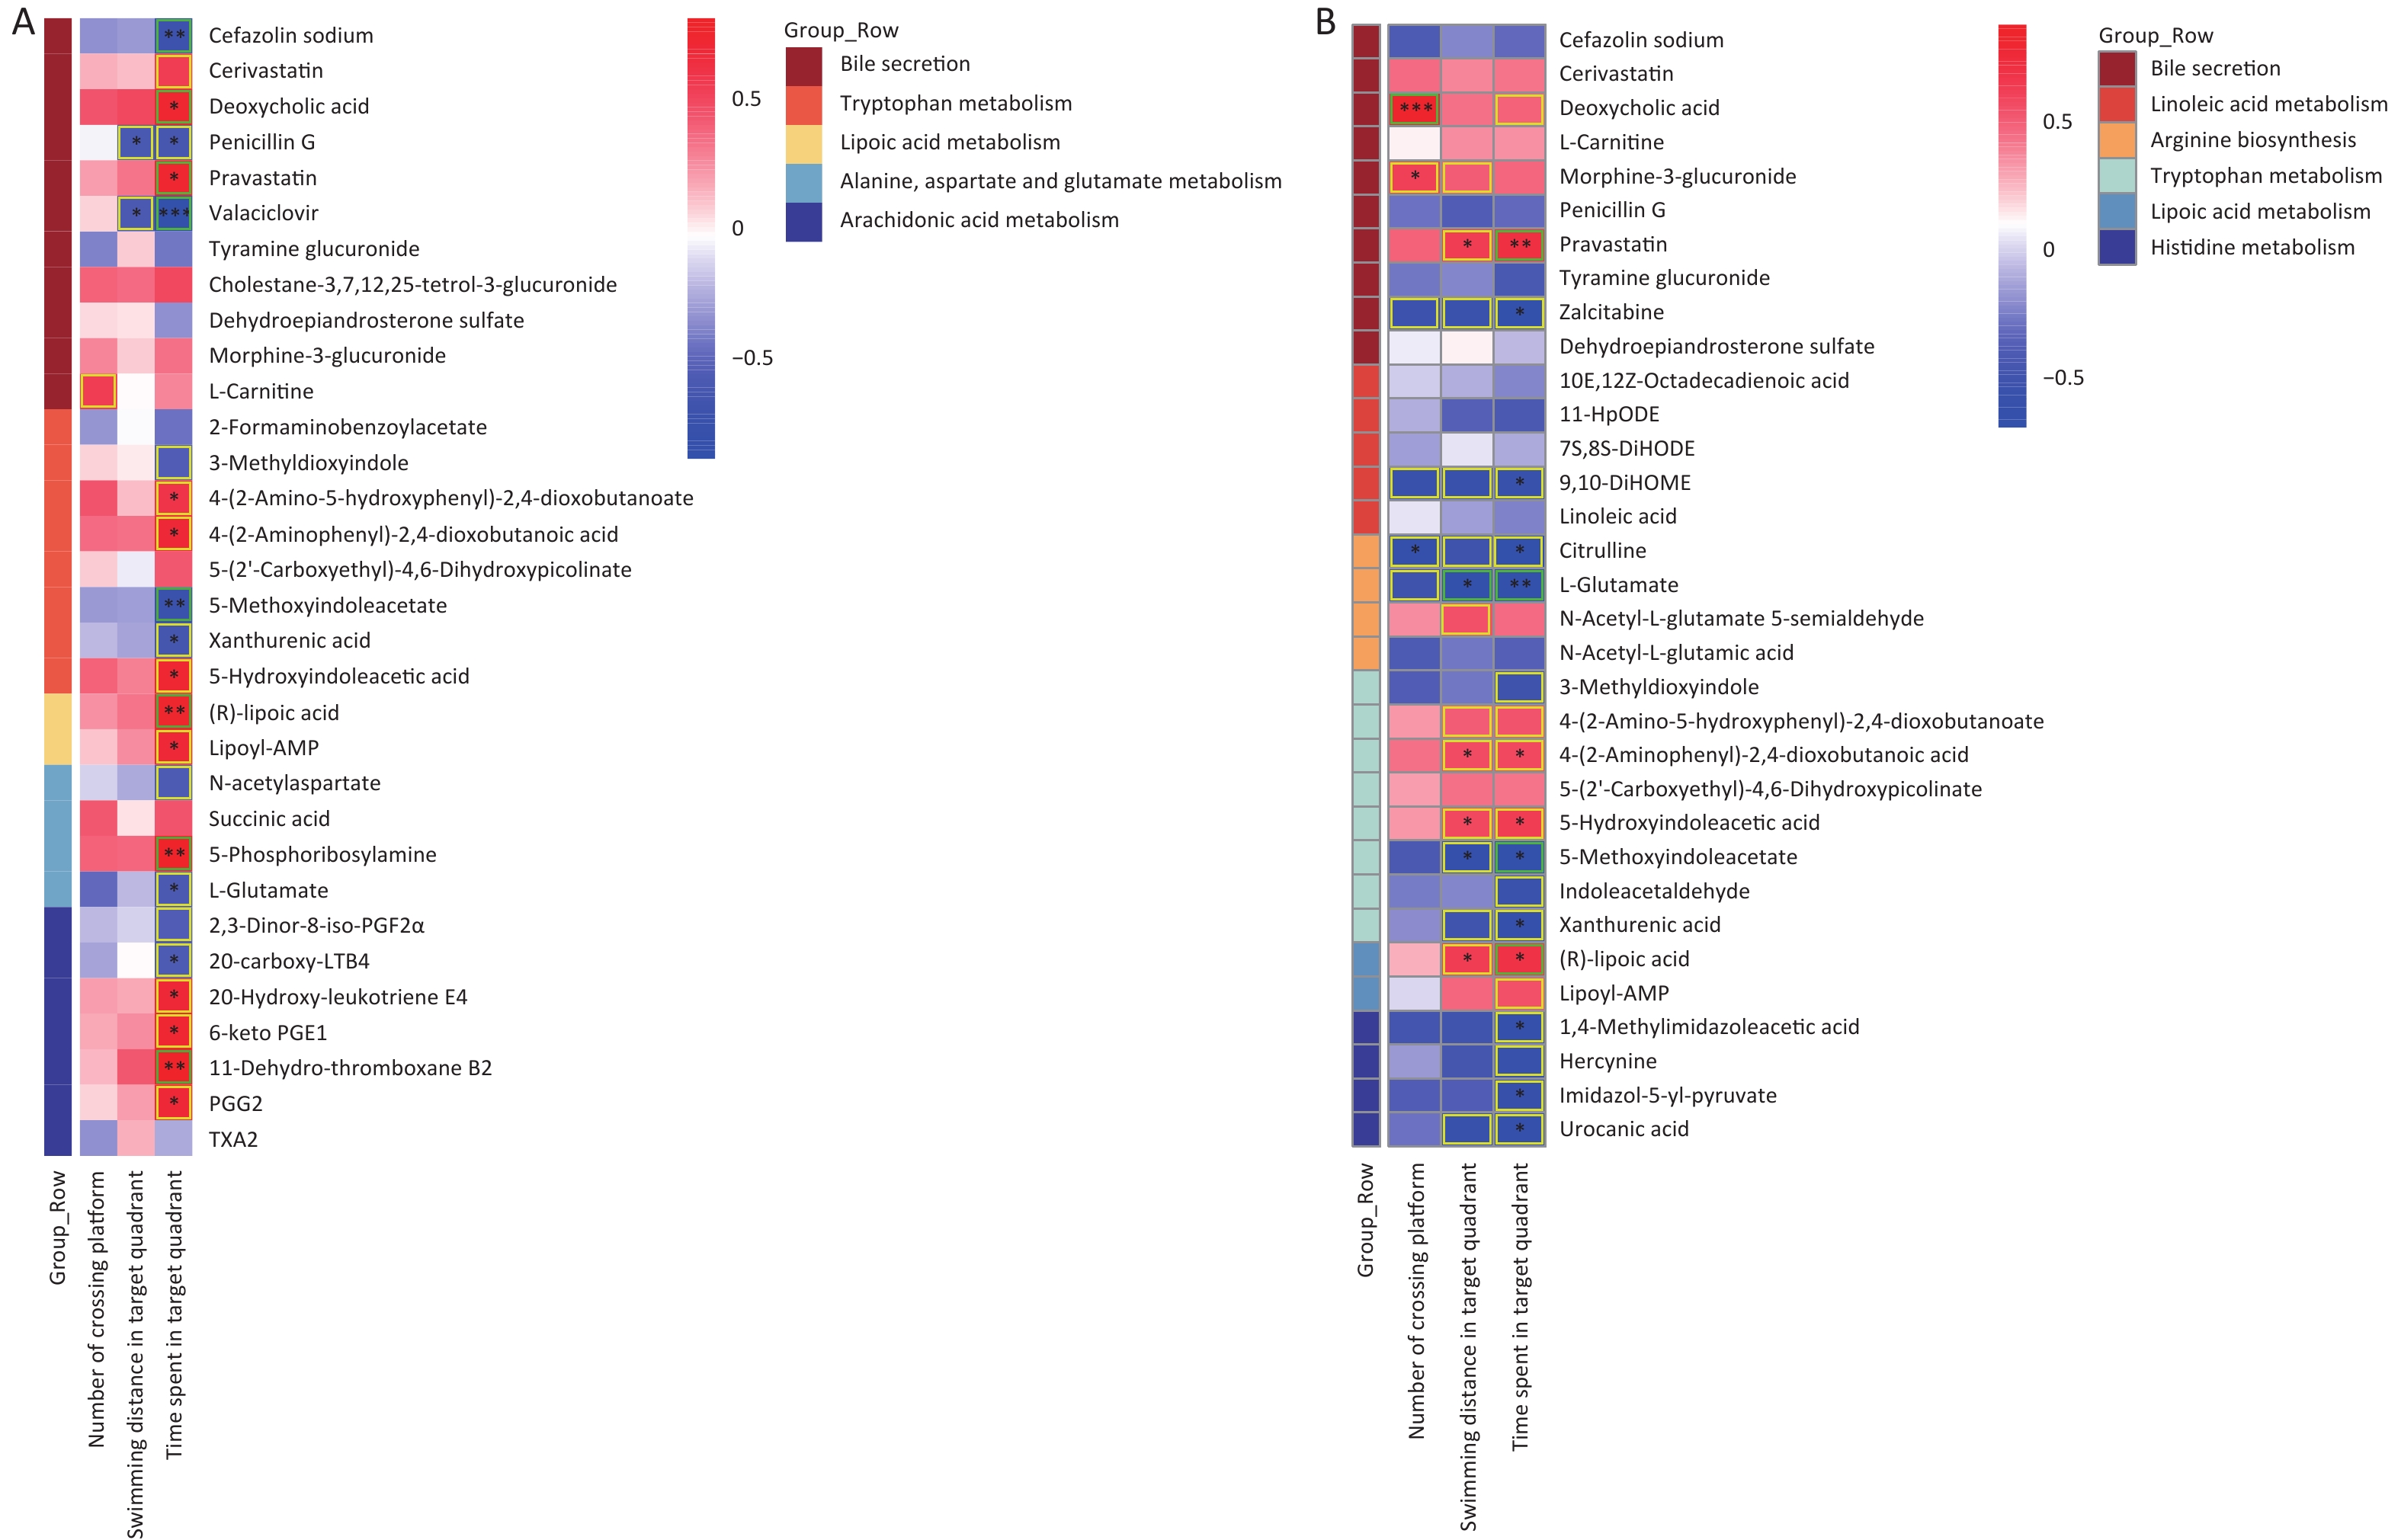
Figure 7A was presents a pooling of samples from all groups; 5 and 12 differential gut microorganisms were observed to be positively and negatively correlated with the three indicators of the water maze, respectively. The Morris water maze performance analysis showed that the AsF combination exposure group was significantly different from the control group. Therefore, it is worth exploring the correlation between the Morris water maze indicators and the gut microflora genera, in which significant differences occurred between the AsF and control groups. Similarly, we identified 21 bacterial genera that were significantly associated with the three performance indicators in the water maze test in the combined AsF and control groups. Among them, seven genera were positively correlated with learning and memory indicators, including Helicobacter and Sutterella (Figure 7B); in contrast, whereas more negatively correlated gut microorganisms were detected, such as [Eubacterium]_xylanophilum_group, Lachnospiraceae_NK4A136_group, and Ruminococcus_1. 70% (16 out of 23) genera, which had a remarkable difference in relative abundance between the control and combined As and F- exposure groups, showed significantly strong correlations (|r| ≥ 0.7) with the water maze performance indicators. These studies suggest that the gut microbiota can indirectly influence indicators related to spatial exploration in the target quadrant in rats, reflecting learning and memory abilities.
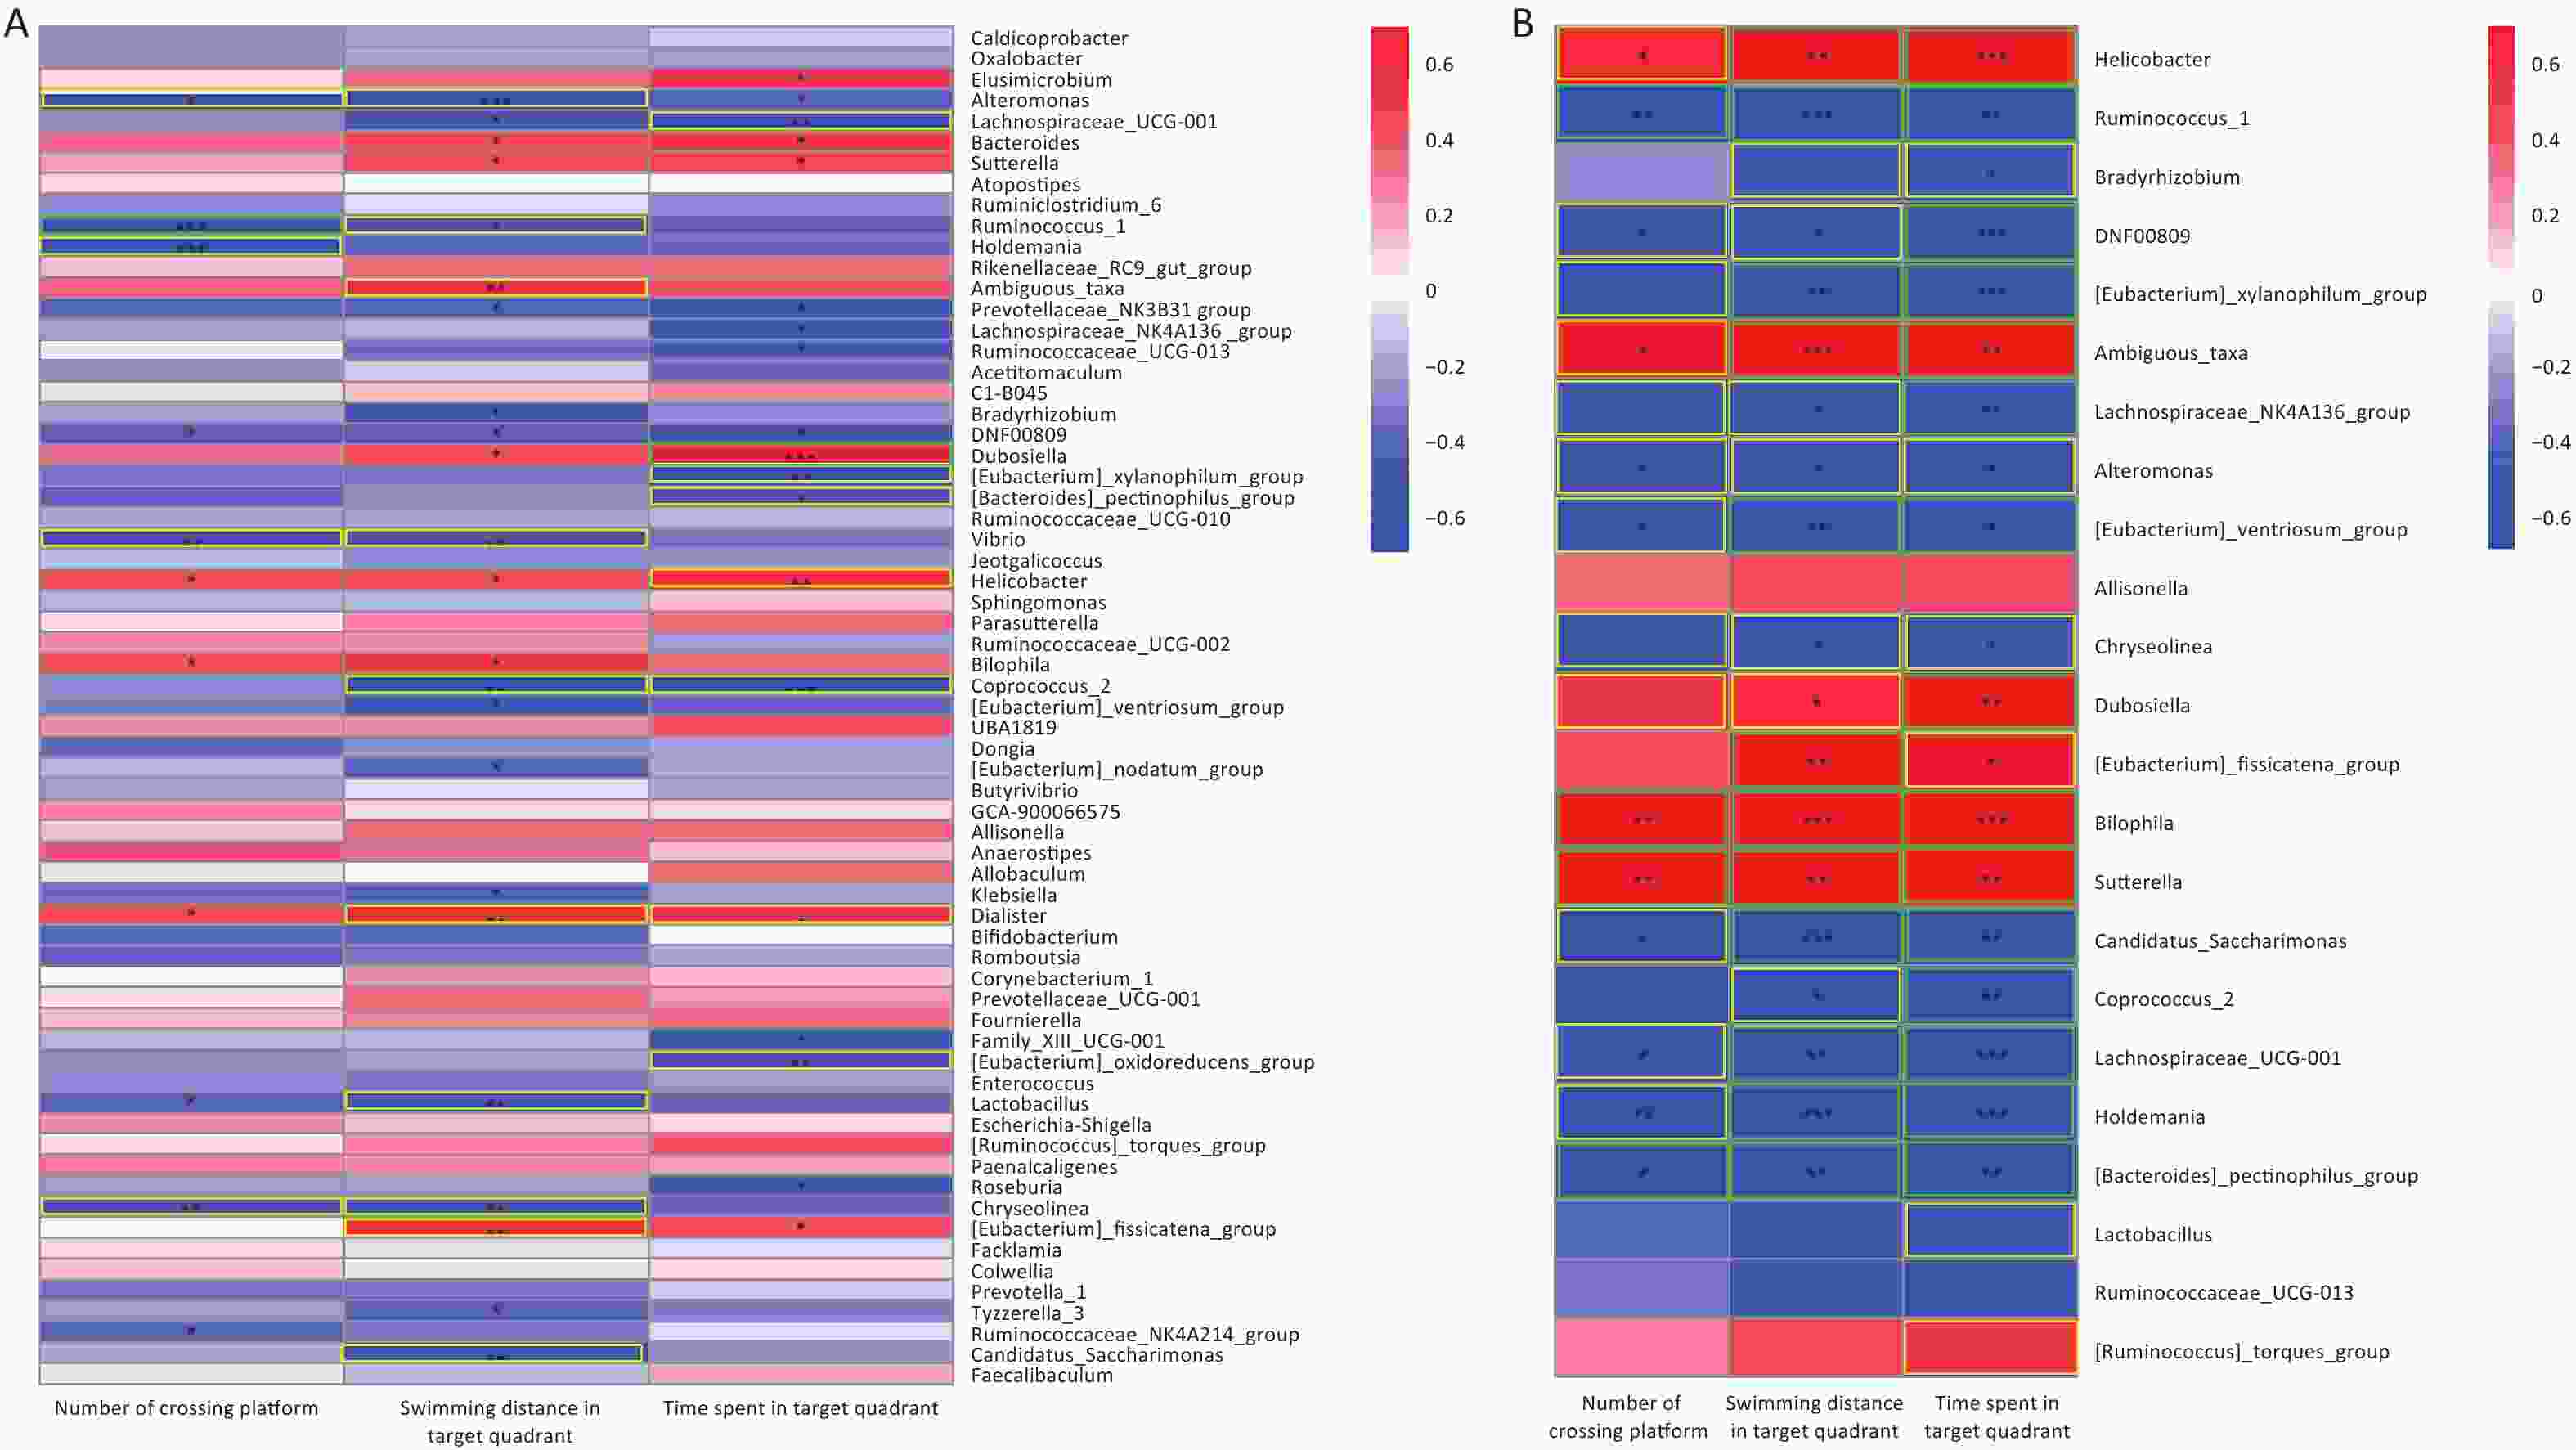
Figure 7. Correlation between microbiome composition at genus level and Morris water maze behavioral indicators. Heat map of correlation matrix generated based on all groups (A). Heat map of correlation matrix generated based on control group and AsF combination exposure group (B). Moderate correlations (0.5 ≤ |r| < 0.7) are highlighted as yellow-outline squares; strong correlations (|r| ≥ 0.7) are highlighted as green-outline squares. *, **, and *** P < 0.05, 0.01, and 0.001, respectively, versus the Con group.
-
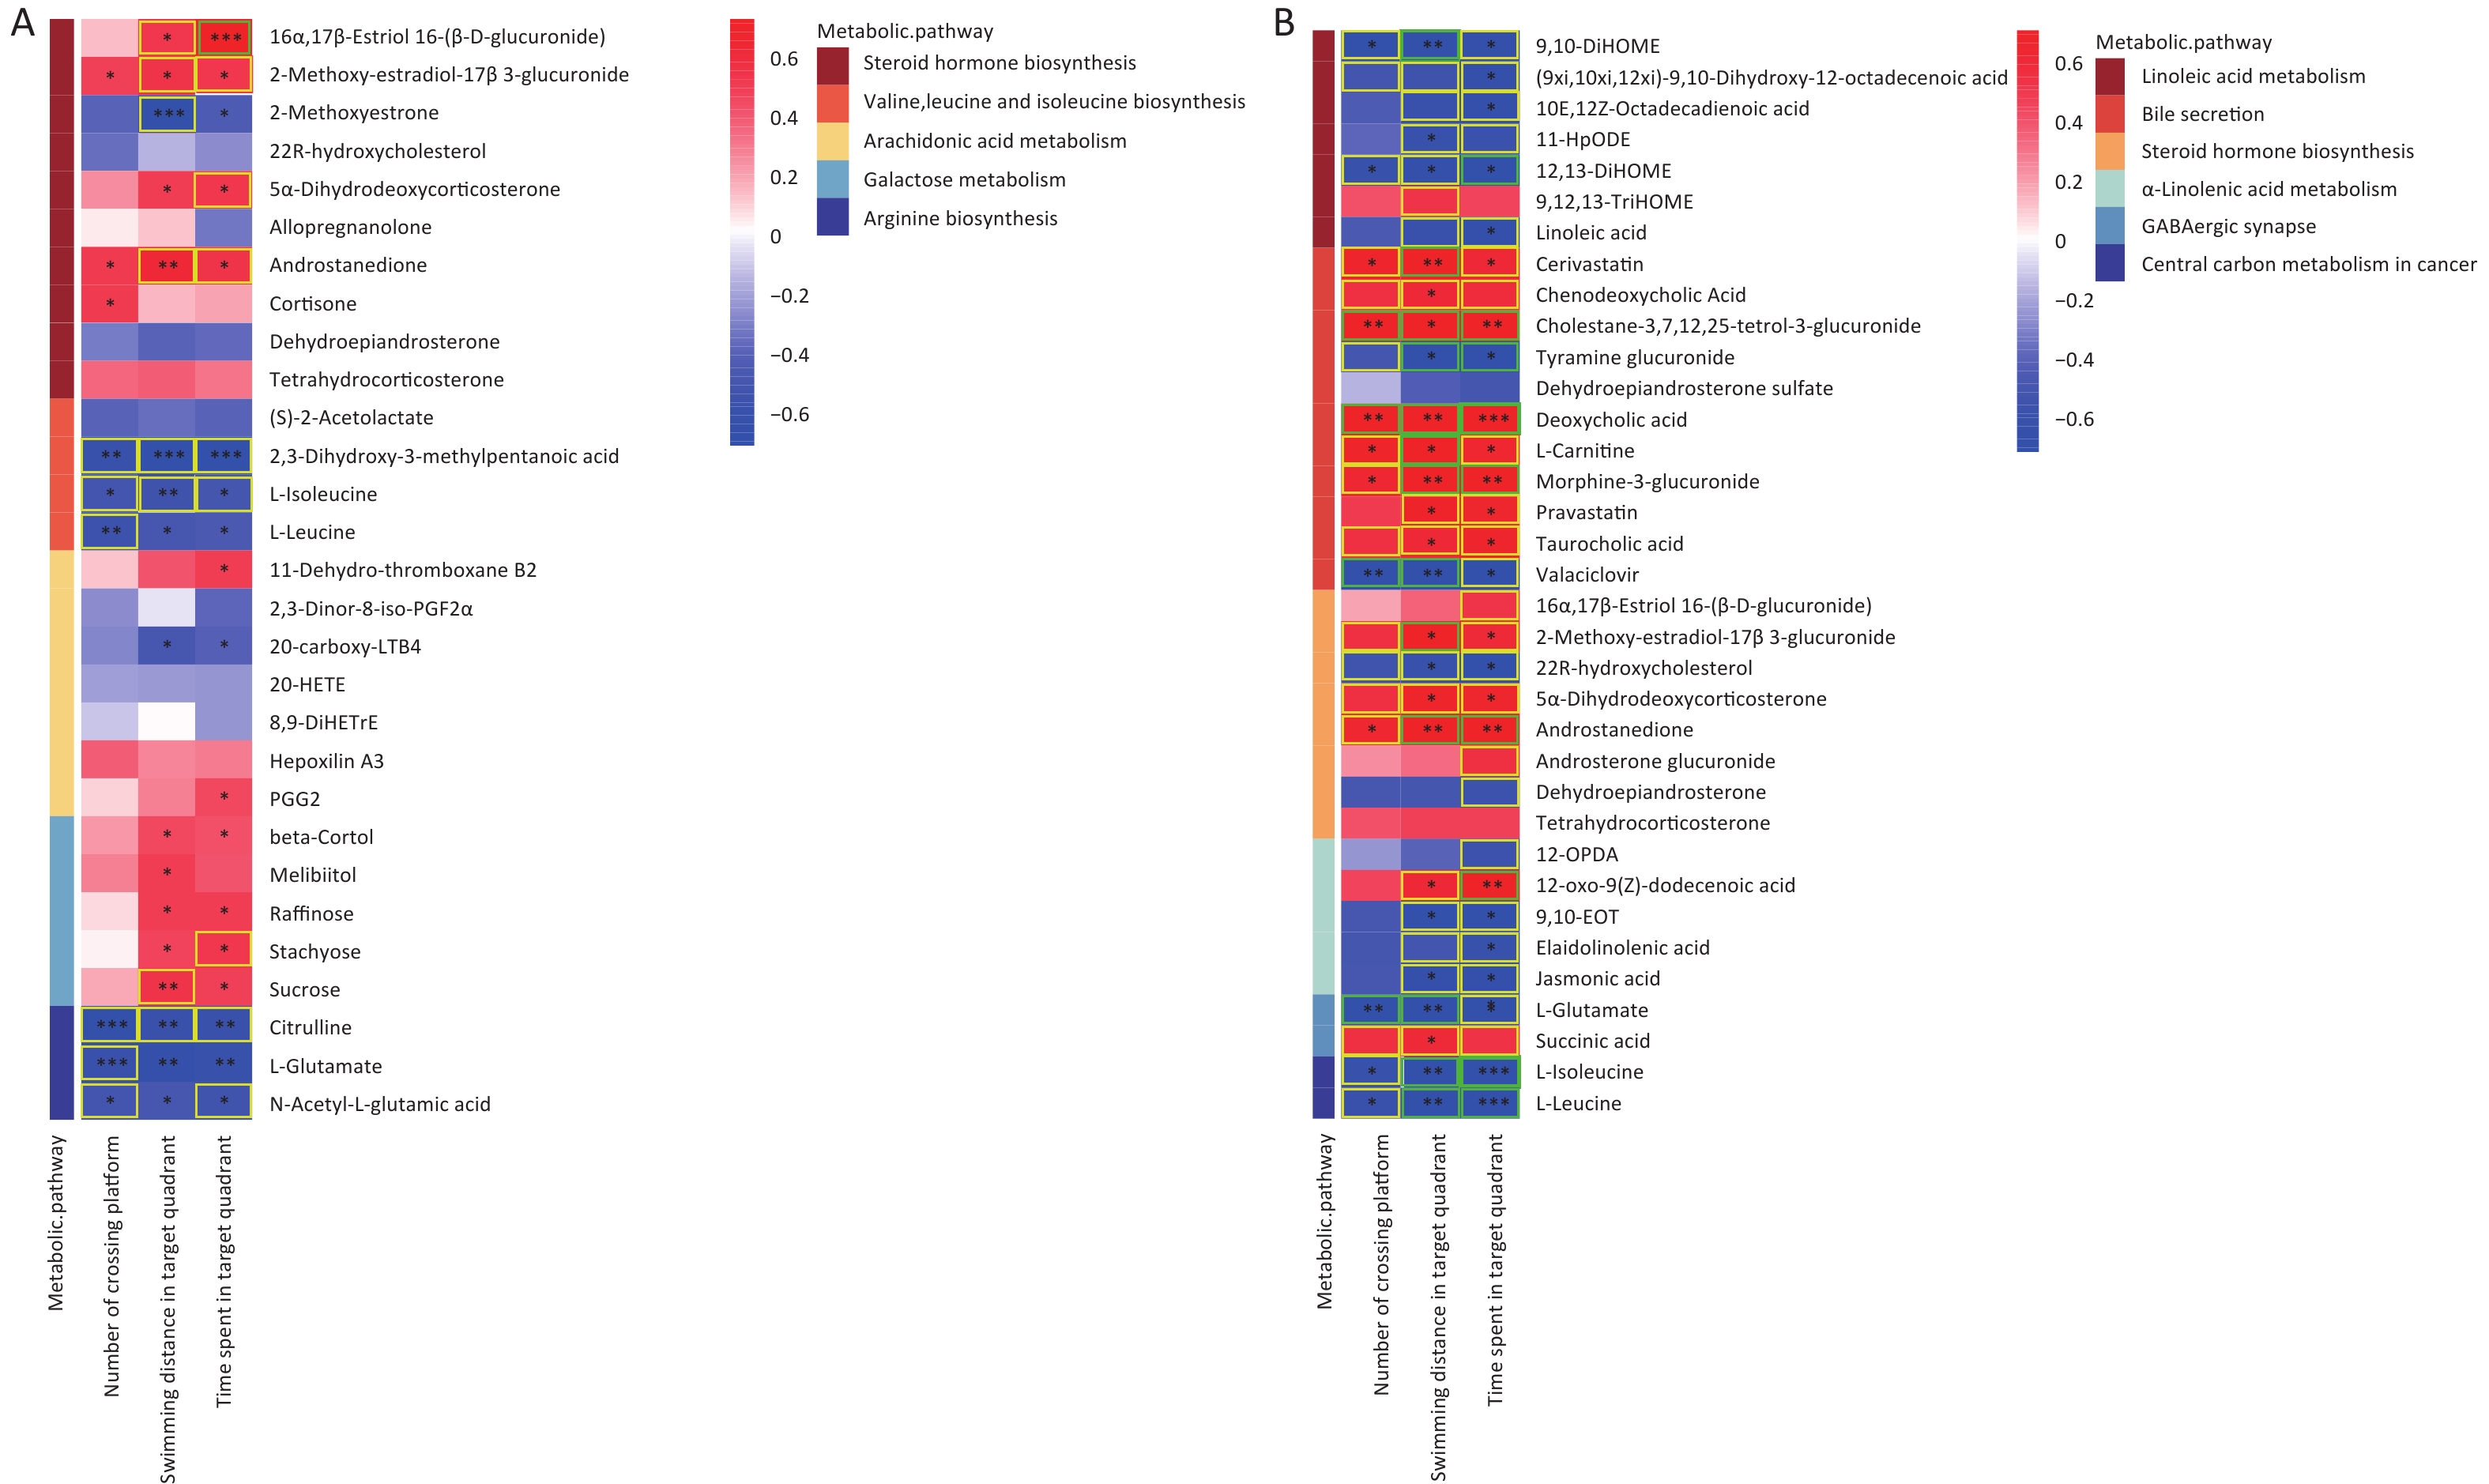
Significant correlations were identified between changes in gut metabolite profiles and water maze indicators. As shown in Figure 8A, a Spearman correlation was established for samples from all groups, with 13 metabolites of the five metabolic pathways showing a significant correlation with the three water maze performance indicators. More specifically, the metabolite Androstanedione showed a positive correlation (P < 0.05), whereas L-isoleucine, L-leucine and L-glutamate (P < 0.05) showed the opposite trend. Figure 8B shows 33 different metabolites, mainly in the combination and control groups. In addition, 20 metabolites, including l-glutamic acid, were simultaneously associated with all three behavioral indicators(|r| ≥ 0.5). Succinic acid was positively correlated with swimming distance in the target region. Moreover, 5-hydroxyindoleacetic acid, 4-(2-aminophenyl)-2,4-dioxobutanoic acid, LA, and Lipoyl-AMP were positively correlated with the time spent in the target quadrant, while xanthic acid and l-glutamate showed the opposite trend (Supplementary Figure S5, available in www.besjournal.com). The microbial and metabolic profiles described above suggest that the in vivo microbiota regulates the bioavailability of these metabolites in the gut, indirectly affecting the learning and memory capacity of the brain.
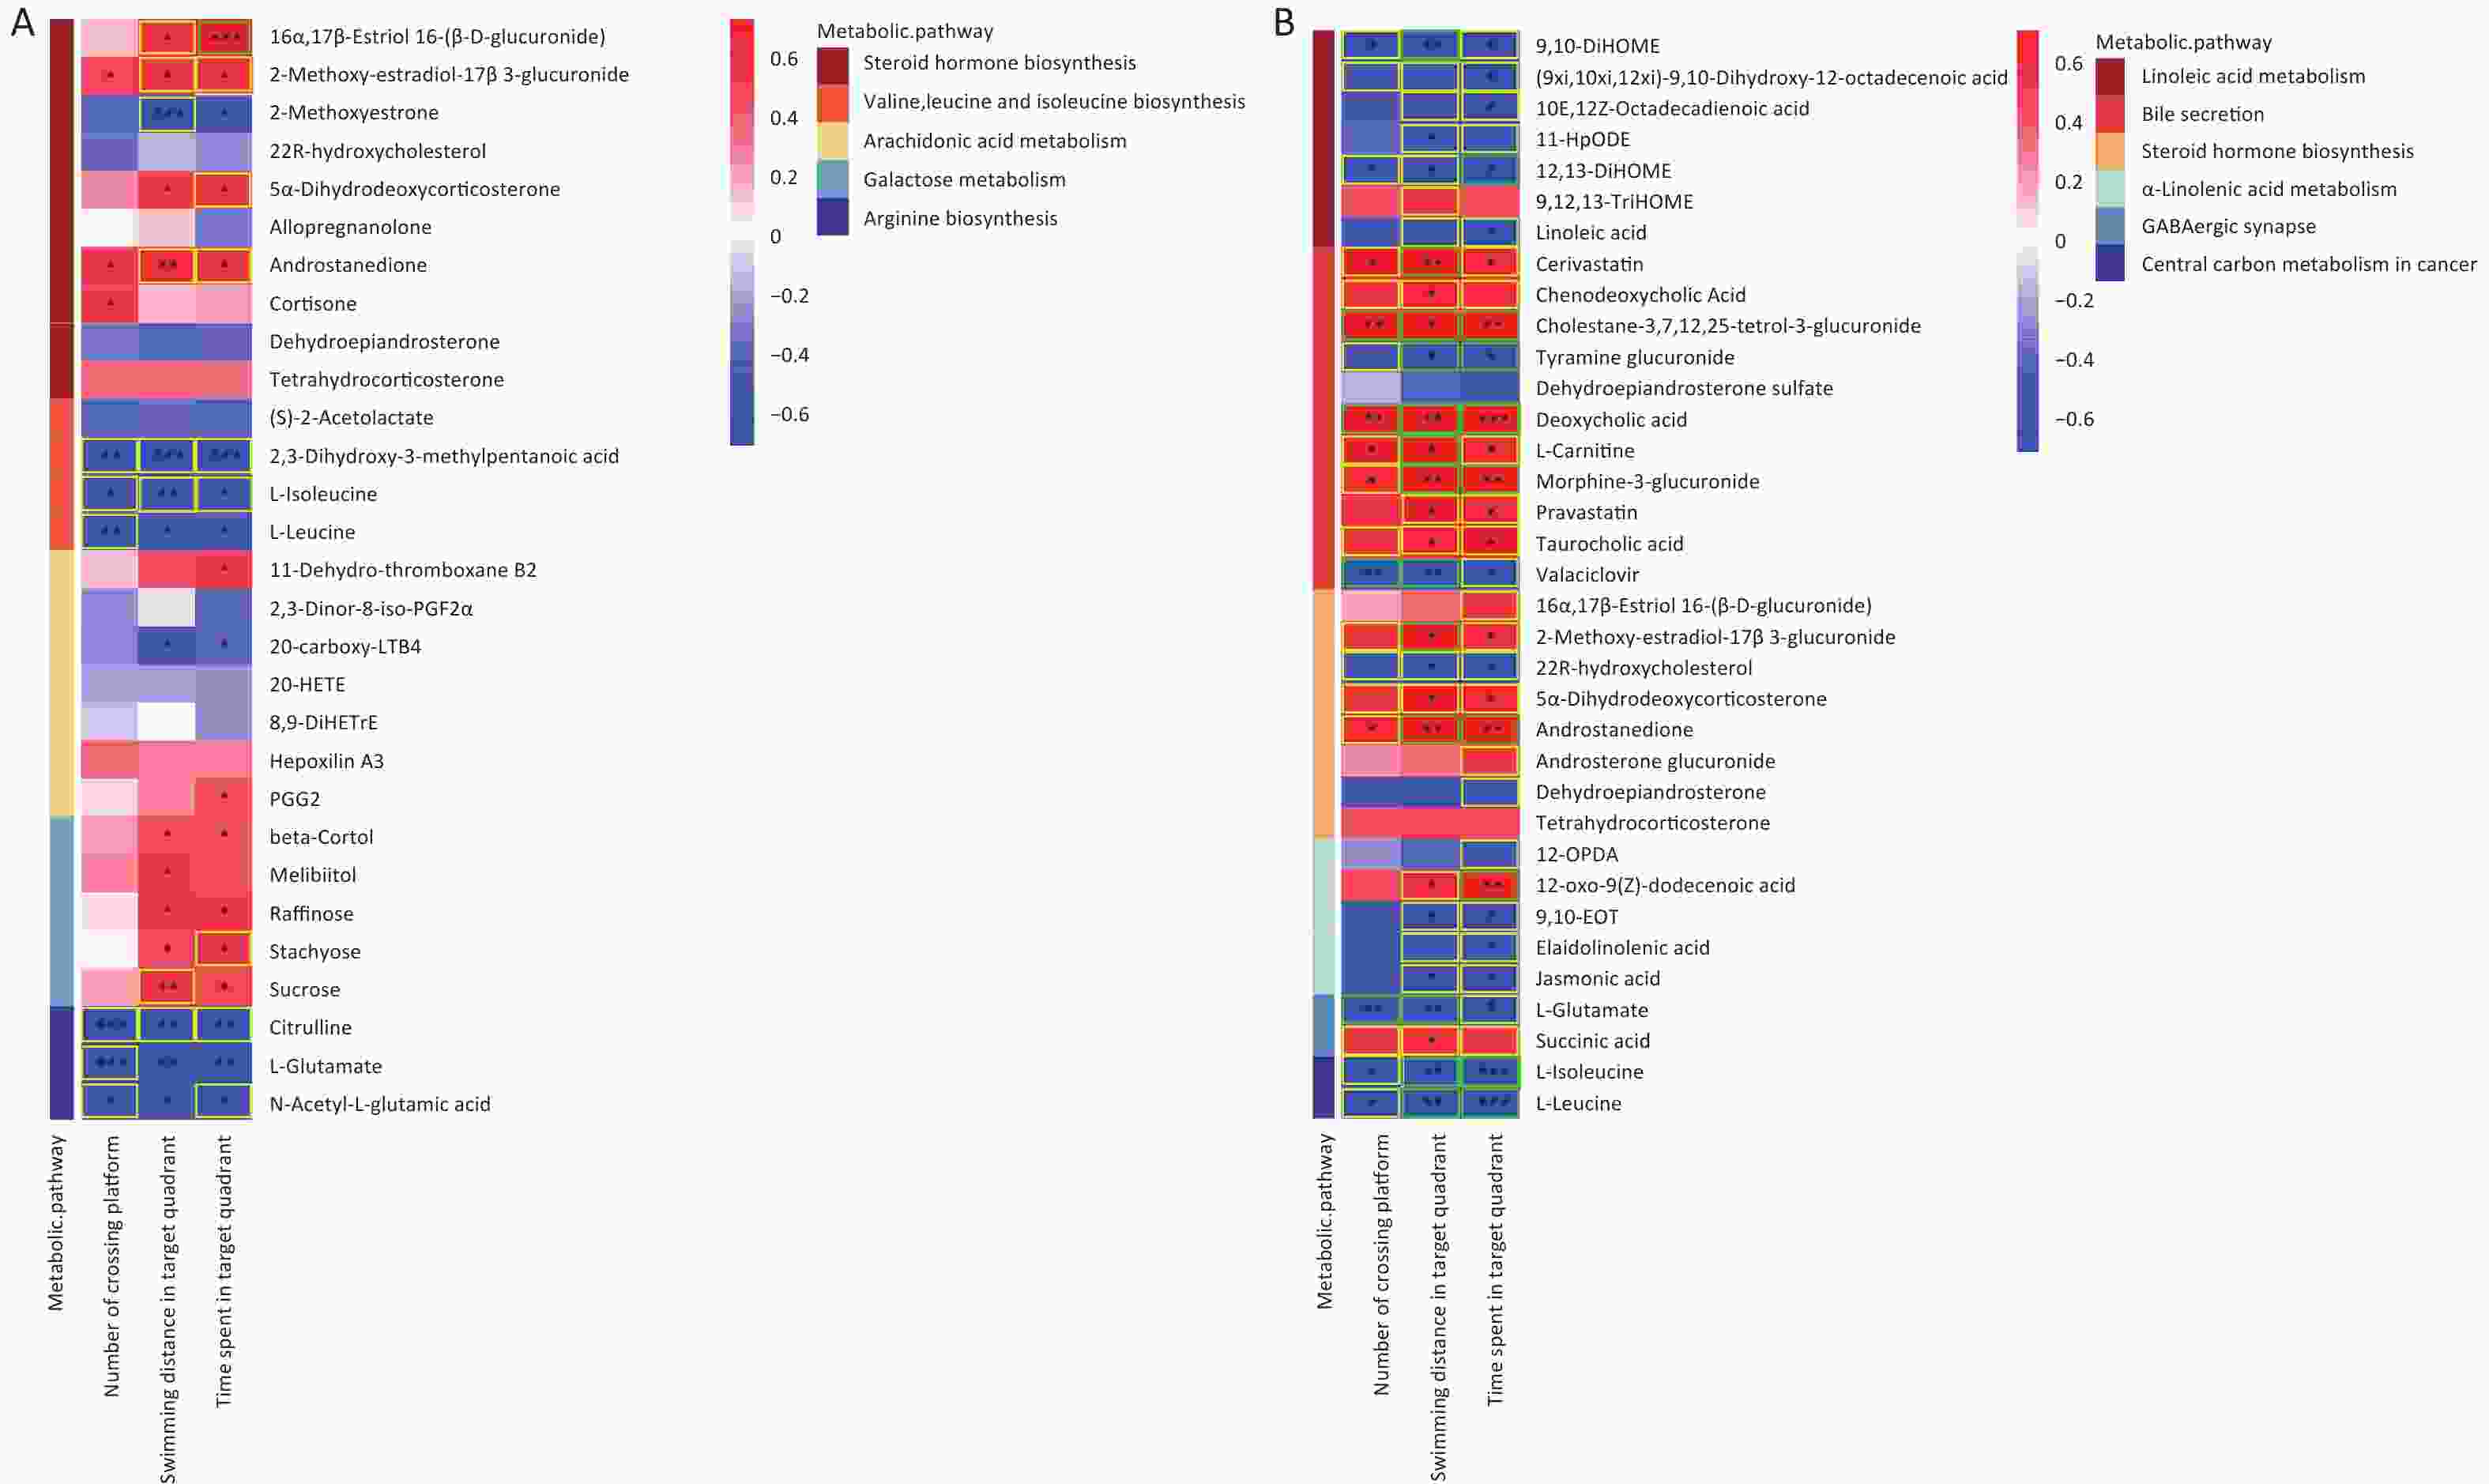
Figure 8. Correlations between metabolomic alterations in the KEGG pathway and Morris water maze behavioral indicators. Heat map of correlation matrix generated based on all groups (A). Heat map of correlation matrix generated based on control group and AsF combination exposure group (B). Moderate correlations (0.5 ≤ |r| < 0.7) are highlighted as yellow-outline squares; strong correlations (|r| ≥ 0.7) are highlighted as green-outline squares. *, **, and *** P < 0.05, 0.01, and 0.001, respectively, versus the C group.
-
As common environmental toxicants and known human carcinogens, arsenic and fluorine have a wide history and scope of application. An increasing number of acute and chronic arsenic and/or fluoride poisoning incidents are occurring worldwide, seriously affecting human public health, and associated with an underlying rise in neurodevelopmental diseases. Increasing evidence has shown that exposure to arsenic and fluorine alone can lead to learning and memory impairment[22, 23], and the combined exposure to arsenic and fluorine causes more serious symptoms and wider harm. However, the underlying mechanism of learning and memory impairment caused by arsenic and/or fluoride exposure is not yet well understood. One of the biomarkers of arsenic and fluoride exposure in the body is urinary arsenic and urinary fluoride, respectively, reflecting the metabolism of toxicants in the body[24, 25]. Surprisingly, based on a 2 × 2 animal model analyzed by factorial analysis, the interaction results showed that arsenic and fluoride had antagonistic effects on urinary arsenic and urinary fluoride contents. Of particular concern, the combined effect of arsenic and fluoride in the AsF group needs to be further experimentally investigated due to multiple factors such as methylation and exposure dose.
The Morris water maze is used to evaluate the functional evaluation of learning memory related to spatial location awareness and orientation awareness (spatial orientation) in experimental animals, and has been widely recognized in scientific studies in several disciplines around the world. The results of the water maze experiment in the current study suggest that arsenic and/or fluorine exposure affects spatial memory in rats. In the present study, the number of platform crossings, time spent in the target quadrant and swimming distance in the target quadrant were significantly lower in the combined exposure group of the spatial exploration experiment compared to the control group, consistent with the results of previous studies[5, 26]. Moreover, we observed a synergistic effect of arsenic and fluoride on the time spent in the target quadrant. Meanwhile, an epidemiological study in Shangyin County, Shanxi Province, found that urinary fluoride and arsenic levels were negatively correlated with children's intelligence [27]. The hippocampus is important for memory acquisition, storage, recall, and reconstruction. In addition, Luo et al. found that deficiency of CA1 pyramidal cells, an important part of pyramidal neurons, can lead to memory loss. The current study of H&E staining in the hippocampus provided further evidence to support this connection. We conclude that arsenic and/or fluorine exposure not only decreased spatial learning and memory abilities in rats but also caused pathological changes in hippocampal neuronal cells.
To our knowledge, this study is the first to use multi-omics (metabolome and microbiome) to investigate the effects of arsenic and/or fluoride on learning and memory by altering gut microbes and metabolites. The relationship between microorganisms and health is an interesting topic. The 16S rRNA sequencing results showed that the diversity of gut microorganisms was significantly higher in the exposed group than in the control group, which is consistent with the results of previous studies[28]. Bacteroidetes/Firmicutes can be used as biomarkers for gut microbial disorder. Numerous studies have shown an increasing trend in Firmicutes with arsenic and fluoride exposure, which is consistent with the results of our study[29-32]. Alterations in gut microbial Firmicutes levels are controversial, partly because they are closely related to the species of the animal, dose and duration of exposure, and feeding environment. In the current study, multiple genera were significantly different in relative abundance between the control and As and/ F exposed combined groups, showing significant correlations with three water maze performance indicators. A study of Japanese patients with dementia showed that the abundance of Bacteroides in the feces of patients with dementia was significantly lower than that in normal subjects[33], which is in accordance with the results of the present study. A significant increase in the relative abundance of LachnospiraceaeNK4A136_, PrevotellaceaeNK3B31_ and [fungal bacteria] xylanobacteria was observed in the exposed group, which was negatively correlated with indicators of neurodevelopmental behavior. Similarly, chlorogenic acid (CGA) alleviated the increase in the proportion of the Laospirillaceae_NK4A136_group with cognitive impairment caused by lead[8]. The protective effect of cognitive impairment has been studied by modulating the gut microbiota, especially the g_Prevotellaceae_NK3B31_group[34]. In addition, the arsenic fluoride combination group also caused a change in the relative abundance of the [Eubacterium]_xylanophilum_group. Overexpression of CircNF1-419 in the brain alters significant changes in the relative abundance of [Eubacterium]_xylanophilum_group in mouse Alzheimer’s disease (AD)-like behavior[35]. These results suggest a potential link between microbiota disruption induced by arsenic and/or fluoride exposure and learning memory.
A growing number of studies suggest that gut microbes influence behavior by regulating the levels of a number of metabolites[36]. For example, interferon increased the abundance of Lachnospiraceae_NK4A136_group and affected amino acid metabolism (L-glutamate), which is consistent with our observed results from the study[37]. Although there is no clear conclusion on the role of microorganisms through metabolites in the field of neurodevelopment, existing results show that there is a certain correlation between key microorganisms and different metabolites.
Evidence suggests that potential mechanisms of disease development are mediated by metabolites[36]. We observed that the differential metabolites induced by As and/or F exposure were enriched in differential metabolic pathways containing a variety of amino acids and lipid metabolites. Tryptophan (Trp) is used in the production of neurotransmitters such as 5-TH and the kynuric acid metabolic pathway (KP) during tryptophan metabolism. It has been reported that female patients with autism spectrum disorder (ASD) have lower concentrations of 5-HT and 5-HIAA, consistent with the results of current study[38]. Studies have shown that inhibitors exert beneficial effects on peripheral nerve dysfunction caused by xanthine acid via xanthine oxidase[39]. Recent studies have found that arsenic damages the long-term memory (LTM) of rat offspring, which may be caused by the excitotoxicity of elevated glutamate[40]. The inhibition of glutamatergic excitatory drive and the balance between synaptic excitation and inhibition (E/I) are important for normal neural circuit function. A recent study showed that arsenic results in decreased succinate levels in mice with impaired learning and memory[41]. Another study also confirmed that PM2.5 exposure leads to a deterioration of spatial learning and memory in rats with specific alterations in succinate content[42]. Similar metabolite alterations in the glutamate pathway were observed in our study. Studies have shown that different levels of arachidonic acid trigger various neurodegenerative diseases owing to the induced activation of microglia[43]. An epidemiological study showed that 2,3-dinor-8-iso-PGF2alpha levels were higher in patients with SCZ and major depression than in control patients[44]. As a downstream product of PGG2, an increase in prostaglandin E 2 (PGE 2) can restore brain inflammation and spatial memory[45]. Lipoic acid (LA) has been proven to significantly improve the learning and memory abilities of mice with dementia[46]. In addition, as an inhibitor of arsenic toxicity, LA is beneficial to the induction of spatial memory and structural integrity[47]. Our correlative results indicate that clear correlations of metabolites on the AA and LA pathways with water maze measures were observed in all exposed groups, which provides further evidence and supports the above associations. In conclusion, the results of this study provide insights into the mechanism of action of arsenic and/or fluoride exposure in learning and memory impairment in the offspring of rats. Previous studies have shown an association between the microflora and neurobehavioral abilities to support the present view. In addition, the results of this study provide further insight into the specific metabolic pathways targeting arsenic and/or fluorogenic neurodevelopmental disorders, as indicated by changes in specific differential metabolite markers.
-
Using an intrauterine to adult SD rat model exposed to arsenic and/or fluoride, we evaluated the role of gut microbes and metabolites in learning and memory impairment. 16S rRNA sequencing results revealed that the microbiome plays a key role in learning and memory impairment caused by arsenic and/or fluoride exposure, especially the differential Enterobacteriaceae Bacteroides, [Eubacterium]_xylanophilum_group, Lachnospiraceae_NK4A136_group, and Prevotellaceae_NK3B31_group, which can become the key flora in follow-up studies. Similarly, the LC-MS results confirmed that differential metabolites were enriched in differential metabolic pathways represented by tryptophan metabolism, lipoic acid, GABAergic synapses, and AA. In addition, there are significant correlations among key gut microbes, metabolites, and neurodevelopmental behavior indicators, wherein the disruption of the gut microbiota and the metabolite alterations may be the key mechanisms of As and/or F-induced learning and memory impairment. The significant correlations among significantly altered microbiota, metabolic pathways, and learning and memory indices indicates that there is a high potential to develop new biomarkers of As and/or F-related neurodevelopment based on microbiome and metabolomics. This integrated analysis of the putative microbial metabolism based on the identified microbes and fecal metabolites provides more functional insights than either of the single omics. Further research is warrant to better understand the mechanism of action of gut microbes and rat endogenous small molecule metabolites in the nervous system, which will provide new biomarkers for the prevention and/or treatment of neurodevelopmental diseases.
-
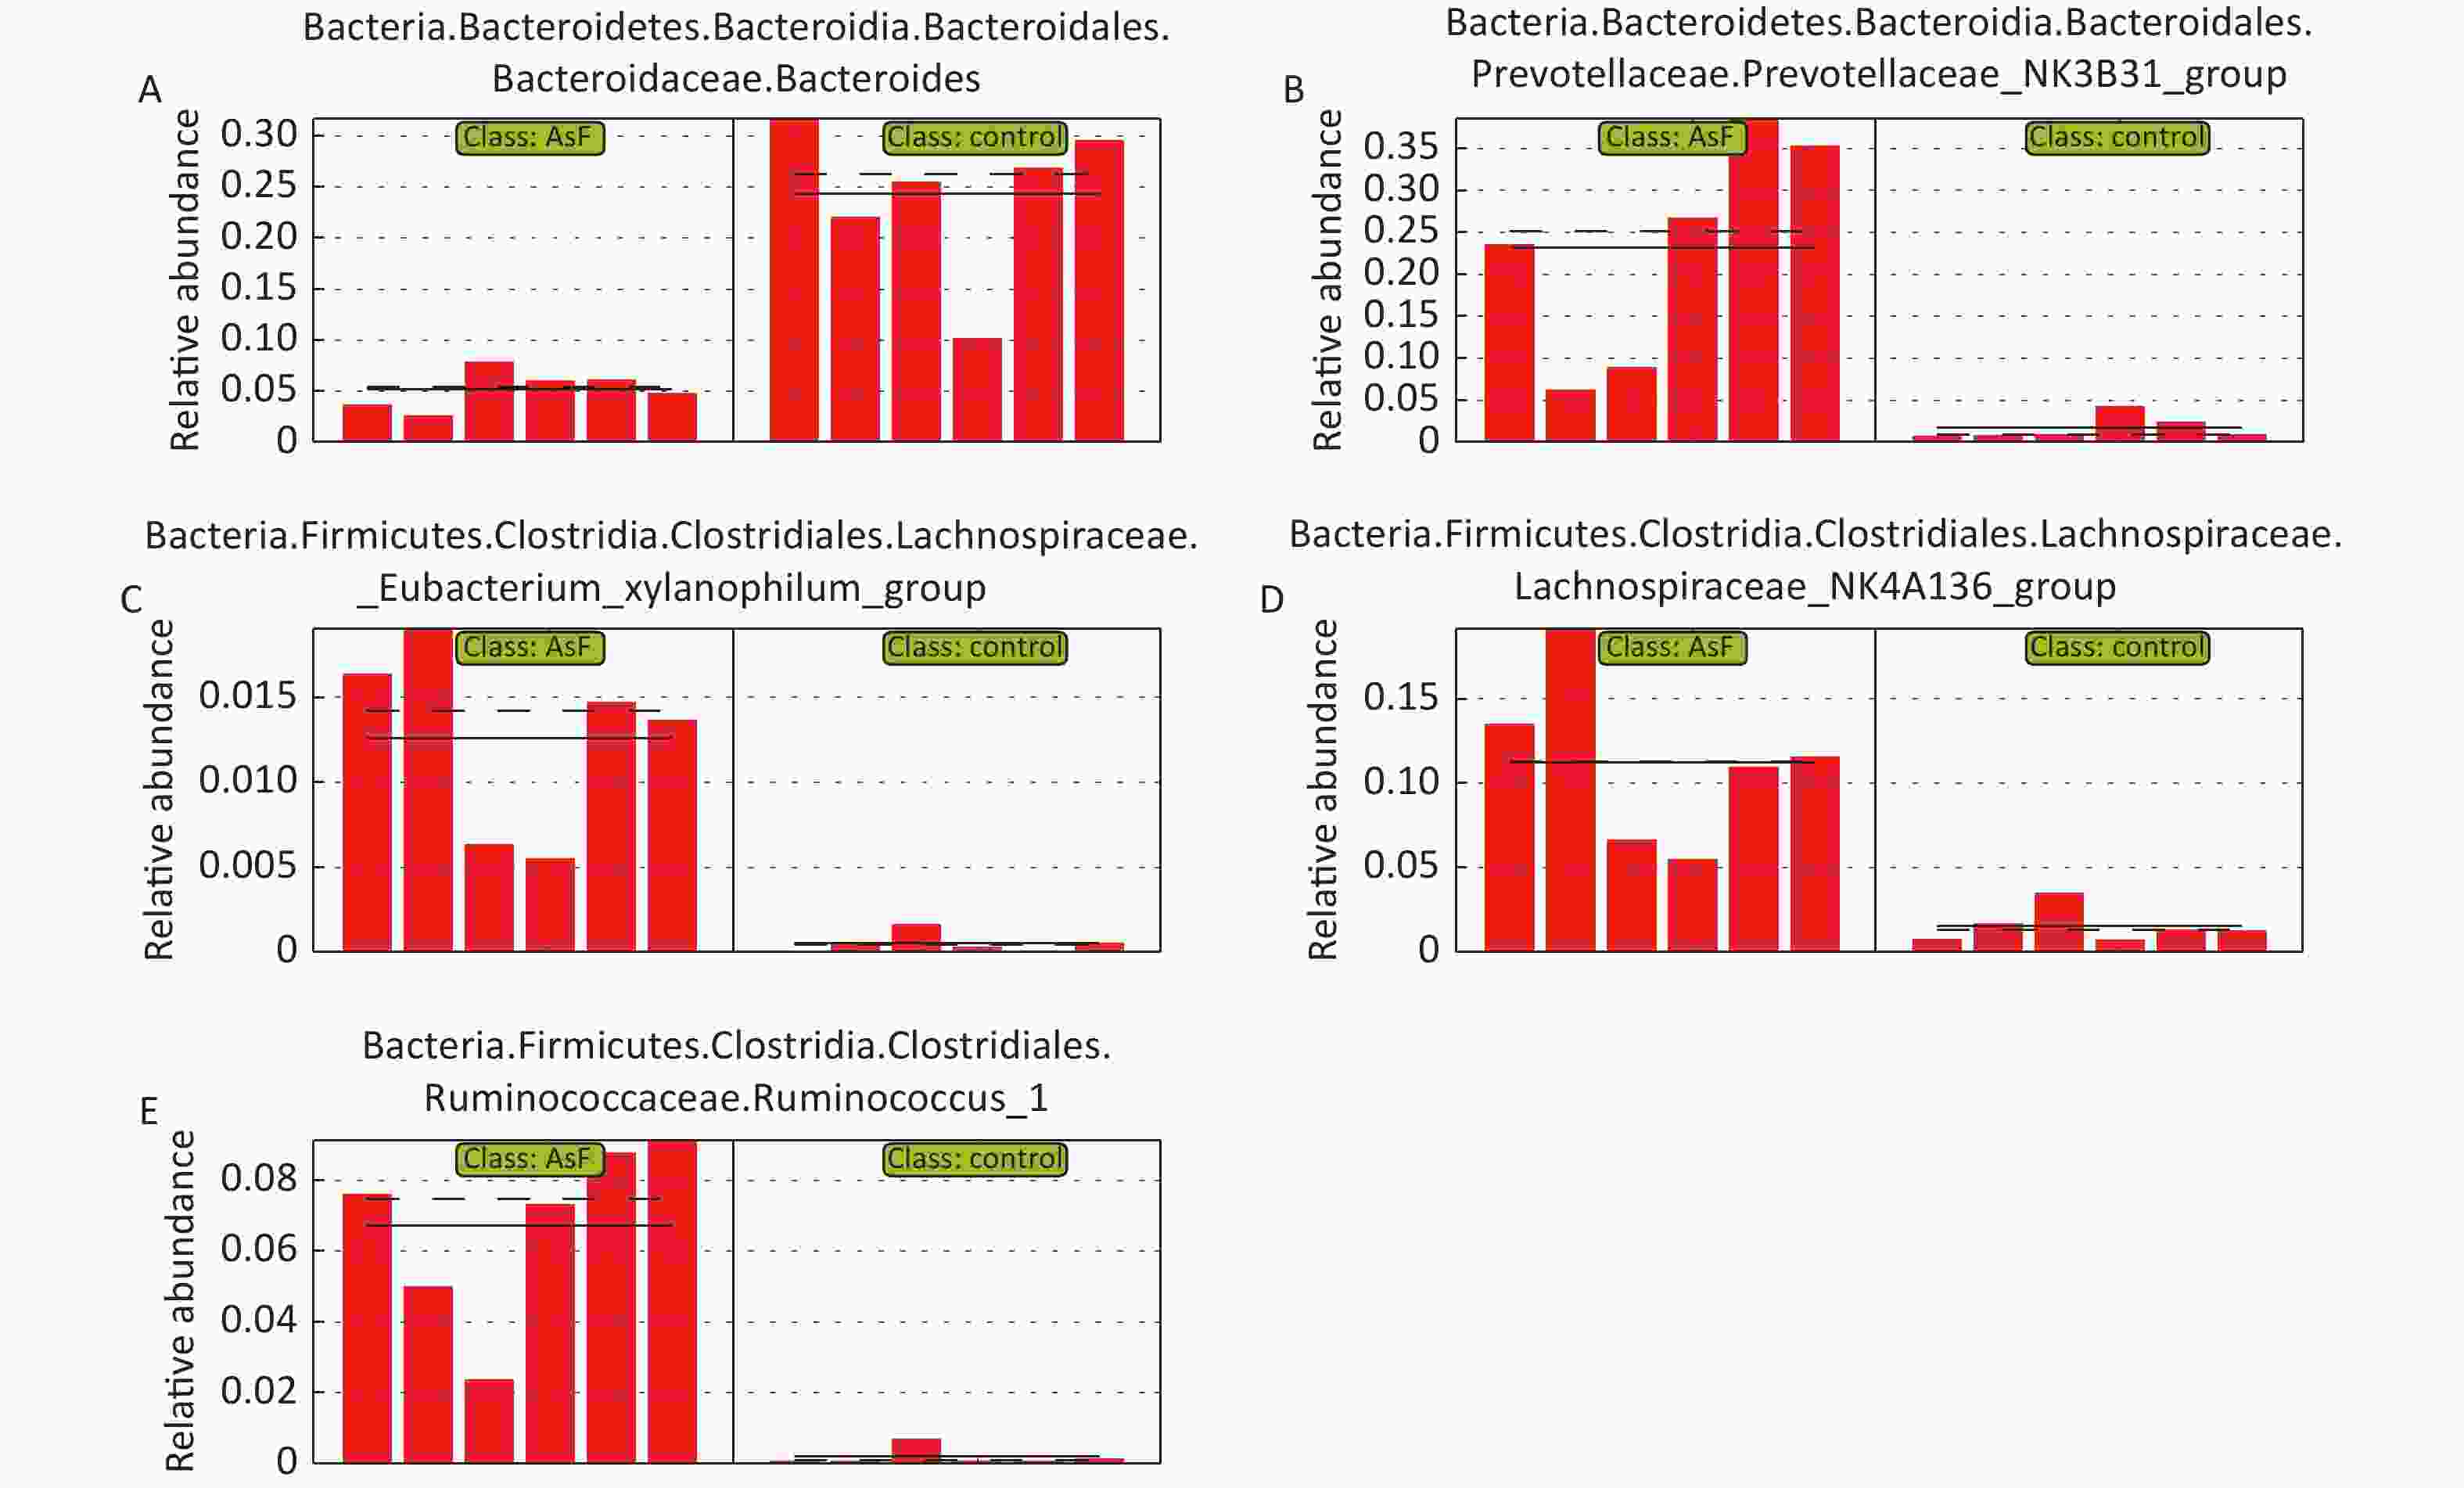
Figure S2. Plot of relative abundance of differential bacteria based on group AsF and Con. The bars represent the relative abundance of each sample, and the solid and dashed lines indicate the mean and median values, respectively
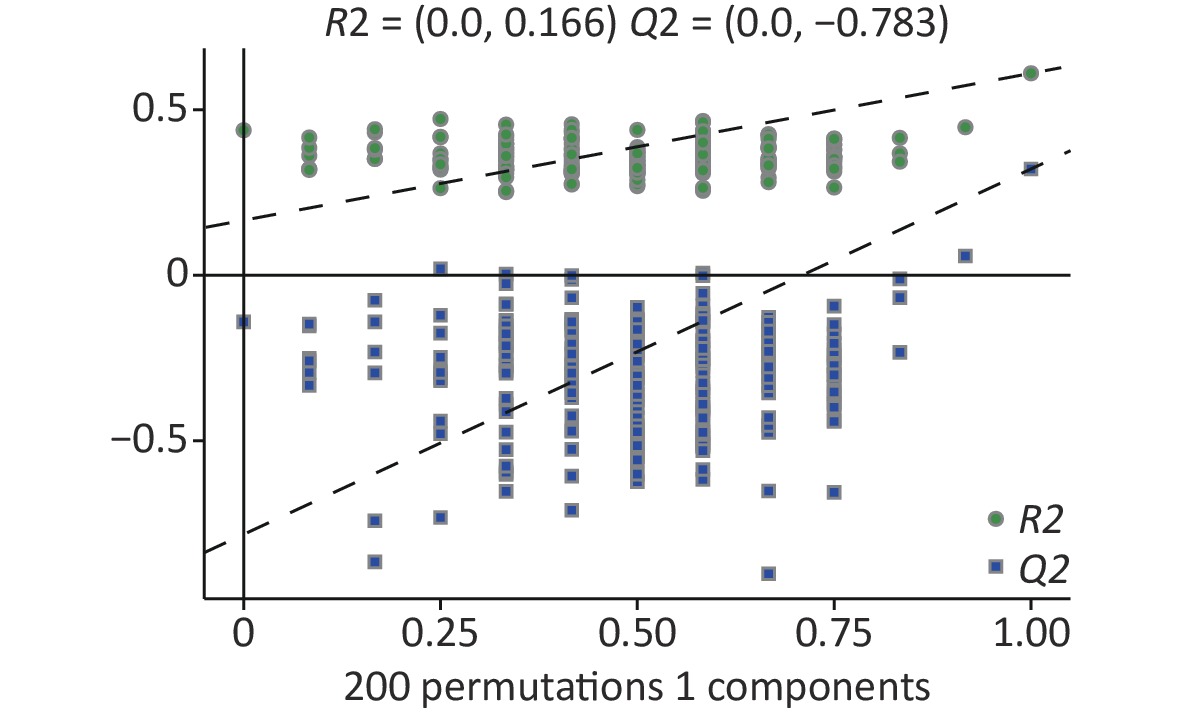
Figure S3. Permutation of differential metabolites based on all groups. R2, Q2: parameter of Permutation test to measure whether the model is overfitted
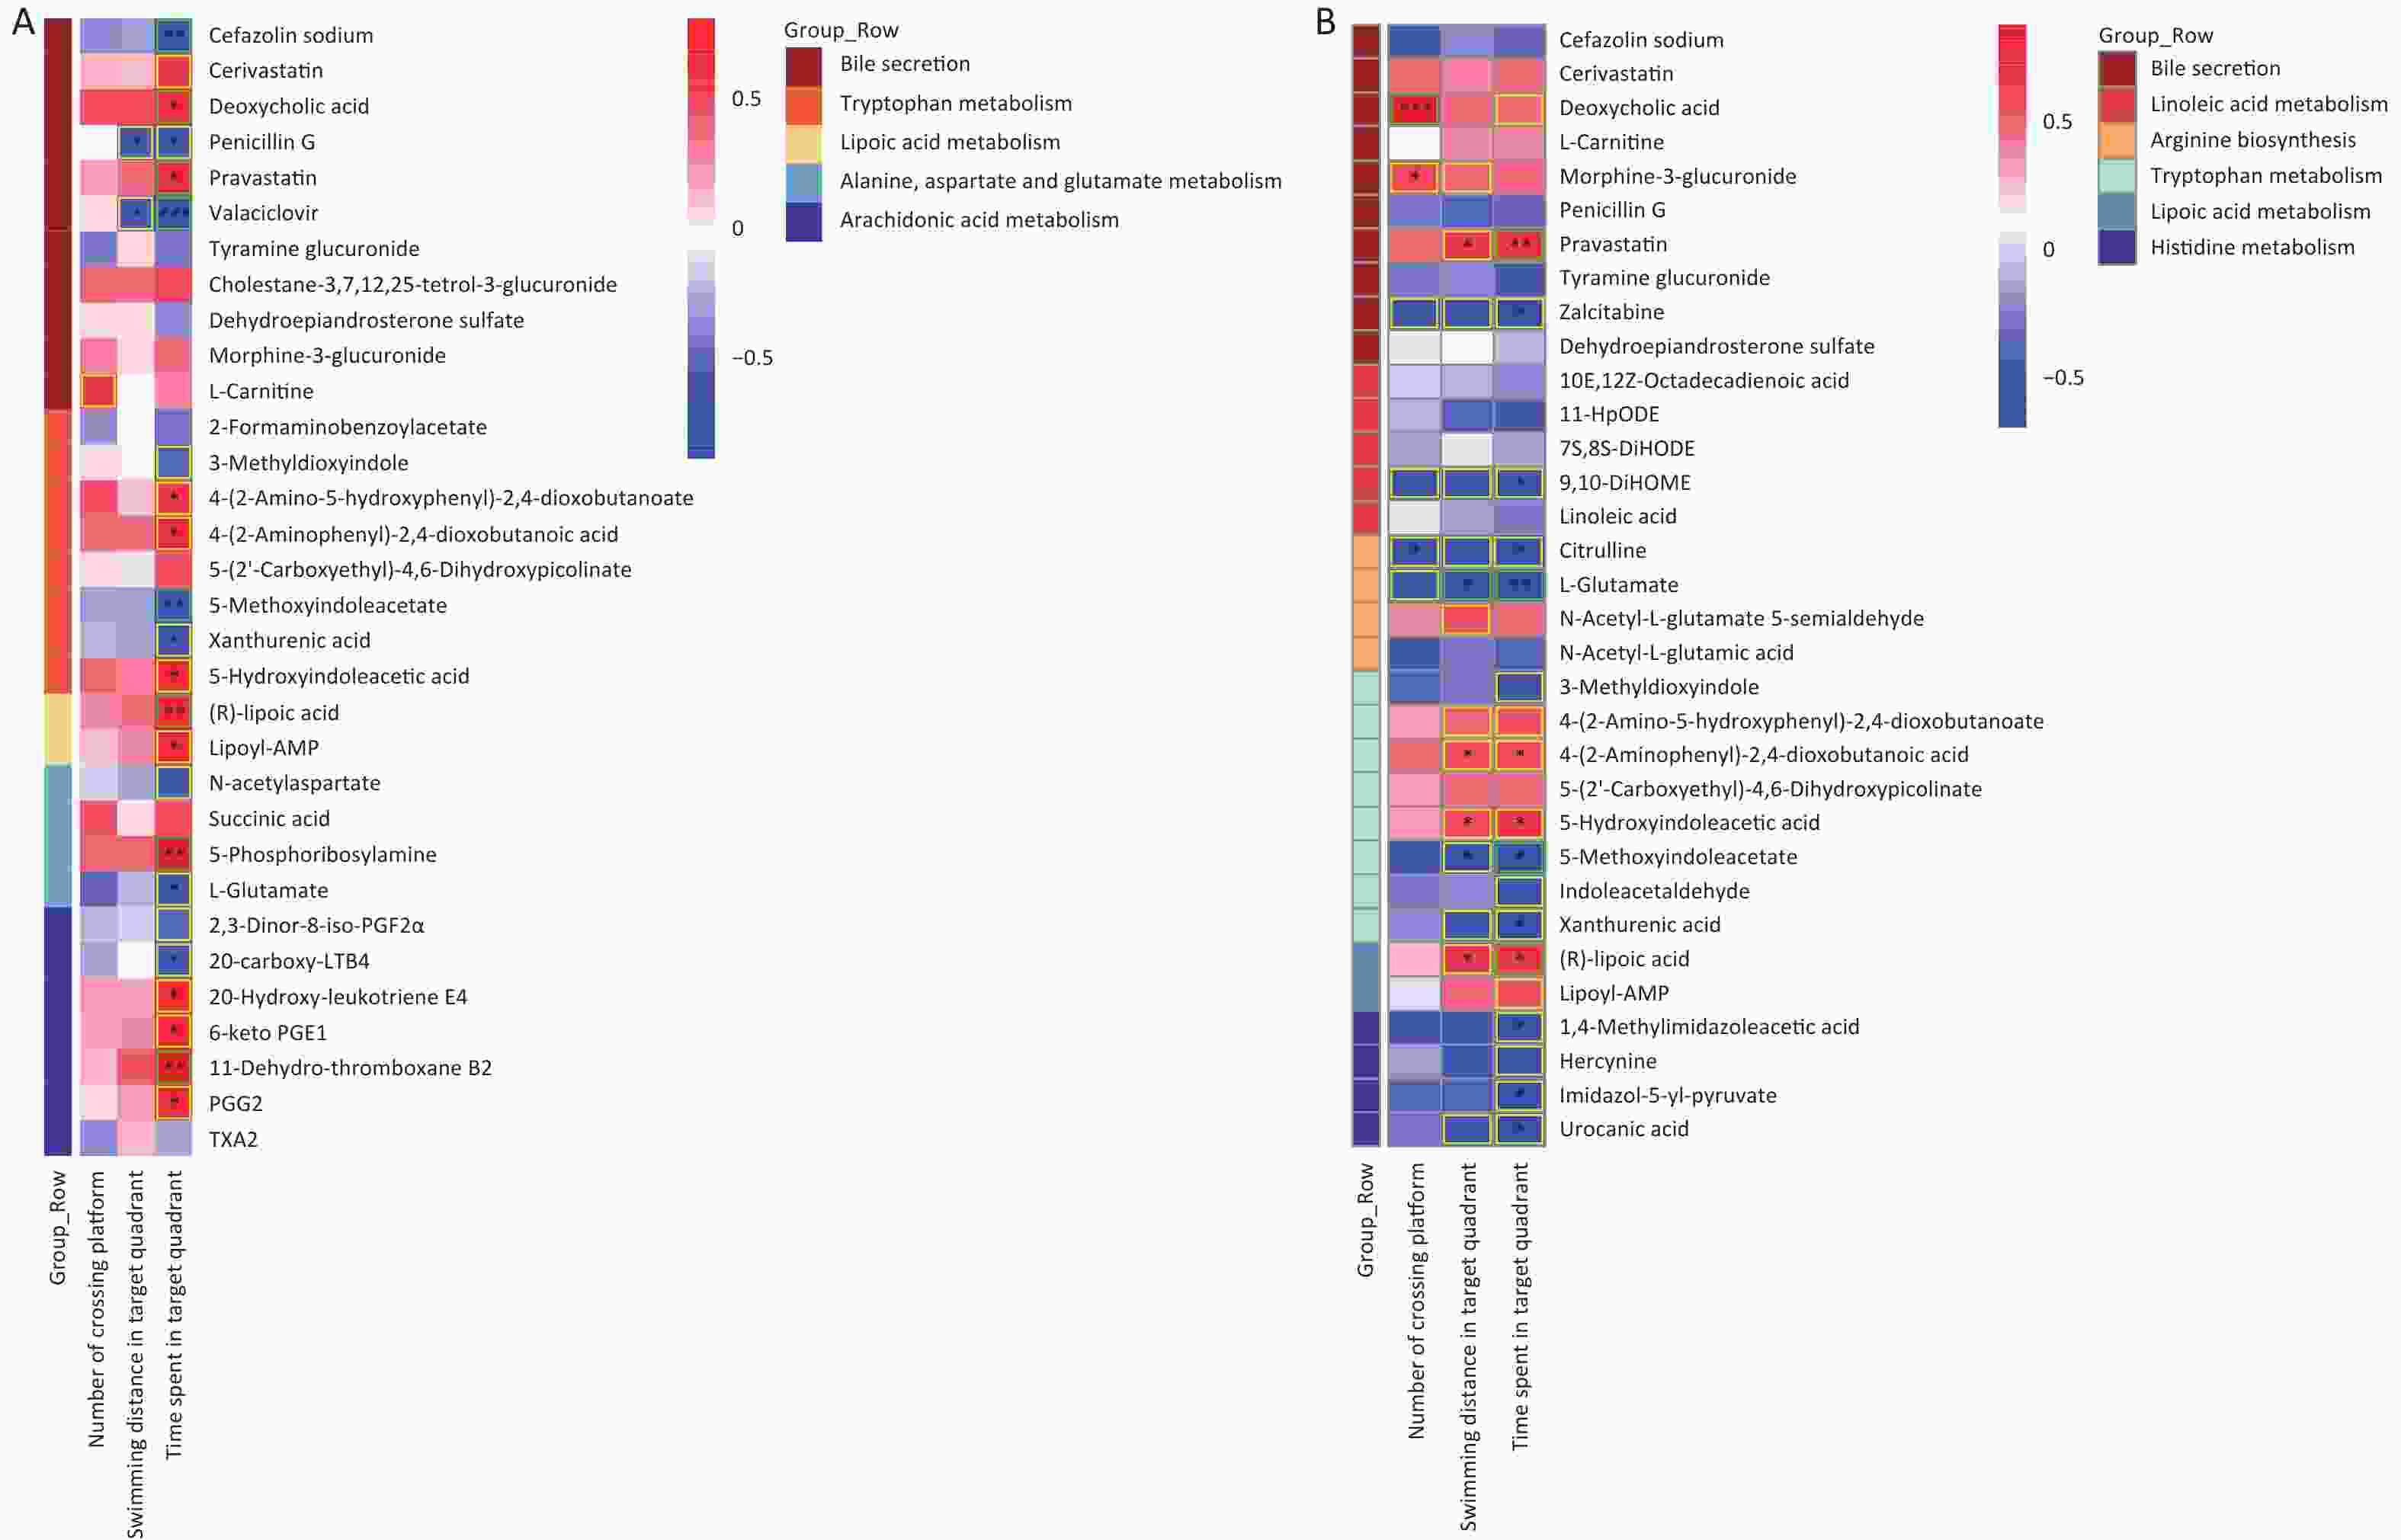
Figure S5. Correlation between metabolomic alterations and behavioral indicators. Heat map of correlation matrix generated based on control group and As exposure group (A). Heat map of correlation matrix generated based on control group and F exposure group (B). Moderate correlations (0.5 ≤ |r| < 0.7) are highlighted as yellow-outline squares; strong correlations (|r| ≥ 0.7) are highlighted as green-outline squares. *, **, and *** P-values < 0.05, 0.01, and 0.001, respectively, versus the C group.
HTML
Chemicals and Reagents
Animals
Arsenic and/or Fluoride Exposure
Biological Sample Collection
Morris Water Maze
Hematoxylin and Eosin (H&E) Staining of Hippocampus
Determination of Excretion of Arsenic and Fluorine
16S rRNA Gene Sequencing for the Gut Microbiome
LC-MS for the Gut Metabolome
Statistical Analysis
Interaction of As and F Co-exposure on As and/or F Metabolism
Effects of As and F, Alone or in Combination, on Behavioral and Pathological Changes
Changes in Microbiome Community Structure and Diversity in Response to As and/or F Exposure
Effects of As and/or F Exposure on Gut Metabolome
Correlation between Gut Microbiota and Metabolites
Correlation between Gut Microbiome Composition and Water Maze Performance
Correlation between Gut Metabolome and Water Maze Performance
 22169Supplementary Materials.pdf
|

|

 Quick Links
 DownLoad: