-
The transition from pregnancy to motherhood is a unique phase that often requires women to make immediate and significant changes in their daily lives, including their thinking and behavior. Such a lifestyle shift may cause difficulties and additional stress for some women, leaving new mothers vulnerable to depression, anxiety, and other negative emotions[1]. Pregnant women have higher levels of depression and anxiety than the general population, and the most common psychological complication of childbearing is postnatal depression (PPD)[2]. A meta-analysis of studies from 56 countries found that 17.7% of pregnant women worldwide experienced PPD[3]. In a meta-analysis, Biaggi et al.[4] demonstrated that the prevalence of antenatal depression in pregnant women was 7%–20% in middle- and high-income countries and > 20% in low-income countries. The prevalence of perinatal depression in China is similar to those in low- and middle-income countries: the pooled prevalence of perinatal depression was 16.3%, with antenatal depression at 19.7% and PPD at 14.8% in China[5]. Nielsen-Scott et al.[6] conducted a meta-analysis and reported the pooled prevalence of self-reported anxiety symptoms was 29.2% antenatally and 24.4% postnatally in low- and middle-income countries; the prevalence of clinically diagnosed anxiety disorder was 8.1% antenatally and 16.0% postnatally. According to Sun et al.[7], the National Center for Women and Children’s Health of China confirmed that the detection rate of anxiety among pregnant women during early pregnancy was 19.9% in China. In addition, fear of childbirth (FOC) is a common psychological problem among mothers-to-be. In their systematic review and meta-analysis, Maeve et al.[8] found that the global prevalence of FOC among pregnant women was 14%. The FOC situation among pregnant women in China is more serious. Han[9] conducted a cross-sectional survey at two hospitals in China through convenience sampling and reported that the total prevalence of FOC was 67.8%, and the percentages of women with mild, moderate, and severe FOC were 43.6%, 20.2%, and 4.0%, respectively.
Excessive depression, anxiety, and FOC can negatively affect the physical health of pregnant women. Women who experience anxiety, depression, and FOC during pregnancy are more likely to have sleep problems and experience more burnout, nausea, dizziness, and heart problems[10-15]. During pregnancy, negative emotions often predict poor delivery-related outcomes. Specifically, FOC increases the risk of elective and emergency cesarean sections[16-18]. Togher[19] indicated that maternal negative emotions, including depression and anxiety, directly affect the fetus by altering the expressions of related genes, causing changes in placental glucocorticoid signaling and, thus, increasing fetal exposure to cortisol. Epidemiological studies have shown that fetal exposure to maternal prenatal mood distress can alter fetal development and increase short- and long-term disease risk[20,21]. Furthermore, prenatal anxiety can augment the risk of preterm birth (PTB) and low birth weight (LBW)[22], whereas prenatal depression can increase the risk of operative deliveries[23], PTB, and LBW[24]. A low Apgar score and low breastfeeding rates have been associated with maternal depression and anxiety during pregnancy[25-27]. Serious postpartum depression and anxiety in mothers can reduce the quality of mother-infant attachment[28,29], which plays an important role in children’s cognitive and emotional development and mental health. Mothers with postpartum depression or anxiety are less sensitive to the infant’s signals that indicate their needs[30]. Finally, a poor mother–infant attachment raises the risk of psychological and behavioral disorders throughout the infant’s life cycle[31,32].
Given the plethora of research on the effects of women’s mental health during pregnancy and early motherhood on the physical and psychological health of the mothers and offspring, preventing or decreasing the incidence of mental disorders among pregnant women should be a crucial public health goal[33,34]. Helpful psychological interventions during pregnancy are urgently needed, and women, especially first-time mothers, require organized antenatal education and preparation for birth.
In the previous two decades, mindfulness-based intervention programs have gradually become more popular to help people improve their well-being. A mindfulness-based childbirth and parenting (MBCP) program[35,36] was developed for pregnant women in the United States, which was adopted by Bardacke from the widely known and effective Mindfulness-Based Stress Reduction program developed by Jon Kabat-Zinn[37]. The MBCP program aims to teach pregnant women and their partners’ mindfulness skills to manage anxiety and depression during pregnancy, cope with fear and pain during childbirth, and foster sensitive parenting styles[38,39]. In several countries, studies have shown that MBCP programs can effectively alleviate pregnant women’s anxiety, depression, FOC, and other negative emotions and facilitate childbirth self-efficacy and marital satisfaction[40-43]. However, to date, few high-quality, evidence-based medical studies have focused on the effect of the MBCP intervention in a maternal population and on the effect of the MBCP program intervention on pregnant women in China.
China has a unique traditional cultural and social background for maternal health care. In 2016, our team introduced the MBCP to China. We conducted a preliminary survey of pregnant women in China regarding the demand for the course and found that the classic 9-week MBCP course was difficult for many pregnant women to accept because 9 weeks was considered too long. To increase the probability of maternal participation in the course, we increased the MBCP program’s compatibility with Chinese culture and social background to meet the needs of pregnant women in China. Our team adjusted the classic MBCP curriculum locally in China[44] by changing the 9-week course to a 4-week one and simplifying parts of the curriculum. Thus, this study explored the efficacy of the 4-week MBCP course in increasing life satisfaction and reducing depression, anxiety, and FOC in pregnant women in China.
-
The required sample size was calculated using statistical power analysis. The score of the Delivery Expectancy/Experience Questionnaire (W-DEQ) was taken as the reference based on previous studies[45], and a statistical power of 0.90 was used to reject a null effect at the 0.05 level of significance. A minimum sample size of 37 for each group was calculated and 74 in total. After taking into account a possible attrition rate of 20%, a target sample size of 93 participants was set.
We created random grouping sequences using the Statistical Analysis System (SAS) for Windows (Version 9.1, SAS institute, Cary, NC, USA) and assigned participants to a control group or an intervention group using a 1:1 ratio based on their time of enrollment.
-
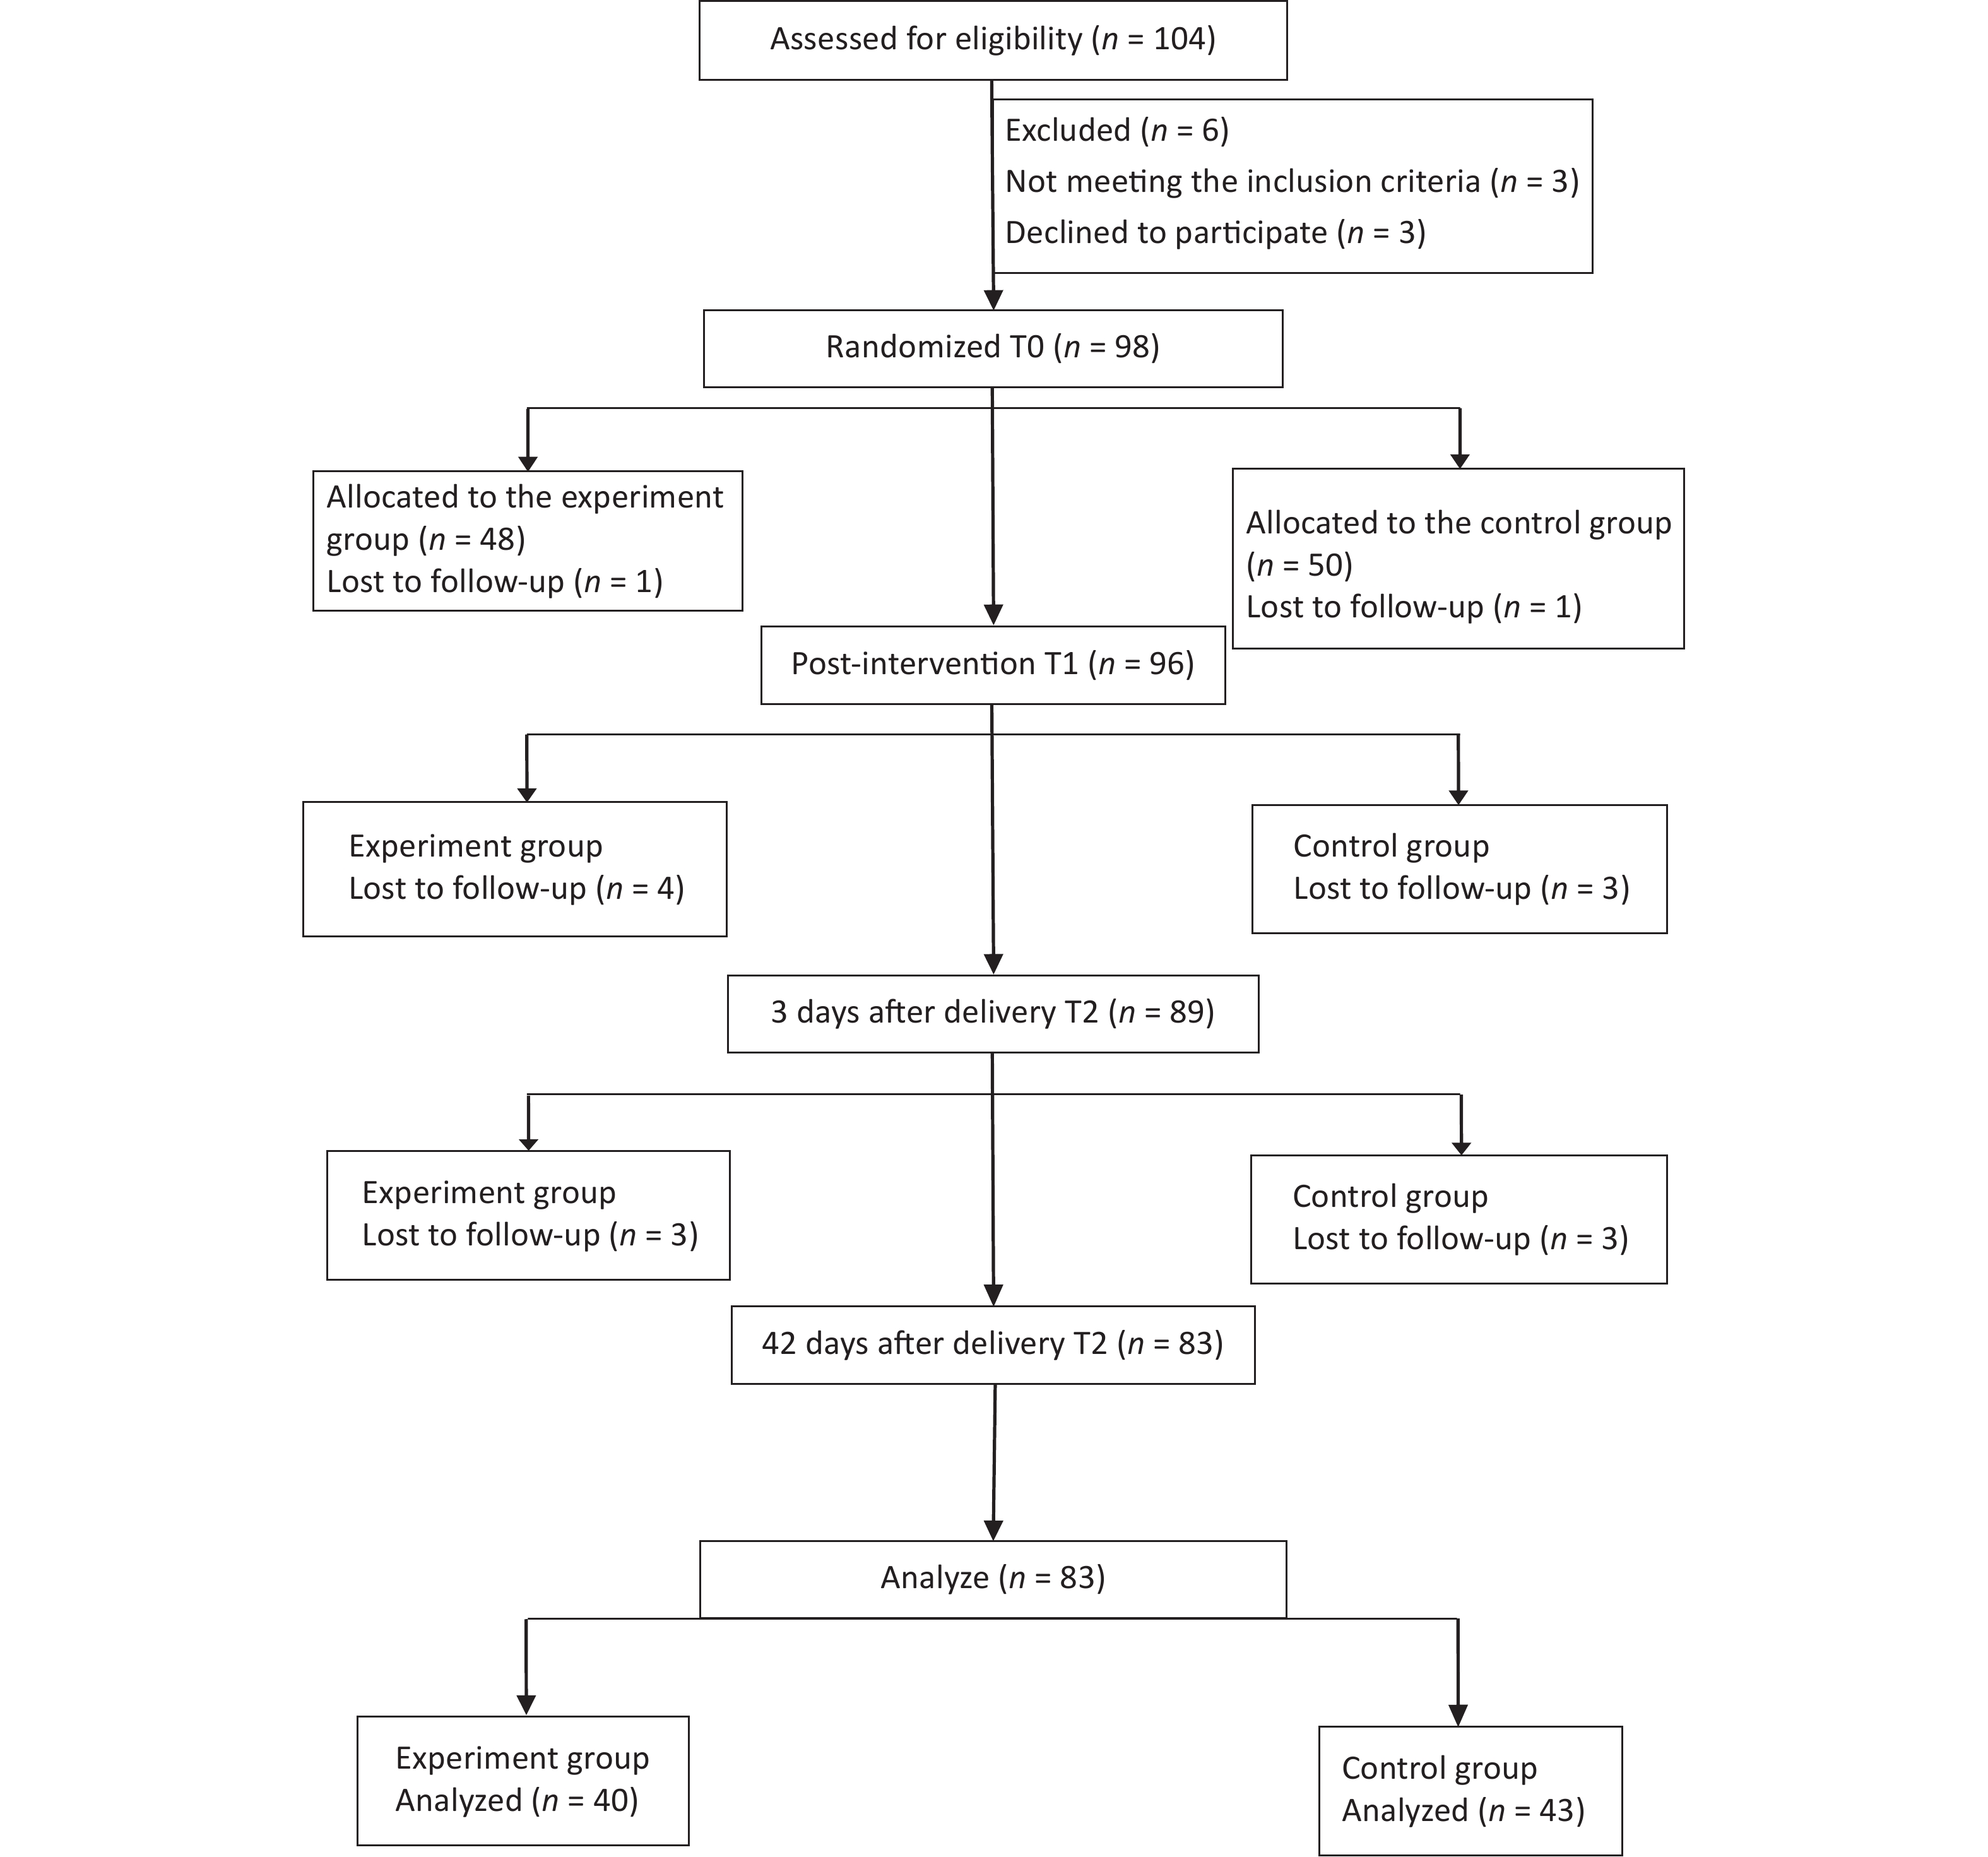
Pregnant women capable of full Chinese communication with a single pregnancy at 20–32 weeks of gestation who had set up a registry at the target hospital and planned to have a prenatal examination, in-hospital delivery, and postnatal review at the hospital were included. Furthermore, the participants should have a high school education or above and have no serious pregnancy complications or diseases. Pregnant women who were diagnosed with psychosis, undergoing any form of psychological therapy, or taking psychotropic medications were excluded. Pregnant women who had repeated abortions, PTB, or a history of epilepsy were also excluded. We initially selected 104 women to participate in the study based on the inclusion criteria (Figure 1).
-
The intervention group received a 4-day on-site localized MBCP course during weekends for four consecutive weeks, with the first, second, and fourth weekends lasting 2.5 h and the third weekend lasting 6.5 h. The total on-site intervention time was 14 h. The course was conducted face-to-face in small groups by two MBCP teachers with rich teaching experience. The course mainly comprised raisin meditation, breathing awareness, body scan, mindful yoga and meditation, labor pain cognitive education, and pain management with holding ice exercises (Table 1). After each on-site course, the intervention group practiced at home for 30–40 min per day, 6 days a week, with the recorded audio by the WeChat applet. The practice consisted of formal practice, such as mindful breathing, body scan, mindful yoga, and 3-min breathing space; and informal practice, such as mindful eating, mindful brushing teeth, mindful washing face, and other mindfulness practices in their daily lives. We invited the partners of the participants to accompany and participate in the on-site course and practice at home.
Week Content Week 1 Introduction to mindfulness and introduction of the teacher and the participants
Practice: mindfully eating a raisin and awareness of breathing meditation
Inquiry, sharing among participantsWeek 2 Practice: body scan meditation Week 3 Inquiry, sharing among participants
Psycho-education: introduction of the birth process and labor pain from a body-mind perspective
Practice: pain meditations by holding ice and practicing various pain-coping strategies and mindful yoga
Inquiry, sharing among participantsWeek 4 Review of the course: encouragement to continue practice in the future
Inquiry, sharing among participantsTable 1. Main content of the 4-week course
The intervention group also received the same regular health education as the control group. For 21 days, we provided an online childbirth education course with the recorded video by the WeChat applet for those in the control group, which lasted about 5–10 min per day. The course covered pregnancy-related physical and psychological knowledge and self-care skills during pregnancy and postpartum.
We helped and guided the two groups of participants to better complete the relevant study and exercises using the WeChat platform. We arranged for physicians to answer their questions related to pregnancy and childbirth using the WeChat platform.
-
We collected the questionnaires before (T0) and after (T1) the intervention, 3 days after delivery (T2), and 42 days after delivery (T3) at the hospital clinic. All participants completed the Edinburgh Postnatal Depression Scale (EPDS), Self-Rating Anxiety Scale (SAS), Wijmam Delivery Expectancy/Experience Questionnaire (W-DEQ-A/B), Satisfaction with Life Scale (SWLS), and Five Facet Mindfulness Questionnaire (FFMQ) at each time point. For the post-intervention assessment, the participants completed the Course Satisfaction Questionnaire (CSQ) designed by our team, which measures the satisfaction of the participants with the course using 10-point scales ranging from 1 to 10; higher scores indicate greater satisfaction with the course. The questionnaire was collected face-to-face between the investigators and participants. The participants read and fill in the paper questionnaires by themselves. After questionnaire collection, we arranged for two researchers to double input the questionnaire information into the database with EpiData software (Version 3.1, EpiData Association, Denmark).
-
The EPDS has ten items, and each item is scored from 0 to 3. The scores for each item were added to obtain the total score[46]. A prenatal EPDS score of > 13 was considered an indicator of depression[47]. Tsao et al.[48] used a cutoff value of 13 in a study involving the women in Taiwan, China. The Cronbach’s alpha ranged from 0.84 to 0.85 in our study.
-
The SAS[49] is a self-report scale with 20 items covering various psychological and somatic anxiety symptoms. The participants respond on a four-point scale (1 = “none, or little time” to 4 = “most or all the time”). They answered the questions based on their experiences from the previous week. The original SAS score ranges from 20 to 80. SAS has shown satisfactory psychometric performance[50]. In our study, the Cronbach’s alpha ranged from 0.83 to 0.88.
-
The W-DEQ-A/B assesses FOC during pregnancy and after childbirth. It is composed of 33 items that are scored using a six-point Likert-type scale, with 0 representing “extremely” and 5 representing “not at all.” The total score ranges from 0 to 165; the higher the score, the higher the FOC[51,52]. In our study, the Cronbach’s alpha ranged from 0.88 to 0.93 for questionnaire A and from 0.82 to 0.94 for questionnaire B.
-
The SWLS[53] is a five-item self-report scale that primarily comprises questions concerned with personal life satisfaction. Responses are scored on a seven-point Likert-type scale (1 = “strongly disagree” and 7 = “strongly agree”). The Cronbach’s alpha ranged from 0.79 to 0.86 in our study.
-
The FFMQ is based on factor analysis and contains 39 questions and five factors: observing, describing, acting with awareness, being non-judgmental of inner experience, and being non-reactive to inner experience. Responses are scored using a five-point Likert-type scale, with 1 representing “never or very rarely true” and 5 representing “very often or always true”[54]. The Cronbach’s alpha ranged from 0.78 to 0.85 in our study.
-
The study protocol was approved by the Ethics Review Committee of the National Center for Women and Children (Approval no. FY2018-30, Chinese Center for Disease Control and Prevention, Beijing, China). Before recruitment, every pregnant woman who was interested in participating in the study received a detailed explanation of the purpose, significance, benefits, and potential risks of our study. Additionally, participants were informed regarding what they needed to do in the study and followed up to obtain their understanding and support. The participants provided informed consent. To keep the data confidential, all data collected were anonymous and prohibited for use outside of our study. The participants were informed that they had the right to withdraw from participation at any time during the study period without consequences.
-
IBM SPSS Statistics for Windows version 24.0 (IBM Corp., Armonk, NY, USA) was used for data analysis. The demographic characteristics were summarized as the mean and standard deviation for measurement data and as frequency counts (percentages) for categorical variables. The chi-square test and Fisher’s exact test were used to evaluate the differences between the two groups of demographic variables (education level, marital status, and family income). Measurement data were analyzed using the t-test. Longitudinal data were analyzed using repeated-measures analysis of variance to compare the differences in scale scores of pregnant women at T0, T1, T2, and T3 between the two groups and the changes in scale scores of pregnant women at four time points within the same group.
-
We interviewed a total of 104 participants, of which 6 were eliminated because they did not meet the criteria for inclusion (n = 3) or declined to participate (n = 3). Another 15 participants were excluded from further analysis because they were lost to follow-up (intervention group, n = 8; control group, n = 7; attrition rate = 15.3%). No statistically significant differences were found in the demographic characteristics of the participants who did (n = 83) and did not (n = 15) complete T2 measurements, including age, infant’s gestational age, body weight, education level, census register, marital status, household income, parity, pregnancy method, and pregnancy complications (P > 0.10). No statistically significant differences in demographic characteristics were noted between the intervention (n = 40) and control (n = 43) groups (Table 2, Figure 1). At the post-intervention assessment, 92.5% of the participants in the intervention group scored ≥ 8 on the CSQ, thus indicating that they were satisfied with the course.
Characteristics Intervention group (n = 40) Comparison group (43) χ2/t P Age (Mean ± SD) 31.83 ± 3.50 31.51 ± 3.00 0.45 0.66a Gestational age of infant (Mean ± SD) 26.23 ± 3.80 27.00 ± 4.10 0.89 0.38a Bodyweight (Mean ± SD) 63.19 ± 8.40 6.15 ± 9.15 0.88 0.38a Level of education, n (%) 0.42 0.52b Junior college or below 7 (15.9) 10 (23.3) University or above 33 (84.1) 33 (76.7) Census register, n (%) 0.41 0.52b Urban 26 (65.0) 25 (58.1) Rural 14 (35.0) 18 (41.9) Marital status, n (%) 1.00c Married 39 (97.5) 42 (97.8) Not married 1 (2.5) 1 (23.2) Income, n (%) 0.77 0.68b < ¥100,000 13 (32.5) 11 (25.6) ¥100,000–¥200,000 15 (37.5) 20 (46.5) > ¥200,000 12 (30.0) 12 (27.9) Parity, n (%) 0.13 0.72b 0 prior births 32 (80.0) 33 (76.7) ≥ 1 prior births 8 (20.0) 10 (23.3) Pregnancy way, n (%) 1.00c Pregnancy by nature 38 (95.0) 41 (95.3) Pregnancy by medicine 2 (5.0) 2 (4.7) Pregnancy complications, n (%) 1.84 0.18b No 33 (82.5) 30 (69.8) Yes 7 (17.5) 13 (30.2) Note. aChi-square test; bt-test; cFisher’s exact test. Significant at the 0.05 level. Table 2. Comparison of general information between the two groups
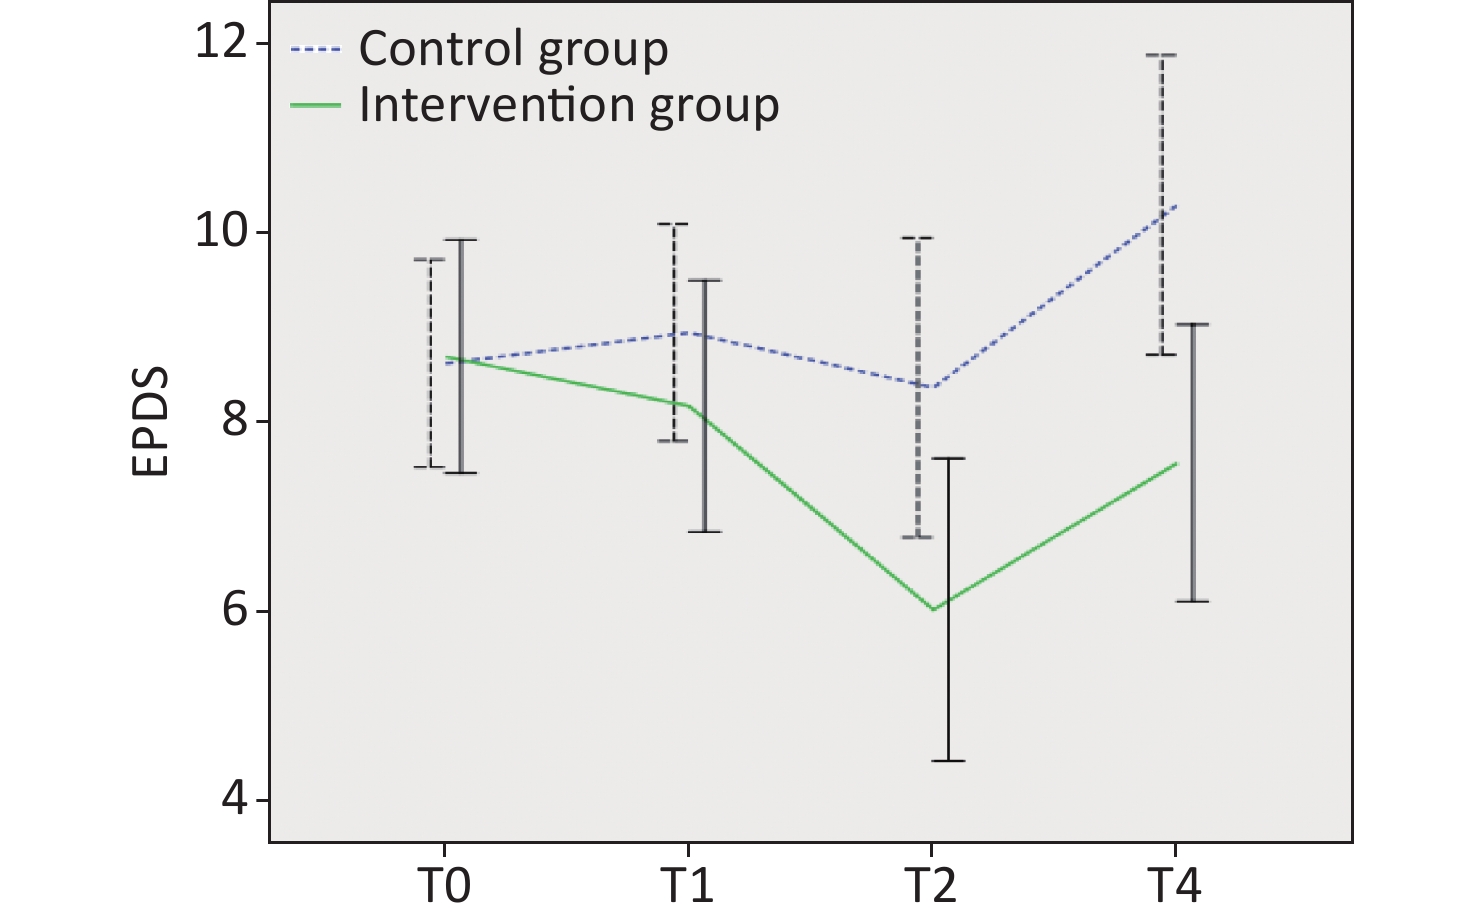
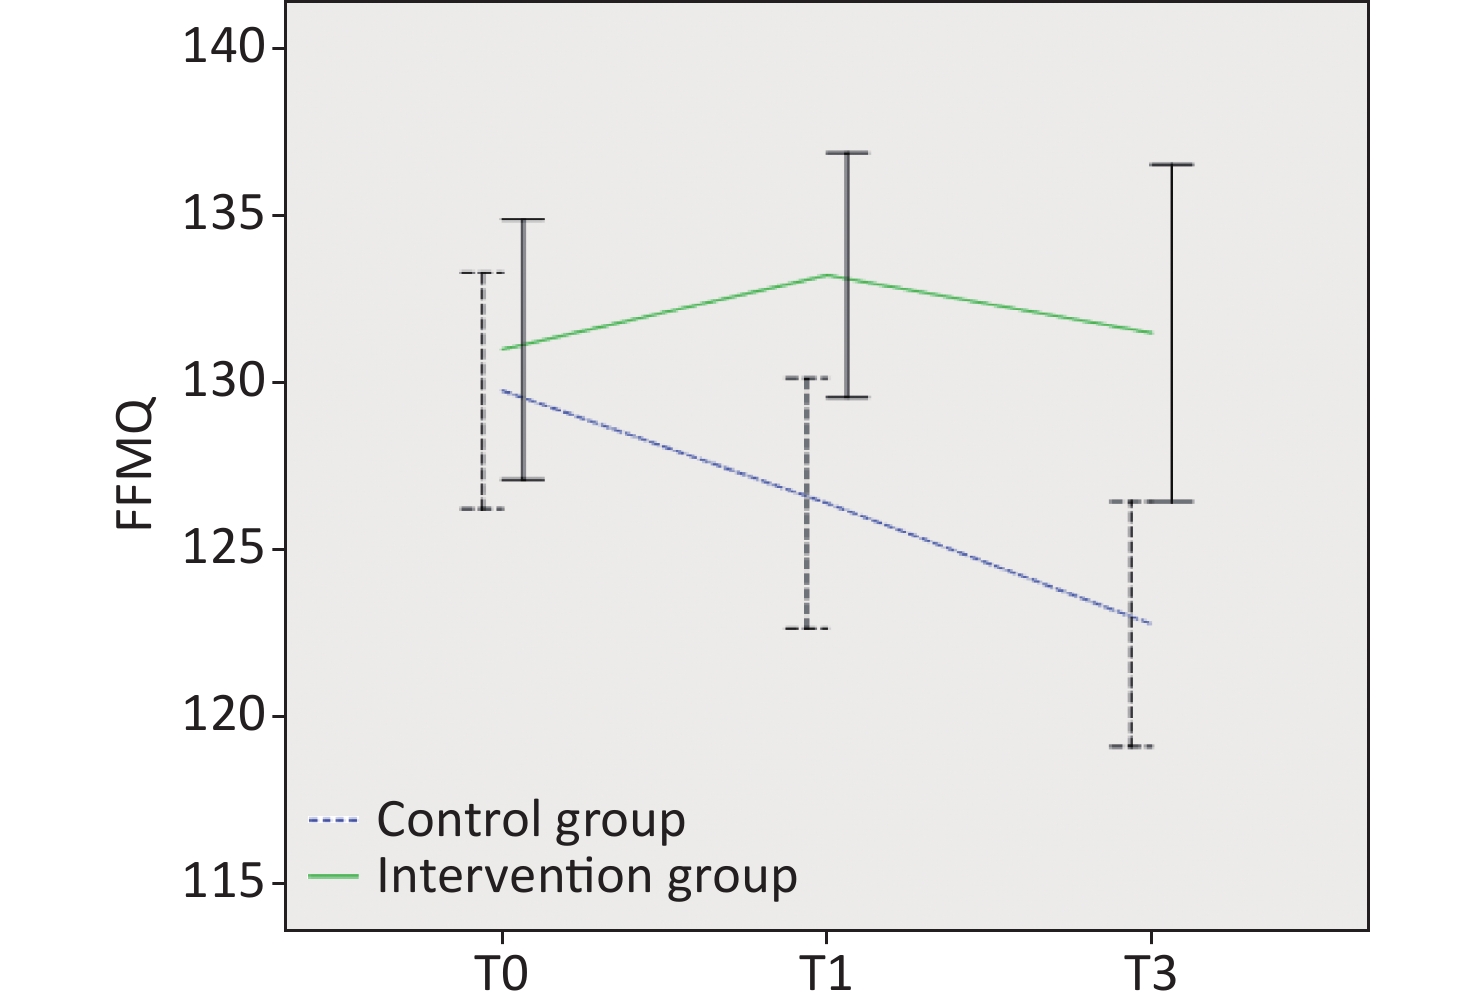
The longitudinal data analysis results are presented in Table 3 and Figures 2-6. Regarding depression, the overall results showed no significant difference between the groups (F = 3.80, P = 0.05). A significant difference was found at different times (F = 4.86, P = 0.04), but no interaction occurred between the group and time (F = 2.58, P = 0.06). Further comparison of the two groups at the same time point revealed that at T0, the average score of the intervention group was 0.07 points higher than that of the control group, but the difference was not significant (P = 0.93). At T1, the average score of the intervention group was lower than that of the control group, with a difference of 0.78 points (P = 0.37). The difference between the two groups gradually emerged over time at T2 and T3, with 2.34 points (P = 0.04) and 2.72 points (P = 0.01) respectively. In the intervention group, the mean within-group comparisons at different time points indicated that the mean score at T2 was significantly lower than at T0 (P = 0.001) and T1 (P = 0.004), and the mean score at T3 was significantly higher than at T2 (P = 0.04). In the control group, the mean score at T3 was significantly higher than at T0 (P = 0.03) and T2 (P = 0.007).
Variables Group T0 T1 T2 T3 Group Time Group×time F (P) F (P) F (P) EPDS Intervention group 8.70 ± 3.86 8.17 ± 4.16 6.03 ± 5.00*ab 7.58 ± 4.57*c 3.80
(0.050)4.86
(0.004)2.58
(0.060)Control group 8.63 ± 3.56 8.95 ± 3.73 8.37 ± 5.14 10.30 ± 5.15ac SAS Intervention group 41.24 ± 8.13 40.11 ± 6.35* 37.51 ± 5.83*a 39.46 ± 9.91 6.26
(0.010)3.06
(0.049)3.85
(0.020)Control group 41.44 ± 6.60 45.41 ± 6.99a 43.63 ± 10.64 43.46 ± 11.09 W-DEQ-
A/BIntervention group 72.19 ± 22.15 60.79 ± 18.53*a 62.00 ± 24.94*a N/A 8.01
(0.006)2.17
(0.100)4.29
(0.008)Control group 70.78 ± 18.04 75.73 ± 17.83 72.95 ± 22.49 N/A SWLS Intervention group 25.98 ± 3.98 28.35 ± 3.99*a N/A 25.58 ± 5.40*b 11.04
(0.001)7.72
(0.001)2.55
(0.080)Control group 24.78 ± 5.48 24.47 ± 4.04 N/A 22.47 ± 5.74ab FFMQ Intervention group 131.00 ± 12.16 133.22 ± 11.42* N/A 131.49 ± 15.75* 4.77
(0.03)1.68
(0.190)6.76
(0.002)Control group 129.77 ± 11.46 126.41 ± 12.16 N/A 122.79 ± 11.90a Note. T0 = before the intervention; T1 = after the intervention; T2 = 3 days after delivery; T3 = 42 days after delivery. FOC, Fear of children; EPDS, Edinburgh Postnatal Depression Scale; FFMQ, Five Facet Mindfulness Questionnaire; SAS, Self-Rating Anxiety Scale; SWLS, Satisfaction With Life Scale; W-DEQ-A/B, Delivery Expectancy/Experience Questionnaire. *A statistical difference was found between the intervention and control groups. aCompared with T0, a significant difference was noted. bCompared with T1, a significant difference was noted. cCompared with T2, a significant difference was noted. Table 3. Assessing the effects of depression, anxiety, FOC, satisfaction with life, and mindfulness using repeated-measures analysis of variance (mean ± SD)
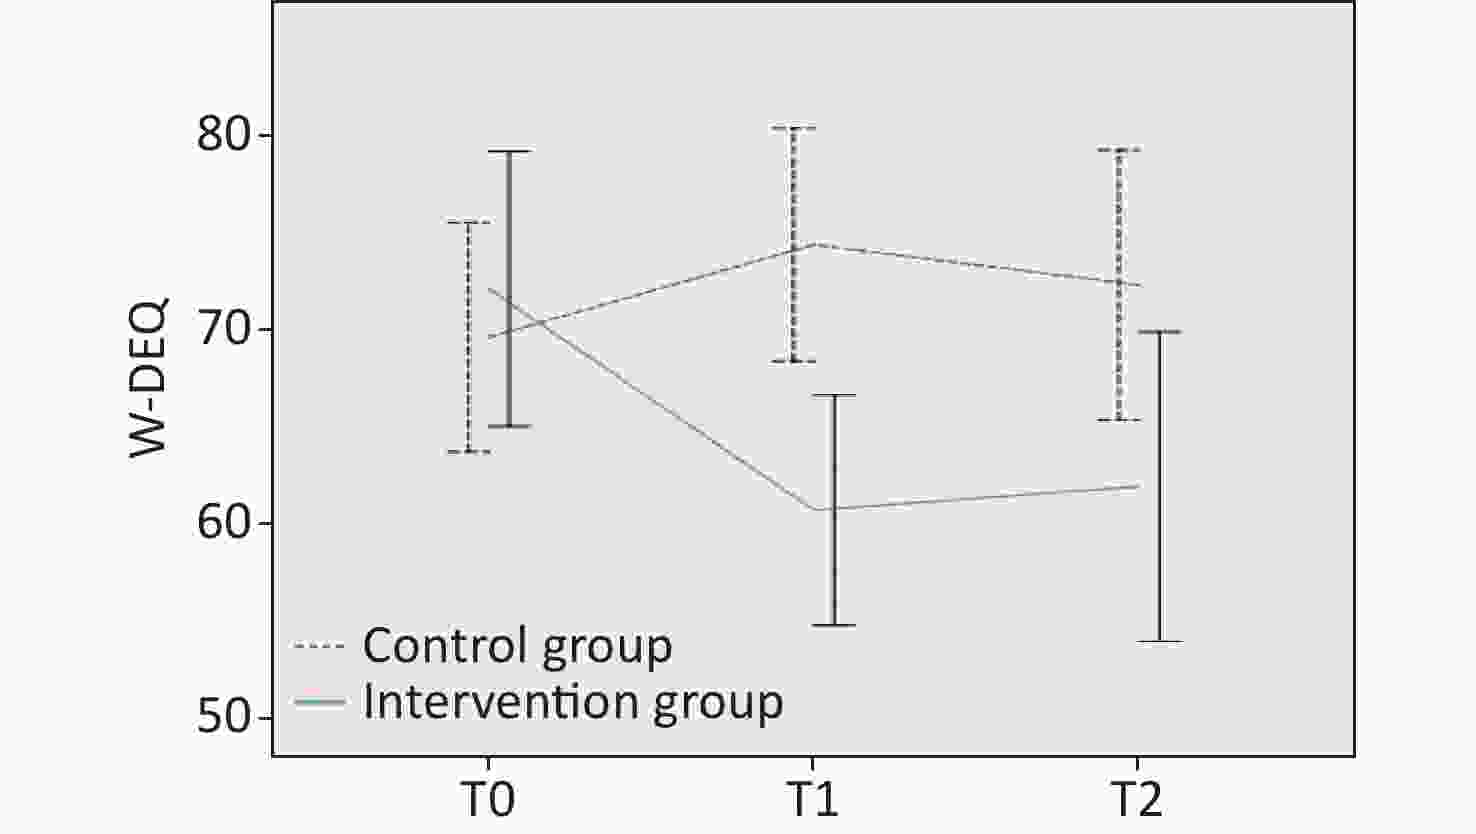
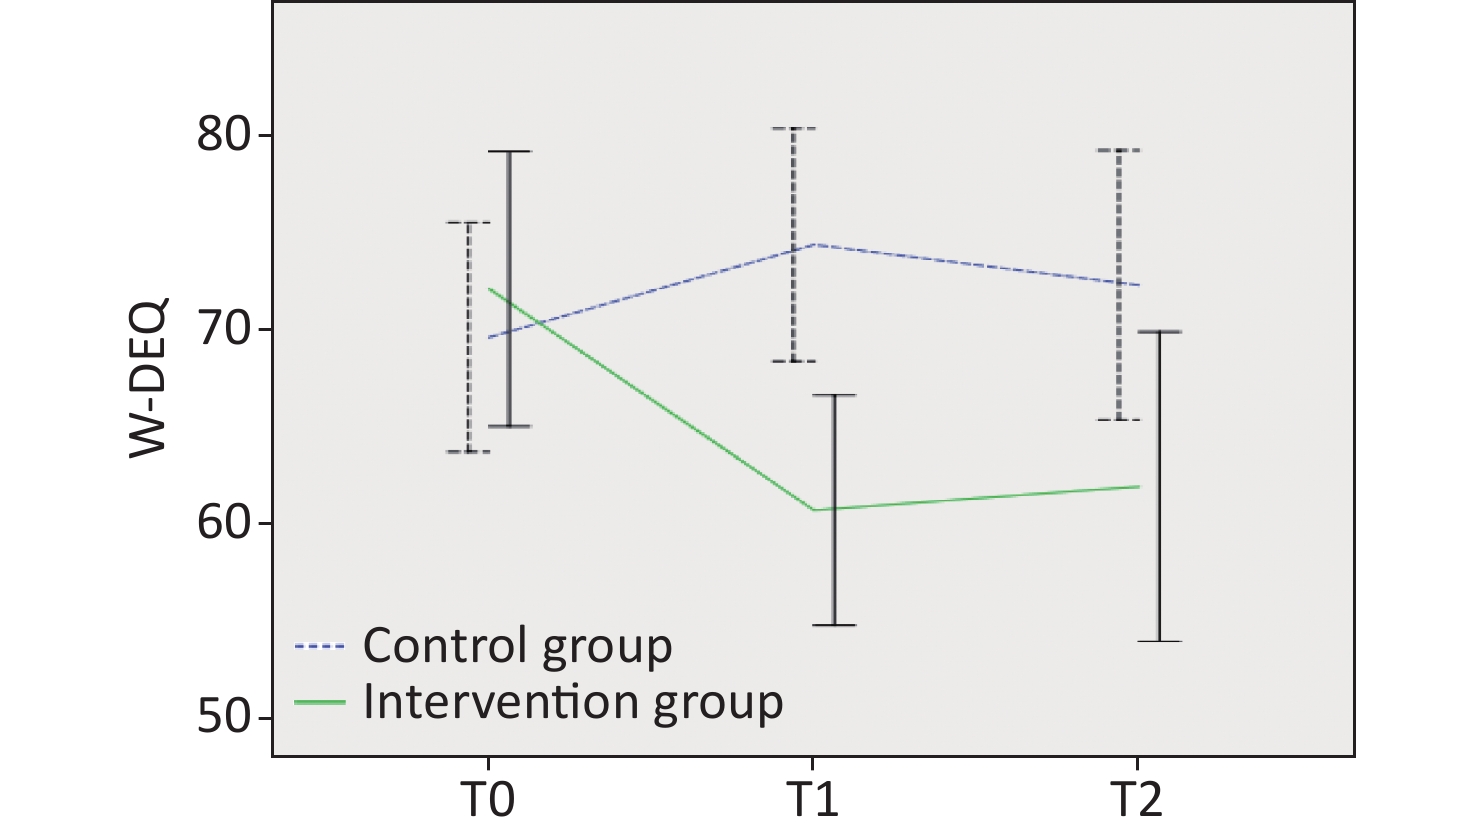
Figure 4. Differences in fear of childbirth at T0, T1, and T3. W-DEQ, Delivery Expectancy/Experience Questionnaire.
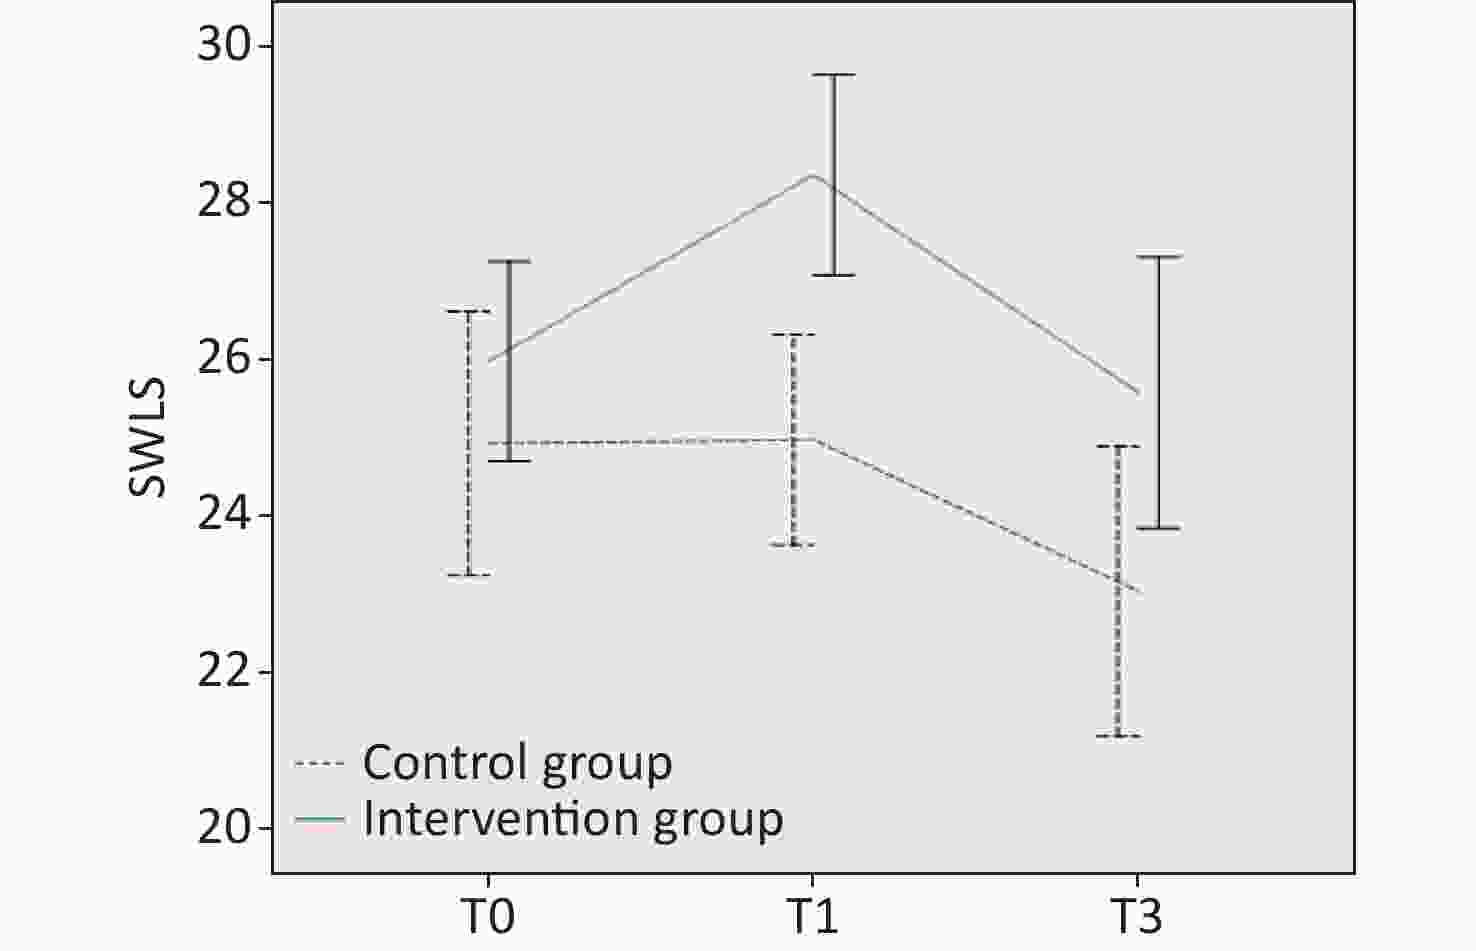
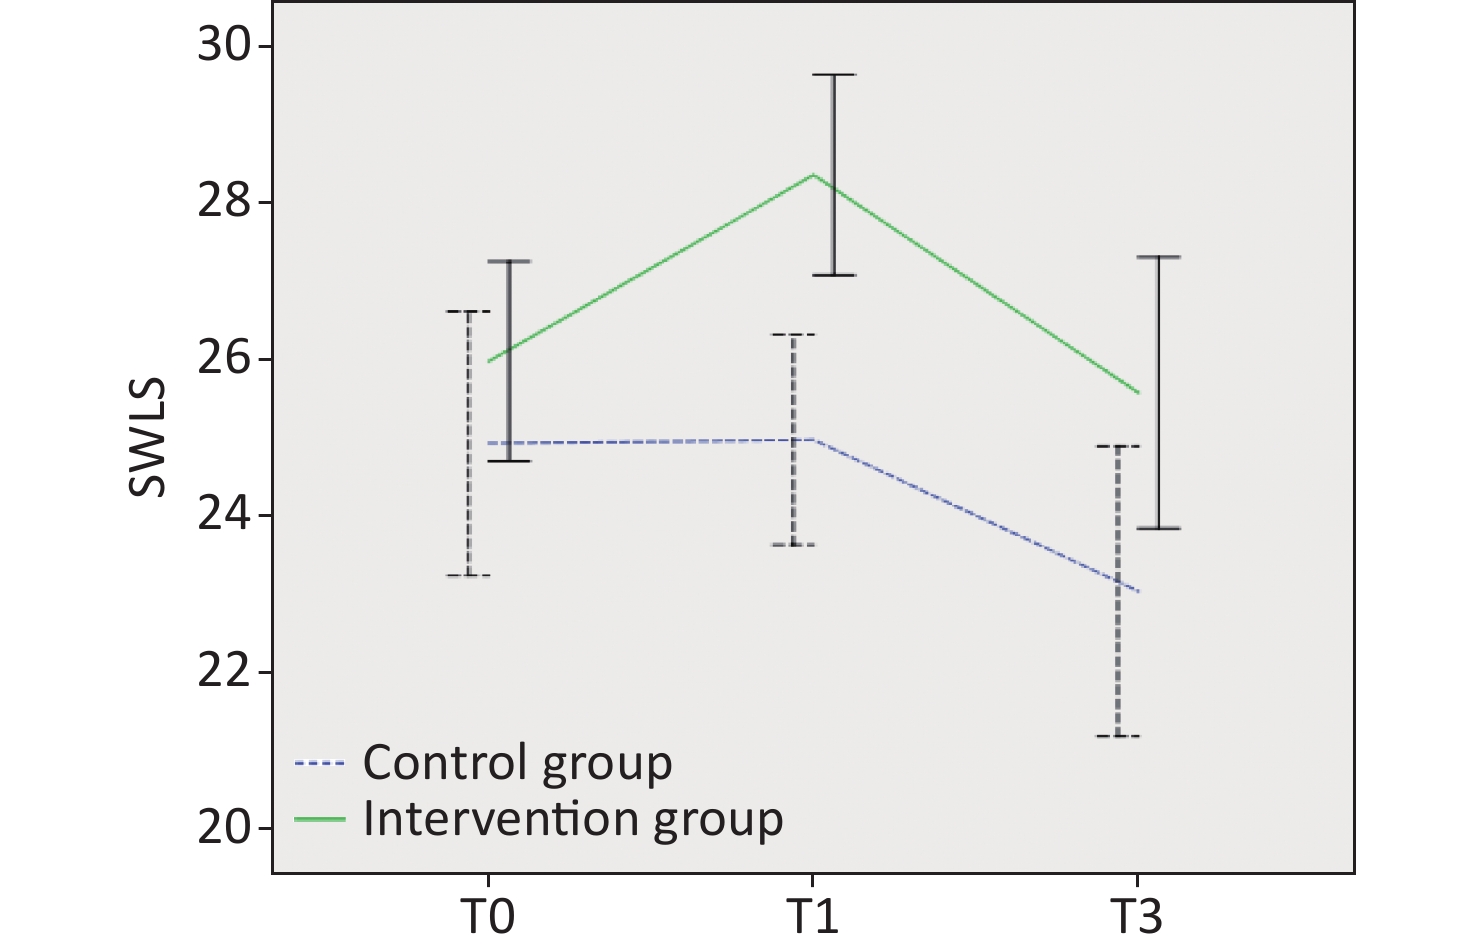
Figure 5. Differences in satisfaction with life at T0, T1, and T3. SWLS, Satisfaction With Life Scale.
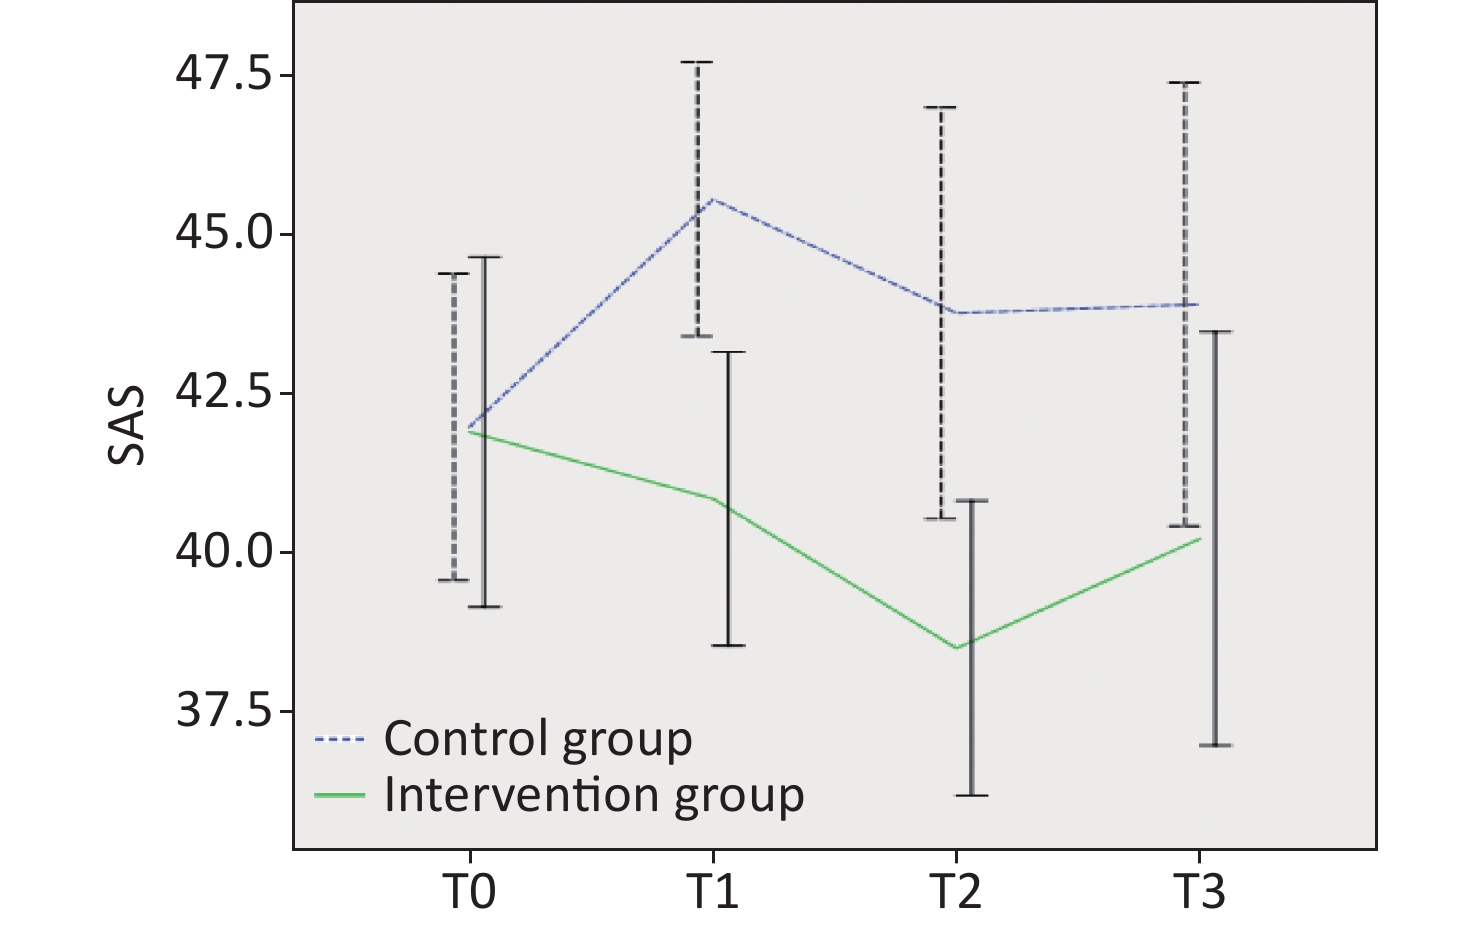
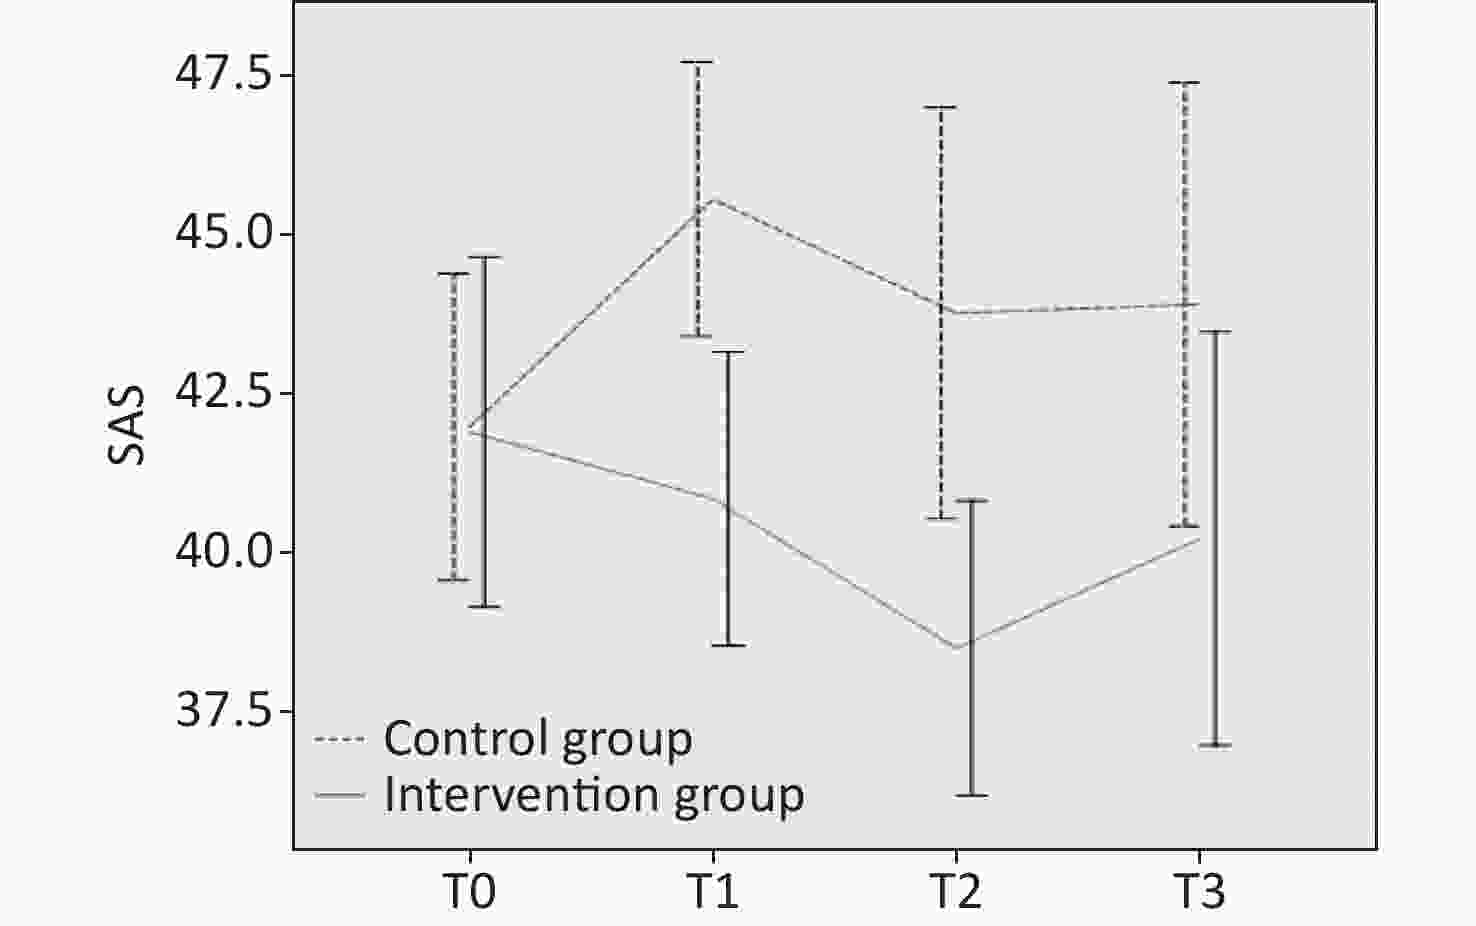
For anxiety, the overall results showed that the differences between the two groups were significant (F = 3.06, P = 0.049). The differences between different times were significant (F = 6.26, P = 0.01), and an interaction was found between the group and time (F = 3.85, P = 0.02). Further comparison of the two groups at the same time point revealed that the average score of the intervention group was 0.2 points lower than that of the control group at T0 but not statistically significant (P = 0.91). After the intervention, the difference between the two groups increased to 5.31 points (P = 0.001) at T1 and 6.12 points (P = 0.003) at T2; however, the difference between the two groups decreased to 4 points at T3 (P = 0.10). In the intervention group, the mean within-group comparisons at different time points indicated that the mean score at T2 was significantly lower than at T0 (P < 0.001), whereas in the control group, the mean score at T1 was significantly higher than at T0 (P = 0.03).
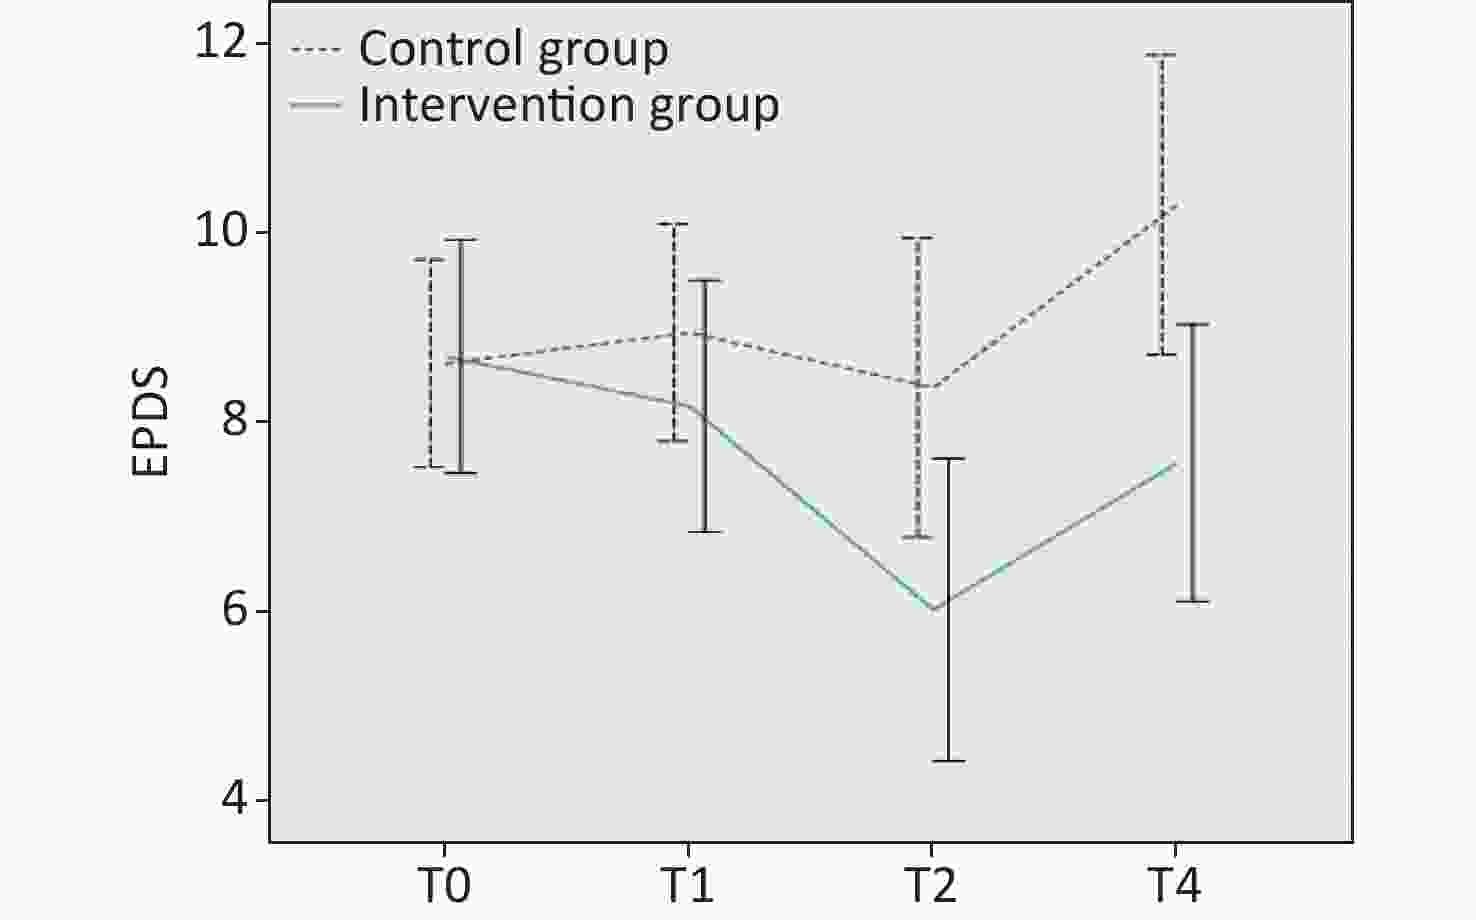
Figure 2. Differences in depression at T0, T1, T2, and T3. EPDS, Edinburgh Postnatal Depression Scale.
As regards FOC, the overall results showed that the difference between the groups was significant (F = 8.01, P = 0.006). The differences between different times were not significant (F = 2.17, P = 0.10), whereas an interaction occurred between group and time (F = 4.29, P = 0.008). Further comparison of the two groups at the same time point showed that the mean score for the intervention group was 1.41 points lower than that of the control group at T0 and was not significant (P = 0.75). The mean score for the intervention group was 14.95 points lower (P < 0.001) than that of the control group at T1; however, the gap between the two groups decreased at T2, and the mean score of the intervention group was 10.95 points lower (P = 0.04) than that of the control group. The mean comparison of scores within groups at different time points indicated that in the intervention group, the mean scores at T1 and T2 were significantly lower than those at T0 (P < 0.001, P = 0.002). The difference between the three time points in the control group was not statistically significant.
Regarding life satisfaction, the overall results showed that the difference between groups was significant (F = 11.04, P = 0.001). The differences between different times were significant (F = 7.72, P = 0.001), but no interaction occurred between group and time (F = 2.55, P = 0.08). Further comparison of the means of the two groups at the same time point showed that the average score of the intervention group at T0 was 1.2 points lower than that of the control group and was not significant (P = 0.27). After the intervention, the difference between the two groups increased to 3.86 points (P < 0.001). At T3, the difference between the two groups decreased to 3.1 points (P = 0.02). In the intervention group, the mean within-group comparisons at different time points indicated that the mean score at T1 was significantly higher than the mean score at T0 (P = 0.002), and the mean score at T3 was significantly higher than the mean score at T1 (P = 0.003). In the control group, the mean scores at T3 were significantly lower than those at T0 (P = 0.02) and T1 (P = 0.03).
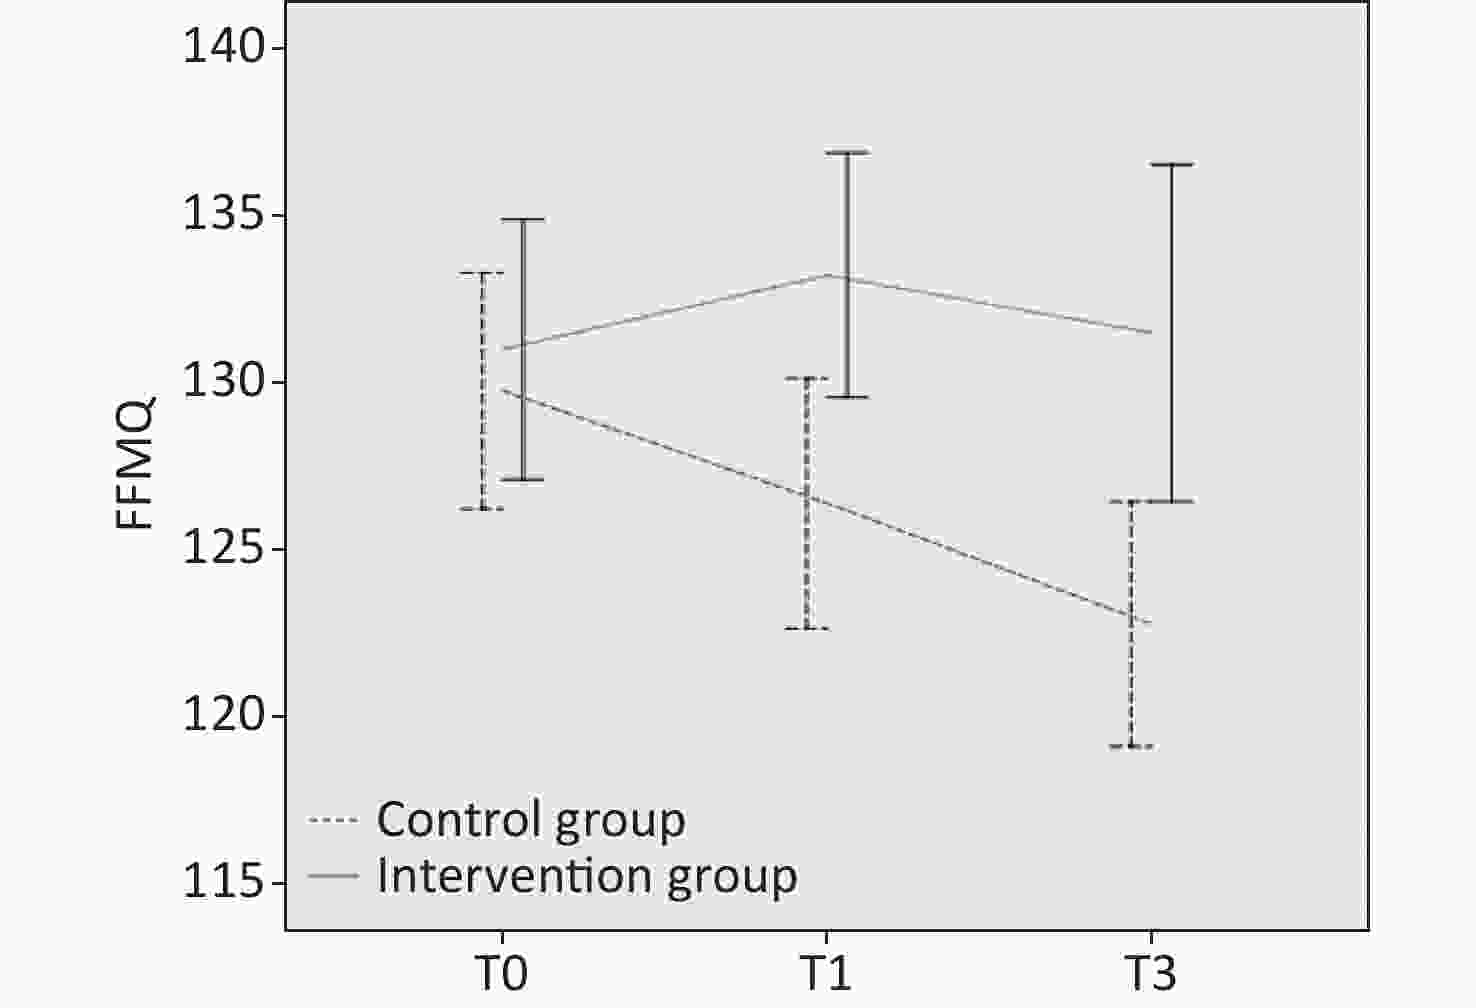
For mindfulness, the overall results showed that the difference between the groups was significant (F = 4.77, P = 0.03). No significant difference was found at different times (F = 1.68, P = 0.19), but an interaction was noted between the group and time (F = 6.76, P = 0.002). Further comparison of the two groups at the same time point revealed that the mean score of the intervention group at T0 was 1.23 points higher than that of the control group and was not significant (P = 0.64). After the intervention, the difference between the two groups increased to 6.81 points (P = 0.01), and at T3, the difference increased to 8.7 points (P = 0.006). In the intervention group, the mean within-group comparisons at different time points indicated that the difference among the three time points was not significant. In the control group, the mean score at T3 was significantly lower than that at T0 (P = 0.001).
-
A total of 83 pregnant women completed the study. Between the group, differences in demographic characteristics and scores on the psychological measures were not statistically significant before the intervention. After the intervention, anxiety and FOC levels were significantly reduced in the intervention group compared with that in the control group, and the significant difference between the two groups lasted up to 3 days postpartum. The depression level between the two groups did not differ after the intervention; however, the depression level in the intervention group was significantly lower than that of the control group 3 days postpartum and lasted until 42 days postpartum. Mindfulness and life satisfaction significantly increased in the intervention group compared with that in the control group after the intervention, and the significant difference between the two groups lasted up to 42 days postpartum. The conclusion of this study is consistent with those of most studies[45,55-64] on mindfulness interventions, but the effect and duration of the intervention vary.
In terms of depression, Warriner et al.[55] at Oxford University conducted a single-arm study including 86 pregnant women. The intervention group received a 4-week mindfulness intervention, and the depression levels of the two groups were compared before and after the intervention to evaluate the effect of the intervention. The results demonstrated that the depression score decreased by 3.08 points after the intervention. In our study, depression in the intervention group decreased significantly 3 days after delivery, with a 2.67 decrease in the depression score, which was slightly lower than that reported by Warriner et al.[55]. A probable reason was that their study participants had a higher depression level (9.36) than in our study (8.7) before the intervention, and participants with higher depression levels may be more sensitive to the intervention. The Oxford study had a high rate of follow-up loss (41.9%), which may contribute to bias. Duncan et al.[45] conducted a randomized controlled trial involving 30 women in the third trimester of pregnancy. The intervention group received a 2.5-day intensive mindfulness-based childbirth preparation course based on MBCP. The Center for Epidemiologic Studies Depression Scale was used to assess depression, which was assessed in both groups before the intervention, after the intervention, and 6 weeks postpartum. The results revealed that depression in the intervention group decreased significantly after the intervention and increased significantly after the intervention to 6 weeks postpartum. In our study, the depression level also increased in the intervention group from 3 days postpartum to 6 weeks postpartum; however, in the study by Duncan et al., the decrease from baseline to 6 weeks postpartum was 7.3% in the intervention group, which was lower than that in our study (12.87%). Beattie[56] conducted a pilot randomized trial using mixed methods with 48 Australian women who were 24–28 weeks pregnant. The intervention group received an 8-week mindfulness intervention, a change from the classic 9-week course, with each class 45 min shorter and fewer classroom discussions and presentations on childbirth. Similarly, depression was measured using the EPDS before, after, and 6 weeks after the intervention. The results established that different from our study, depression in the intervention group decreased after the intervention and increased significantly after the intervention to 6 weeks after the intervention. The time point with the largest decline was after the intervention, which was a score that was 1.2 points lower than before the intervention and only 0.2 points lower than the score before the intervention at 6 weeks after the intervention. No significant difference was found between the two groups at 6 weeks after the intervention. In our study, the first 3 days after delivery showed the largest decrease (2.67) in depression and the score for depression at 6 weeks postpartum decreased by 1.12 points compared with the baseline score, and a significant difference remains between the two groups at 6 weeks postpartum. Our follow-up period was clearly longer than that in Beattie’s study and, in part, suggests that the effect of our intervention may last longer. When the baseline levels of the two studies were compared, the baseline depression level in the intervention group in Beattie’s study (5.30 ± 3.09) was lower than in our study (8.70 ± 3.86); thus, our participants had higher depression levels and might be more sensitive to the intervention. In addition, the attrition rate was significantly higher in Beattie’s study (62.5%) than in our study (15.3%). Lonnberg et al.[57] conducted a randomized controlled study of 193 pregnant women who experienced high stress levels. The participants were between 15 and 22 weeks pregnant, and the intervention group received MBCP training for 8 weeks. Depression was measured with EPDS, and the depression level of the two groups was analyzed and compared before and after the intervention and at 3, 9, and 12 months postpartum. The results showed that, unlike in our study, the difference between the two groups appeared immediately after the intervention. Although the depression in both groups showed a downward trend, the decrease was greater in the intervention group. The total score for depression in the intervention group decreased by 6.1 points after the intervention, much higher than in our study. However, the depression level in the intervention group showed an upward trend from after the intervention to 12 months after delivery, and no statistical difference was found between the two groups at 12 months after delivery. In our study, the depression level in the intervention group continued to decline from after the intervention to 3 days postpartum; however, from 3 to 42 days postpartum, it increased slightly. Lonnberg et al. selected pregnant women with high stress levels, and the effect of mindfulness training may be more significant for those with mood disorders. However, for a period after the intervention, the depression level in both studies showed a rising trend, and the intervention effect gradually disappeared. Dimiddjian et al.[58] conducted a randomized controlled study of women with a history of depression. The pregnant women in the intervention group received an 8-week mindfulness-based training program, and the researchers assessed the depression level in the two groups at 6 months after delivery. The relapse rate in the mindfulness group was 18.4% compared with 50.2% in the control group. This result suggests the need to increase postpartum intervention courses to continue the effects of the intervention.
For anxiety, the SAS has been rarely used to evaluate anxiety in other similar studies. Warriner et al.[55] used the Generalized Anxiety Disorder Scale-7 to evaluate anxiety before and after the intervention when evaluating the effectiveness of a 4-week mindfulness intervention course. They reported that after the intervention, compared with the baseline, the participants’ anxiety level was significantly lower. In our study, the anxiety level in the intervention group was lower than the baseline 3 days after delivery. Guardino et al.[59] measured the anxiety level using the Pregnancy-Specific Anxiety Scale (PSA), Pregnancy-Related Anxiety Scale, and State Anxiety Scale. The stress level was measured with the Perceived Stress Scale (PSS). The researchers conducted a randomized controlled trial of 47 pregnant women with high stress levels and anxiety (PSS > 34 or PSA > 11), and the intervention group was given a 6-week mindfulness intervention. The participants’ anxiety levels and other psychological states before, after, and 6 weeks after the intervention were assessed. The results showed that the anxiety level decreased significantly after the intervention but increased significantly from after the intervention to 6 weeks after the intervention. Unlike this investigation, in our study, the anxiety level was measured by the SAS, but a similar conclusion was drawn: anxiety decreased from the intervention to 3 days postpartum but increased from 3 days postpartum to 6 weeks postpartum. This result further affirms that for a period after the intervention, the effect of the mindfulness intervention will be reduced, both in the general population and people with mood disorders.
With regard to FOC, in a small-sample randomized controlled experiment by Duncan LG et al.[45], the W-DEQ was used to measure the FOC level, which was assessed in the two groups before and after the intervention and 6 weeks postpartum. The results showed that the total W-DEQ score of the intervention group decreased by 9.1 points after the intervention, whereas the total W-DEQ score of the intervention group in our study decreased by 11.4 points after the intervention. Duncan LG et al. demonstrated that the FOC level in the intervention group decreased by 10 points at 6 weeks postpartum compared with the score before the intervention. In this study, at 6 weeks postpartum, the FOC level decreased by 10.12 points compared with the score before the intervention. Thus, our study showed a larger decline in FOC. Similarly, Veringa-Skiba IK et al.[60] conducted a randomized controlled trial of 141 pregnant women with FOC (W-DEQ-A > 66) who received MBCP training for 9 weeks. They assessed FOC before and after the intervention, and the results indicated that FOC scores decreased by 28.7 points in the intervention group, much higher than that in our study (11.4), thereby suggesting that mindfulness interventions may be more effective for pregnant women with FOC. The rate of follow-up loss in the study by Irena et al.[60] was 30.5%, higher than our study, which implies that the 9-week course may be difficult for some participants to adhere to.
Regarding life satisfaction, to date, we have not found any research on the effect of mindfulness interventions on life satisfaction among pregnant women. However, Perez-Blasco J et al.[61] conducted a pilot study of 26 breastfeeding mothers; the intervention group received an 8-week mindfulness intervention, and life satisfaction was assessed using the SWLS. The results showed that the life satisfaction scores of the intervention group increased by 2.07 points, but the difference was not significant when compared with the control group. In our study, the life satisfaction scores increased by 2.37 points after the intervention, which was statistically different from that of the control group. The score decreased by 2.77 points from after the intervention to 42 days postpartum, but the score of the intervention group continued to be higher than that of the control group. Although the participants in the two studies differed characteristically, we can still predict that the change in postpartum lifestyle and the responsibility of raising newborns may decrease women’s life satisfaction, but mindfulness training has a positive regulatory effect on life satisfaction during pregnancy and postpartum.
In summary, the results of this study confirm that the 4-week MBCP course had a certain effect on improving the mental health of pregnant women in China in terms of depression, anxiety, FOC, and life satisfaction. For normal pregnant women, in terms of depression, we found that although the effect of our intervention was not observed immediately after the intervention, a decrease in depression was observed 3 days after delivery. The reduction in depression after our intervention was greater than what was found in the 2.5-day short-term intensive intervention course[45] and the 8-week intervention course in Australia[56], and the effect may last longer. In terms of FOC, the reduction in maternal fear after our course intervention was greater than that in the 2.5-day short-term intensive intervention course. Given the high detection rate of FOC in China[9], the 4-week simplified version of the MBCP course has the potential to alleviate or reduce FOC in Chinese women. As regards adherence, the follow-up loss in our study was only 15.8%, lower than most 8- and 9-week intervention programs. Moreover, the intervention effect was not as substantial in our sample of normal pregnant women compared with the intervention effect on pregnant women with depression, anxiety, stress, or FOC. In the future, evaluating the effect of a mindfulness-based intervention on people with specific psychological disorders in China is necessary. In addition, our study did not evaluate whether the mindfulness intervention course had an impact on maternal physiological indicators, and the effect of mindfulness intervention on maternal physiological indicators could be evaluated in the future. For example, functional near infrared spectroscopy could be used to assess cortical activation during the mindfulness task. Which can help us to assess the treatment response of mindfulness and explore the possible physiological mechanisms behind mindfulness[62]. We also established that, Similar to most studies, the intervention effect on the mental state of participants gradually declined or even disappeared after a period, especially after childbirth. To extend the duration of the effect of the course, taking additional intensive courses or encouraging women to continue to practice mindfulness after childbirth may be necessary.
To our knowledge, this study is the first to explore the psychological effects of a 4-week MBCP course on pregnant women in China. At present, few investigations have evaluated the effectiveness of MBCP courses among Chinese people. Pan et al.[63,64] conducted two randomized controlled studies to ascertain the effects of an 8-week mindfulness intervention program on depression, stress, and other psychological conditions among pregnant women in Taiwan, China. Chan et al.[65] conducted a randomized controlled study on pregnant women to evaluate the intervention effect of prenatal mindfulness meditation training on the psychological status of pregnant women in Hong Kong, China. However, randomized controlled studies of the 4-week course have not been reported. Furthermore, few studies have assessed the effects of prenatal interventions until 42 days postpartum. Our study provides a theoretical reference for the promotion and application of localized MBCP courses with pregnant women in China.
-
This study had some limitations. First, the participants were mainly pregnant women with a high education level. The proportions of the participants with a college education or higher were 84.1% and 76.7% in the intervention group and control group, respectively. We speculated that the effect of the mindfulness course may be related to the education level of the participants; people with a high education level may understand the content of the course better and, thus, be more sensitive to the intervention. We are not sure whether the 4-week simplified version of the MBCP course would have the same effect if the participants were pregnant women with a low education level. Second, we limited the inclusion criteria to primiparas. The levels of depression and anxiety are higher in primiparas[66]. Participants with mood disorders may be more sensitive to mindfulness interventions. These aspects of the study limit the extrapolation of its results. Third, our study did not assess whether the mindfulness intervention program affects maternal biomarkers.
-
The results of this study suggest that providing mindfulness training to women during pregnancy can effectively improve life satisfaction and reduce depression, anxiety, and FOC during pregnancy and postpartum. Our course has strengths in terms of the intervention effect on depression and FOC. The 4-week MBCP course for pregnant women in China appears to be an acceptable and effective maternal mental health intervention. However, whether the course can be widely promoted among pregnant women in China still needs to be evaluated by health economics.
-
Not applicable.
Benefits of Mindfulness Training on the Mental Health of Women During Pregnancy and Early Motherhood: A Randomized Controlled Trial
doi: 10.3967/bes2023.041
- Received Date: 2022-08-24
- Accepted Date: 2022-10-27
-
Key words:
- Mindfulness /
- Depression /
- Anxiety /
- Fear of childbirth /
- Life satisfaction /
- Randomized controlled trial
Abstract:
The authors declare that there are no competing interests.
The study protocol was approved by the Ethics Review Committee of the National Center for Women and Children’s Health (Chinese Center for Disease Control and Prevention, Beijing, China; Approval no. FY2020-10) and conducted in accordance with the ethical principles regarding human experimentation of the Declaration of Helsinki. All participants submitted signed informed consent before inclusion in the study. We promise that they can terminate their participation for any reason at any time.
Trial registration: Chinese Clinical Trial Registry (ChiCTR): ChiCTR2000033149 Date of the first registration: 24/05/ 2020.
| Citation: | WANG Shu Lei, SUN Meng Yun, HUANG Xing, ZHANG Da Ming, YANG Li, XU Tao, PAN Xiao Ping, ZHENG Rui Min. Benefits of Mindfulness Training on the Mental Health of Women During Pregnancy and Early Motherhood: A Randomized Controlled Trial[J]. Biomedical and Environmental Sciences, 2023, 36(4): 353-366. doi: 10.3967/bes2023.041 |




 Quick Links
 DownLoad:
