


-
Epidemiological studies suggest a global decline in male fertility, which accounts for approximately 50% of infertility cases in couples. Male infertility is a multifactorial and complex issue that may arise due to congenital, acquired, idiopathic, or other unknown factors [1]. Microcystins (MCs), a group of cyanobacterial toxins, have been positively detected in the serum samples of fishermen at Chaohu Lake (0.045–1.832 μg/L) [2] and Taihu Lake (0.1–0.64 μg/L) [3]. To date, MCs have been confirmed to trigger reproductive toxicity, according to a review by Zhang et al. [4]. Furthermore, an epidemiological investigation indicated that exposure to MC is associated with decreased semen quality, particularly reduced sperm motility [5]. However, the specific mechanisms responsible for the negative effects of MCs on sperm motility in both human and animal models are currently unknown.
Sperm motility is a critical parameter to evaluate the vitality and fertilizing potential of ejaculated spermatozoa. Epididymal and accessory sex gland secretions play crucial roles in sperm quality. Neutral α-glucosidase (NAG), which is excreted by the epididymis, has been reported to be vital for sperm maturation. Zinc is an important prostatic product involved in regulating the proteolytic activity of prostate-specific antigens. Fructose produced by seminal vesicles serves as a source of energy and fuel for the metabolism of sperm cells [6]. However, to our knowledge, there is no evidence regarding the function of these seminal plasma biochemical components in MC-induced male reproductive health. Therefore, we conducted a mediation effect analysis to investigate the roles of seminal plasma biochemical components and the effects of semen MCs on sperm motility and velocity. Given that these seminal plasma biochemical components are markers of the epididymis and accessory sex glands, this study will provide a new perspective on understanding how MCs affect male reproductive health.
In this research, the participants comprised a subset of subjects from an established cross-sectional study [5]. The criteria for selection were minimal: 1) 20–40 years old; 2) living for more than 3 years in Jiangsu or Anhui provinces, where cyanobacterial blooms occur frequently. From June 12, 2020 to January 19, 2021, 2,588 eligible men were recruited from the reproductive medical center, Affiliated Drum Tower Hospital of Nanjing University Medical School, Nanjing, and asked to complete a questionnaire. Men with self-reported inappropriate abstinence time (< 2 or > 7 days), a history of disease or surgery of the reproductive or urological system, and missing semen samples were excluded, leaving 1,715 men. Among them, 837 men who were included in the mediation effect analysis in this study underwent further examination of seminal plasma biochemical components. This study was approved by the Ethical Committee of Drum Tower Hospital, affiliated with Nanjing University Medical School, and all participants provided written consent.
Semen samples were provided by each participant by masturbation. Sperm motility and velocity were assessed using a BEION S3 computer-aided sperm analysis system (CASA; Beion Medical Technology, Shanghai, China). Seminal plasma was analyzed for the presence of zinc, NAG, citric acid, and fructose. The detection kits for these four seminal plasma biochemical components were purchased from Nanjing Xindi Biopharmaceuticals. The levels of semen MCs were examined using a direct competitive enzyme-linked immunosorbent assay kit (Beacon Analytical Systems Inc., ME, USA). The limit of detection of MCs was 0.1 μg/L. The average recovery was 90.2%, and the relative standard deviation was 13.1%. For measurements below the limit of detection, a random forest model was utilized to impute concentrations using Python (version 3.7).
The chi-square test was used to analyze the differences in the baseline information among the four groups, which were divided according to MC quartiles. The Spearman rank correlation was used to explore the relationship between potential confounders and sperm parameters and seminal plasma biochemical components. A multivariable linear regression model was used to calculate the associations between semen MCs, sperm parameters, and seminal plasma biochemical components. The levels of semen MCs were treated as continuous variables and divided into four groups based on quartiles. P for the trend was calculated by fitting the median concentrations of semen MCs in each quartile and entering them into the models as continuous variables. Differences in seminal plasma biochemical components/MCs between the normal and abnormal groups were assessed using the Mann-Whitney U test. To ensure the normality of the residuals and accuracy of the results, the concentrations of zinc, NAG, citric acid, and fructose were square-root transformed, whereas the levels of semen MCs were ln-transformed. All other parameters were left untransformed. A mediation analysis was conducted to assess the role of seminal plasma biochemical components in the relationship between semen MC levels and sperm motility or velocity. We further divided the study population into two groups based on age and conducted a stratified analysis. Statistical analyses were conducted using IBM PASW (SPSS version 20.0, IL, USA). All statistical tests were two-sided, and P < 0.05 was considered statistically significant.
Table 1 summarizes the characteristics of the 837 subjects. The participants were predominantly Han (99.5%), with 46.2% between 20 and 30 years old and 41.5% having a normal body mass index (BMI). All the subjects reported an abstinence period of 2–7 days, with 62.8% reporting 2–4 days. More than three-fourths of the men (78.4%) had received a senior high school or above education, and 56.5% were earning 50 thousand yuan or more/person/year. Over half of the men (57.1%) had never consumed alcohol, approximately half of the men (41.8%) were non-smokers, and 23.7% had never drunk caffeinated beverages. Few men had diabetes (0.6%) or hypertension (4.1%). We further summarized the characteristics according to quartiles of semen MCs; however, we did not find any substantial differences in the distribution of demographic characteristics across the different quartiles of MC exposure (Table 1).
Variablesa Overall Quartile of Semen MCs (μg/L) P-valueb Q1 (< 0.12) Q2 (0.12–0.15) Q3 (0.15–0.20) Q4 (> 0.20) Age (years) 0.159 20–30 387 (46.2) 100 (47.8) 89 (42.6) 109 (51.9) 89 (42.6) 31–40 450 (53.8) 109 (52.2 ) 120 (57.4) 101 (48.1) 120 (57.4) Body mass index (kg/m2) 0.736 Underweight (< 18.5) 22 (2.6) 6 (2.9) 8 (3.8) 6 (2.9) 2 (1.0) Normal (18.5–23.9) 347 (41.5) 92 (44.0) 80 (38.3) 91 (43.3) 84 (40.2) Overweight (24.0–27.9) 317(37.9) 72 (34.4) 83(39.7) 77 (36.7) 85 (40.7) Obese (≥ 28) 151 (18.0) 39 (18.7) 38 (18.2) 36 (17.1) 38 (18.2) Race 0.569 Han 833 (99.5) 208 (99.5) 208 (99.5) 210 (100) 207 (99.0) Others 4 (0.5) 1 (0.5) 1 (0.5) 0 (0.0) 2 (1.0) Abstinence time (days) 0.052 2–4 526 (62.8) 123 (58.9) 145 (69.4) 122 (58.1) 136 (65.1) 5–7 311 (37.2) 86 (41.1) 64 (30.6) 88 (41.9) 73 (34.9) Educational level 0.826 Junior and below 181 (21.6) 48 (23.0) 48 (23.0) 43 (20.5) 42 (20.1) Senior and above 656 (78.4) 161 (77.0) 161 (77.0) 167 (79.5) 167 (79.9) Income (¥/person/year) 0.806 20 thousand and below 130 (15.5) 35 (16.7) 30 (14.4) 34 (16.2) 31 (14.8) 20–50 thousand 234 (28.0) 61 (29.2) 63 (30.1) 50 (23.8) 60 (28.7) 50 thousand and above 473 (56.5) 113 (54.1) 116 (55.5) 126 (60.0) 118 (56.5) Smoking status 0.183 Current 402 (48.0) 107 (51.2) 98 (46.9) 88 (41.9) 109 (52.2) Never 350 (41.8) 88 (42.1) 86 (41.1) 95 (45.2) 81 (38.8) Ever 85 (10.2) 14 (6.7) 25 (12.0) 27 (12.9) 19 (9.1) Drinking status 0.264 Current 266 (31.8) 67 (31.9) 62 (29.5) 67 (31.9) 70 (33.5) Never 478 (57.1) 113 (53.8) 125 (59.5) 115 (54.8) 125 (59.8) Ever 93 (11.1) 29 (13.8) 22 (10.5) 28 (13.3) 14 (6.7) Tea/coffee consumption 0.654 Yes 639 (76.3) 162 (77.1) 153 (72.9) 161 (76.7) 163 (77.6) No 198 (23.7) 47 (22.4) 56 (26.7) 49 (23.3) 46 (21.9) Hypertension 0.667 Yes 34 (4.1) 6 (2.9) 8 (3.8) 11 (5.2) 9 (4.3) No 803 (95.9) 203 (96.7) 201 (95.7) 199 (94.8) 200 (95.2) Diabetes 0.528 Yes 5 (0.6) 1 (0.5) 2 (1.0) 0 (0.0) 2 (1.0) No 832 (99.4) 208 (99.5) 207 (99.0) 210 (100) 207 (99.0) Note. aData are given as n (percent). Q1, n = 209; Q2, n = 209; Q3, n = 210; Q4, n = 210. MCs, microcystins. bFrom chi-squared test. P < 0.05 was considered as statistically significant. Table 1. Characteristics for the study participants by quartile of Semen MCs (n = 837), n (%)
The distribution of sperm parameters, seminal plasma biochemical components, and semen MC levels are shown in Supplementary Table S1 (available in www.besjournal.com). In terms of sperm parameters, the median values of total motility, progressive motility, curvilinear velocity (VCL), straight-line velocity, average path velocity, the amplitude of lateral head displacement, linearity, wobble, and straightness were 52.50%, 40.30%, 43.20 μm/s, 19.60 μm/s, 23.20 μm/s, 2.30 μm, 44.50%, 53.00%, and 80.50%, respectively. The median values of zinc, NAG, citric acid, and fructose were 2.53 mmol/L, 19.67 U/L, 20.10 mmol/L, and 14.10 mmol/L, respectively. The detection rate of MCs in semen was 88.6%, with a mean of 0.16 μg/L, which suggested that MCs can enter human bodies and subsequently accumulate in reproductive organs via circulation, leading to adverse effects on the male reproductive system.
Outcomes Percent detected (%) Mean ± SD Median (25th, 75th) Range (Min–Max) Sperm motility parameters Total motility (%) 100 51.01 ± 19.07 52.50 (38.70, 65.05) 1.3–96.2 Progressive motility (%) 100 39.94 ± 17.50 40.30 (27.30, 52.85) 0–92.1 Sperm velocity parameters VCL (μm/s) 100 43.27 ± 8.76 43.20 (38.50, 48.35) 0–65.9 VSL (μm/s) 100 19.50 ± 4.64 19.60 (16.90, 22.20) 0–39.2 VAP (μm/s) 100 23.12 ± 4.82 23.20 (20.60, 25.90) 0–41.1 ALH (μm) 100 2.30 ± 0.56 2.30 (2.00, 2.60) 0–4.1 LIN (%) 100 44.74 ± 8.55 44.50 (40.10, 50.00) 0–73.0 WOB (%) 100 53.15 ± 8.09 53.00 (49.80, 57.80) 0–76.1 STR (%) 100 79.19 ± 10.22 80.50 (76.60, 84.20) 0–95.5 Biochemical components Zinc (mmol/L) 100 2.65 ± 1.17 2.53 (1.79, 3.41) 0.06–6.85 NAG (U/L) 100 22.27 ± 12.35 19.67 (14.01, 27.42) 0.08–101.22 Citric acid (mmol/L) 100 22.68 ± 14.26 20.10 (11.48, 30.77) 0.21–90.01 Fructose (mmol/L) 100 14.64 ± 7.00 14.10 (9.68, 19.10) 0–40 Semen MCsa (μg/L) 88.6 0.16 ± 0.07 0.16 (0.12, 0.20) < LOD to 0.62 Note. VCL, curvilinear velocity; VSL, straight-line velocity; VAP, average path velocity; ALH, amplitude of lateral head displacement; LIN, linearity; WOB, wobble; STR, straightness; NAG, neutral α-glucosidase; SD, standard deviation; Min, minimum; Max, maximum; MCs, microcystins; LOD, limit of detection. aThe limit of detection (LOD) of microcystins is 0.1 μg/L. The concentrations of MCs below the LOD were imputed with a random forest model. Table S1. Sperm parameters, seminal plasma biochemical components and semen MC levels of the study participants (n = 837)
Spearman rank correlations revealed that tea/coffee consumption was negatively correlated with total motility, age and educational level were positively correlated with velocity parameters, and abstinence time was negatively correlated with the straight-line velocity (Supplementary Table S2, available in www.besjournal.com). We also found that age, BMI, abstinence time, and smoking status were positively correlated with various seminal plasma biochemical components (Supplementary Table S3 available in www.besjournal.com). To determine the appropriate covariates for inclusion in the final multivariate models, we utilized the “change-in-estimate” method where a covariate was included if its inclusion resulted in a change of ≥ 10% in the regression coefficient [7]. Additionally, due to biological considerations, age, BMI, abstinence time, smoking, and drinking status were included in the final multivariate models.
Covariates Total motility Progressive motility VCL VSL VAP ALH LIN WOB STR Age −0.025 −0.007 0.069* 0.071* 0.073* 0.040 0.044 0.036 0.027 BMI −0.046 −0.052 −0.046 −0.041 −0.046 −0.043 −0.011 −0.008 −0.028 Race −0.028 −0.033 0.002 0.024 0.019 −0.038 0.035 0.033 0.039 Abstinence time 0.014 −0.003 −0.049 −0.081* −0.067 −0.046 −0.040 −0.025 −0.055 Educational level 0.039 0.053 0.080* 0.111** 0.110** 0.026 0.081* 0.083* 0.065 Income 0.005 0.006 0.019 0.019 0.016 −0.015 0.003 −0.003 0.006 Smoking status −0.048 −0.046 −0.057 0.002 −0.019 −0.056 0.043 0.037 0.002 Drinking status −0.016 −0.005 0.024 0.044 0.035 0.005 0.014 0.000 0.026 Tea/coffee consumption −0.068* −0.057 0.005 −0.044 −0.018 −0.011 −0.018 −0.037 0.001 Hypertension −0.010 −0.026 −0.044 −0.018 −0.018 −0.022 0.033 0.044 0.002 Diabetes 0.006 0.001 −0.023 −0.022 −0.023 −0.008 0.023 0.022 0.024 Note. Estimates calculated using Spearman correlation. VCL, curvilinear velocity; VSL, straight-line velocity; VAP, average path velocity; ALH, amplitude of lateral head displacement; LIN, linearity; WOB, wobble; STR, straightness; BMI, body mass index. *P < 0.05, **P < 0.01. Table S2. Spearman correlation coefficients between covariates and sperm motility, velocity parameters (n = 837)
Covariates Zinc NAG Citric acid Fructose Age 0.036 0.117** 0.063 0.010 BMI 0.069* 0.034 0.087* −0.051 Race 0.033 0.019 0.030 0.049 Abstinence time 0.036 0.077* 0.043 −0.012 Educational level 0.044 0.059 0.066 −0.039 Income −0.031 −0.031 −0.004 −0.005 Smoking status −0.026 −0.012 −0.039 0.124** Drinking status 0.016 0.014 −0.004 0.019 Tea/coffee consumption −0.013 0.015 −0.015 −0.013 Hypertension 0.016 −0.007 0.016 0.005 Diabetes −0.003 0.040 0.003 −0.005 Note. Estimates calculated using Spearman correlation. NAG, neutral α-glucosidase; BMI, body mass index. *P < 0.05, **P < 0.01. Table S3. Spearman correlation coefficients between covariates and seminal plasma biochemical components (n = 837)
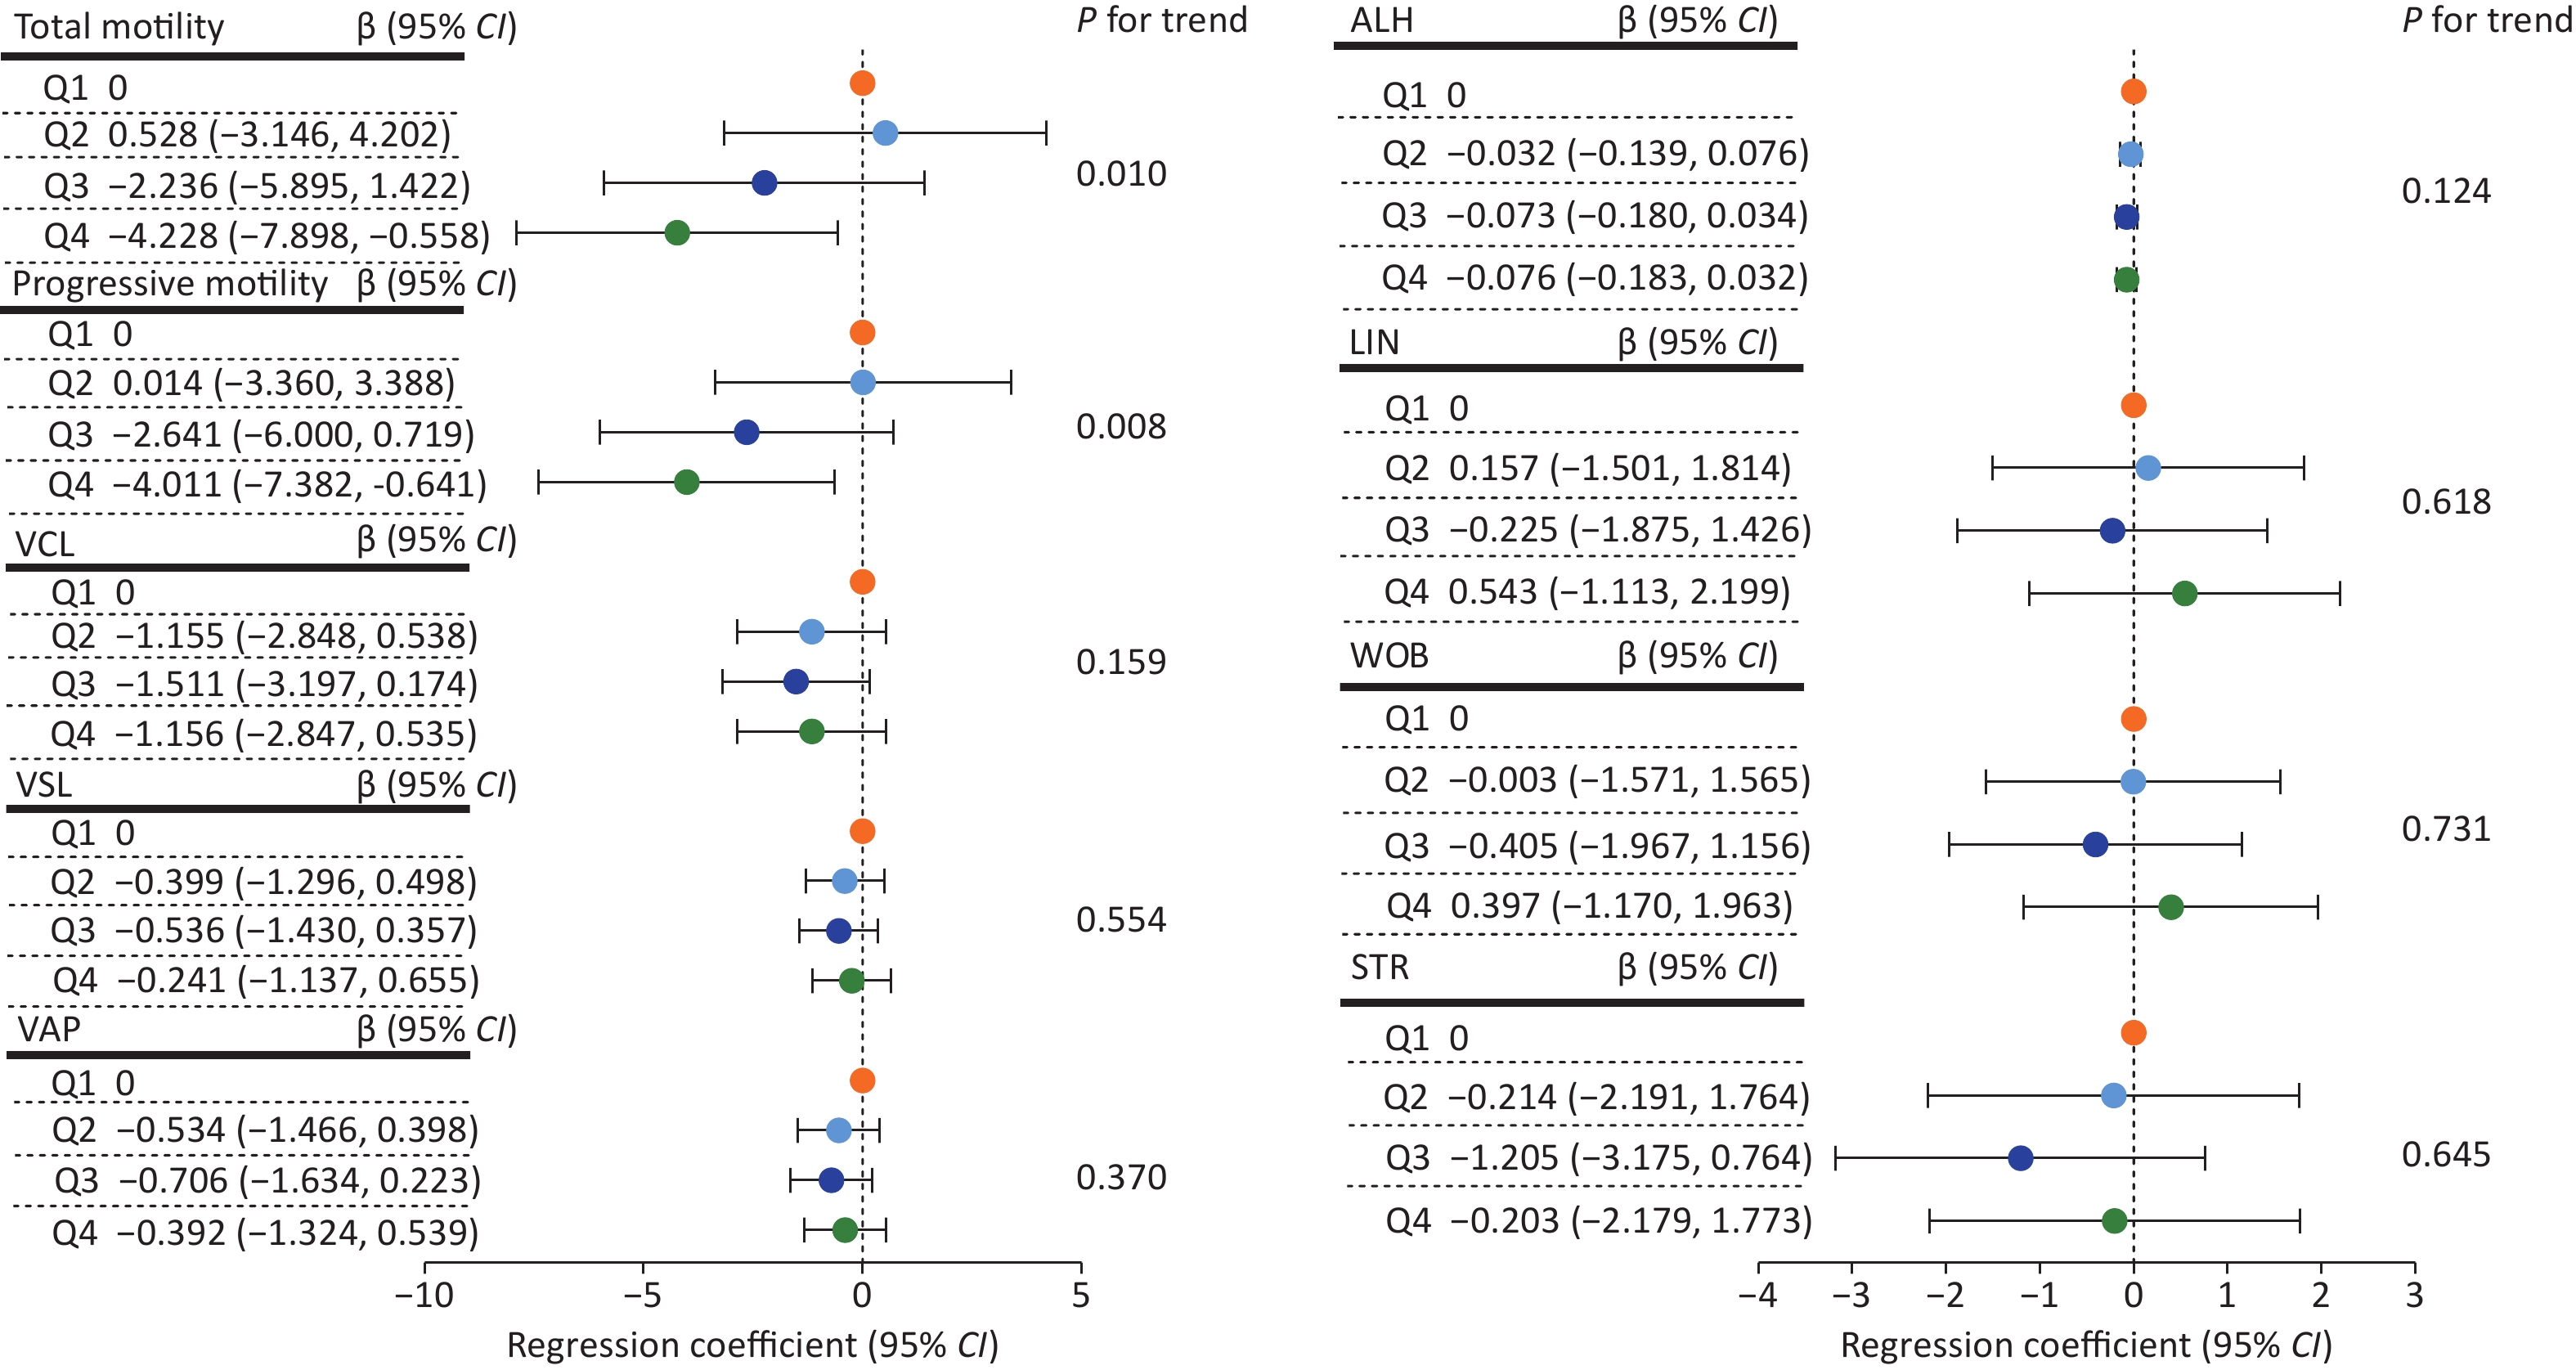
In the adjusted models, we found significant negative associations between semen MCs and total motility (β = −4.387; 95% CI: −7.458, −1.317), progressive motility (β = −4.428; 95% CI: −7.245, −1.612), and VCL (β = −1.481; 95% CI: −2.895, −0.068) (P < 0.05) (Table 2). Furthermore, we found a negative dose-related association between MC quartiles and total motility (P
for trend = 0.010) and progressive motility (P for trend = 0.008) (Supplementary Figure S1, available in www.besjournal.com). These results were similar to those in rodents where sperm motility was reduced following exposure to MC-leucine-arginine (MC-LR) [4]. Moreover, velocity parameters, such as VCL, were considerably decreased in MC-LR-exposed zebrafish [8]. Nevertheless, studies regarding the mechanisms underlying MC-induced poor sperm motility are limited. Sperm parameters Total motility Progressive motility VCL VSL VAP β (95% CI) −4.387
(−7.458, −1.317)−4.428
(−7.245, −1.612)−1.481
(−2.895, −0.068)−0.534
(−1.283, 0.215)−0.666
(−1.445, 0.113)P-value 0.005 0.002 0.040 0.162 0.094 Sperm parameters ALH LIN WOB STR β (95% CI) −0.086
(−0.175, −0.004)0.151
(−1.235, 1.536)0.162
(−1.149, 1.472)−0.431
(−2.085, 1.223)P-value 0.061 0.831 0.809 0.609 Seminal plasma biochemical components Zinc NAG Citric acid Fructose β (95% CI) −0.082
(−0.143, −0.021)−0.304
(−0.499, −0.109)−0.454
(−0.696, −0.213)0.075
(−0.083, 0.233)P-value 0.009 0.002 < 0.001 0.352 Note. Estimates calculated using multiple linear regression model. Age, BMI, abstinence time, smoking status and drinking status were included in the adjusted models. MCs, microcystins; CI, confidence interval; VCL, curvilinear velocity; VSL, straight-line velocity; VAP, average path velocity; ALH, amplitude of lateral head displacement; LIN, linearity; WOB, wobble; STR, straightness; NAG, neutral α-glucosidase; BMI, body mass index. azinc, NAG, citric acid and fructose were square root-transformed. MCs were ln-transformed. Other parameters were not transformed. bP < 0.05 was considered as statistically significant. Table 2. Adjusted regression coefficients [β (95% CI)] for changes in in-transformed MC levels (continuous) associated with sperm parameters and seminal plasma chemical components (n = 837)
Seminal plasma biochemical components could be considered clinical indicators of epididymis and accessory sex gland function, which regulate sperm motility [6]. Therefore, we explored the association between seminal plasma biochemical components and sperm parameters in this study. Here, NAG and citric acid were positively related to the total and progressive motility, which were statistically significant (P < 0.05), while fructose was negatively associated (P < 0.05). These results in our study, were consistent with those in other male populations [9, 10]. No relationship between zinc and sperm motility parameters was observed (Supplementary Table S4, available in www.besjournal.com). The collective data led us to speculate that MCs impaired the secretion of seminal plasma biochemical components, thereby decreasing sperm motility.
Outcomes Zinc P-valueb NAG P-value Citric acid P-value Fructose P-value Adjusted β (95% CI) Adjusted β (95% CI) Adjusted β (95% CI) Adjusted β (95% CI) Total motility 1.478
(−1.966, 4.921)0.400 2.936
(1.882, 3.991)< 0.001 1.047
(0.185, 1.909)0.017 −2.865
(−4.181, −1.549)< 0.001 Progressive motility 1.810
(−1.351, 4.971)0.261 2.423
(1.452, 3.395)< 0.001 1.183
(0.393, 1.973)0.003 −2.393
(−3.603, −1.182)< 0.001 VCL 1.092
(−0.489, 2.673)0.176 0.480
(−0.012, 0.972)0.056 0.798
(0.405, 1.192)< 0.001 −0.359
(−0.970, 0.251)0.249 VSL −0.692
(−1.528, 0.144)0.105 −0.350
(−0.610, −0.090)0.008 0.136
(−0.074, 0.346)0.204 0.244
(−0.079, 0.567)0.138 VAP −0.296
(−1.167, 0.575)0.505 −0.028
(−0.300, 0.243)0.838 0.254
(0.036, 0.472)0.022 0.023
(−0.313, 0.3600.893 ALH 0.129
(0.029, 0.230)0.011 0.067
(0.036, 0.098)< 0.001 0.050
(0.025, 0.075)< 0.001 −0.042
(−0.081, −0.003)0.034 LIN −2.067
(−3.607, −0.526)0.009 −0.908
(−1.386, −0.430)< 0.001 −0.329
(−0.717, 0.059)0.096 1.019
(0.425, 1.612)0.001 WOB −1.261
(−2.722, 0.201)0.091 −0.271
(−0.727, 0.184)0.243 −0.170
(−0.537, 0.197)0.364 0.595
(0.031, 1.159)0.039 STR −0.484
(−2.331, 1.363)0.607 −0.611
(−1.185, −0.037)0.037 0.057
(−0.406, 0.521)0.808 0.993
(0.283, 1.703)0.006 Note. Estimates calculated using multiple linear regression models adjusted for age, BMI, abstinence time, smoking status and drinking status. CI, confidence interval; NAG, neutral α-glucosidase; VCL, curvilinear velocity; VSL, straight-line velocity; VAP, average path velocity; ALH, amplitude of lateral head displacement; LIN, linearity; WOB, wobble; STR, straightness. aZinc, NAG, citric acid and fructose were square root-transformed. Other parameters were not transformed. bP < 0.05 was considered as statistically significant. Table S4. Regression coefficients [β (95% CI)] for changes in sperm motility and velocity parameters associated with seminal plasma biochemical components (n = 837)a
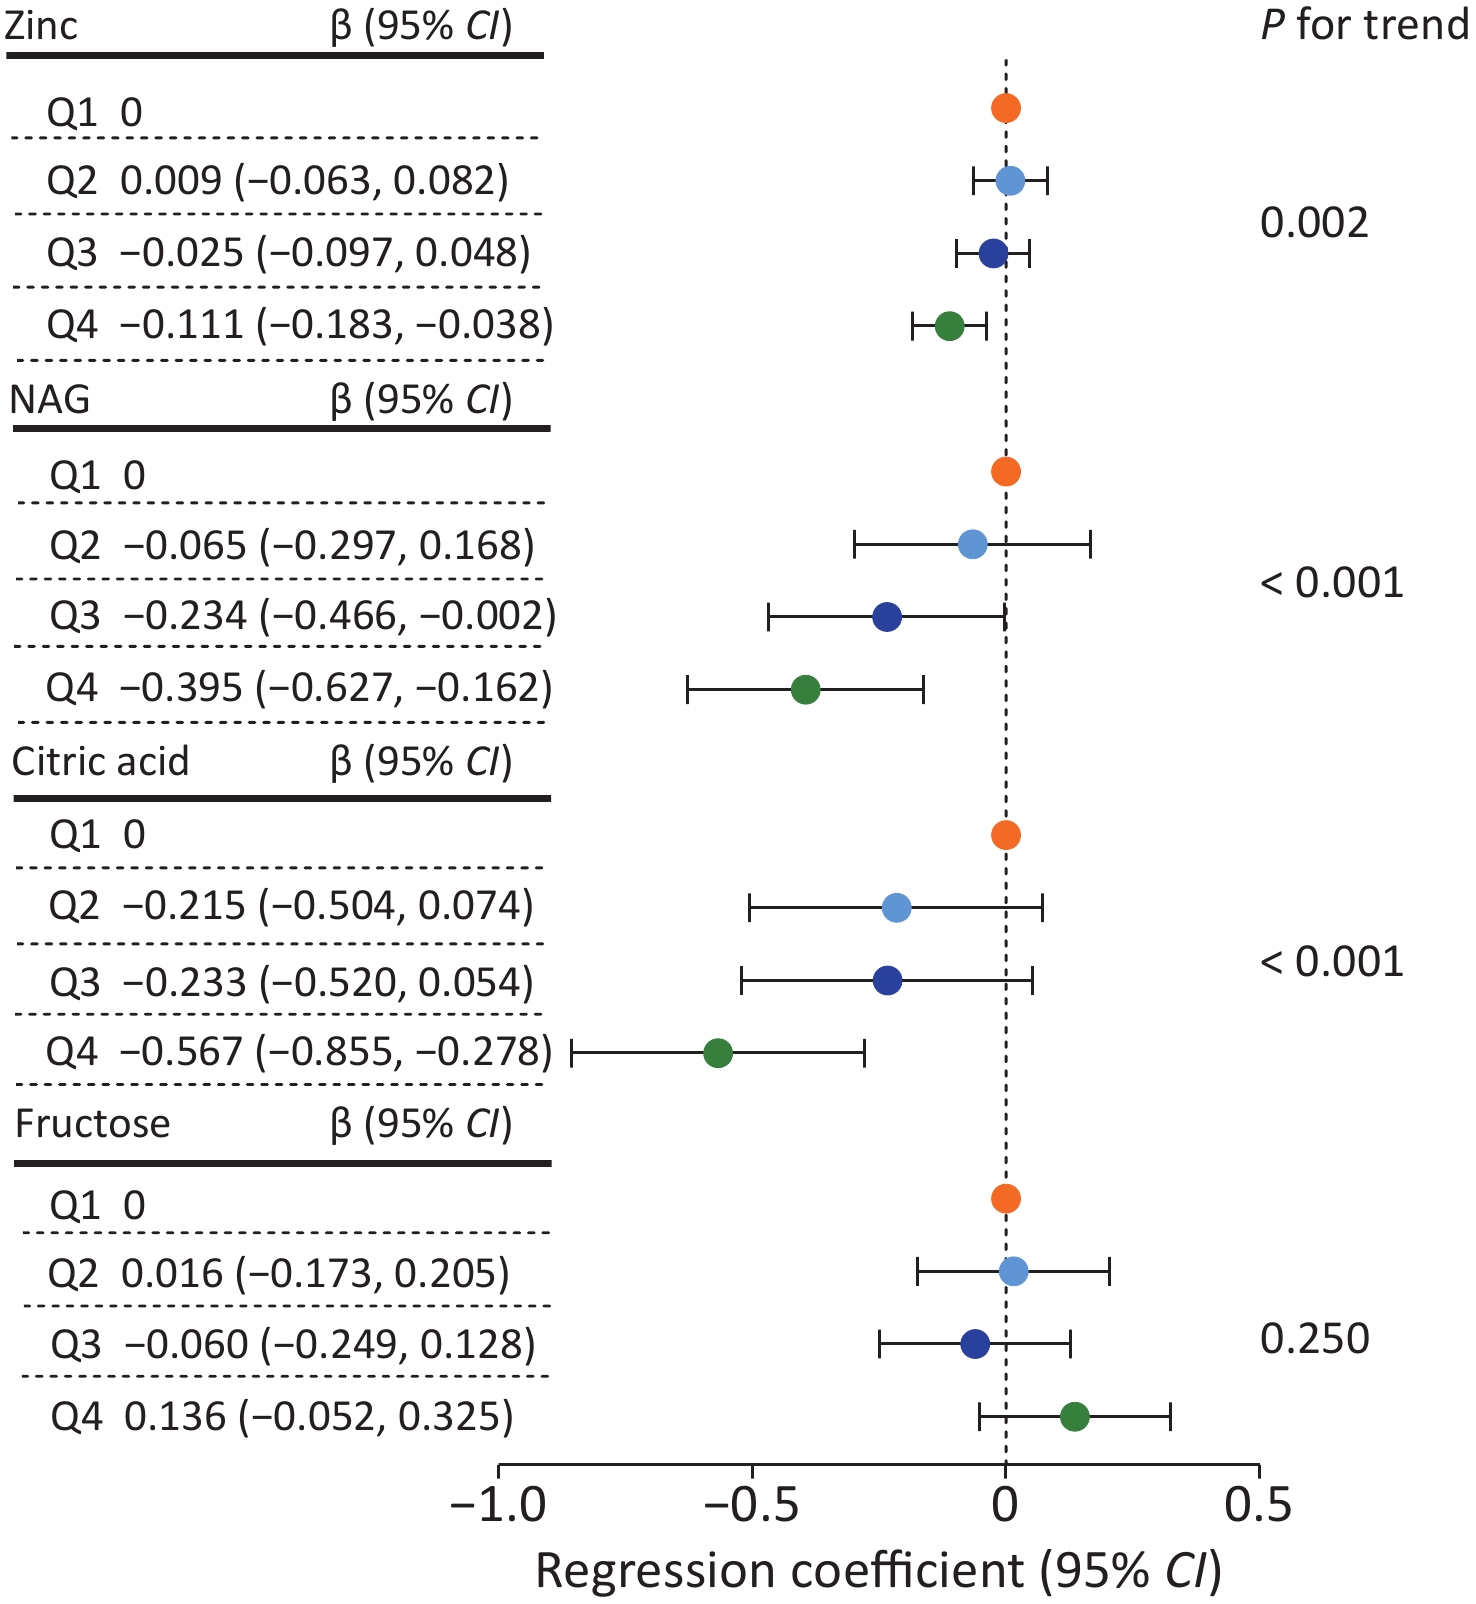
To uncover the underlying mechanisms, we further observed that MCs were negatively associated with zinc (β = −0.082; 95% CI: −0.143, −0.021), NAG (β = −0.304, 95% CI: −0.696, −0.213), and citric acid (β = −0.454; 95% CI: −0.696, −0.213). However, no association between MCs and fructose was observed (Table 2), implying that MCs might not exert toxicity on the seminal vesicles. Consistently, MC quartiles were found to be negatively associated with the three seminal plasma biochemical components (zinc, NAG, and citric acid) (P for trend < 0.01) (Supplementary Figure S2, available in www.besjournal.com). We further noticed that there were considerable differences in NAG and fructose levels between the normal and abnormal semen groups, but there was no difference in MCs between these groups (Supplementary Figure S3, available in www.besjournal.com). This suggests that there might be a relationship between MC exposure and the decreasing tendency of sperm motility, but not male infertility. However, this finding should be verified in a larger population.
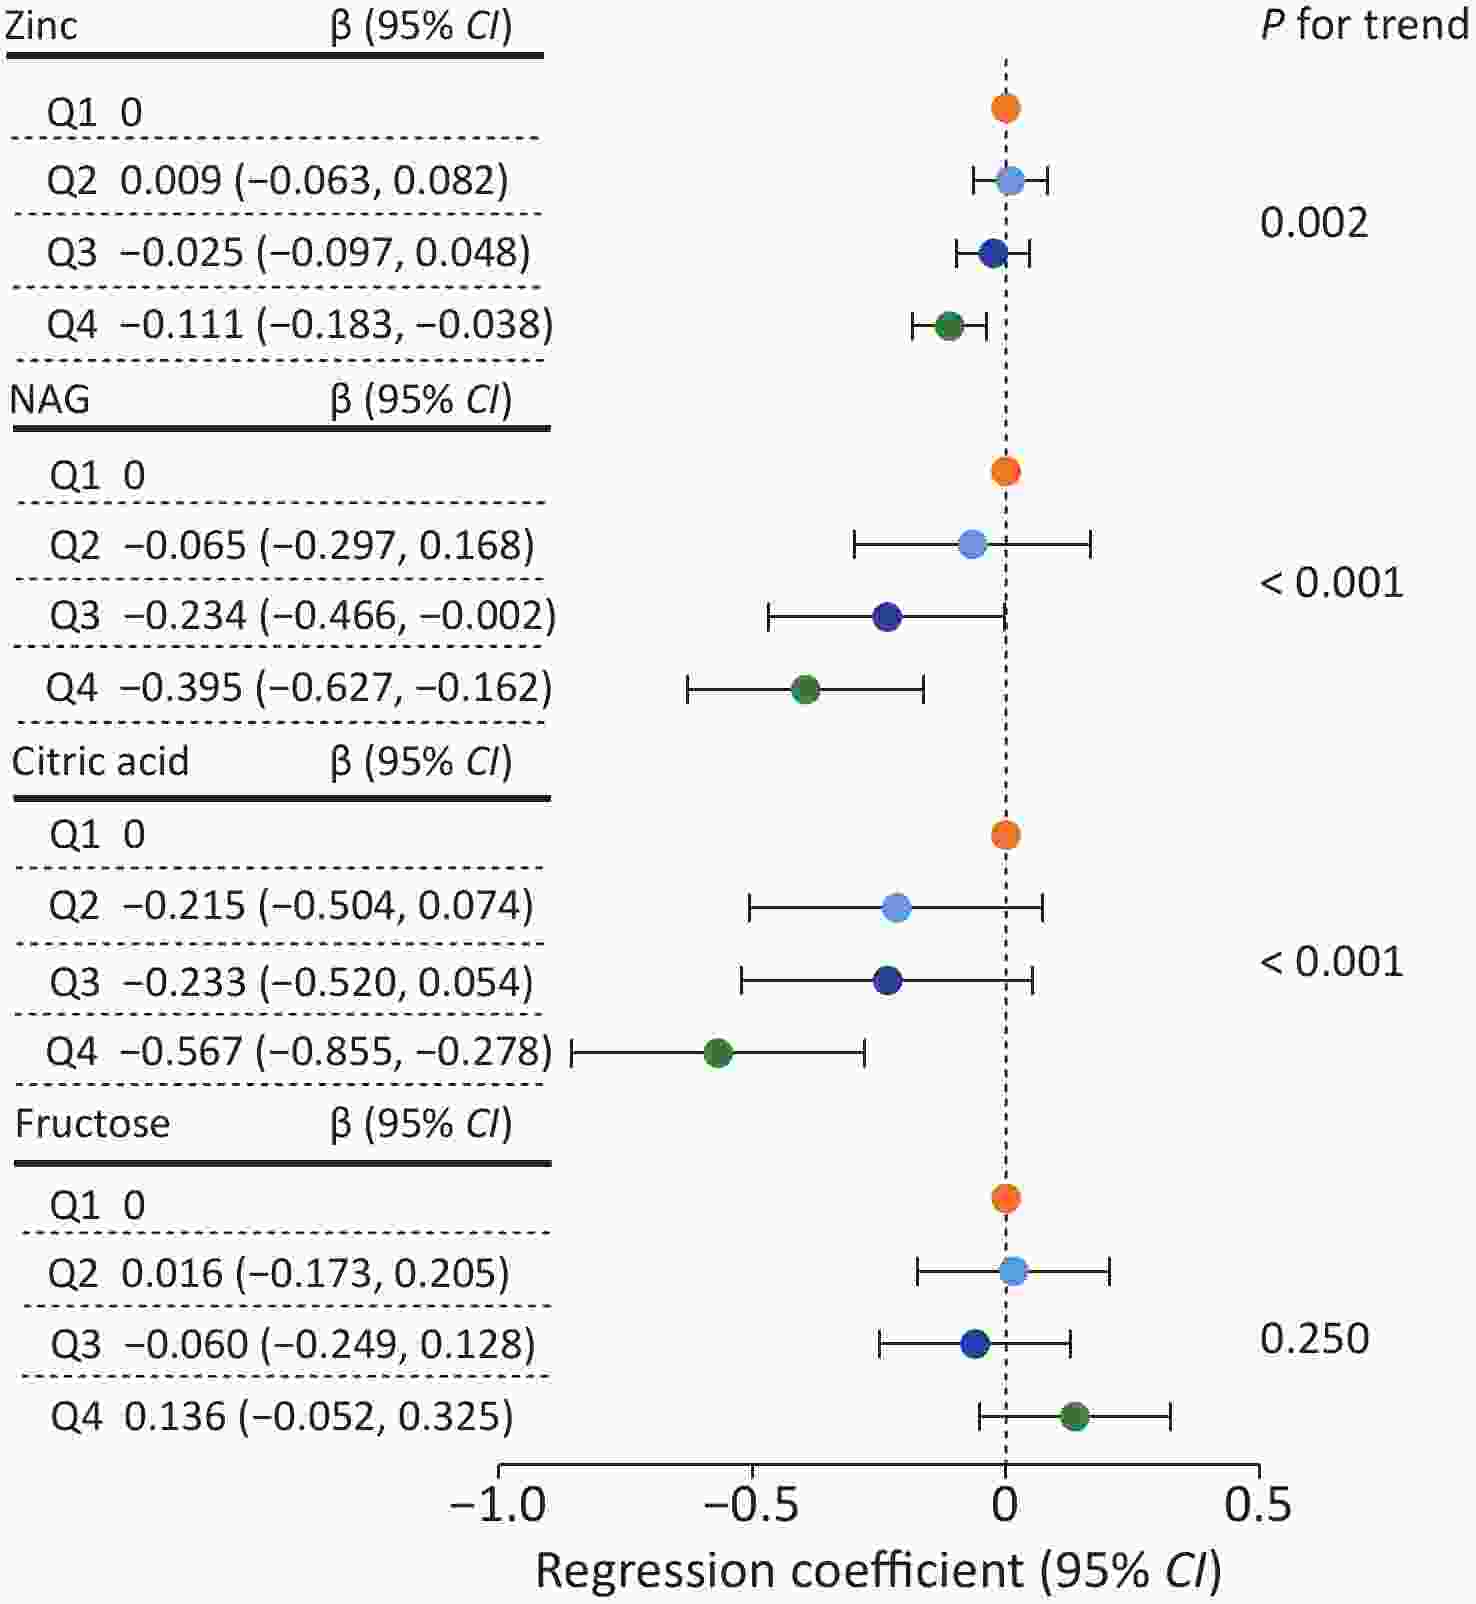
Figure S2. Regression Coefficients [β (95% CI)] for changes in seminal plasma biochemical components across MC quartiles (n = 837). First quartile (Q1) was used as a reference group. Multivariable linear regression models were adjusted for age, BMI, abstinence time, smoking and drinking status. Zinc, NAG, citric acid and fructose were square root-transformed. Semen MC levels were ln-transformed. Test for trend was performed by entering the median value of each quartile of semen MCs as a continuous variable in the models. CI, confidence interval; MCs, microcystins; BMI, body mass index; NAG, neutral α-glucosidase.
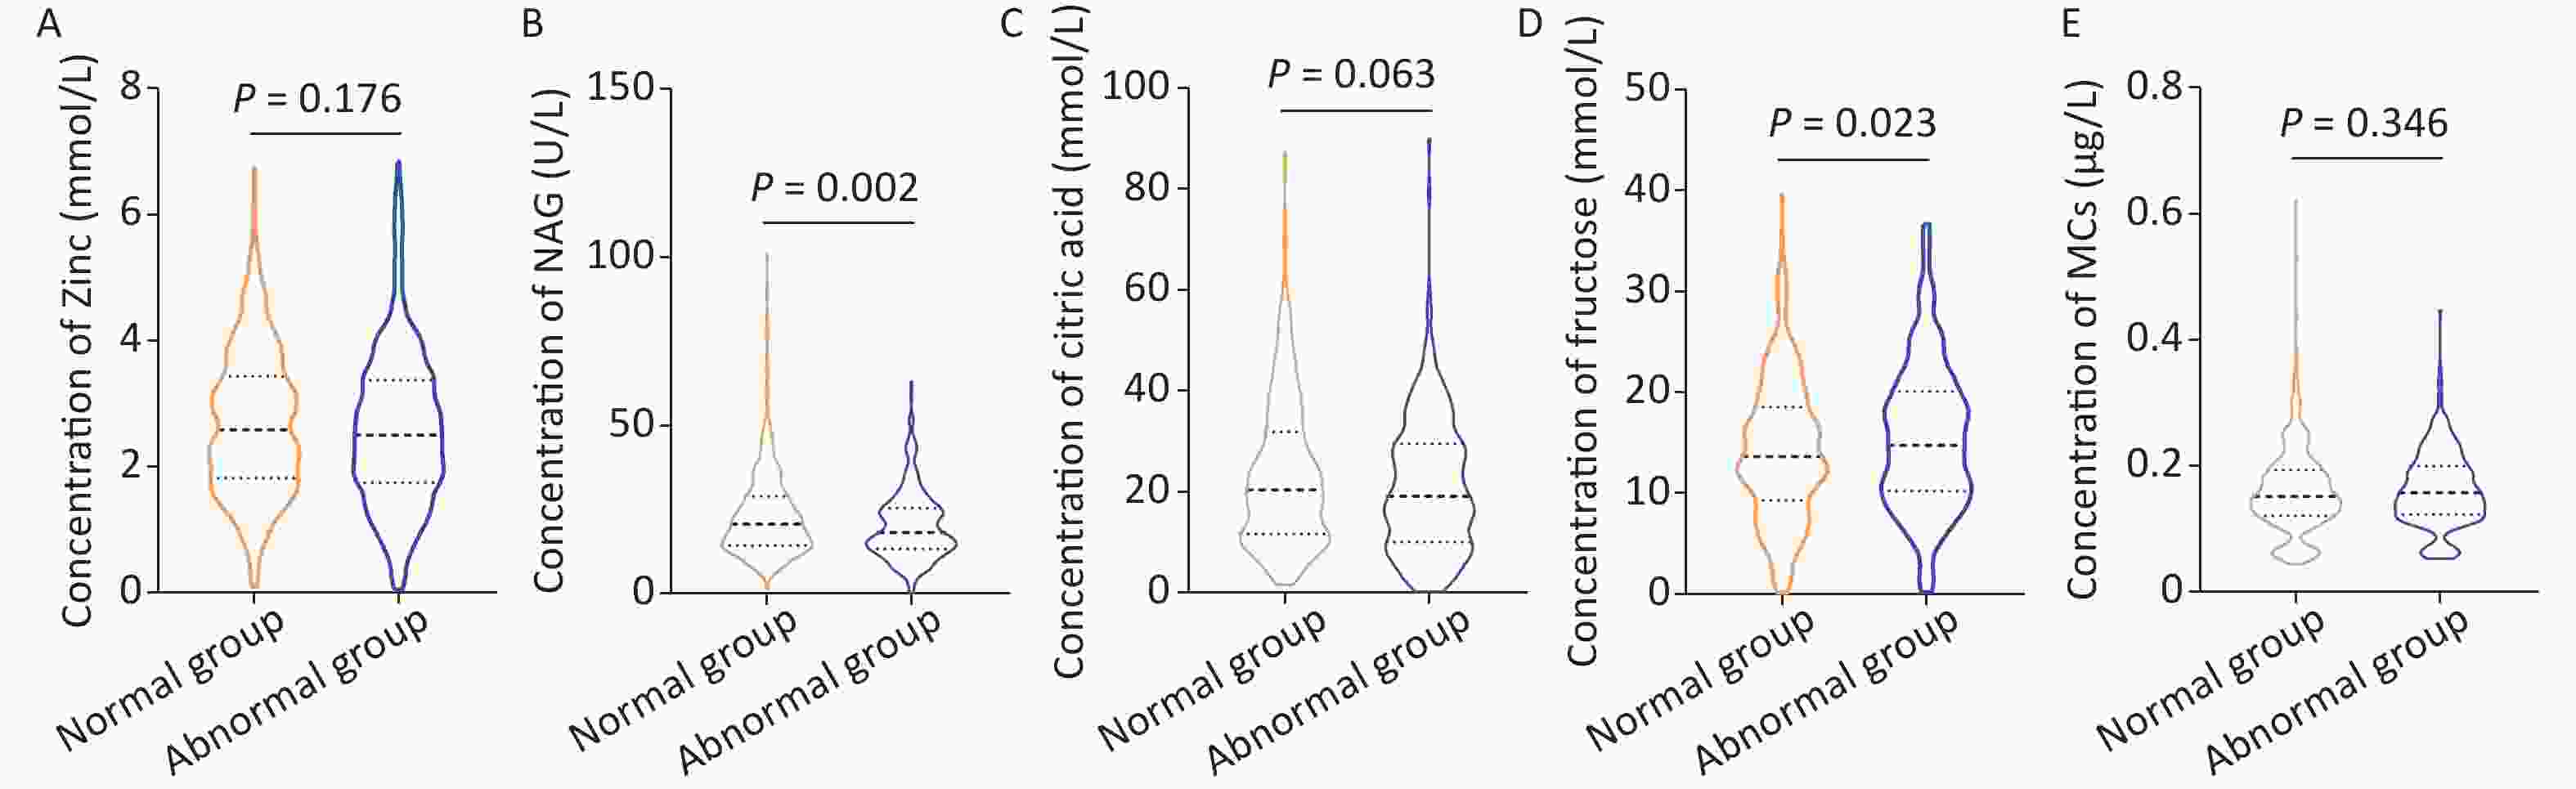
Figure S3. The concentrations of seminal plasma zinc (A), NAG (B), citric acid (C), fructose (D), and MCs (E) in normal group (n = 552) and abnormal group (n = 285). The abnormal semen quality parameters referred to the sperm concentration, count, total motility, and progressive motility lower than 15
$ \times $ 106/mL, 39$ \times $ 106/ejaculate, 40%, and 32%, respectively. When all the four parameters were higher than the WHO standards, the participant was assigned to the normal group or the participant was assigned to the abnormal group. Mann-Whitney U test was used to analyze the difference between the two groups. P-value < 0.05 was considered statistical significance. NAG, neutral α-glucosidase; MCs, microcystins.Semen MCs were observed to be related to biochemical components (NAG and citric acid) and sperm parameters (motility and VCL). Citric acid was associated only with sperm motility, whereas NAG was found to be associated with both sperm motility and VCL. Therefore, we further explored the mediation effect of NAG/citric acid in the relationship between semen MCs and sperm motility and velocity. After adjusting for the same set of confounders, we found that the mediated proportion of NAG in the associations between semen MCs and total and progressive motility was 19.4% and 15.7%, respectively. Citric acid was found to mediate 9.4% and 10.7% of the effects of semen MC exposure on total and progressive motility, respectively (Figure 1). Moreover, citric acid played a statistically significant role as a mediator in the association between MC exposure and VCL (Supplementary Figure S4, available in www.besjournal.com). Overall, we hypothesized that the negative effects of MC exposure on sperm motility might be partly due to post-testicular mechanisms involving epididymal and prostatic dysfunction induced by MCs. A previous systematic review reported that chronic MC-LR exposure induces prostatic toxicity, including prostatic hyperplasia and prostatitis [4]. However, the relationship between MC-LR-induced prostate impairment and decreased sperm motility has not yet been established. Presumably, there have been no animal studies on the effects of MCs on epididymal functions. Therefore, our inference should be further verified through toxicological studies.
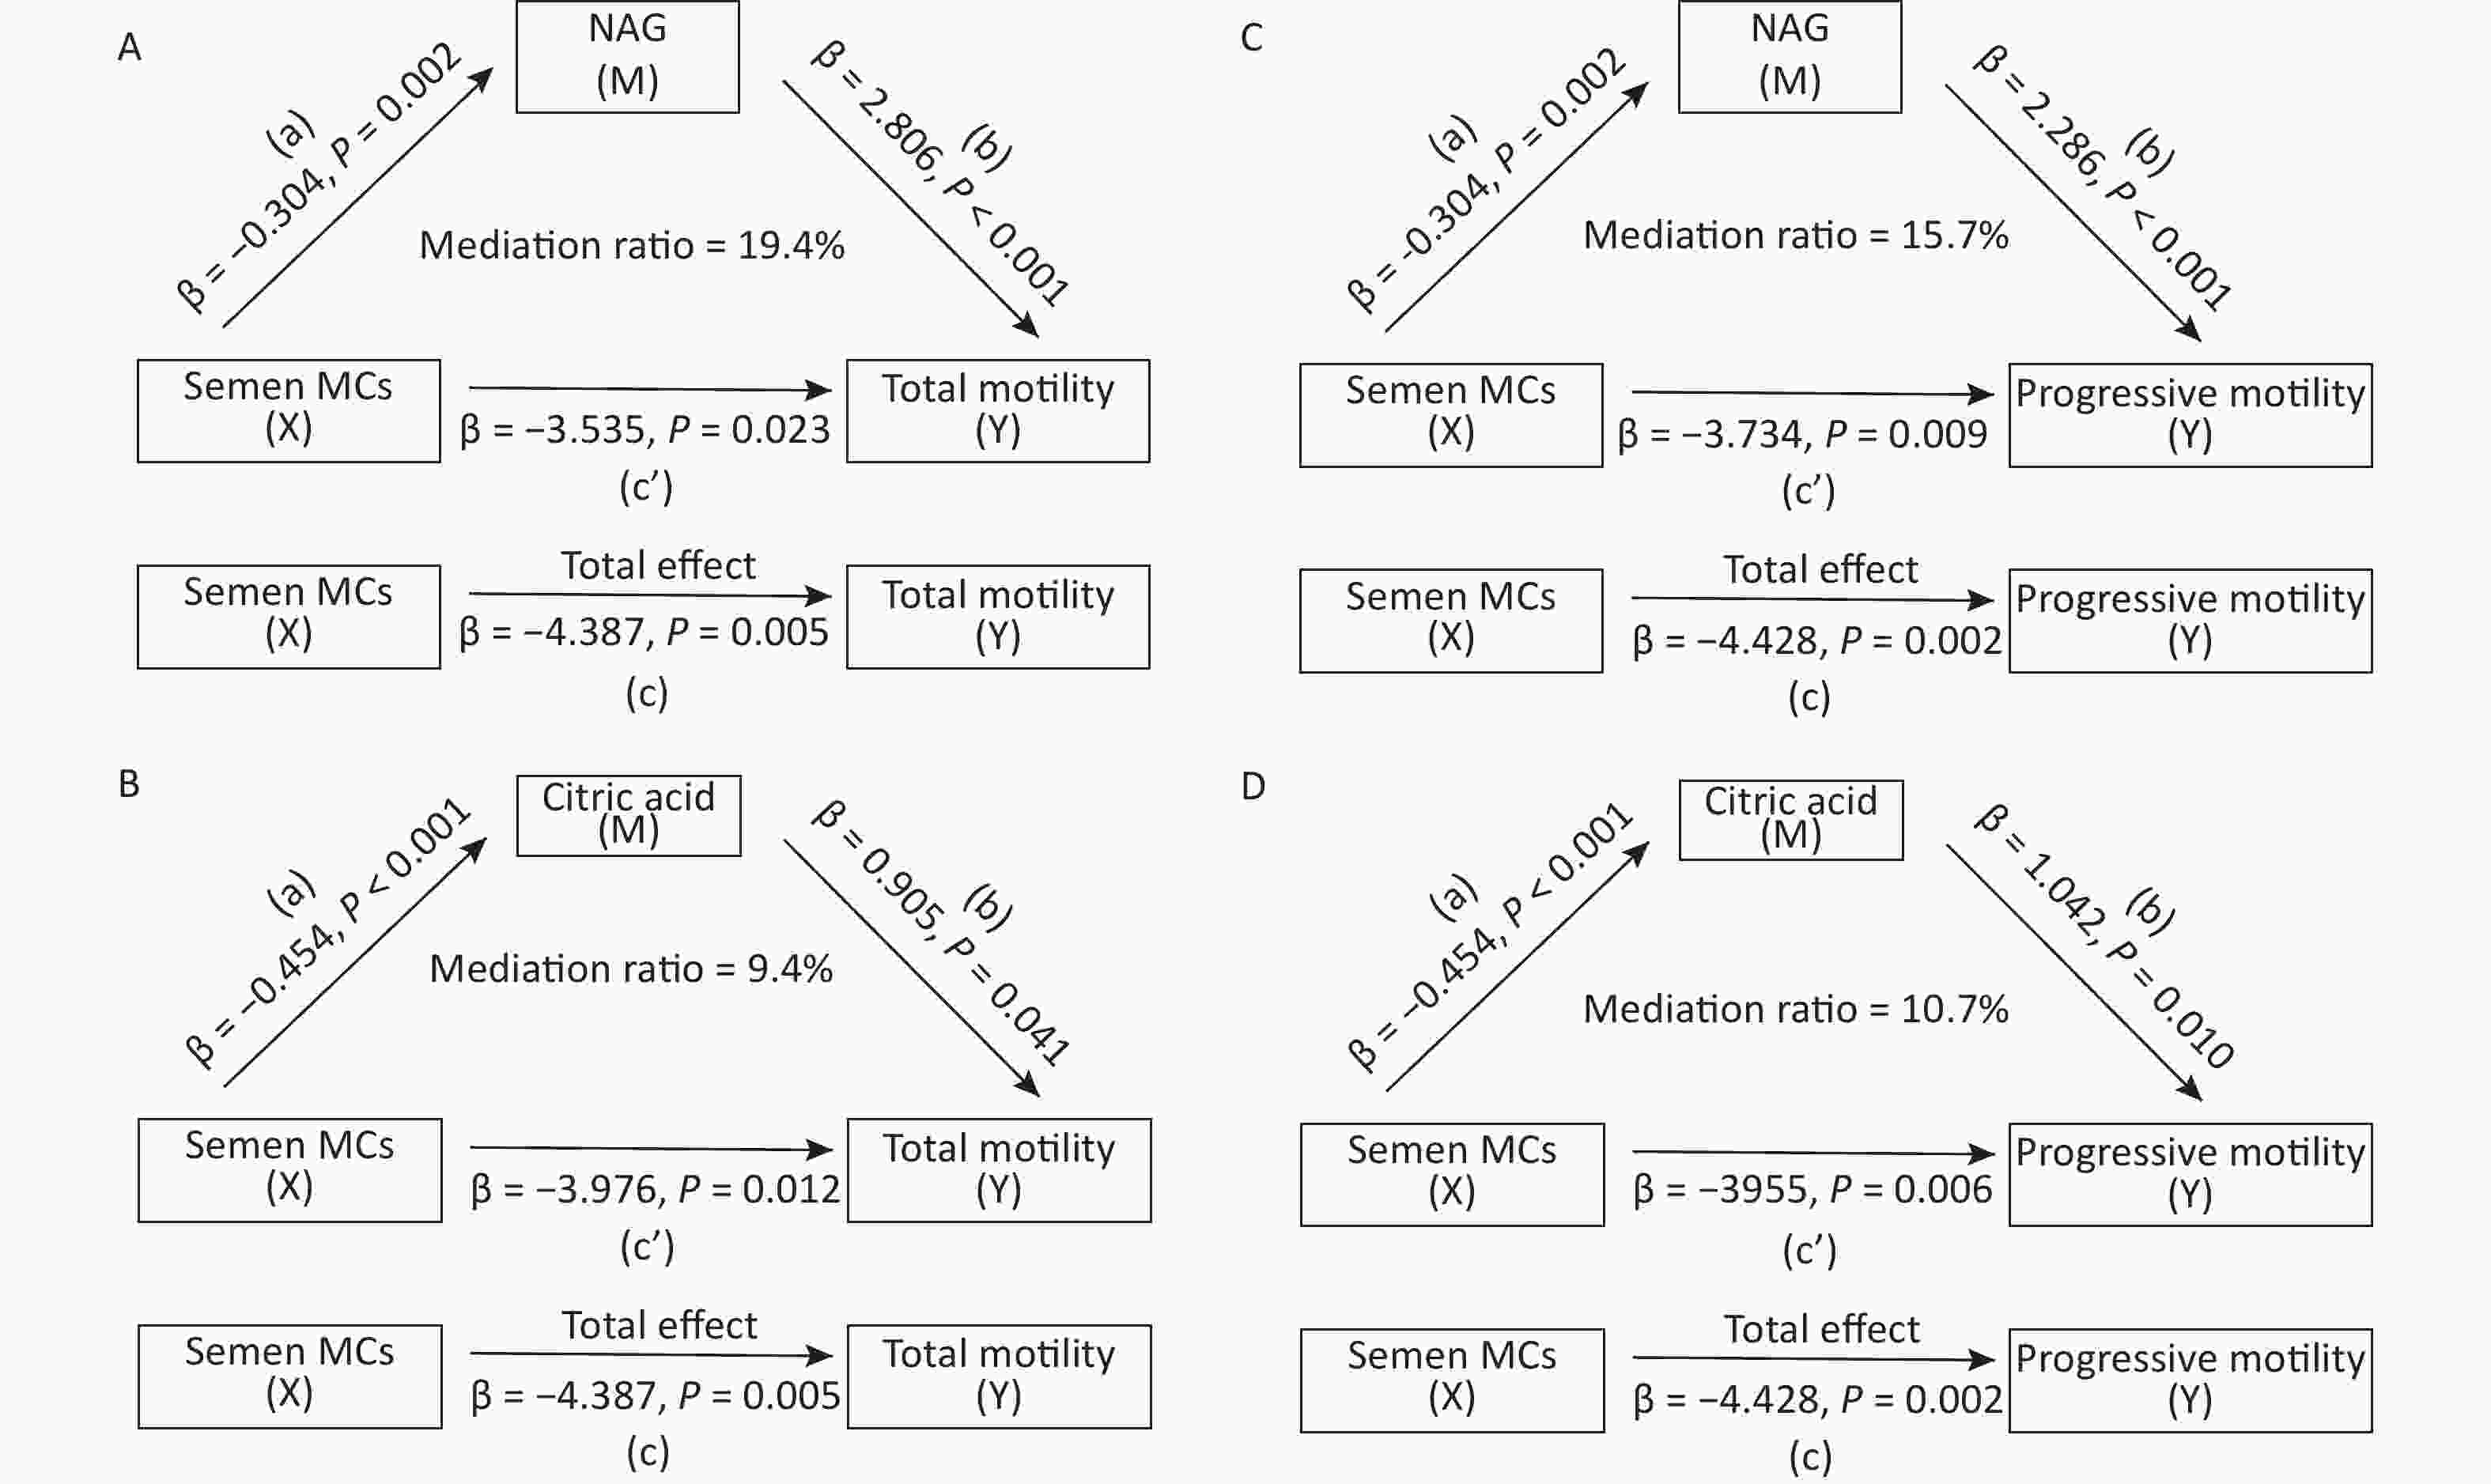
Figure 1. Mediation analysis models exploring the mediating roles of seminal plasma biochemical components in the associations between semen MC exposure and sperm motility (n = 837). Mediation analysis models were adjusted for age, BMI, abstinence time, smoking, and drinking status. Semen MC levels were ln-transformed. NAG (A, C) and citric acid (B, D) were square-root transformed. Other parameters were not transformed. a, the effect of semen MCs on seminal plasma biochemical components (NAG or citric acid); b, the effect of seminal plasma biochemical components on sperm motility parameters; c’, the direct effect of semen MCs on sperm motility parameters; c, the total effect of semen MCs on sperm motility parameters (c = a × b + c’). The mediation ratio was calculated as (a × b)/c. MCs, microcystins; BMI, body mass index; NAG, neutral α-glucosidase.
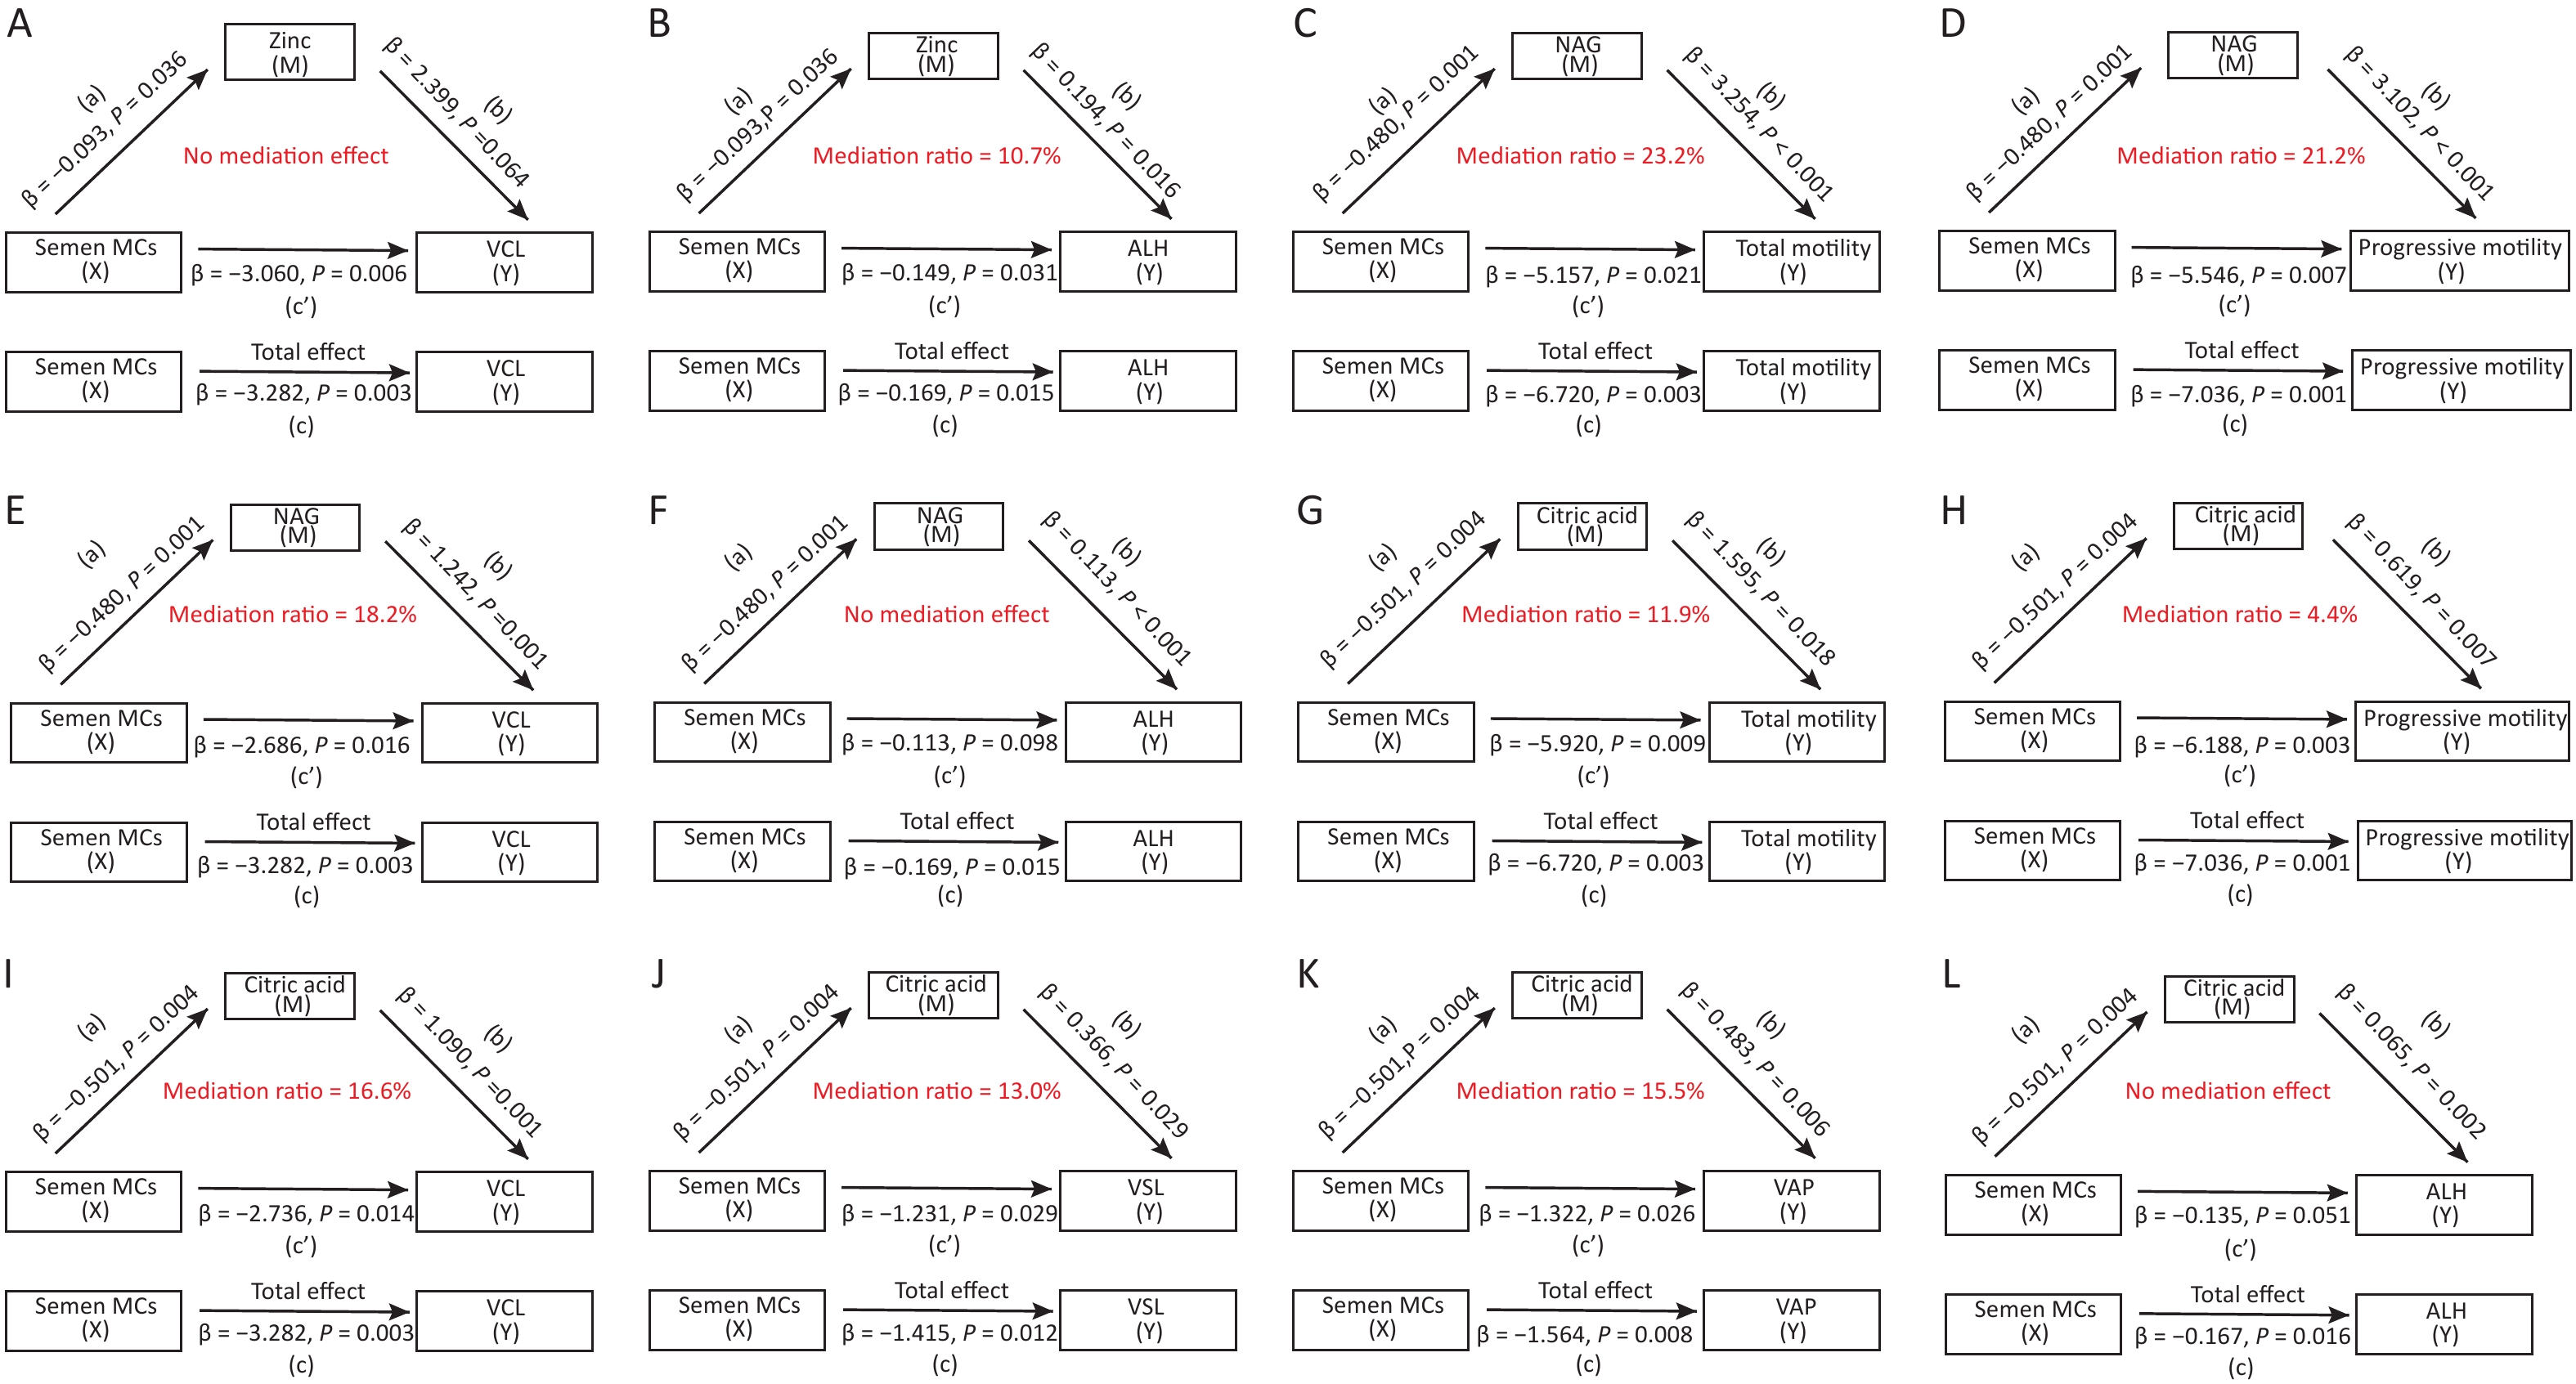
After stratification by age, we observed stronger relationships between MCs and various sperm parameters among participants aged 20–30 years, but no considerable associations were observed among those aged 31–40 years (Supplementary Table S5, available in www.besjournal.com). Four seminal plasma biochemical components were associated with various sperm parameters; however, the strength of the associations differed between the two subgroups (Supplementary Table S6, available in www.besjournal.com). Furthermore, among those aged between 20–30 years, zinc was found to mediate 10.7% of the effects of MCs on the amplitude of lateral head displacement, and NAG/citric acid showed a stronger mediation effect in the relationship between MC exposure and sperm motility or velocity (Supplementary Figure S5, available in www.besjournal.com). Taken together, these results suggest that the adverse effects of MCs on reproductive health among young males should be given more attention.
Outcomes Semen MC levels Age: 20–30 (n = 387) P-valueb Age: 31–40 (n = 450) P-value Adjusted β (95% CI) Adjusted β (95% CI) Motility parameters Total motility −6.720 (−11.129, −2.310) 0.003 −2.340 (−6.659, 1.978) 0.287 Progressive motility −7.036 (−11.119, −2.953) 0.001 −2.296 (−6.220, 1.629) 0.251 Velocity parameters VCL −3.282 (−5.458, −1.107) 0.003 −0.081 (−1.938, 1.777) 0.932 VSL −1.415 (−2.511, −0.318) 0.012 0.116 (−0.922, 1.155) 0.826 VAP −1.564 (−2.721, −0.407) 0.008 −0.010 (−1.073, 1.052) 0.985 ALH −0.167 (−0.303, −0.032) 0.016 −0.024 (−0.145, 0.097) 0.695 LIN −0.460 (−2.540, 1.621) 0.664 0.599 (−1.297, 2.496) 0.535 WOB −0.232 (−2.232, 1.768) 0.820 0.423 (−1.343, 2.190) 0.638 STR −1.562 (−4.134, 1.010) 0.233 0.402 (−1.786, 2.589) 0.718 Biochemical components Zinc −0.093 (−0.179, −0.006) 0.036 −0.073 (−0.159, 0.013) 0.097 NAG −0.480 (−0.766, −0.194) 0.001 −0.177 (−0.447, 0.093) 0.198 Citric acid −0.501 (−0.838, −0.164) 0.004 −0.425 (−0.769, −0.081) 0.016 Fructose 0.055 (−0.175, 0.286) 0.637 0.094 (−0.126, 0.314) 0.401 Note. Estimates calculated using multiple linear regression models adjusted for BMI, abstinence time, smoking status and drinking status. Stratified analysis divided age into two groups. MC, microcystin; CI, confidence interval; VCL, curvilinear velocity; VSL, straight-line velocity; VAP, average path velocity; ALH, amplitude of lateral head displacement; LIN, linearity; WOB, wobble; STR, straightness; NAG, neutral α-glucosidase. azinc, NAG, citric acid and fructose were square root-transformed. MCs were ln-transformed. Other parameters were not transformed. bP < 0.05 was considered as statistically significant. Table S5. Stratified analysis for the association between ln-transformed MC levels and sperm motility, velocity parameters and seminal plasma chemical components by stratification of agea
Age Outcomes Zinc P-valueb NAG P-value Citric acid P-value Fructose P-value Adjusted β (95% CI) Adjusted β (95% CI) Adjusted β (95% CI) Adjusted β (95% CI) 20–30 Total motility 3.935
(−1.237, 9.107)0.135 3.635
(2.116, 5.154)< 0.001 1.880
(0.567, 3.194)0.005 −3.803
(−5.730, −1.877)< 0.001 Progressive motility 4.372
(−0.426, 9.170)0.074 3.481
(2.071, 4.890)< 0.001 1.979
(0.762, 3.197)0.002 −3.295
(−5.090, −1.499)< 0.001 VCL 2.783
(0.240, 5.326)0.032 1.398
(0.639, 2.157)< 0.001 1.208
(0.565, 1.852)< 0.001 −0.417
(−1.386, 0.552)0.398 VSL 0.335
(−0.950, 1.620)0.608 −0.015
(−0.403, 0.372)0.938 0.421
(0.094, 0.747)0.012 0.288
(−0.198, 0.775)0.245 VAP 0.771
(−0.584, 2.126)0.264 0.361
(−0.047, 0.768)0.083 0.541
(0.198, 0.884)0.002 0.069
(−0.446, 0.583)0.793 ALH 0.213
(0.055, 0.371)0.008 0.120
(0.073, 0.166)< 0.001 0.071
(0.031, 0.111)0.001 −0.060
(−0.120, 0.000)0.049 LIN −0.714
(−3.132, 1.705)0.562 −0.878
(−1.602, −0.153)0.018 0.058
(−0.562, 0.677)0.855 1.371
(0.465, 2.278)0.003 WOB 0.055
(−2.270, 2.381)0.963 −0.261
(−0.962, 0.440)0.465 0.194
(−0.401, 0.790)0.521 1.004
(0.128, 1.880)0.025 STR 1.518
(−1.474, 4.510)0.319 −0.265
(−1.164, 0.634)0.562 0.540
(−0.225, 1.305)0.166 1.398
(0.271, 2.525)0.015 31–40 Total motility −0.384
(−5.058, 4.290)0.872 2.338
(0.856, 3.820)0.002 0.456
(−0.712, 1.624)0.443 −2.215
(−4.046, −0.384)0.018 Progressive motility −0.084
(−4.333, 4.165)0.969 1.541
(0.187, 2.896)0.026 0.630
(−0.431, 1.690)0.244 −1.710
(−3.377, −0.043)0.044 VCL −0.212
(−2.228, 1.803)0.836 −0.288
(−0.933, 0.358)0.381 0.499
(−0.003, 1.000)0.051 −0.207
(−1.001, 0.587)0.609 VSL −1.523
(−2.637, −0.410)0.007 −0.615
(−0.970, −0.259)0.001 −0.077
(−0.358, 0.203)0.588 0.276
(−0.166, 0.718)0.220 VAP −1.171
(−2.314, −0.027)0.045 −0.350
(−0.717, 0.016)0.061 0.032
(−0.256, 0.319)0.829 0.063
(−0.389, 0.516)0.783 ALH 0.064
(−0.066, 0.194)0.335 0.022
(−0.019, 0.064)0.290 0.033
(0.001, 0.066)0.044 −0.022
(−0.073, 0.029)0.398 LIN −3.174
(−5.203, −1.145)0.002 −0.887
(−1.539, −0.235)0.008 −0.614
(−1.123, −0.104)0.018 0.790
(−0.015, 1.595)0.054 WOB −2.374
(−4.272, −0.477)0.014 −0.255
(−0.867, 0.357)0.412 −0.457
(−0.933, 0.019)0.060 0.333
(−0.419, 1.086)0.384 STR −1.966
(−4.324, 0.392)0.102 −0.840
(−1.594, −0.085)0.029 −0.259
(−0.849, 0.332)0.390 0.708
(−0.222, 1.638)0.135 Note. Estimates calculated using multiple linear regression models adjusted for BMI, abstinence time, smoking status and drinking status. Stratified analysis divided age into two groups. CI, confidence interval; VCL, curvilinear velocity; VSL, straight-line velocity; VAP, average path velocity; ALH, amplitude of lateral head displacement; LIN, linearity; WOB, wobble; STR, straightness; NAG, neutral α-glucosidase. azinc, NAG, citric acid and fructose were square root-transformed. Other parameters were not transformed. bP < 0.05 was considered as statistically significant. Table S6. Stratified analysis for the association between seminal plasma biochemical components and sperm motility and velocity parameters by stratification of agea
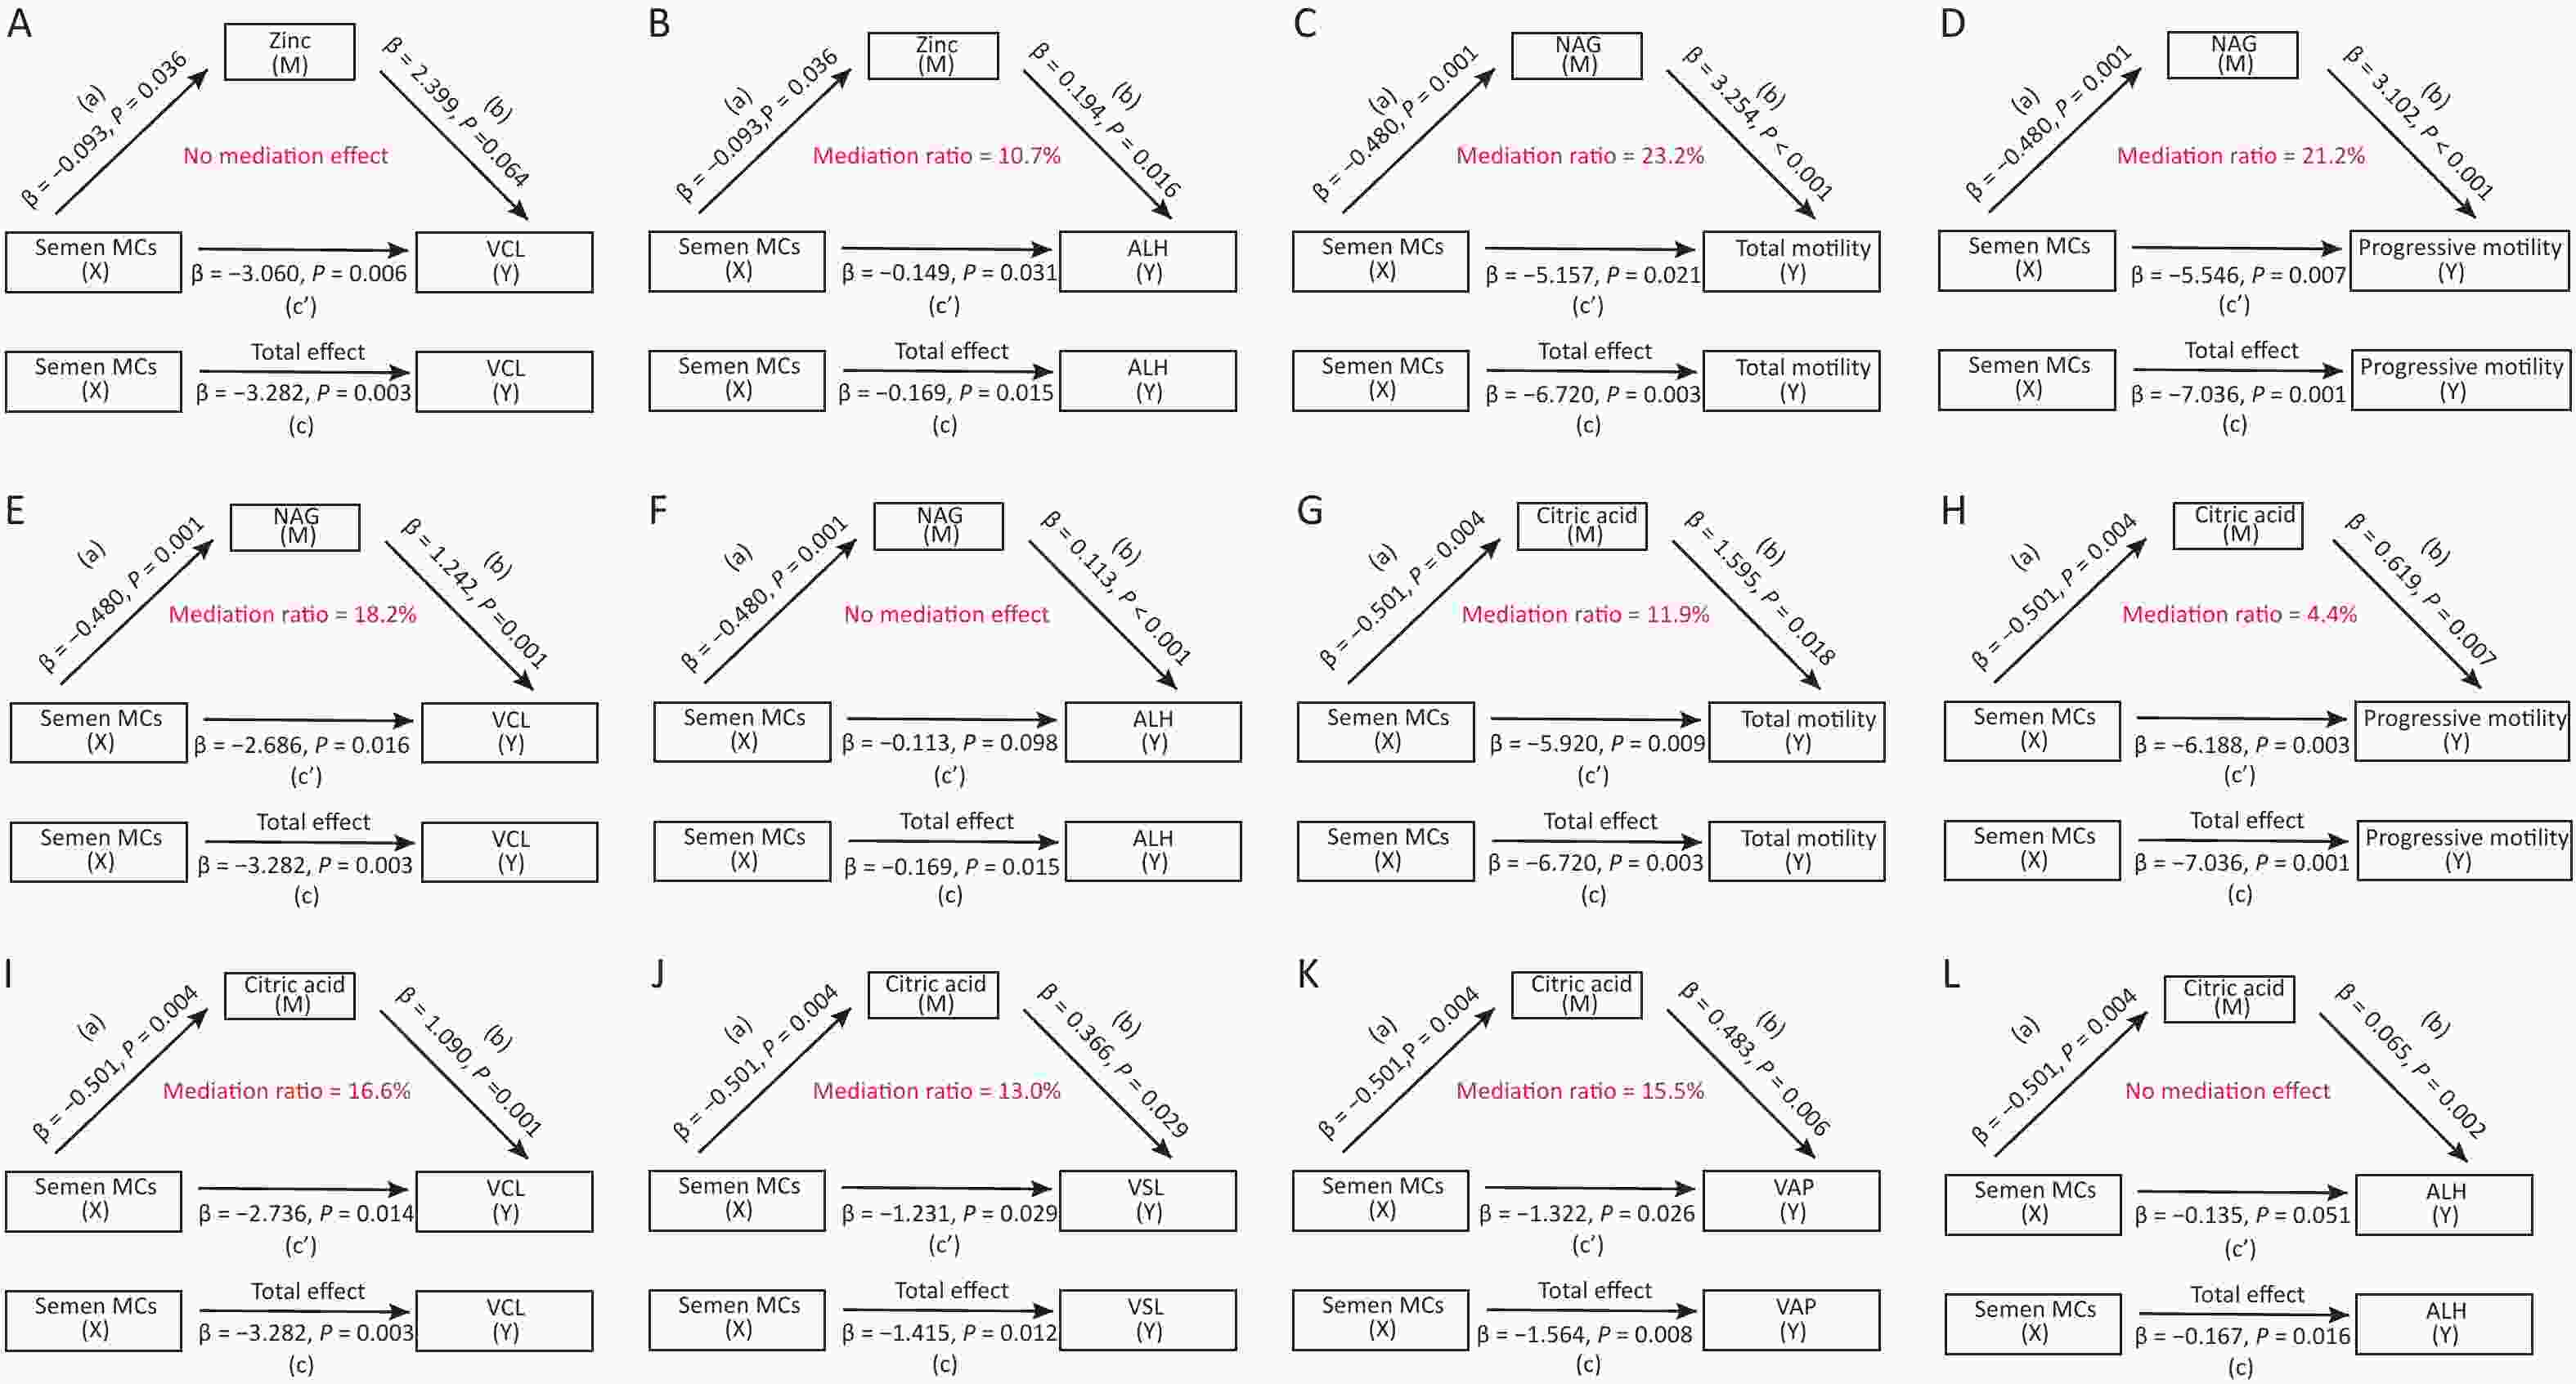
Figure S5. Mediation analysis model exploring the mediation effects of seminal plasma biochemical components in the effects of semen MCs on sperm motility and velocity parameters in the population aged from 20 to 30 years. Mediation analysis models were adjusted for BMI, abstinence time, smoking and drinking status. Semen MC levels were ln-transformed. Zinc, NAG and citric acid were square root-transformed. Other parameters were not transformed. a) the effect of semen MCs on seminal plasma biochemical components; b) the effect of seminal plasma components on sperm motility or velocity parameters; c’) the direct effect of semen MCs on sperm motility or velocity parameters; c) the total effect of semen MCs on sperm motility or velocity parameters (c = a × b + c’). The mediation ratio was calculated as (a × b)/c. MCs, microcystins; BMI, body mass index; NAG, neutral α-glucosidase; VCL, curvilinear velocity; ALH, amplitude of lateral head displacement; VSL, straight-line velocity; VAP, average path velocity.
The strengths of the present study were as follows: Semen MCs were used as the internal biomarkers of MC exposure, which had the potential to reflect the precise MC levels in the male reproductive system from all sources and routes, to explore the association between MC exposure and male reproductive health. In addition, a relatively large population was recruited based on strict exclusion criteria to reduce bias.
However, our study had several limitations. First, owing to the cross-sectional design, we could not rule out the possibility of a temporal relationship being formed between MCs, sperm parameters, and seminal plasma biochemical components due to a single semen sample, which may vary over time. Second, we did not consider the impact of potential exposure to other environmental pollutants. Third, we did not consider the interaction between covariates and their association with the effects of MCs on male semen quality. Finally, the participants in this study were recruited from a reproductive medical center, which might not represent the general population.
Reportedly, this is the first epidemiological study to reveal the potential roles of seminal plasma biochemical components and their adverse effects on male sperm motility following MC exposure. We found that NAG and critic acid showed substantial mediating effects on the association between MC exposure and poor sperm motility. Given that NAG is a marker of epididymal function and citric acid is a marker of prostatic function, this study offers novel ways to elucidate the potential roles of the epididymis and accessory sex glands in the effects of MCs on male sperm motility. However, further toxicological studies are required to elucidate the underlying mechanisms.
-
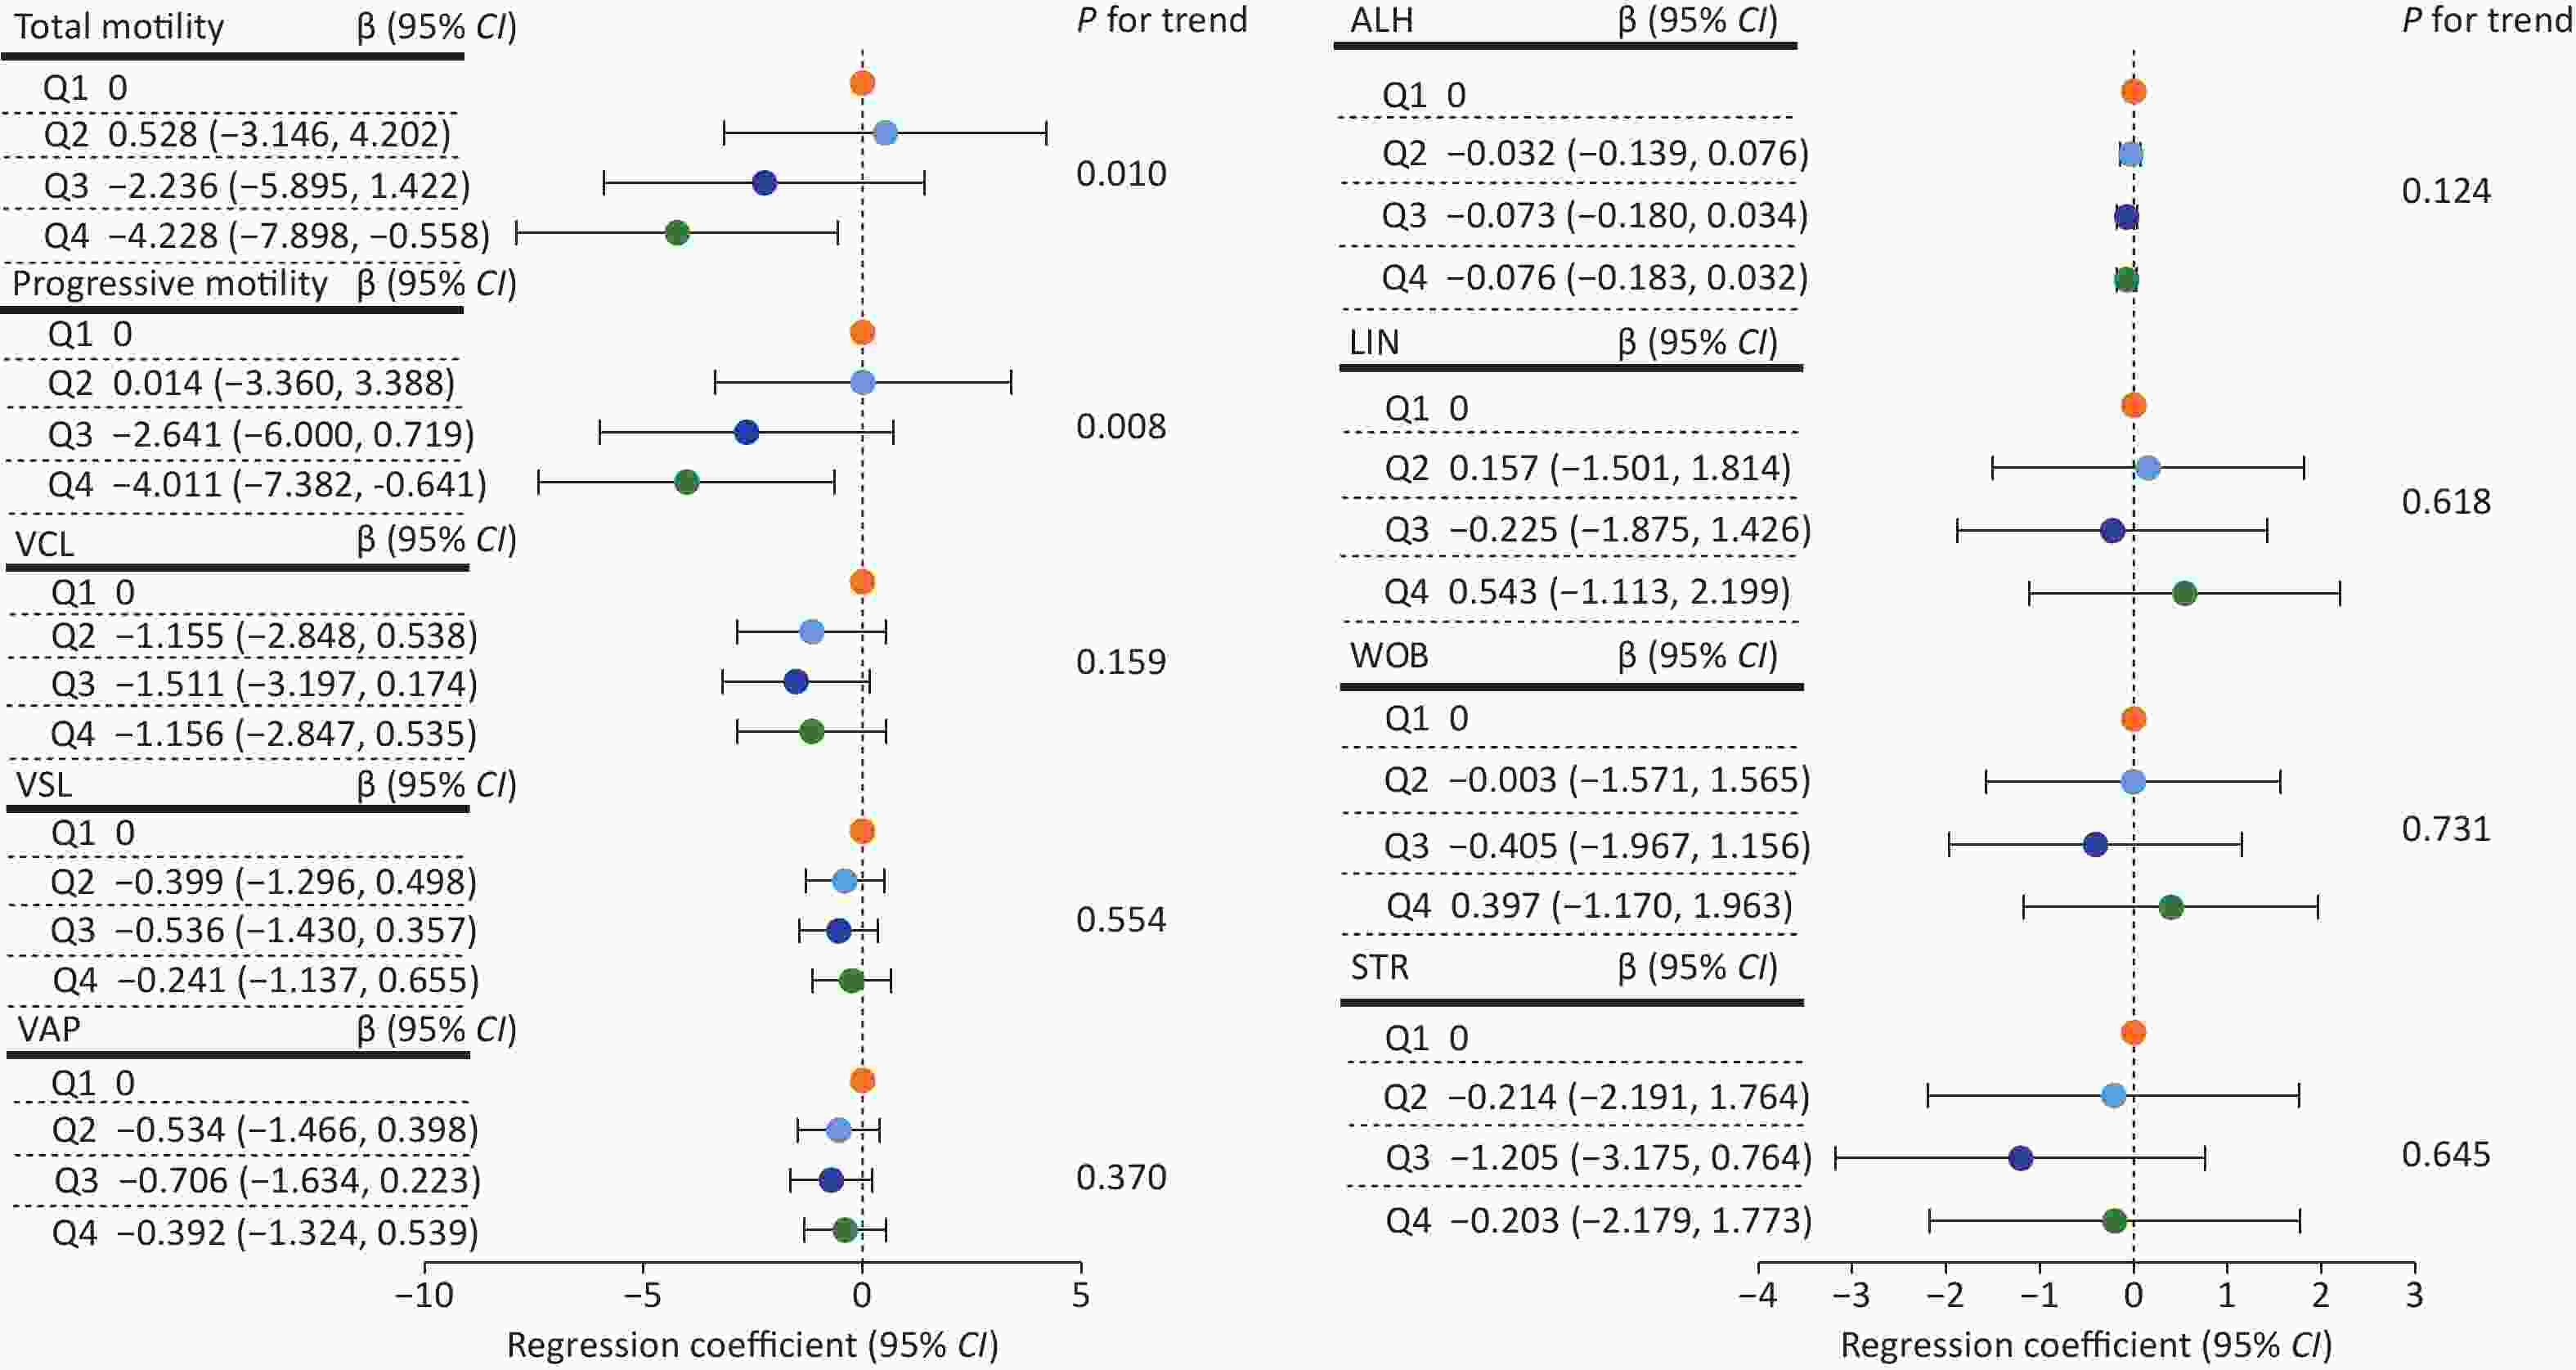
Figure S1. Regression coefficients [β (95% CI)] for changes in sperm motility and velocity parameters across semen MC quartiles (n = 837). First quartile (Q1) was used as a reference group. Multivariable linear regression models were adjusted for age, BMI, abstinence time, smoking and drinking status. Semen MC levels were ln-transformed. Other parameters were not transformed. Test for trend was performed by entering the median value of each quartile of semen MCs as a continuous variable in the models. CI, confidence interval; BMI, body mass index; MCs, microcystins; VCL, curvilinear velocity; VSL, straight-line velocity; VAP, average path velocity; ALH, amplitude of lateral head displacement; LIN, linearity; WOB, wobble; STR, straightness; Q, quartile.
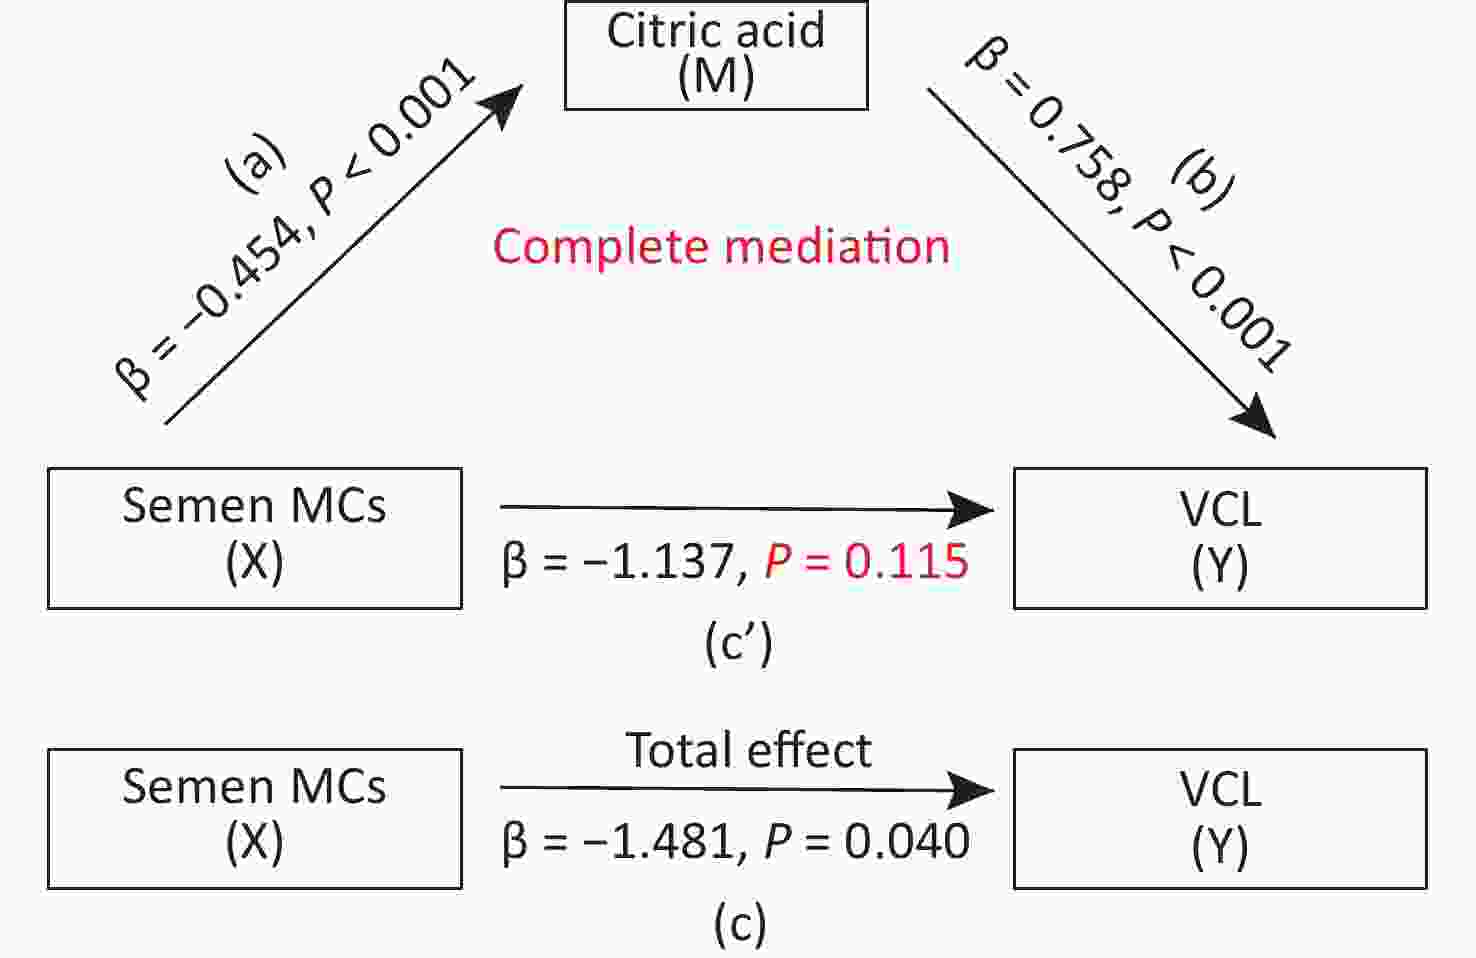
Figure S4. Mediation analysis model exploring the mediating role of citric acid in the association between semen MC exposure and VCL (n = 837). Mediation analysis models were adjusted for age, BMI, abstinence time, smoking and drinking status. Semen MC levels were ln-transformed. Citric acid was square root-transformed. VCL was not transformed. a) the effect of semen MCs on citric acid; b) the effect of citric acid on VCL; c’) the direct effect of semen MCs on VCL; c) the total effect of semen MCs on VCL (c = ab + c’). The mediation ratio was calculated as (a × b)/c. MCs, microcystins; BMI, body mass index; VCL, curvilinear velocity.
HTML


&These authors contributed equally to this work.
Reference
 22398+Supplementary Materials.pdf
|

|

 Quick Links
 DownLoad: