


-
Cancer has become a serious threat to public health and the economy worldwide[1]. Lung cancer has been the highest cause of cancer-related morbidity and mortality, closely followed by gastric cancer and liver cancer[2]. Cancer is a complex disease involving multiple factors, including environmental factors (e.g., alcohol intake, tobacco use) and genetic factors, as well as their interactions[3]. Although clinical treatment of cancer has improved greatly, the overall outcome is still unsatisfactory, and the five-year survival rate is still low[4]. Thus, the identification of reliable genetic biomarkers is of great importance for risk prediction and early detection of cancer.
Immunity plays an important role in carcinogenesis, and chronic inflammation is recognized as a condition favoring the development of cancer[5]. The B7-H4 is an immune checkpoint that plays an essential role in carcinogenesis, and it is able to affect T-cell functions (cytotoxicity, cytokine secretion, and cell proliferation), epithelial-to-mesenchymal transition, and cancer stemness[6-9]. The miR-125a is an inflamma-miRNA involved in the regulation of innate and adaptive immune responses and regulates immune and inflammation processes in human cancers[10]. Aberrant expressed B7-H4 gene and miR-125a gene occur in many malignant tumors, whereas the underlying mechanism remains largely unknown.
Single nucleotide polymorphism (SNP), a well-defined genetic variation, has been extensively applied in the medical field. Regulatory SNPs (rSNPs) are a group of SNPs that participate in the regulation of gene expression and protein structural/functional behavior[11]. Among the enormous SNPs in the B7-H4 gene and miR-125a gene, two rSNPs, namely, rs10754339[12] and rs12976445[13], have been highlighted in the literature[14-23]. However, the results were contradictory rather than conclusive. To further explore their contribution to carcinogenesis, we conducted a case-control study to investigate the effects of rs12976445 and rs10754339 on susceptibility to lung, liver, and gastric cancer in the Chinese population of Hubei Province. Additionally, we estimated the association of rs12976445/rs10754339 and cancer susceptibility via a meta-analysis by combining the data of previous related studies and those of the present study.
-
A total of 1,490 cancer patients (lung/gastric/liver/: 550/460/480) and 800 controls were enrolled in this study. All cancer patients were confirmed histopathologically and recruited from the Hubei Cancer Hospital and Wuhan Xinzhou District People’s Hospital. Individuals to be included in the control were selected from cancer-free individuals who visited the Wuhan Xinzhou District People’s Hospital for regular physical examinations. All participants were biologically unrelated Han Chinese living in the Hubei Province of China. Each participant signed an informed consent form. This study was approved by the ethical committee of the Wuhan University of Technology.
-
The peripheral blood samples of all studied subjects were collected into blood vacuum tubes containing ethylenediaminetetraacetic acid (EDTA) and stored at 4 °C. Genomic DNA was extracted from the blood samples using the TIANamp Blood DNA Kit (DP348; TianGen Biotech, Beijing, China) within one week, according to the manufacturer’s instructions. Finally, the DNA samples were stored at −20 °C before use.
-
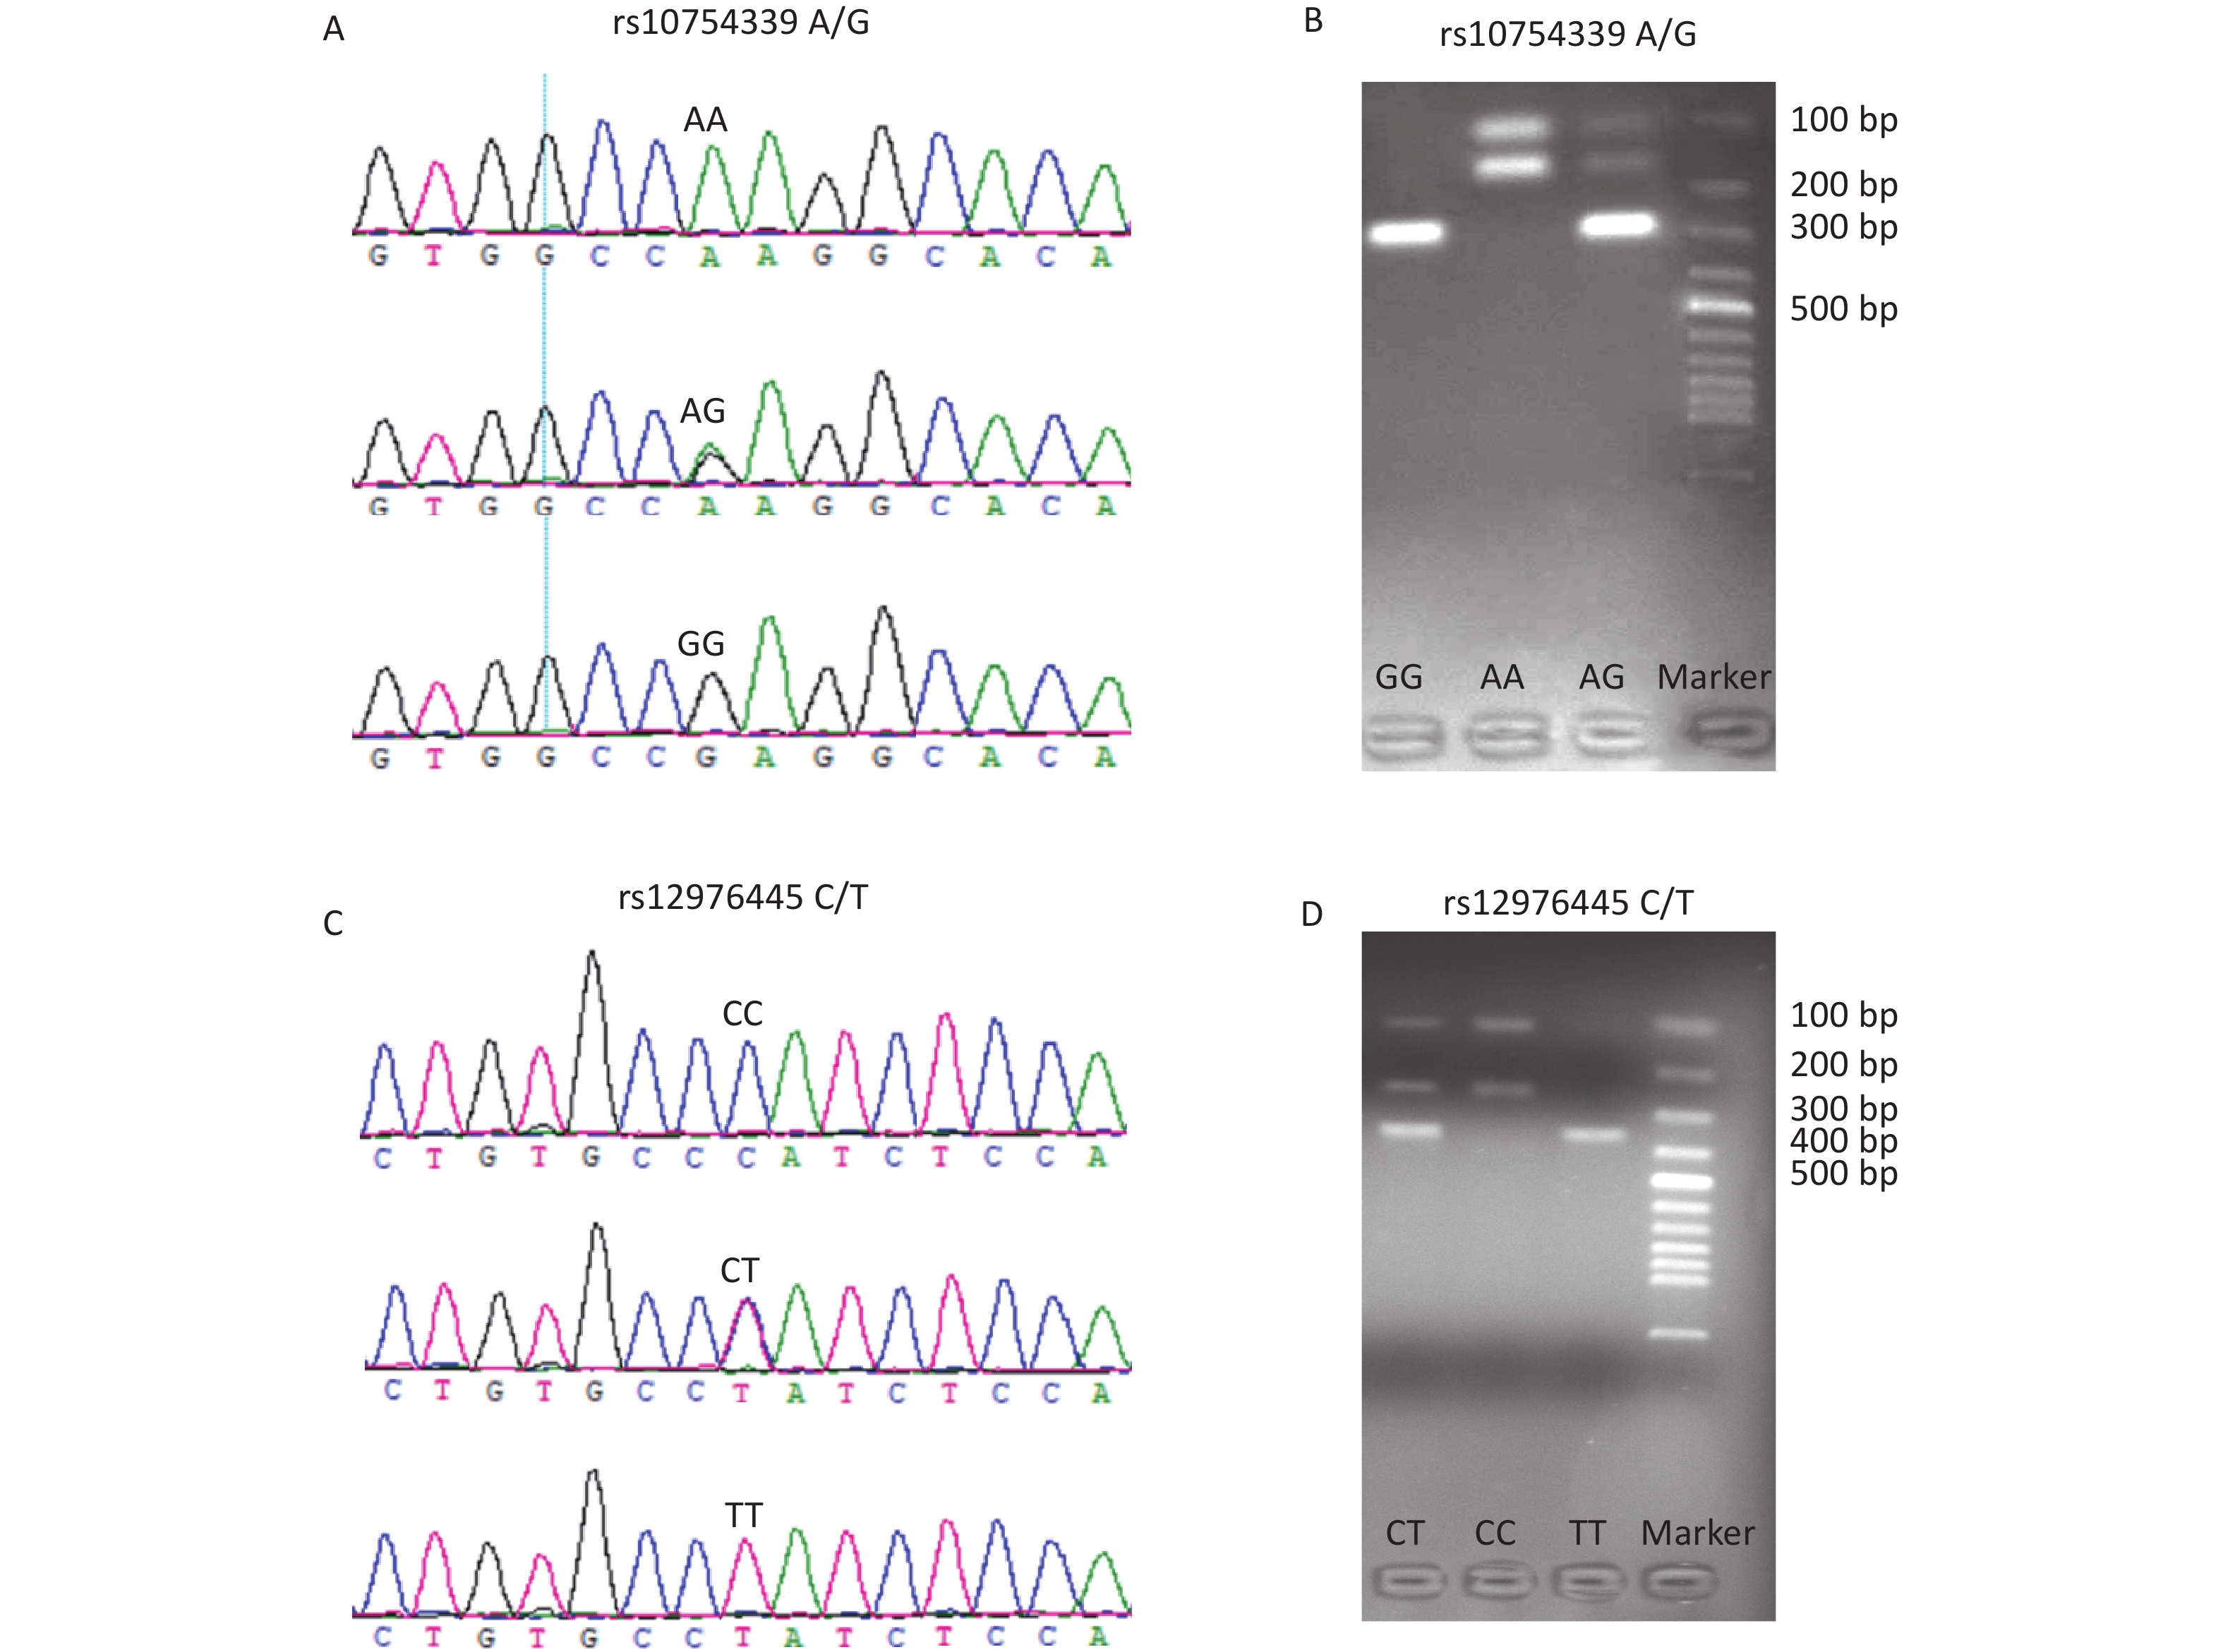
The genotyping of rs10754339 and rs12976445 was performed by the polymerase chain reaction-restriction fragment length polymorphism (PCR-RFLP) method. Table 1 shows the PCR primer sequences and the restriction enzymes used. The accuracy of the PCR-RFLP was confirmed by sequencing the PCR products from 10% randomly selected samples, and there were no differences in results between the two methods. Supplementary Figure S1 (available in www.besjournal.com) displays the genotyping diagrams of rs10754339 and rs12976445 by PCR-RFLP and Sanger sequencing.
Locus Primer Sequence (5’–3’) Annealing
temperature (°C)Restriction enzyme Digested fragments rs10754339 F: TGCTGACGGCTATCCGACTC
R: GCTTCTCCTGTATGCCCCTAAA51 MlsI, 37 °C AA: 117 bp + 174 bp
AG: 291 bp + 117 bp + 174 bp
GG: 291 bprs12976445 F: TCCCTCTTATTCTGGCATTC
R: GTCAGGTTTCAGTTGGTGGT59 SduI, 37 °C CC: 238 bp + 110 bp
CT: 348 bp + 238 bp + 110 bp
TT: 348 bpTable 1. Oligonucleotides and restriction enzymes of rs10754339 and rs12976445 for genotyping
-
SPSS 15.0 was used to perform all the statistical analyses. χ2 test was applied to determine the statistical differences in age, gender, smoking status, and drinking status between cancer patients and the control group. The genotypic frequencies of rs10754339 and rs12976445 were tested for deviation from the Hardy-Weinberg equilibrium (HWE) in the control group. Furthermore, the logistic regression analysis under six genetic comparisons was used to estimate the effects of rs10754339 and rs12976445 on cancer susceptibility. The level of significance was set at P < 0.05, and the Bonferroni correction was applied for multiple comparisons (P < 0.0084, 0.05/6).
-
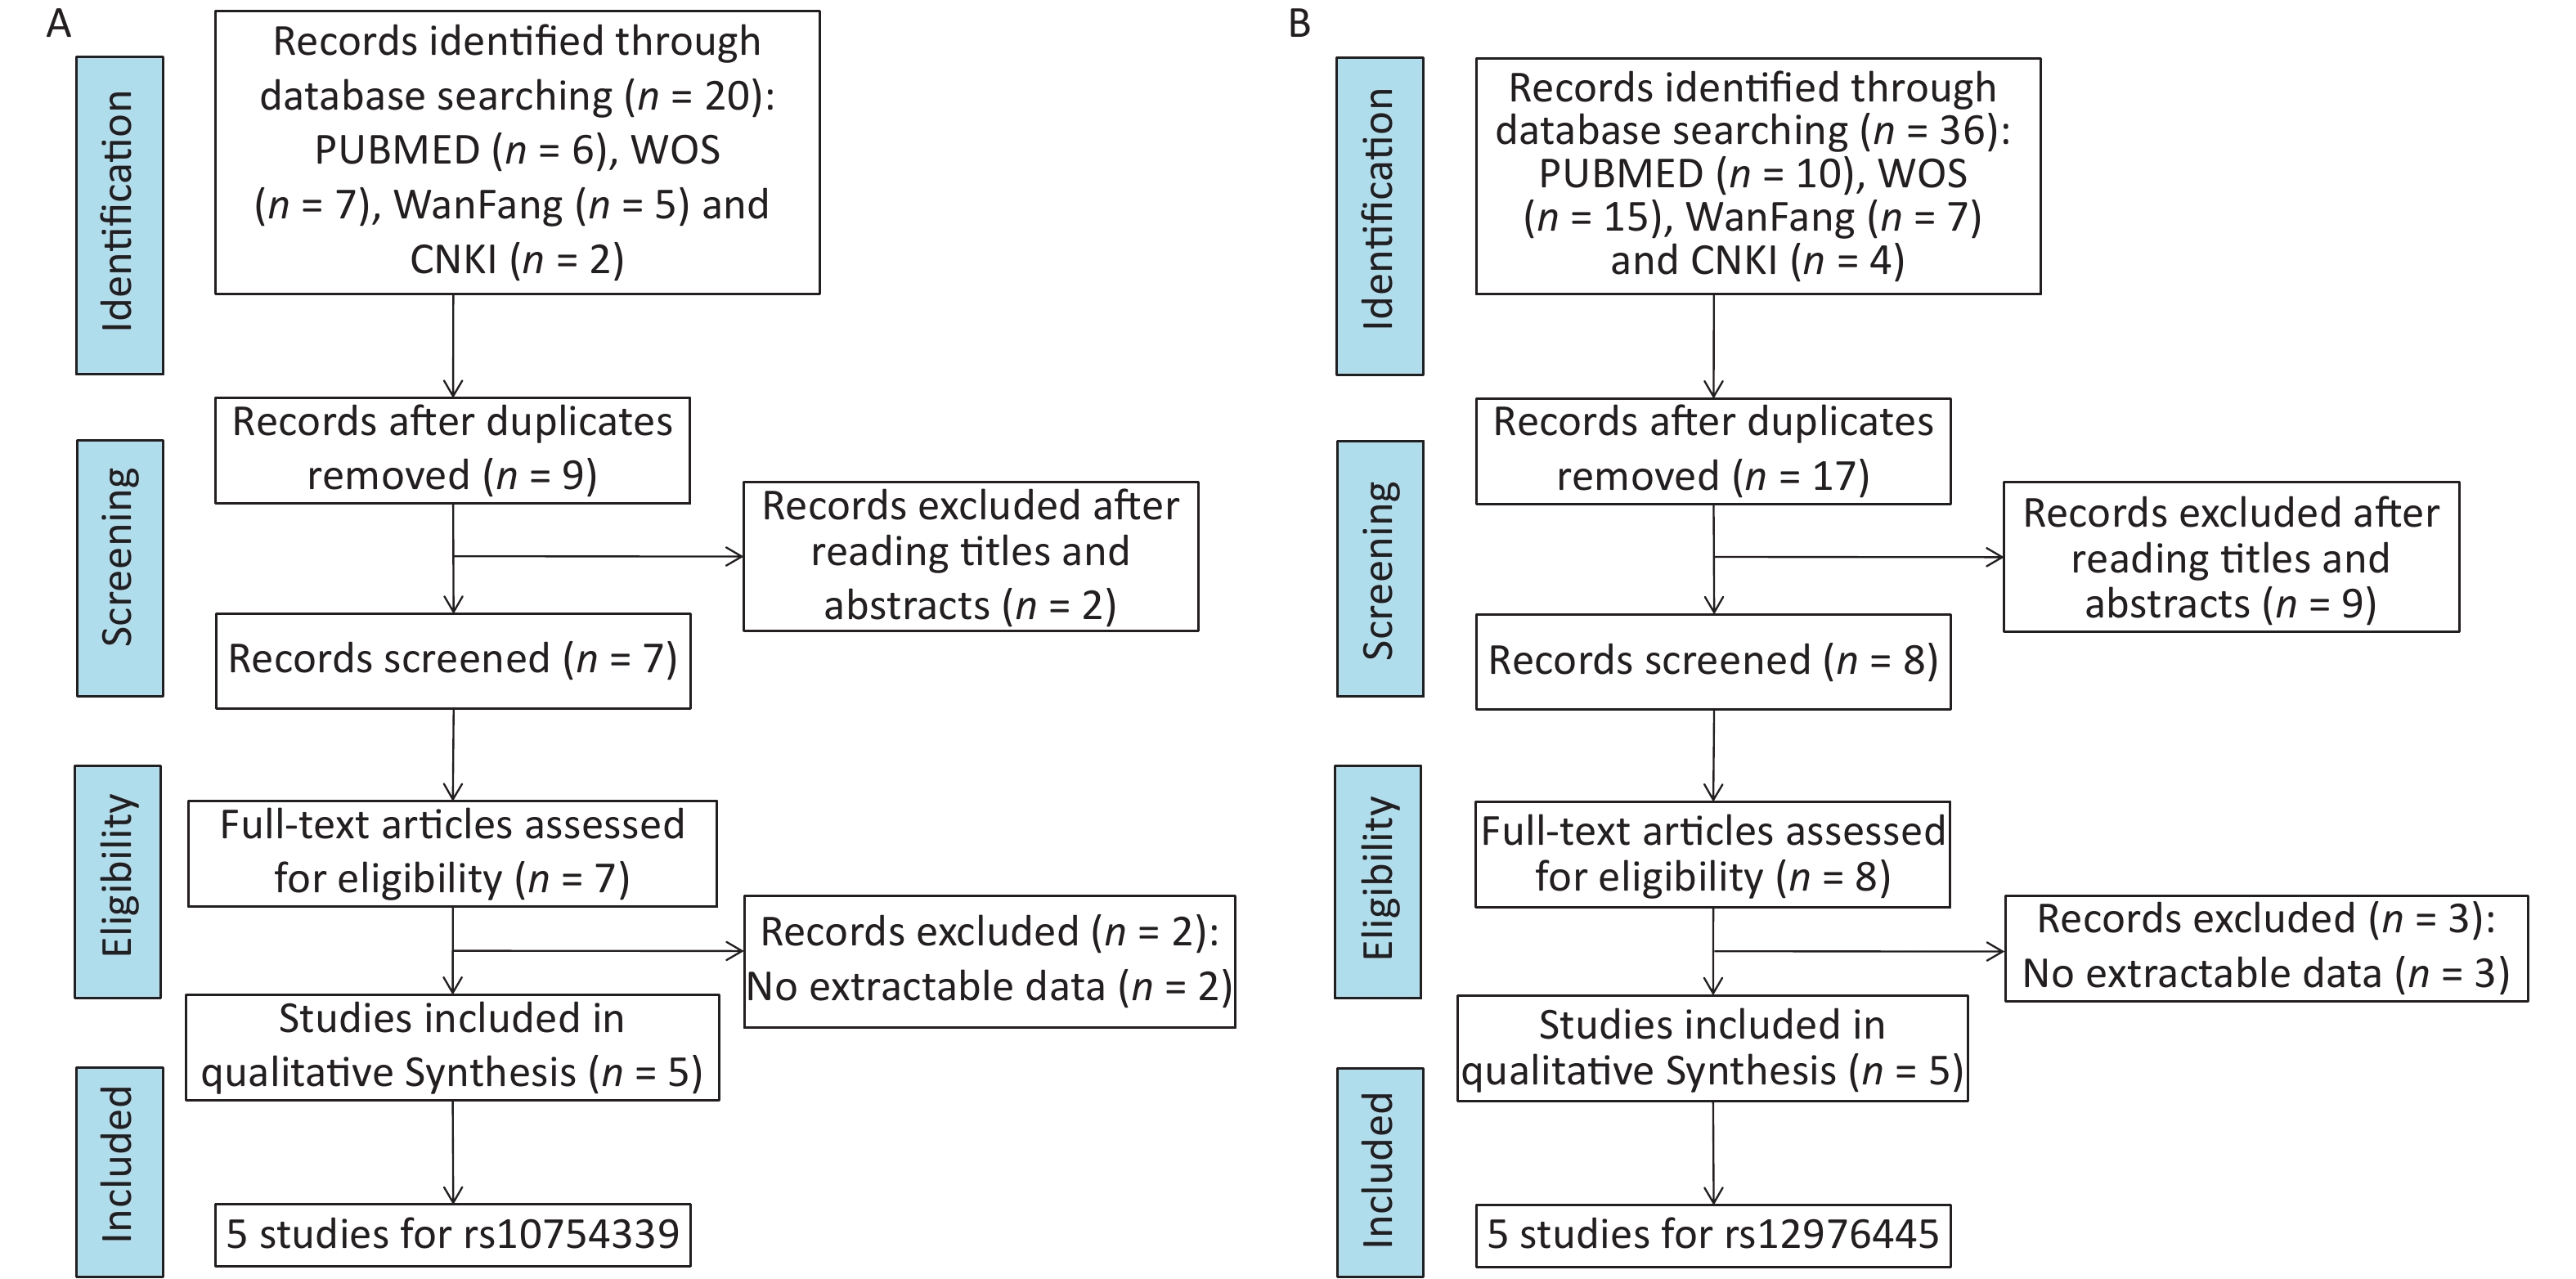
Related literature up to March of 2022 was searched in PubMed, ISI Web of Science, CNKI, and Wanfang databases with the terms “rs10754339 and cancer/tumor” or “rs12976445 and cancer/tumor.” Supplementary Figure S2 (available in www.besjournal.com) shows the flow diagram of the literature retrieving process. References listed in retrieved articles were checked for missing information. For a study to be included in the meta-analysis, it had to meet the following criteria: (1) it is a human study, (2) it is an investigation of rs10754339/rs12976445 and cancer risk, (3) it is a case-control study, (4) frequency data are extractable, and (5) the control group conforms to the HWE. The STATA 14.0 was used to conduct all the statistical analyses, including the heterogeneity test, pooled ORs, publication bias, and sensitivity analysis. P < 0.05 was set as the significance level, and Bonferroni correction was applied for multiple comparisons (P < 0.0084, 0.05/6). Trial sequential analysis (TSA) was used to assess whether the evidence of this meta-analysis was enough and conclusive[24], and the interpretation of TSA results has been described in our previous article[25].
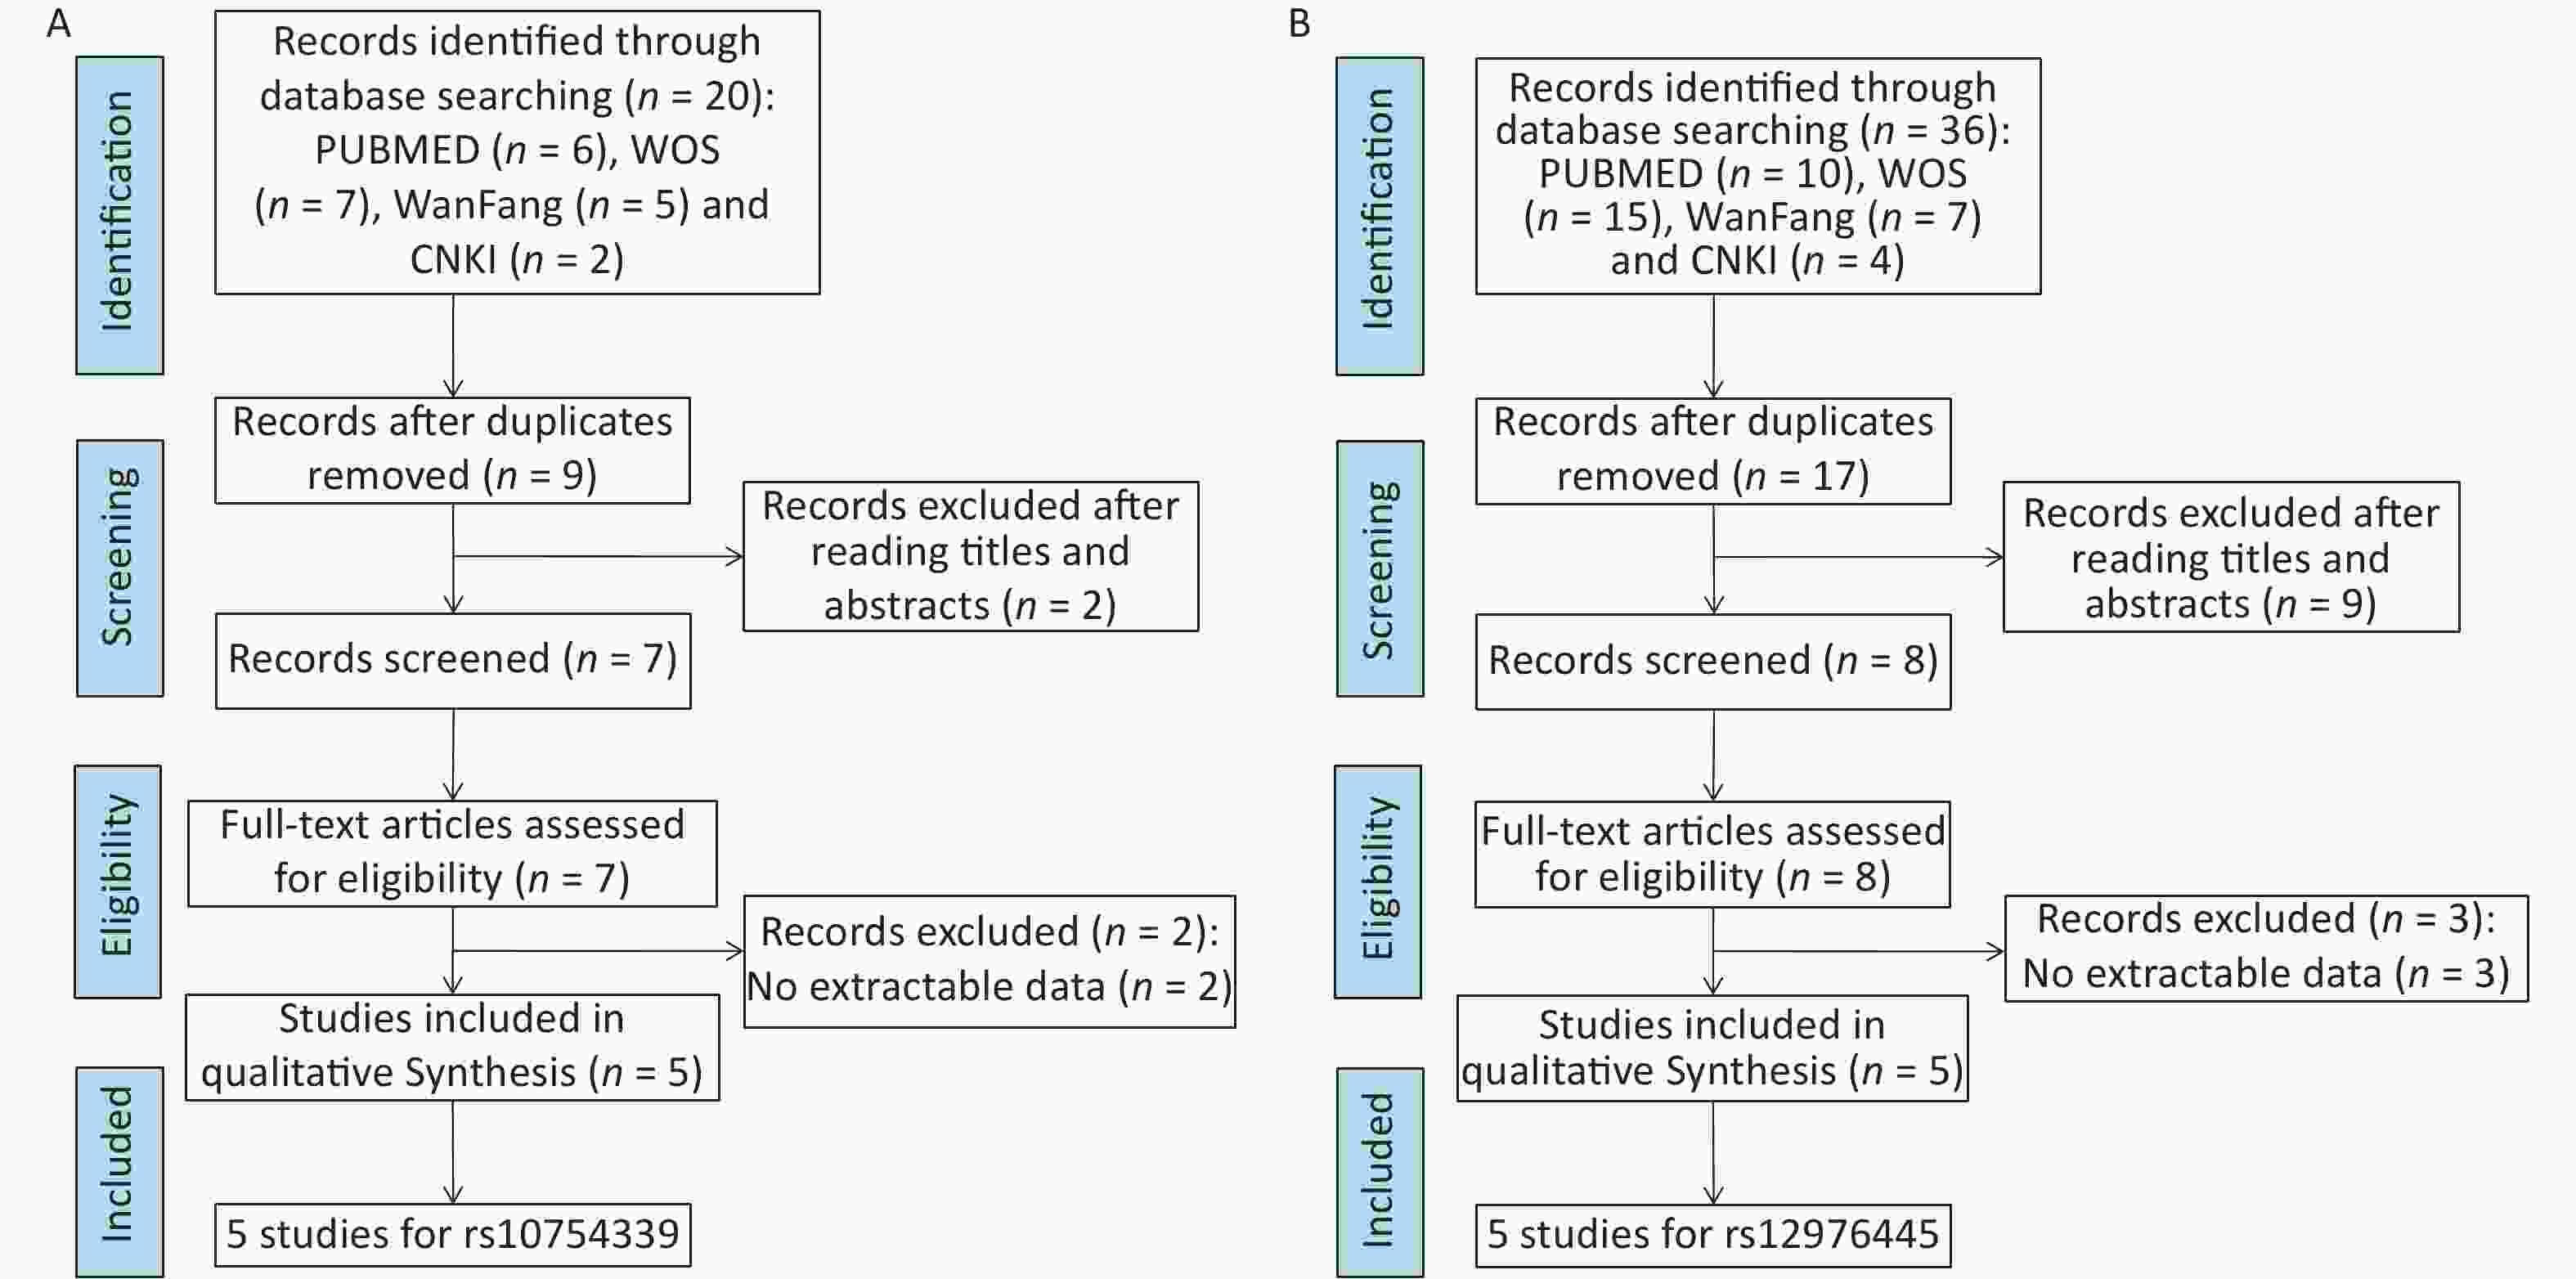
Figure S2. The flow diagram of the literature review process for the meta-analysis of rs10754339 and cancer risk (A) and the meta-analysis of rs12976445 and cancer risk (B).
-
The principal characteristics of the age, gender, smoking status, and alcohol status of studied subjects are presented in Table 2. The distributions of these four variables between cancer patients and the control group did not differ significantly, suggesting the cases and controls were well-matched in this study.
Group Age, n (%) Gender, n (%) Smoking status, n (%) Drinking status, n (%) P-value1 ≤ 60 years > 60 years Male Female Ever Never Ever Never Normal controls
(n = 800)434 (54.3) 366 (45.7) 558 (69.7) 242 (30.3) 209 (26.1) 591 (73.9) 237 (29.6) 563 (70.4) Lung cancer
patients (n = 550)306 (55.6) 244 (44.4) 373 (67.9) 177 (32.1) 150 (27.3) 400 (72.7) 170 (31.0) 380 (69.0) 0.615 0.451 0.639 0.613 Gastric cancer
patients (n = 460)252 (54.8) 208 (45.2) 323 (70.3) 137 (29.7) 132 (28.8) 328 (71.2) 148 (32.1) 312 (67.9) 0.855 0.862 0.323 0.344 Liver cancer
patients (n = 480)280 (58.3) 200 (41.7) 343 (71.5) 137 (28.5) 140 (29.2) 340 (70.8) 158 (32.9) 322 (67.1) 0.154 0.517 0.237 0.217 Note. 1Two-sided χ2 test for the distributions of age (1st column), gender (2nd column), smoking status (3rd column) and drinking status (4th column) between lung/gastric/liver cancer patients and normal controls. Table 2. Characteristics of participants in this study
-
Table 3 shows the allelic and genotypic distributions of rs10754339 and rs12976445, as well as their contribution to cancer susceptibility. No deviation from HWE was observed for rs10754339 or rs12976445 in the control group (P > 0.05). In this study, rs10754339 was significantly associated with the risk of lung and gastric cancer but not with liver cancer. The A allele of rs10754339 was associated with a lower risk of lung cancer (A vs. G, P = 0.002, OR = 0.68, 95% CI: 0.54–0.87) and gastric cancer (A vs. G, P = 0.006, OR = 0.71, 95% CI: 0.55–0.91) than the G allele. Concordantly, carriers of the AA genotype were less inclined to suffer from lung cancer than carriers of the AG/AG + GG genotype (AA vs. AG, P = 0.006, OR = 0.69, 95% CI: 0.53–0.90; AA vs. AG + GG, P = 0.003, OR = 0.67, 95% CI: 0.52–0.87), and were less inclined to suffer from gastric cancer than AG + GG genotype carriers (AA vs. AG + GG, P = 0.007, OR = 0.68, 95% CI: 0.52–0.90). Additionally, the rs12976445 was significantly associated with the risk of lung cancer but not liver or gastric cancer. Specifically, the T allele of rs12976445 conferred a higher risk for lung cancer than the C allele (T vs. C, P = 0.001, OR = 1.48, 95% CI: 1.17–1.87), and individuals carrying the genotype with at least one T allele had a higher lung cancer risk than that CC carriers (TT + TC vs. CC, P = 0.004, OR = 1.46, 95% CI: 1.13–1.88).
Group Allele, n (%) Genotype, n (%) HWE1 Genetic comparison [P-value, OR (95% CI)]2 rs10754339 A G AA AG GG A vs. G AA vs. AG AA vs. GG AG vs. GG AA vs. AG + GG AA + AG
vs. GGNormal controls
(n = 800)1,443
(0.902)157
(0.098)650
(0.415)143
(0.179)7
(0.009)0.961 Lung cancer
patients (n = 550)949
(0.863)151
(0.137)409
(0.744)131
(0.238)10
(0.018)0.002, 0.68
(0.54–0.87)0.006, 0.69
(0.53–0.90)0.099, 0.44
(0.17–1.17)0.381, 0.64
(0.24–1.73)0.003, 0.67
(0.52–0.87)0.135, 0.48
(0.18–1.26)Gastric cancer
patients (n = 460)797
(0.866)123
(0.134)344
(0.748)109
(0.237)7
(0.015)0.006, 0.71
(0.55–0.91)0.011, 0.69
(0.52–0.92)0.237, 0.53
(0.18–1.52)0.621, 0.76
(0.26–2.24)0.007, 0.68
(0.52–0.90)0.298, 0.57
(0.20–1.64)Liver cancer
patients (n = 480)858
(0.894)102
(0.106)384
(0.800)90
(0.188)6
(0.013)0.509, 0.92
(0.70–1.19)0.671, 0.94
(0.70–1.26)0.506, 0.69
(0.23–2.07)0.589, 0.73
(0.24–2.26)0.583, 0.92
(0.69–1.23)0.519, 0.70
(0.23–2.09)rs12976445 C T CC CT TT T vs. C TT vs. TC TT vs. CC TC vs. CC TT vs. TC + CC TT + TC
vs. CCNormal controls
(n = 800)1,435
(0.897)165
(0.103)642
(0.803)151
(0.189)7
(0.009)0.847 Lung cancer
patients (n = 550)940
(0.855)160
(0.145)405
(0.736)130
(0.236)15
(0.027)0.001, 1.48
(1.17–1.87)0.054, 2.49
(0.99–6.29)0.009, 3.40
(1.37–8.40)0.022, 1.37
(1.05–1.78)0.012, 3.18
(1.29–7.84)0.004, 1.46
(1.13–1.88)Gastric cancer
patients (n = 460)811
(0.882)109
(0.118)358
(0.778)95
(0.207)7
(0.015)0.234, 1.17
(0.90–1.51)0.400, 1.59
(0.54–4.67)0.278, 1.79
(0.62–5.15)0.411, 1.13
(0.85–1.50)0.298, 1.75
(0.61–5.02)0.306, 1.16
(0.88–1.53)Liver cancer
patients (n = 480)829
(0.864)131
(0.136)359
(0.748)111
(0.231)10
(0.021)0.011, 1.37
(1.08–1.76)0.191, 1.94
(0.72–5.26)0.059, 2.56
(0.96–6.77)0.053, 1.32
(1.00–1.73)0.076, 2.41
(0.91–6.38)0.022, 1.37
(1.05–1.79)Note. 1Genotypic frequencies of rs10754339 and rs12976445 in controls were tested for departure from Hardy-Weinberg equilibrium (HWE) using two-sided χ2 test. 2The P value and OR (95% CI) were calculated for each genetic comparison between lung/gastric/liver cancer patients and normal controls, and adjusted for age, sex, smoking, and drinking status. OR, odd ratio; CI, confidence interval. Table 3. Genotype and allele distributions of rs10754339 and rs12976445 polymorphism and their association with cancer risk
-
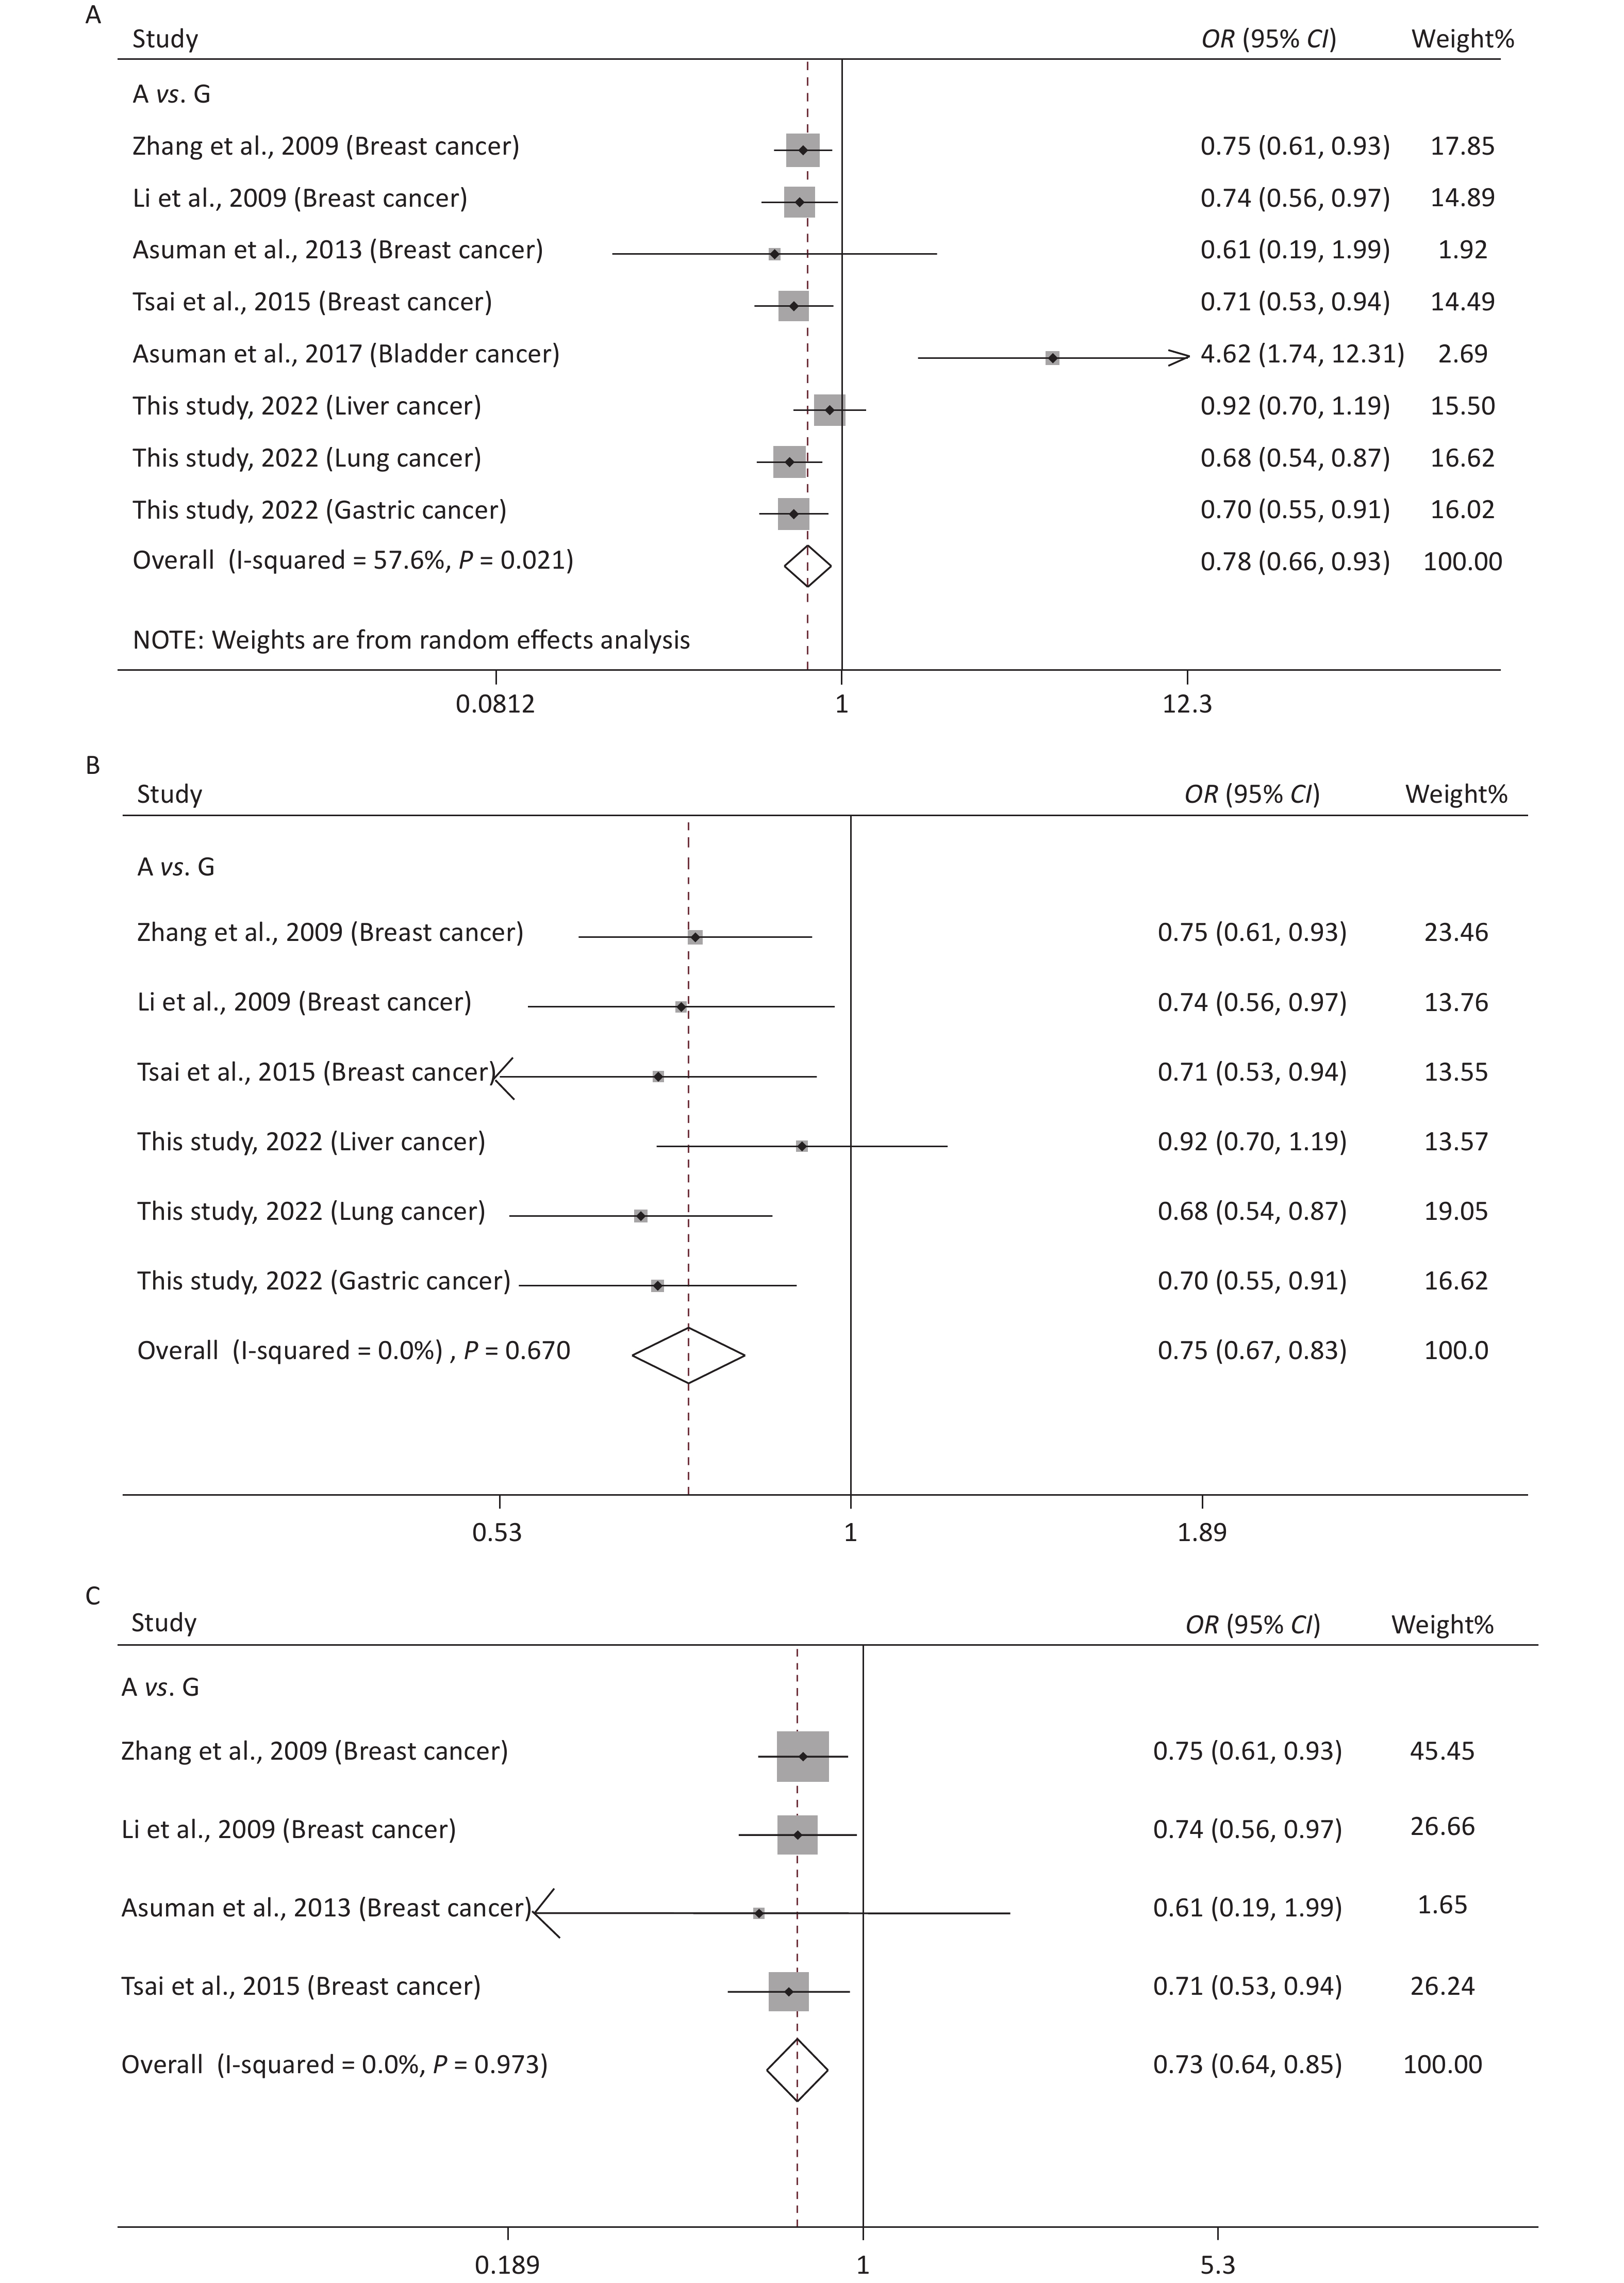
Supplementary Table S1 (available in www.besjournal.com) shows the main features of the included studies in the meta-analysis of rs10754339 and cancer susceptibility. The statistical results are presented in Table 4 and Supplementary Figure S3 (available in www.besjournal.com). It was observed that rs10754339 was significantly associated with total cancer risk under A vs. G (P = 0.004, OR = 0.78, 95% CI: 0.66–0.93), AA vs. AG (P = 0.004, OR = 0.76, 95% CI: 0.62–0.91), and AA vs. AG + GG (P = 0.004, OR = 0.75, 95% CI: 0.62–0.91). Interestingly, the ethnicity-stratified analysis showed that the association between rs10754339 and total cancer risk especially existed in the Chinese population. Furthermore, there was a significant association between rs10754339 and breast cancer risk.
Genetic model Heterogeneity test Pooled OR
(95% CI)Hypothesis test Begg's test Egger's test Studies
(n)Q P I2 Z P Z P Z P rs10754339 and total cancer risk (2,936 case/3,669 control) A vs. G 16.52 0.021 57.6 0.78 (0.66–0.93) 2.85 0.004 0.62 0.536 1.59 0.162 8 AA vs. AG 15.70 0.028 55.4 0.76 (0.62–0.91) 2.88 0.004 0.12 0.902 1.25 0.259 8 AA vs. GG 3.44 0.841 < 0.001 0.66 (0.46–0.94) 2.27 0.023 0.87 0.386 1.43 0.203 8 AG vs. GG 1.38 0.986 < 0.001 0.91 (0.63–1.31) 0.53 0.596 0.12 0.902 0.62 0.556 8 AA vs. AG + GG 17.08 0.017 59.0 0.75 (0.62–0.91) 2.86 0.004 0.37 0.711 1.44 0.200 8 AA + AG vs. GG 2.90 0.894 < 0.001 0.73 (0.51–1.04) 1.74 0.082 0.87 0.386 1.04 0.339 8 rs10754339 and total cancer risk in Chinese population (2,843 case/3,609 control) A vs. G 3.19 0.670 < 0.001 0.75 (0.67–0.83) 5.64 < 0.001 0.00 1.000 0.14 0.894 6 AA vs. AG 3.77 0.583 < 0.001 0.72 (0.64–0.81) 5.42 < 0.001 0.38 0.707 −0.04 0.971 6 AA vs. GG 0.82 0.976 < 0.001 0.63 (0.44–0.91) 2.49 0.013 0.38 0.707 −1.09 0.339 6 AG vs. GG 0.91 0.969 < 0.001 0.89 (0.61–1.29) 0.64 0.522 0.75 0.452 −1.67 0.171 6 AA vs. AG+GG 3.76 0.584 < 0.001 0.71 (0.64–0.80) 5.74 < 0.001 0.38 0.707 0.04 0.970 6 AA + AG vs. GG 1.06 0.958 < 0.001 0.70 (0.49–1.01) 1.93 0.054 0.38 0.707 −1.54 0.199 6 rs10754339 and total cancer risk in Caucasian population (93 case/60 control) A vs. G 6.68 0.010 85.0 1.73 (0.24–12.54) 0.54 0.587 − − − − 2 AA vs. AG 6.22 0.013 83.9 1.58 (0.16–15.73) 0.39 0.698 − − − − 2 AA vs. GG 1.08 0.300 7.1 2.50 (0.34–18.25) 0.91 0.365 − − − − 2 AG vs. GG < 0.001 0.992 < 0.001 1.98 (0.20–19.25) 0.59 0.557 − − − − 2 AA vs. AG + GG 6.84 0.009 85.4 1.73 (0.18–16.42) 0.47 0.635 − − − − 2 AA+AG vs. GG 0.69 0.406 < 0.001 2.36 (0.32–17.50) 0.84 0.403 − − − − 2 rs10754339 and breast cancer risk (1,384 case/1,239 control) A vs. G 0.23 0.973 < 0.001 0.73 (0.64–0.85) 4.21 < 0.001 1.02 0.308 −1.93 0.193 4 AA vs. AG 0.27 0.966 < 0.001 0.68 (0.57–0.80) 4.43 < 0.001 1.70 0.089 −2.12 0.078 4 AA vs. GG 0.07 0.996 < 0.001 0.70 (0.44–1.10) 1.56 0.118 −0.34 1.000 0.50 0.666 4 AG vs. GG 0.20 0.978 < 0.001 1.03 (0.65–1.64) 0.12 0.906 −0.34 1.000 1.31 0.321 4 AA vs. AG + GG 0.16 0.984 < 0.001 0.68 (0.57–0.80) 4.54 < 0.001 1.70 0.089 −2.12 0.078 4 AA + AG vs. GG 0.08 0.994 < 0.001 0.80 (0.51–1.25) 1.00 0.318 −0.34 1.000 0.17 0.878 4 Table 4. Meta-analysis of the association between rs10754339 and cancer risk
References
(author, year)Country/ethnicity Cancer type Genotyping
assay1Case, control (n) HWE2 Quality
control3
(Y/N)rs10754339 Total A/G AA/AG/GG Asuman et al., 2013 USA/Caucasian Breast cancer PCR-RFLP 31, 30 54/8, 55/5 24/6/1,
26/3/10.167 Y Asuman et al., 2017 Turkey/Caucasian Bladder cancer PCR-RFLP 62, 30 117/7,
47/1355/7/0,
18/11/10.660 Y Jin et al., 2022 China/Asian Liver cancer PCR-RFLP 480, 800 858/102,
1,443/157384/90/6,
650/143/70.779 Y Jin et al., 2022 China/Asian Lung cancer PCR-RFLP 550, 800 949/151,
1,443/157409/131/10,
650/143/70.779 Y Jin et al., 2022 China/Asian Gastric cancer PCR-RFLP 460, 800 797/123,
1,443/157344/109/7,
650/143/70.779 Y Li et al., 2009 China/Asian Breast cancer PCR-RFLP 287, 305 434/140,
493/117159/116/12,
198/97/100.652 Y Tsai et al., 2015 China/Asian Breast cancer PCR-RFLP 566/400 978/154,
720/80420/138/8,
324/72/41.000 Y Zhang et al., 2009 China/Asian Breast cancer PCR-RFLP 500, 504 753/247,
808/200277/199/24,
324/160/200.965 Y rs12976445 Total T/C TT/CT/CC Hossein et al., 2018 Iranian/Asian Colorectal cancer TP-ARMS-PCR 373, 372 438/308,
431/313118/202/53,
116/199/570.060 Y Jin et al., 2022 China/Asian Liver cancer PCR-RFLP 480, 800 131/829,
165/1,43510/111/359,
7/151/6420.779 Y Jin et al., 2022 China/Asian Lung cancer PCR-RFLP 550, 800 160/940,
165/1,43515/130/405,
7/151/6420.779 Y Jin et al., 2022 China/Asian Gastric cancer PCR-RFLP 460, 800 109/811,
165/1,4357/95/358,
7/151/6420.779 Y Mohan et al., 2018 Indian/Asian Prostate cancer PCR-RFLP 100, 100 99/101,
122/7828/43/29,
37/48/150.930 Y Morteza et al., 2020 Iranian/Asian Prostate cancer PCR-RFLP 150, 150 137/163,
143/15728/81/41,
33/77/400.723 Y Sun et al., 2021 China/Asian Lung cancer Taqman 503, 548 109/897,
114/9828/93/402,
2/110/4360.198 Y Tomasz et al., 2020 Polish/Caucasian Breast cancer PCR-RFLP 175, 129 241/109,
173/8580/81/14,
54/65/100.111 Y Note. 1PCR-RFLP, polymerase chain reaction-restriction fragment length polymorphism; TP-ARMS-PCR, tetra‐primer amplification refractory mutation systems polymerase chain reaction; 2Genotypic frequencies of rs10754339 and rs12974339 in normal controls was tested for departure from Hardy-Weinberg equilibrium (HWE) using the χ2 test. 3Quality control was conducted when sample of cases and controls was genotyped. Table S1. Characteristics of the included studies for the meta-analysis of rs10754339 and rs12976445
-
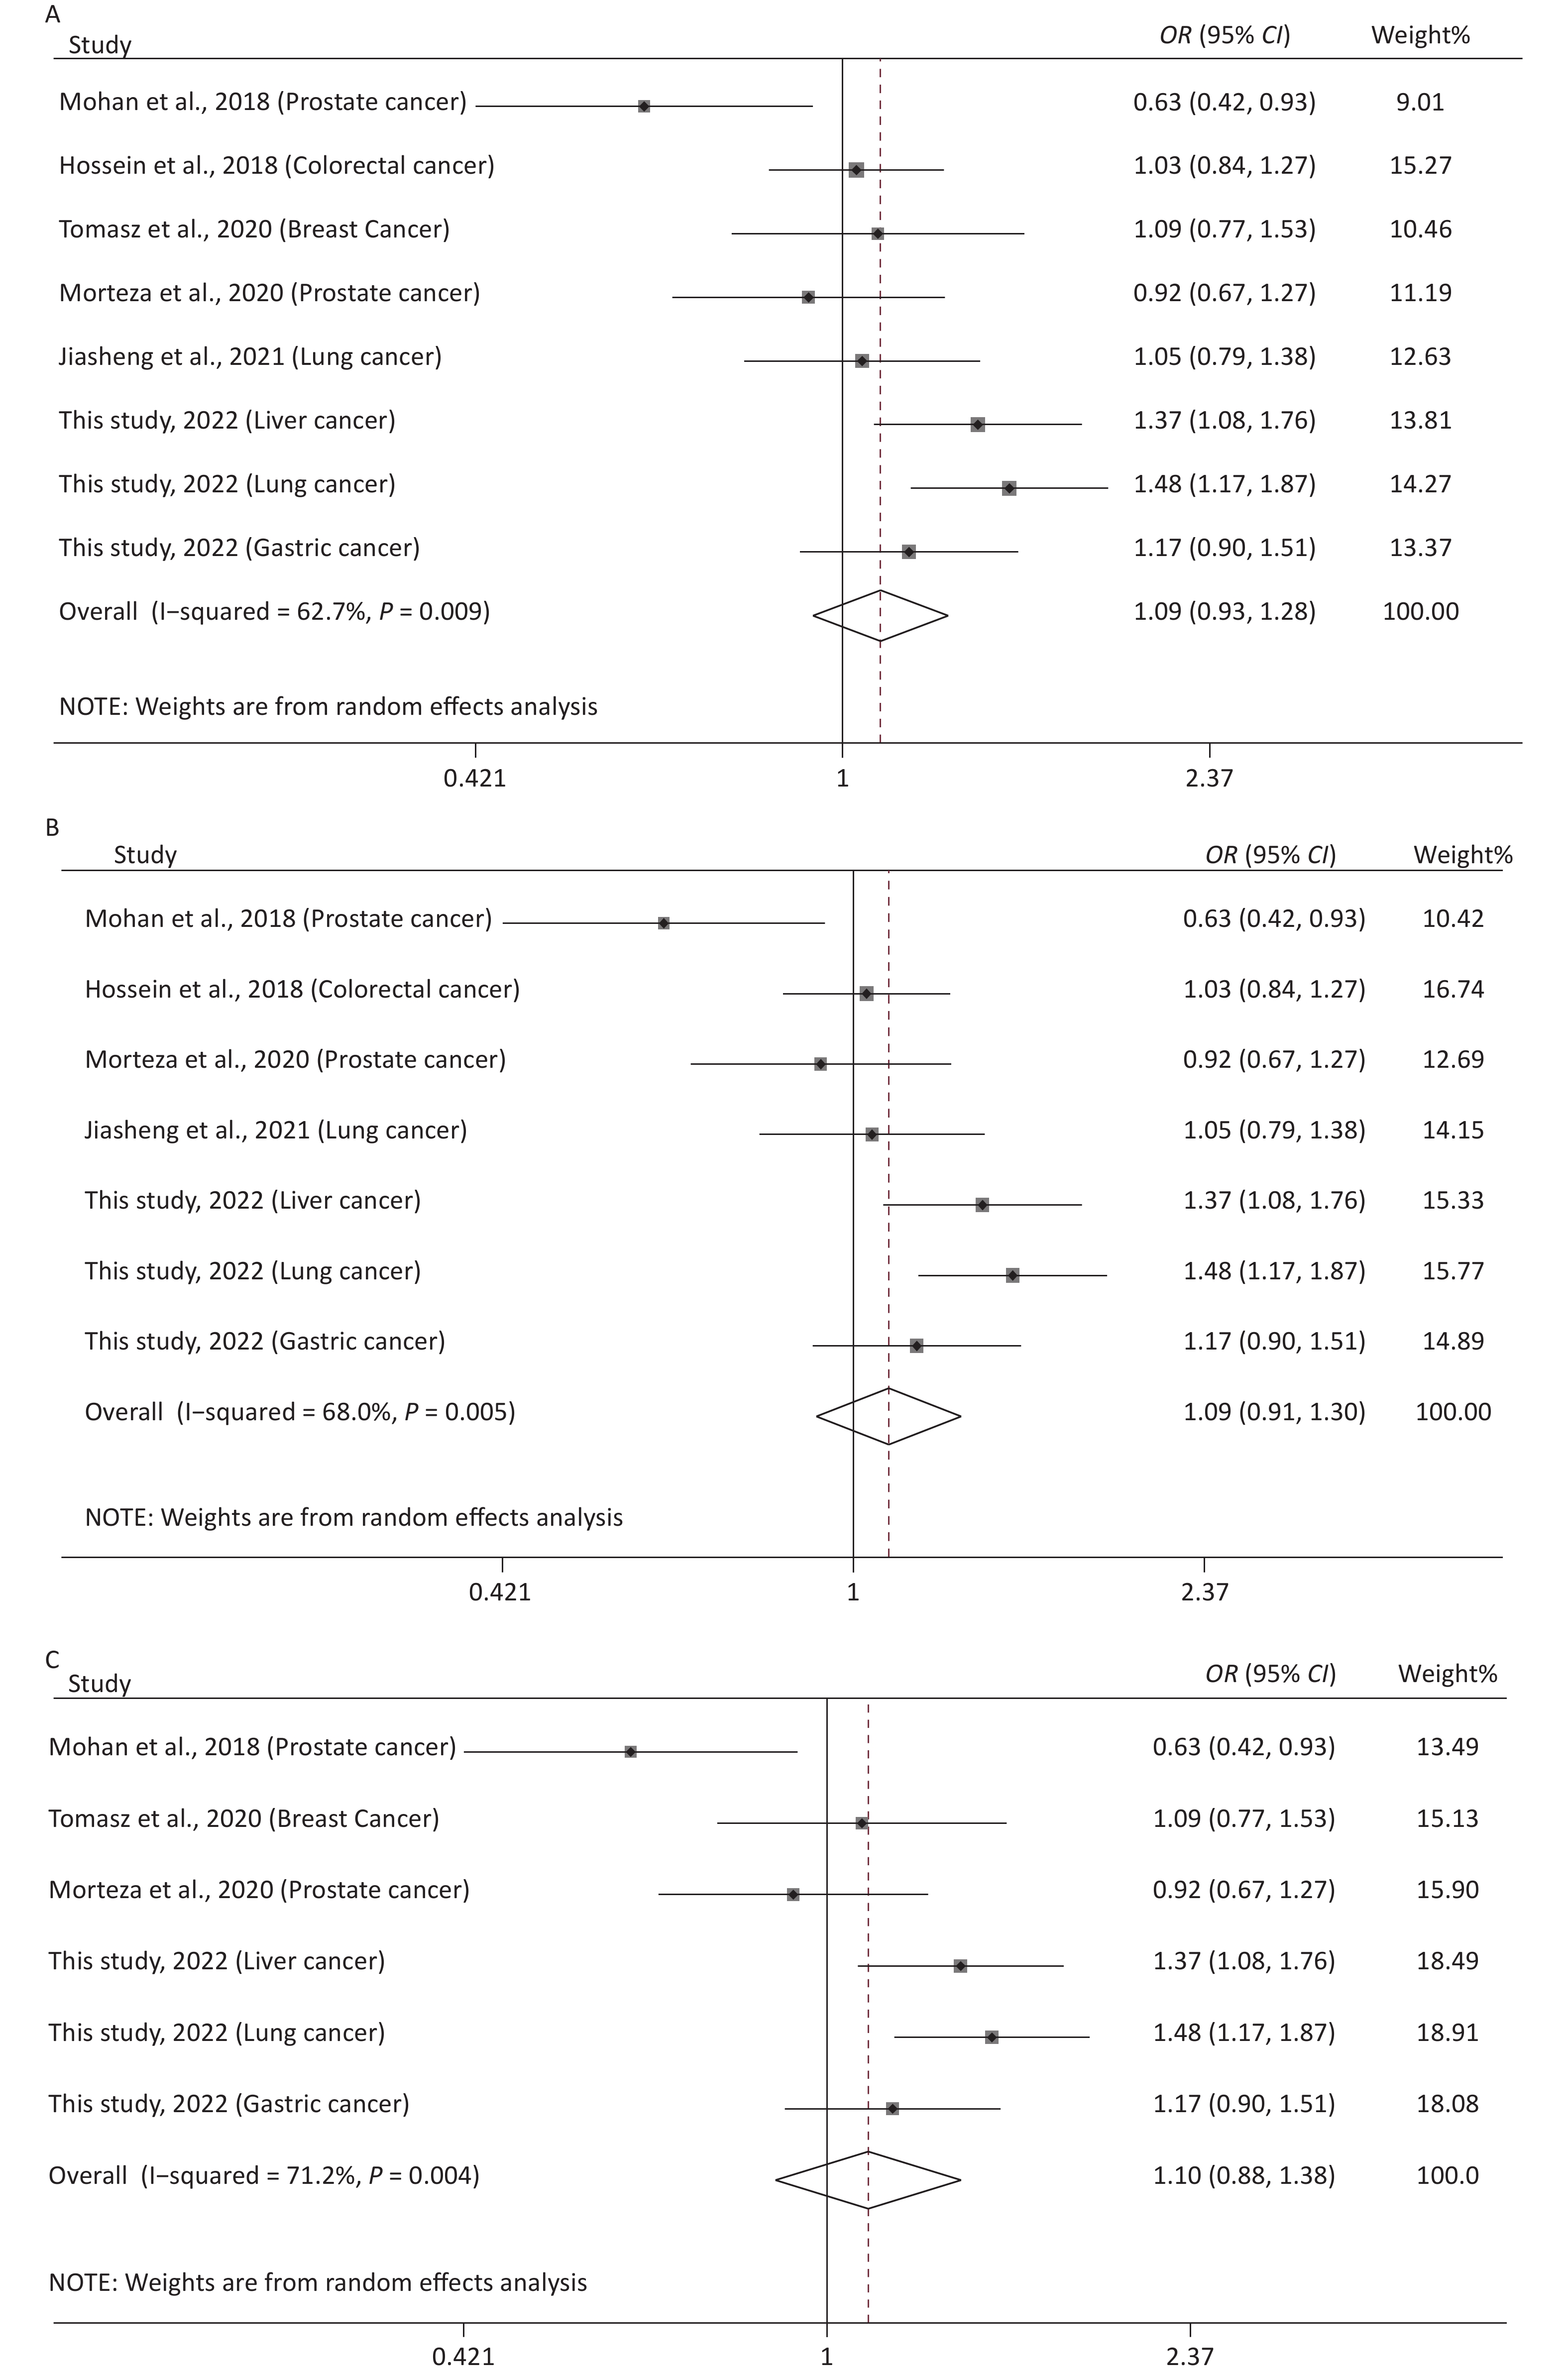
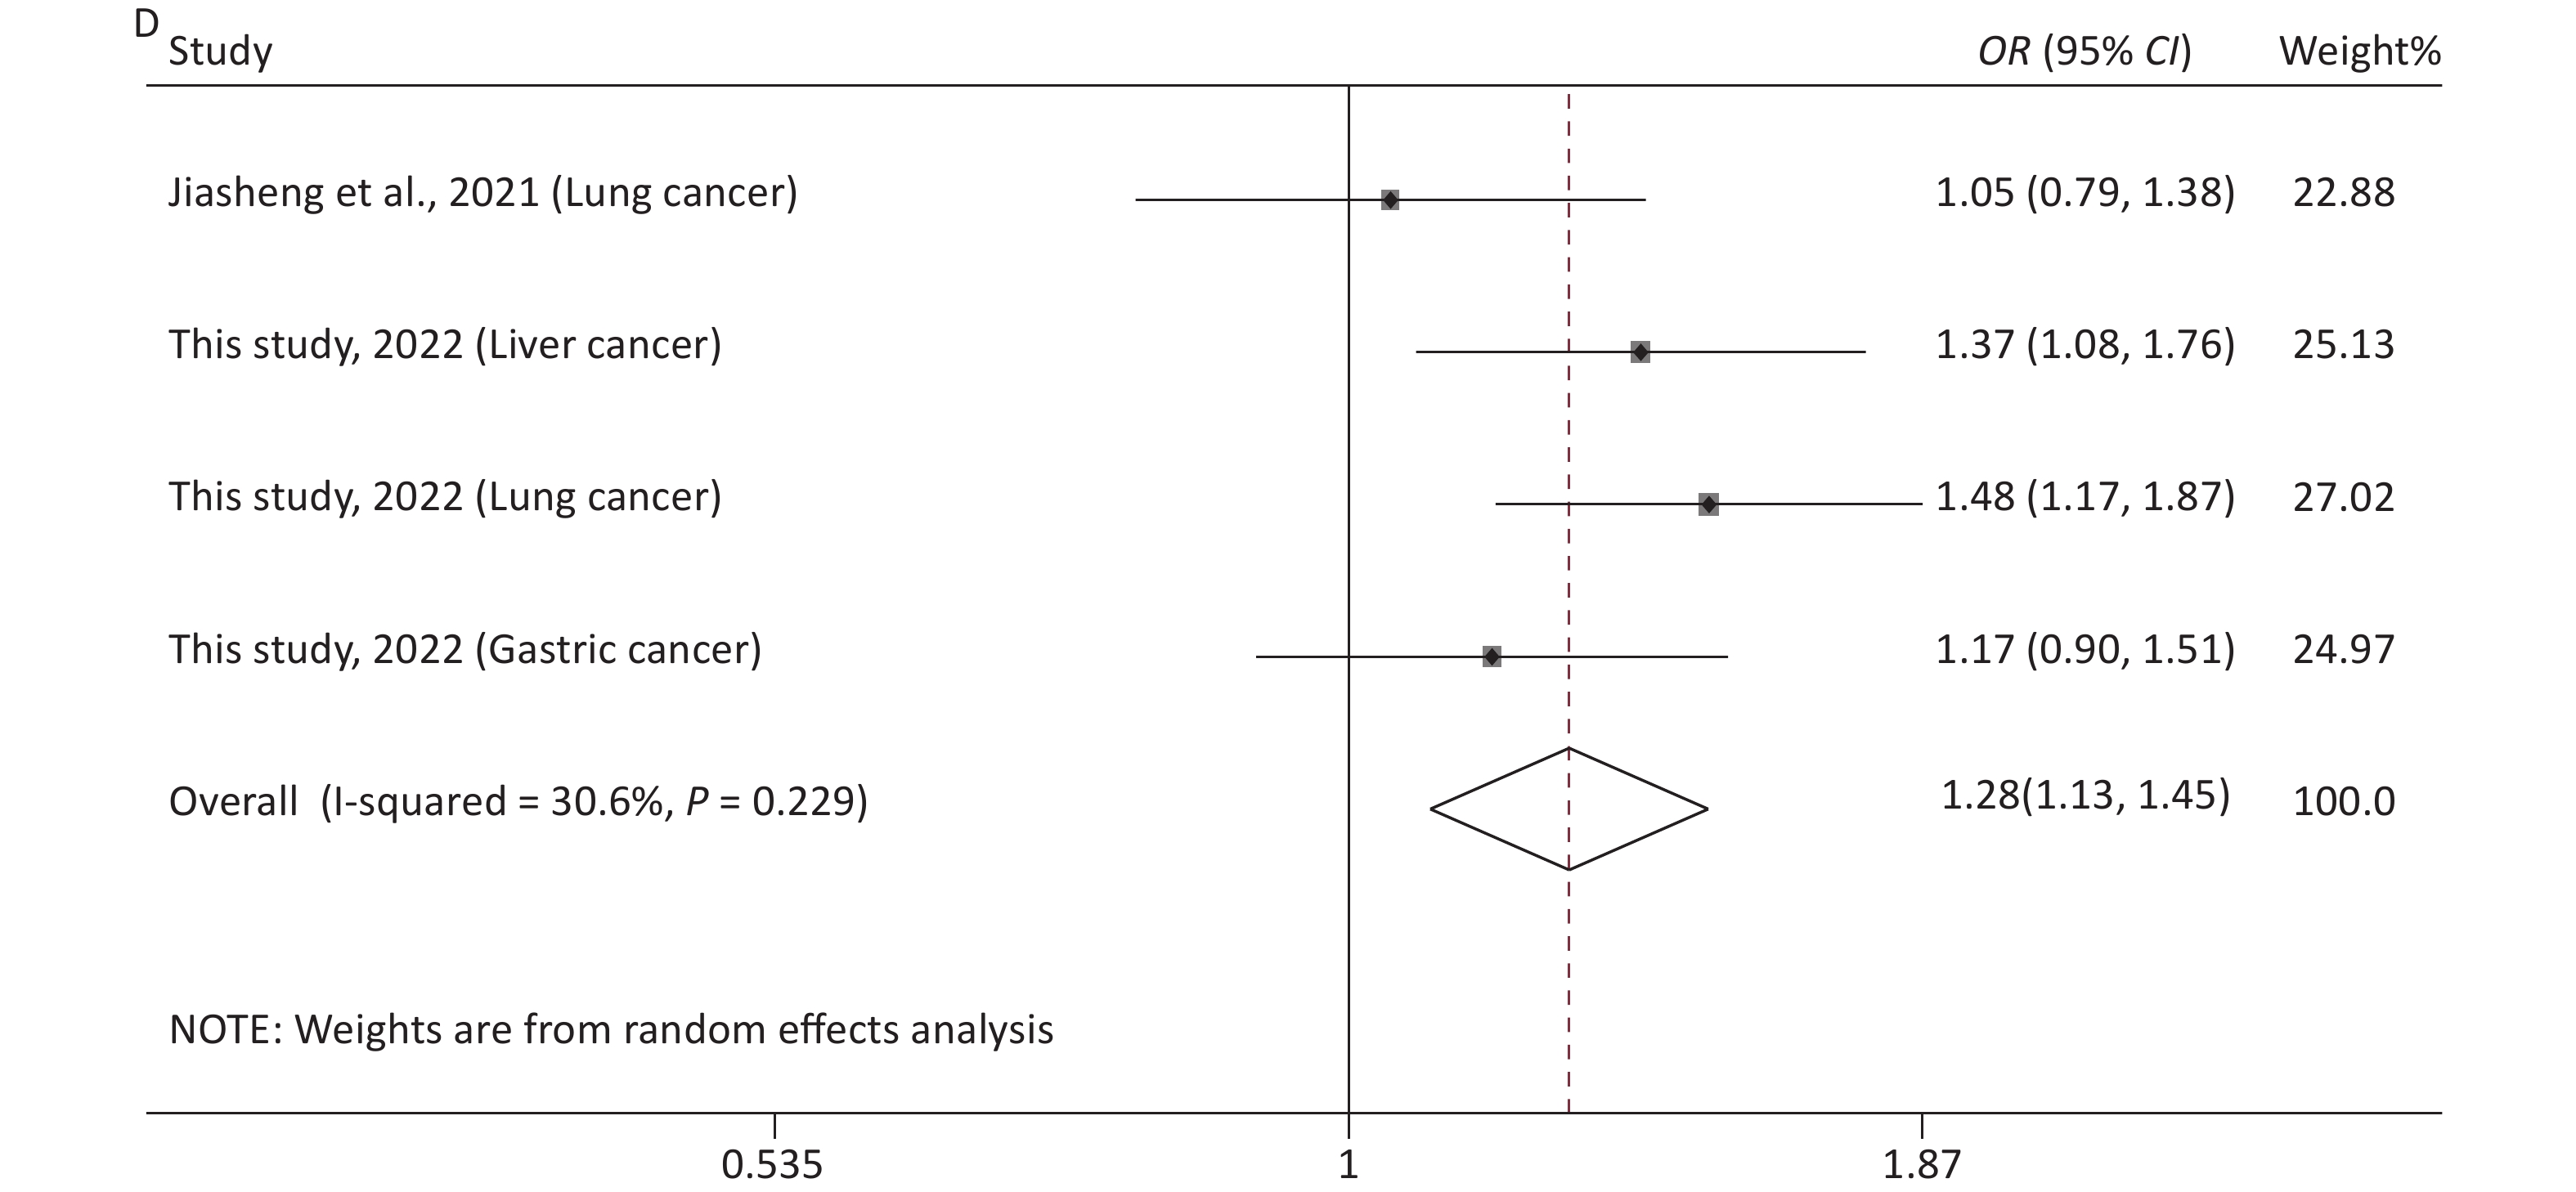
The main features of the included studies in the meta-analysis of rs12976445 and cancer susceptibility are presented in Supplementary Table S1. The statistical results are shown in Table 5 and Supplementary Figure S4 (available in www.besjournal.com). No significant association between rs12976445 and total cancer risk was observed. However, the stratified analysis by ethnicity revealed that rs12976445 was significantly associated with total cancer risk in the Chinese population under T vs. C, TT vs. TC, TT vs. CC, TT vs. TC + CC and TT + TC vs. CC. Moreover, the stratified analysis by cancer type identified a significant association between rs12976445 and lung cancer risk under TT vs. TC, TT vs. CC and TT vs. TC + CC.
Genetic model Heterogeneity test Pooled OR
(95% CI)Hypothesis test Begg's test Egger's test Studies
(n)Q P I2 Z P Z P Z P rs12976445 and cancer risk (2,791 case/3,699 control) T vs. C 18.78 0.009 62.7 1.09 (0.93−1.28) 1.10 0.273 1.61 0.108 −1.91 0.105 8 TT vs. TC 10.10 0.183 30.7 1.13 (0.92−1.39) 1.16 0.247 1.61 0.108 2.45 0.057 8 TT vs. CC 19.64 0.006 64.4 1.33 (0.81−2.18) 1.14 0.254 1.61 0.108 1.32 0.236 8 TC vs. CC 10.77 0.149 35.0 1.13 (0.99−1.28) 1.85 0.065 2.35 0.019 −2.28 0.063 8 TT vs. TC + CC 15.78 0.027 55.6 1.26 (0.89−1.79) 1.30 0.194 1.11 0.266 2.15 0.075 8 TT + TC vs. CC 14.09 0.050 50.3 1.11 (0.92−1.34) 1.06 0.288 1.91 0.051 −2.41 0.061 8 rs12976445 and cancer risk in Asian population (2,616 case/3,570 control) T vs. C 18.74 0.005 68.0 1.09 (0.91−1.30) 0.95 0.340 1.80 0.072 −1.98 0.104 7 TT vs. TC 10.02 0.124 40.1 1.12 (0.89−1.41) 0.94 0.348 1.50 0.133 2.48 0.056 7 TT vs. CC 19.57 0.003 69.3 1.40 (0.79−2.45) 1.16 0.248 0.90 0.368 1.28 0.258 7 TC vs. CC 10.48 0.106 42.7 1.13 (1.00−1.29) 1.91 0.057 1.85 0.058 −2.52 0.054 7 TT vs. TC + CC 15.72 0.015 61.8 1.33 (0.86−2.06) 1.29 0.198 0.90 0.368 2.02 0.099 7 TT + TC vs. CC 13.89 0.031 56.8 1.11 (0.91−1.36) 1.02 0.309 1.87 0.055 −1.91 0.112 7 rs12976445 and cancer risk in Chinese population (1,993 case/2,948 control) T vs. C 4.32 0.229 30.6 1.28 (1.13−1.45) 3.81 < 0.001 1.70 0.089 −2.45 0.057 4 TT vs. TC 1.39 0.708 < 0.001 2.29 (1.34−3.89) 3.05 0.002 −0.34 1.000 1.23 0.345 4 TT vs. CC 1.20 0.754 < 0.001 2.79 (1.66−4.71) 3.86 < 0.001 −0.34 1.000 0.44 0.700 4 TC vs. CC 4.41 0.221 32.0 1.19 (1.03−1.37) 2.35 0.019 1.70 0.089 −2.25 0.060 4 TT vs. TC + CC 1.20 0.752 < 0.001 2.68 (1.59−4.51) 3.71 < 0.001 −0.34 1.000 0.59 0.614 4 TT + TC vs. CC 4.61 0.203 34.9 1.25 (1.09−1.43) 3.12 0.002 1.70 0.089 −2.25 0.060 4 rs12976445 and cancer risk in Iranian population (523 case/522 control) T vs. C 0.33 0.563 < 0.001 1.00 (0.84−1.19) 0.01 0.994 − − − − 2 TT vs. TC 0.40 0.528 < 0.001 0.95 (0.72−1.27) 0.33 0.742 − − − − 2 TT vs. CC 0.46 0.497 < 0.001 1.00 (0.69−1.46) 0.01 0.994 − − − − 2 TC vs. CC 0.03 0.859 < 0.001 1.07 (0.77−1.49) 0.38 0.705 − − − − 2 TT vs. TC + CC 0.48 0.489 < 0.001 0.97 (0.74−1.27) 0.23 0.819 − − − − 2 TT + TC vs. CC 0.14 0.713 < 0.001 1.04 (0.76−1.43) 0.25 0.799 − − − − 2 rs12976445 and prostate cancer risk (250 case/250 control) T vs. C 2.21 0.137 54.7 0.79 (0.62−1.02) 1.84 0.066 − − − − 2 TT vs. TC 0.01 0.917 < 0.001 0.82 (0.53−1.27) 0.87 0.383 − − − − 2 TT vs. CC 2.01 0.156 50.2 0.61 (0.37−1.01) 1.94 0.052 − − − − 2 TC vs. CC 2.88 0.090 65.2 0.72 (0.33−1.56) 0.83 0.407 − − − − 2 TT vs. TC + CC 0.24 0.623 < 0.001 0.74 (0.49−1.11) 1.45 0.146 − − − − 2 TT + TC vs. CC 3.33 0.068 70.0 0.67 (0.31−1.47) 1.00 0.319 − − − − 2 rs12976445 and lung cancer risk (1,053 case/1,348 control) T vs. C 3.52 0.061 71.6 1.26 (0.89−1.76) 1.32 0.188 − − − − 2 TT vs. TC 0.48 0.490 < 0.001 2.99 (1.36−6.61) 2.71 0.007 − − − − 2 TT vs. CC 0.07 0.789 < 0.001 3.65 (1.67−7.97) 3.24 0.001 − − − − 2 TC vs. CC 3.68 0.055 72.8 1.13 (0.76−1.66) 0.60 0.546 − − − − 2 TT vs. TC + CC 0.13 0.719 < 0.001 3.49 (1.60−7.61) 3.14 0.002 − − − − 2 TT + TC vs. CC 3.86 0.050 74.1 1.20 (0.82−1.77) 0.93 0.353 − − − − 2 rs12976445 and total cancer risk based on PCR-RFLP (1,915 case/2,779 control) T vs. C 17.38 0.004 71.2 1.10 (0.88−1.38) 0.87 0.385 1.86 0.057 −2.67 0.052 6 TT vs. TC 6.36 0.273 21.4 1.16 (0.88−1.54) 1.08 0.282 0.75 0.452 1.67 0.171 6 TT vs. CC 16.81 0.005 70.3 1.27 (0.67−2.43) 0.72 0.469 1.13 0.260 1.61 0.184 6 TC vs. CC 8.50 0.131 41.1 1.19 (1.02−1.38) 2.28 0.023 1.86 0.057 −2.77 0.050 6 TT vs. TC + CC 12.43 0.029 59.8 1.28 (0.81−2.01) 1.06 0.291 0.38 0.707 1.80 0.146 6 TT + TC vs. CC 12.21 0.032 59.1 1.12 (0.87−1.44) 0.88 0.381 1.88 0.060 −2.61 0.053 6 Table 5. Meta-analysis of the association between rs12976445 and cancer risk
-
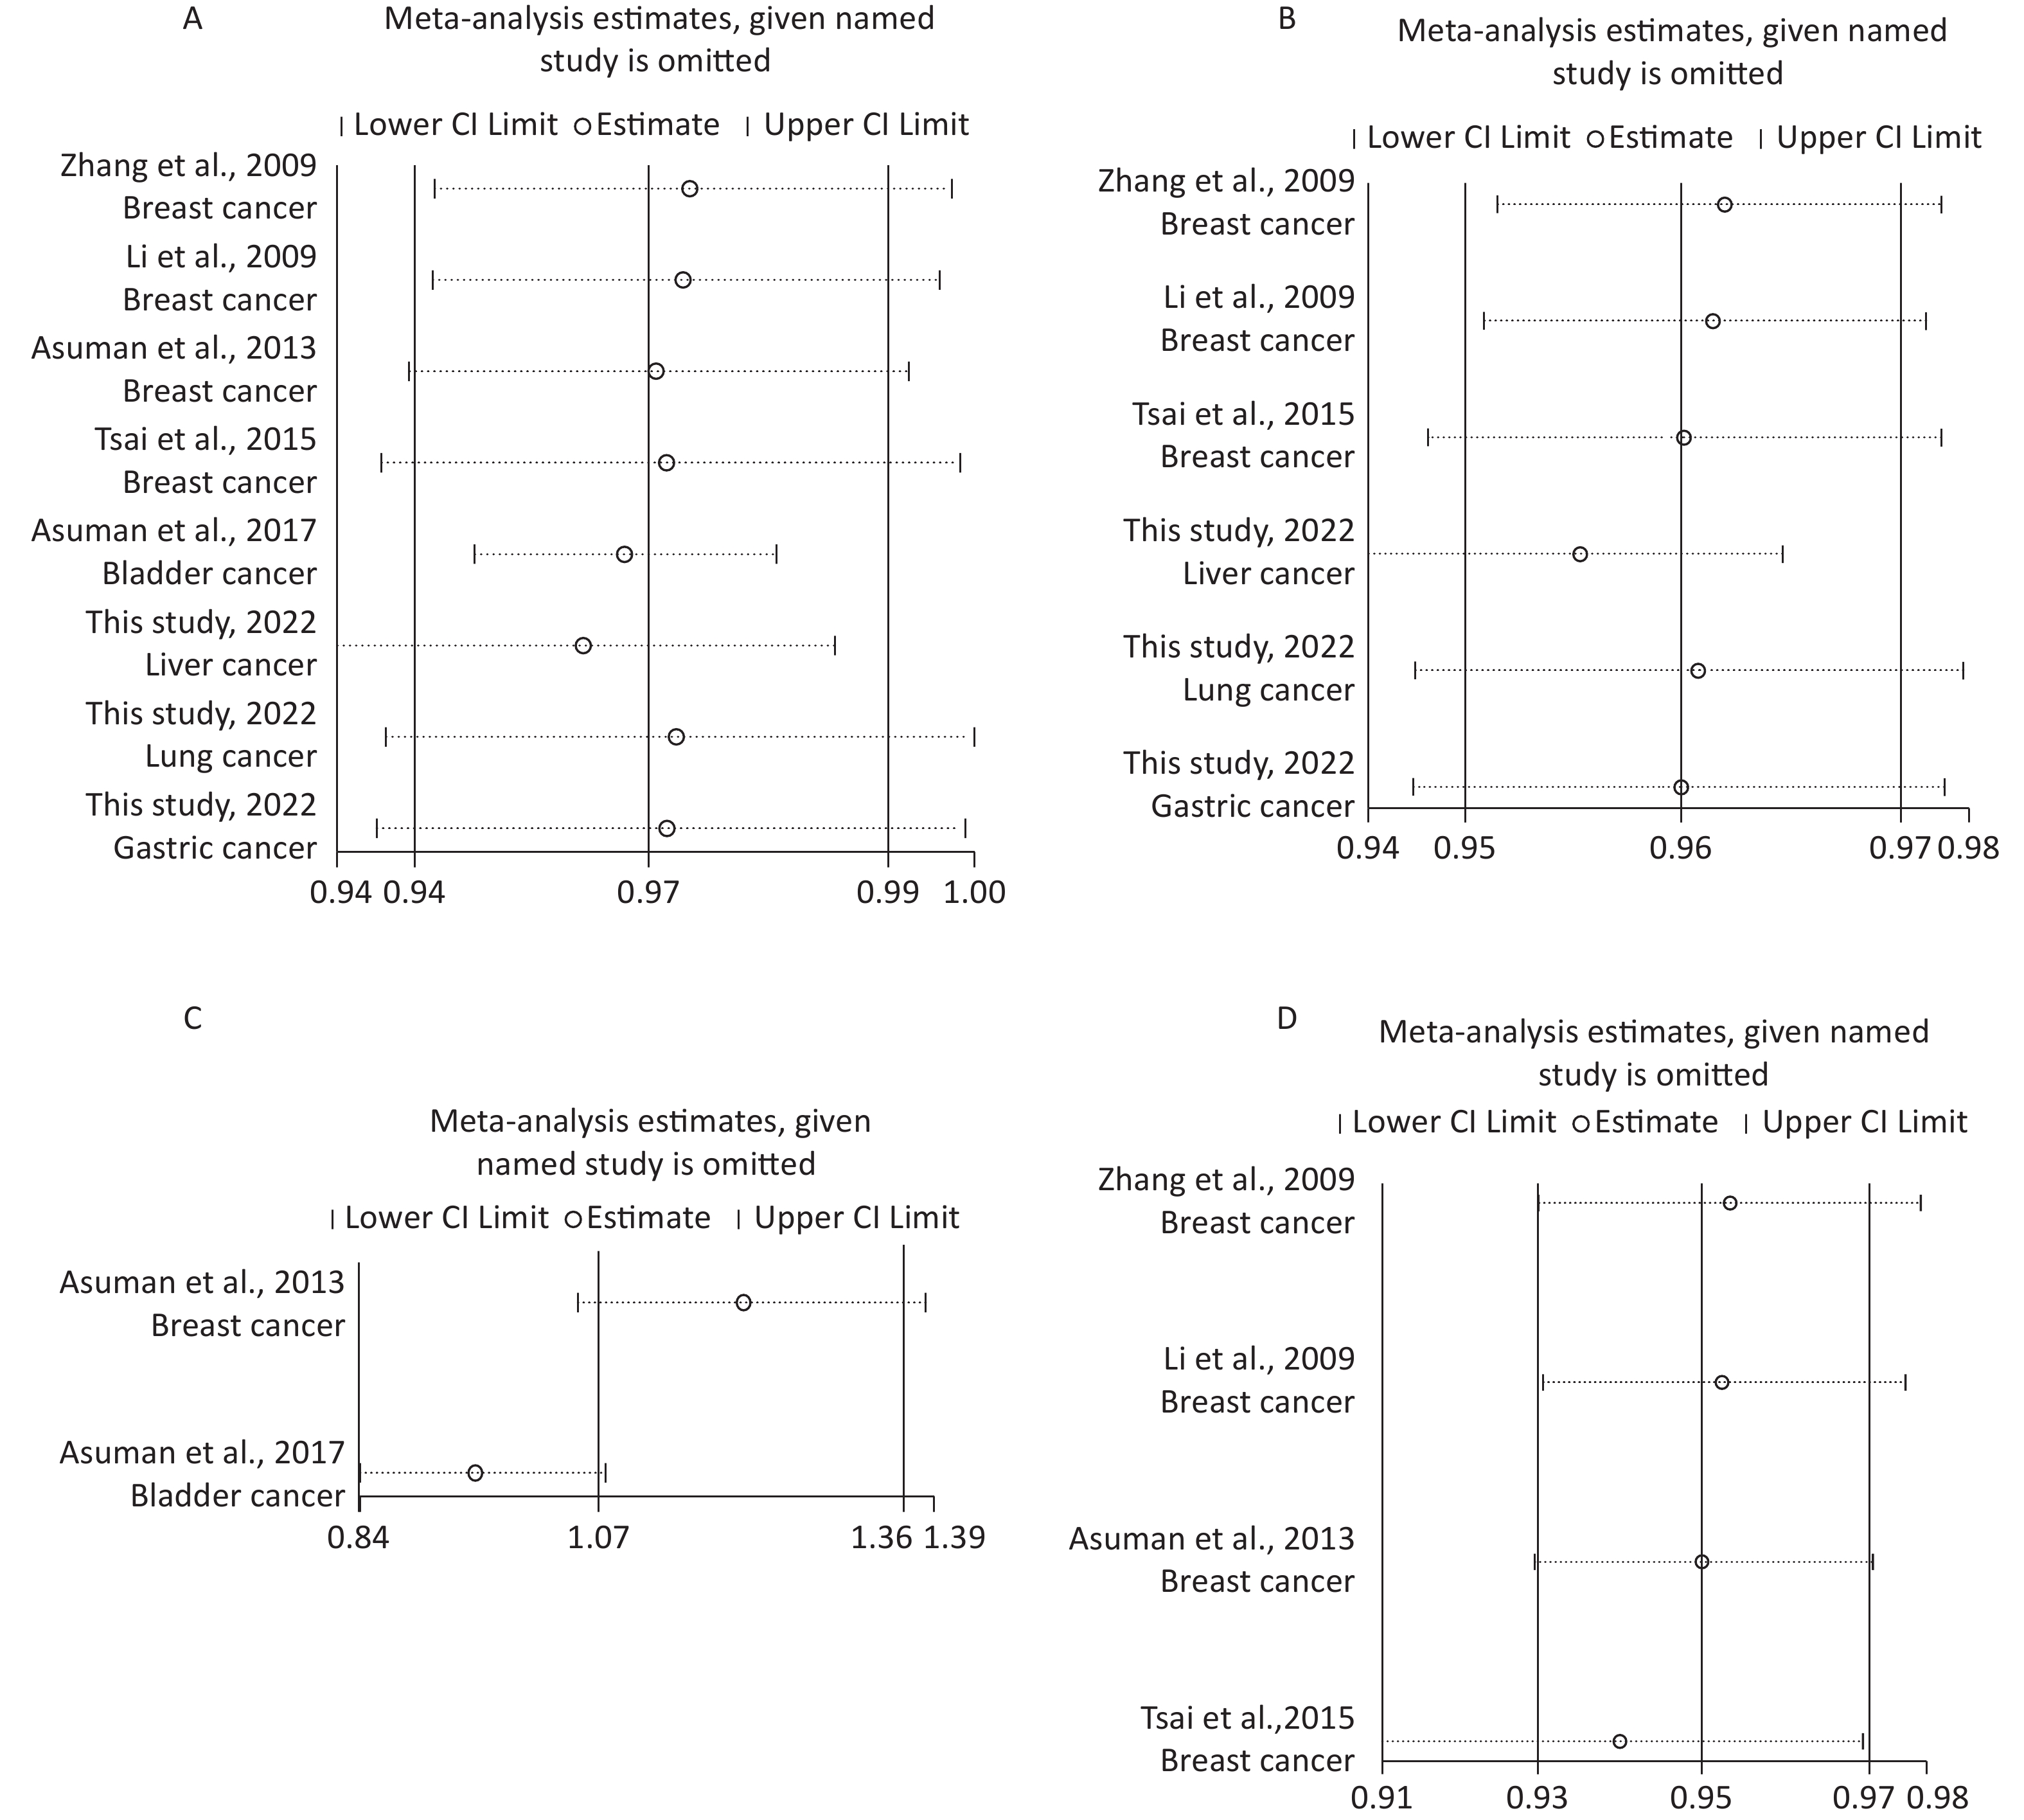
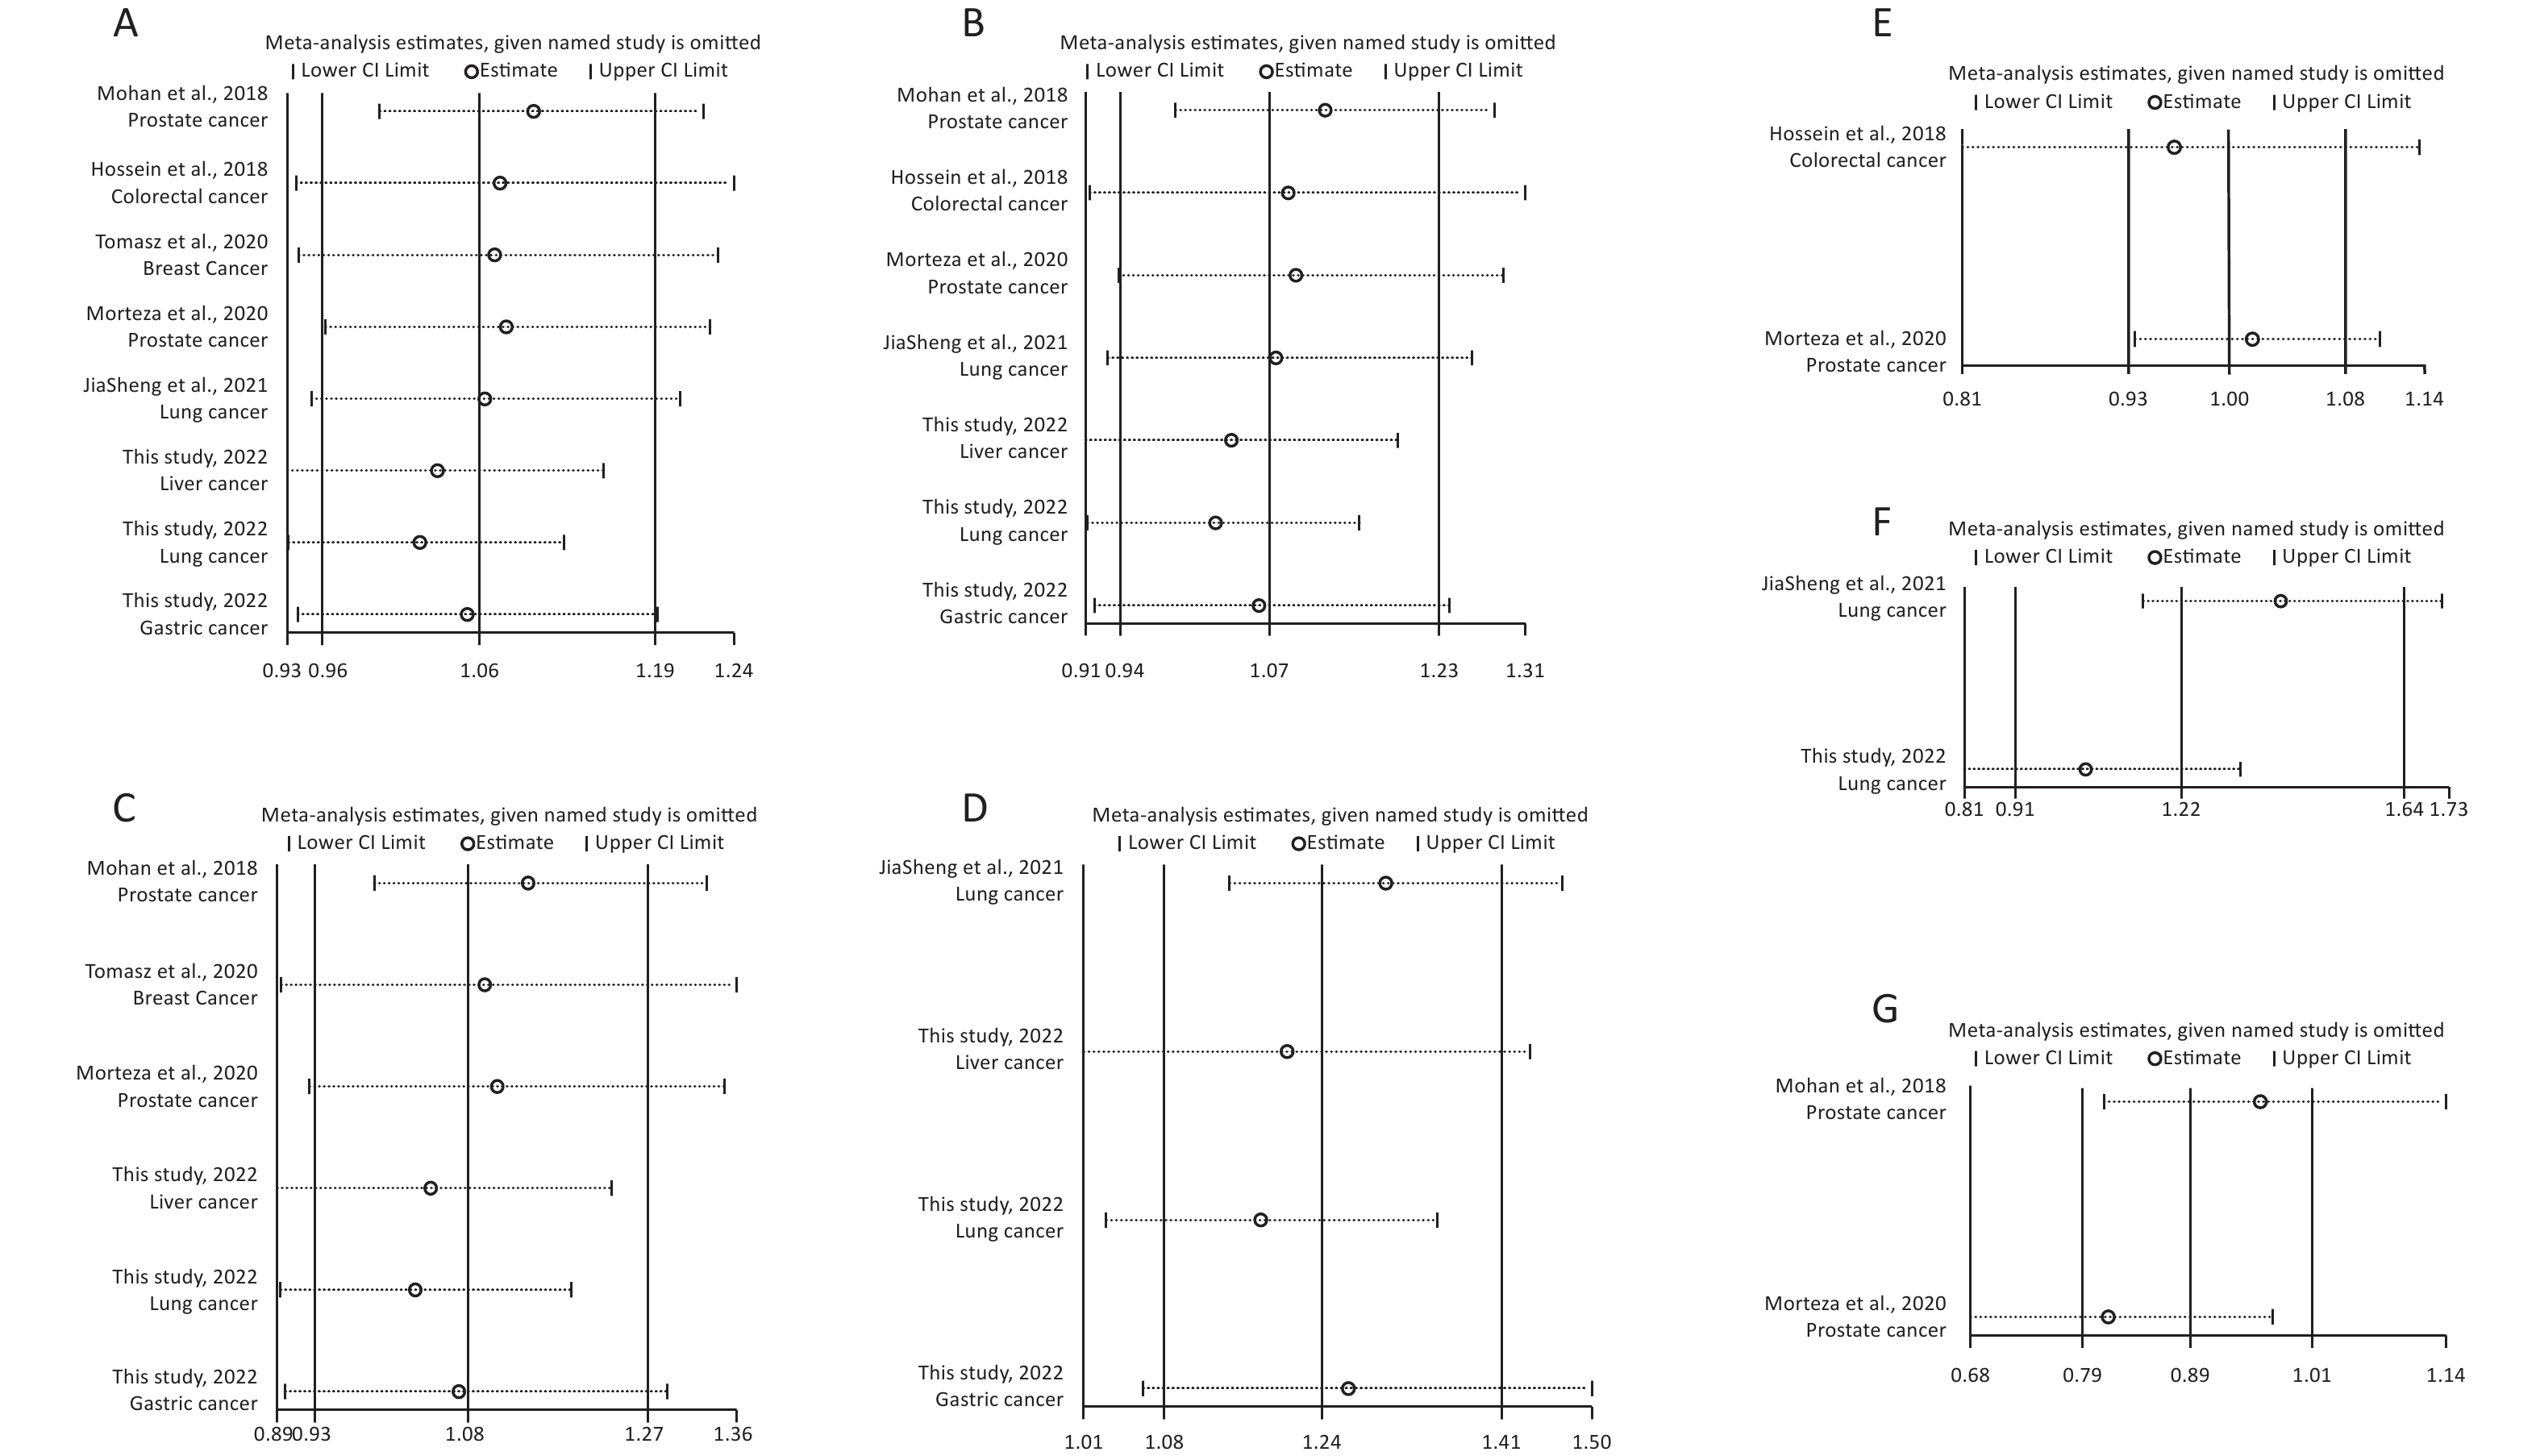
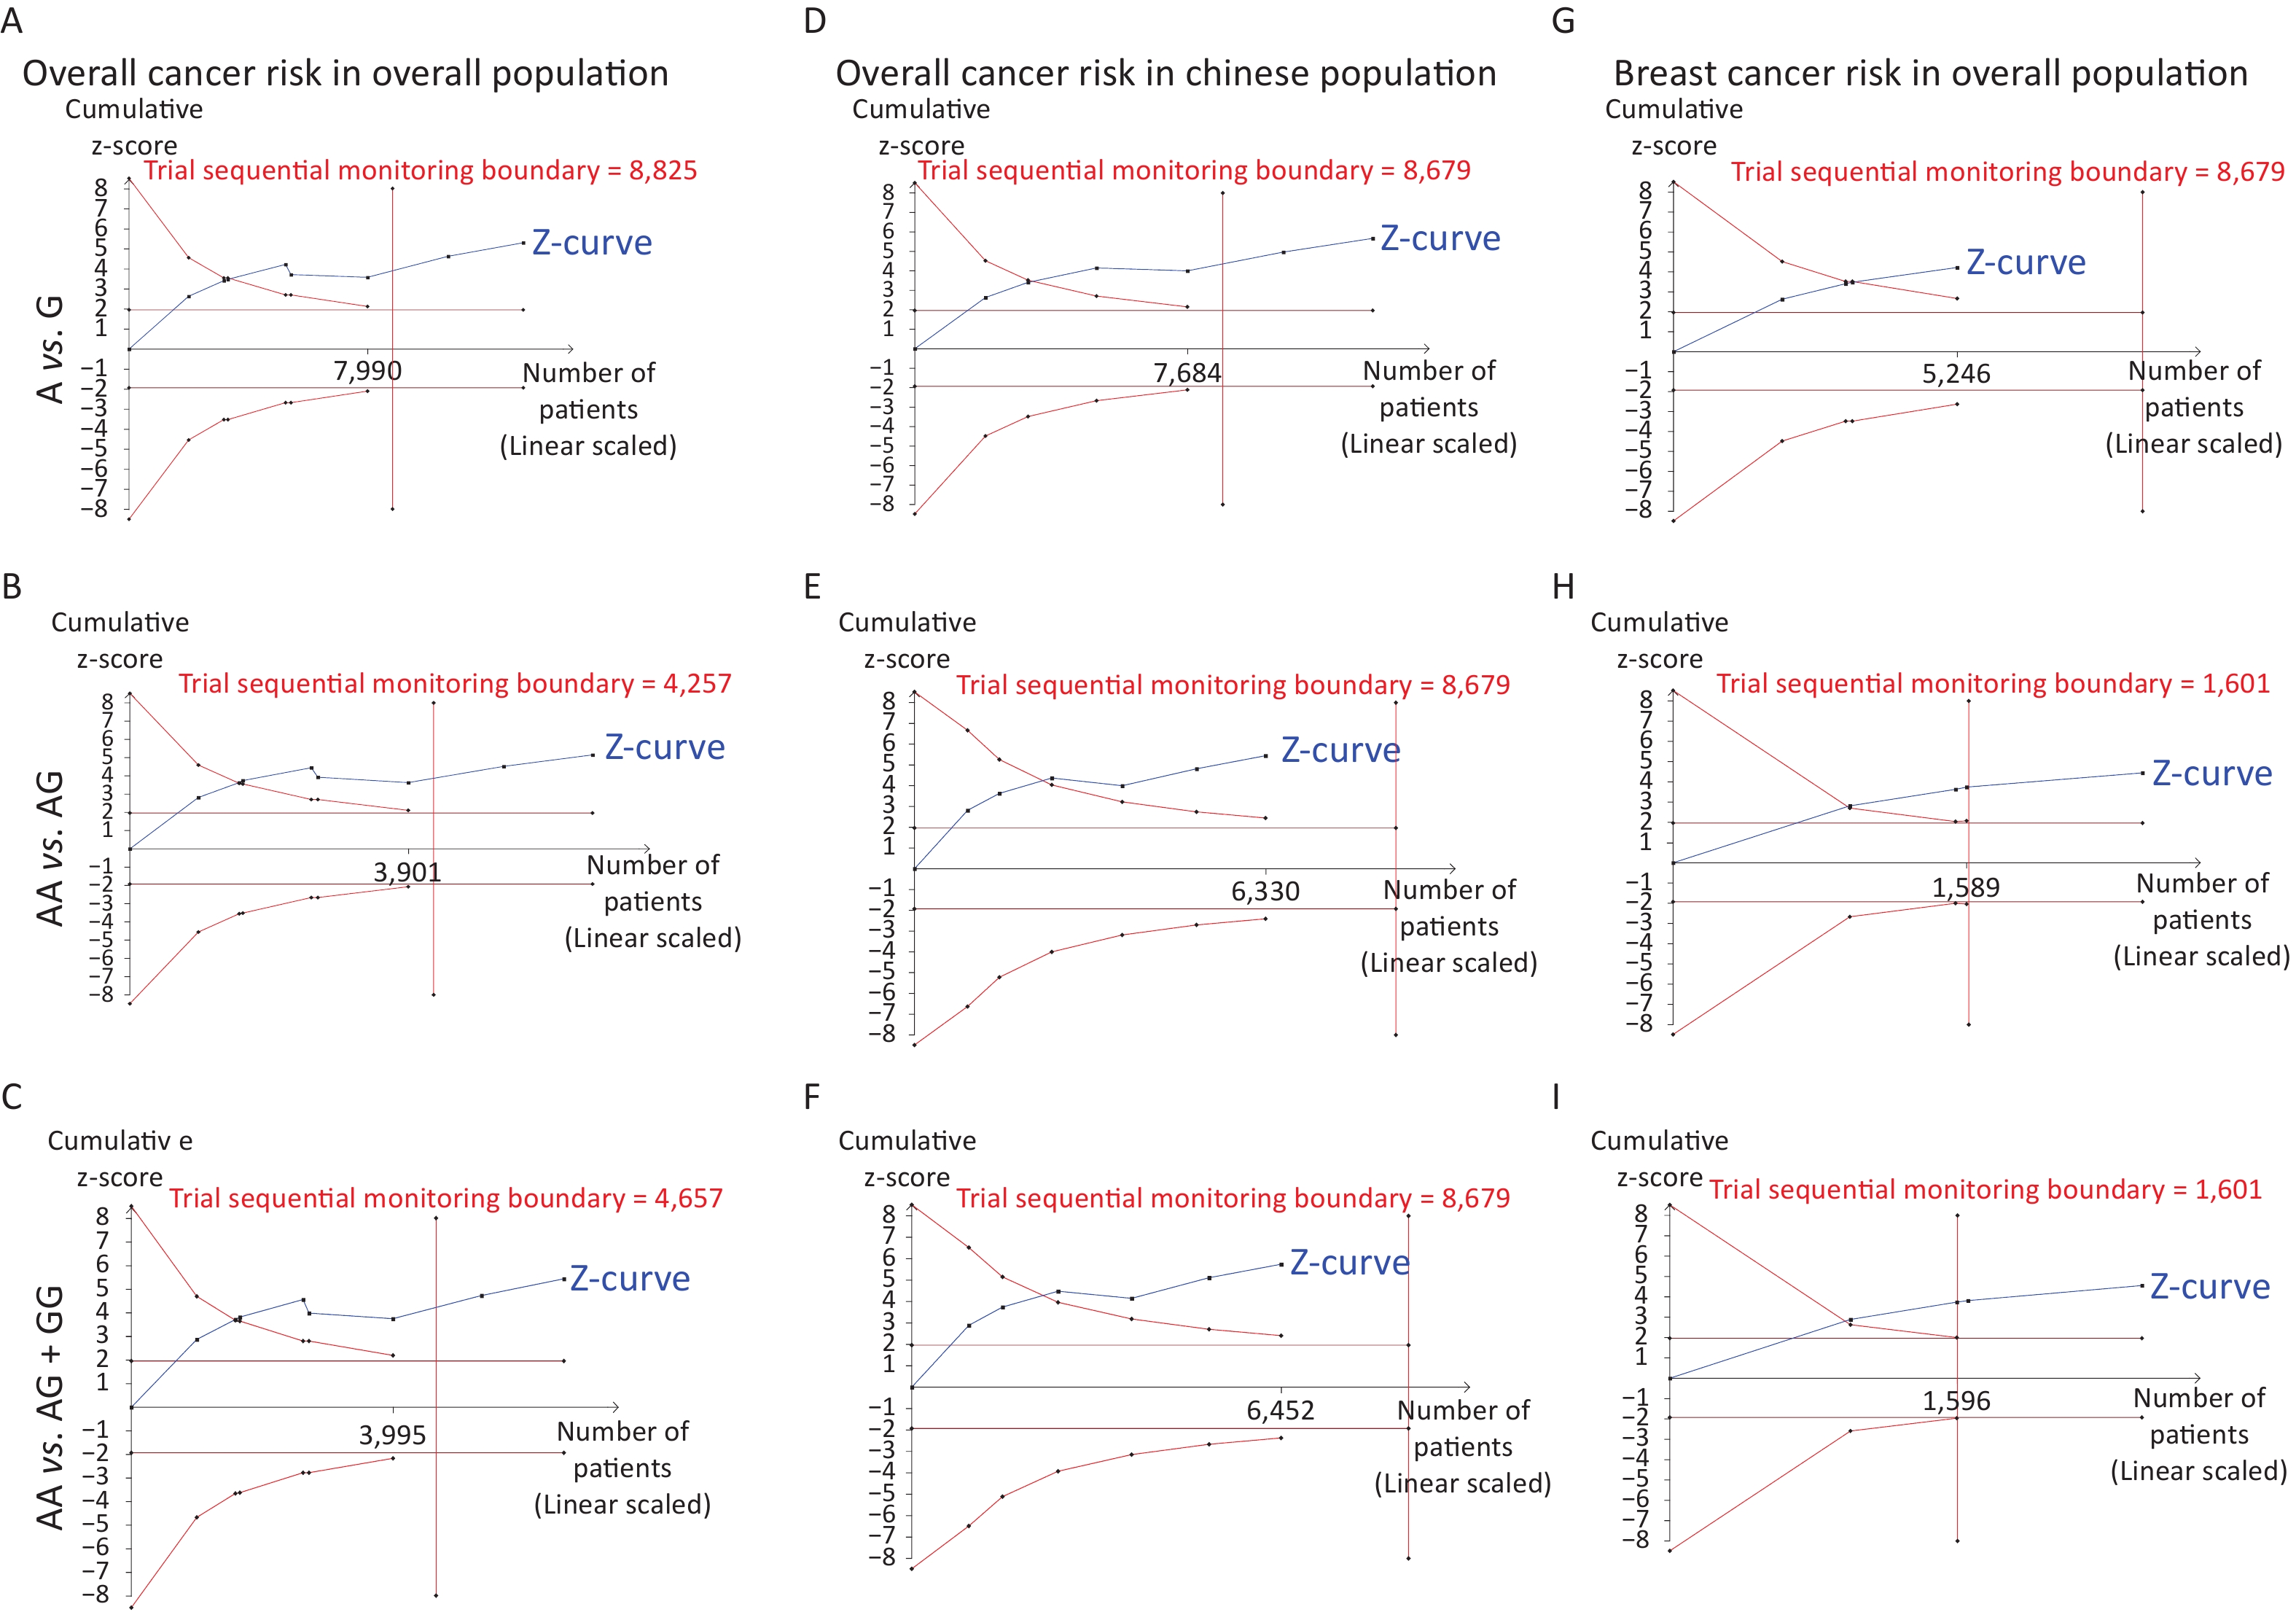
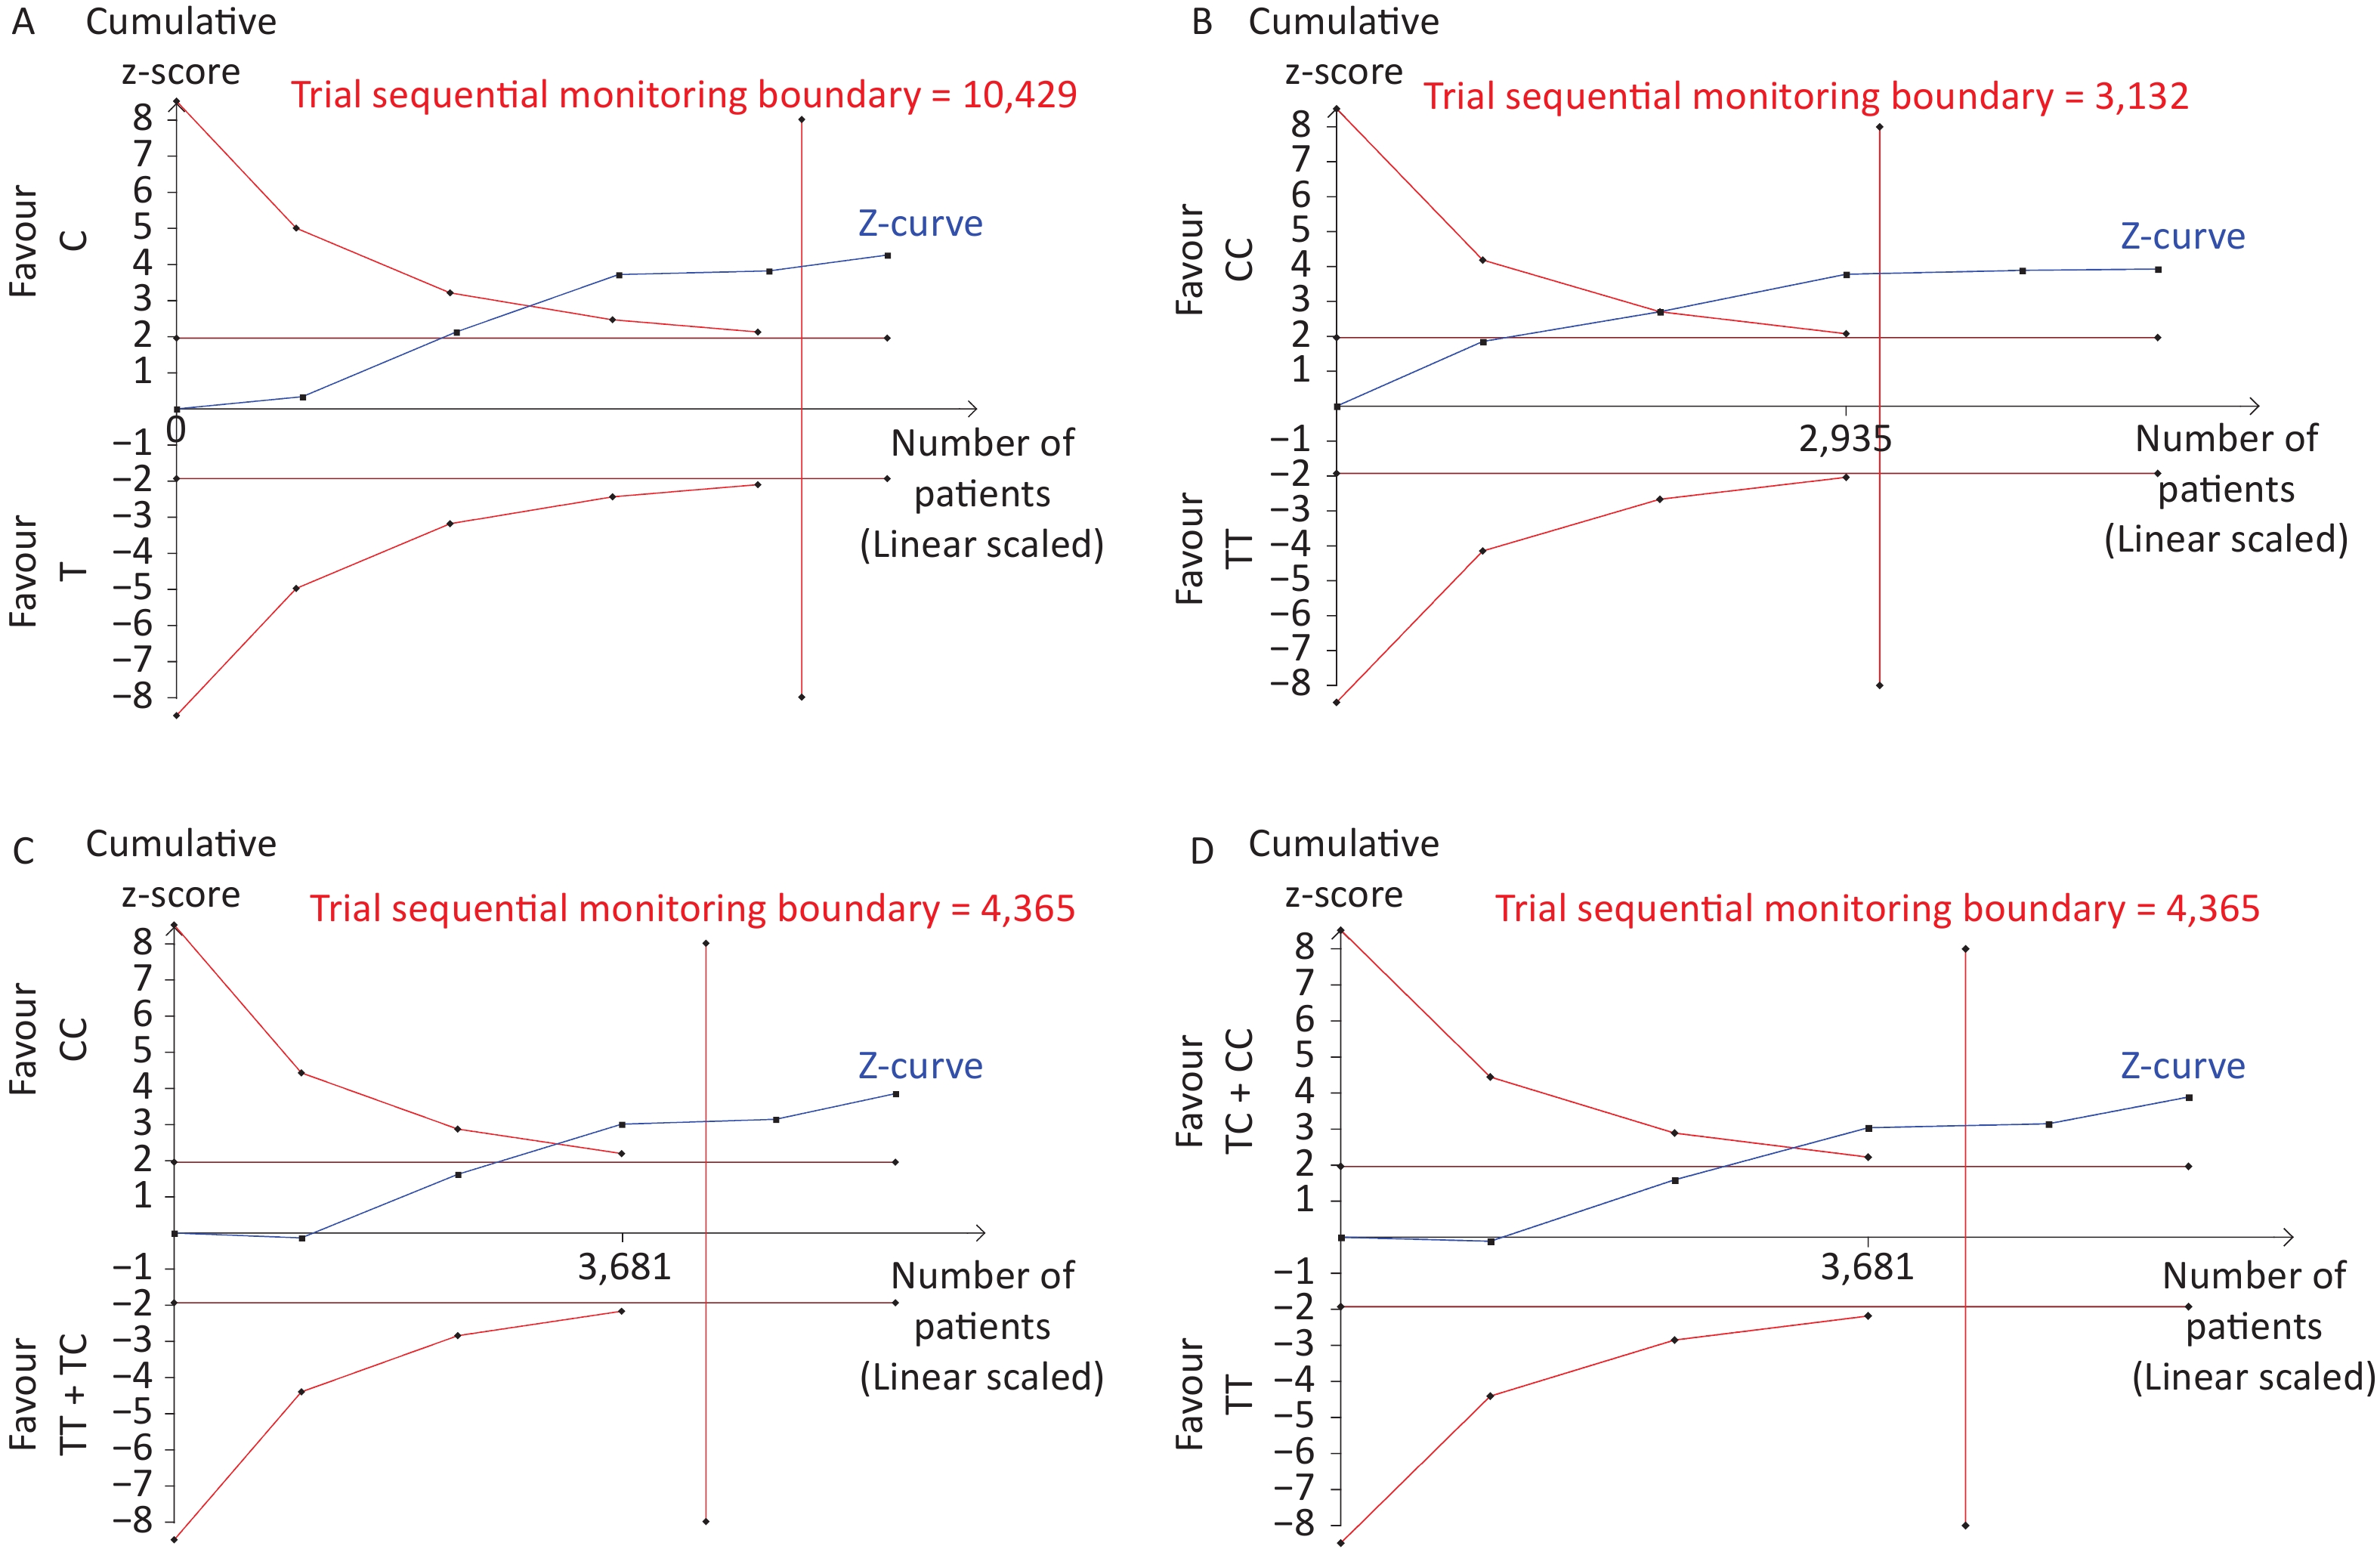
Removal of any single case-control study from the analysis of rs10754339 and rs12976445 in the allele model did not significantly affect the consistency of pooled ORs (Figures 1–2). Moreover, potential publication bias was assessed for rs10754339 and rs12976445, and the results did not show any evidence of publication bias in any of the genetic comparisons (Tables 4–5), suggesting the statistical results were credible. As shown in Figures 3–4, the cumulative Z-curves crossed both the traditional boundary (Z = 1.96) and trial sequential monitoring boundary in the TSA of rs10754339 and cancer risk, as well as in the TSA of rs12976445 and cancer risk, indicating that true positive results could be obtained.

Figure 1. Sensitivity analysis of rs10754339 and overall cancer risk under A vs. G in the total population (A), Chinese population (B) and Caucasian population (C). Sensitivity analysis of rs10754339 and breast cancer risk under A vs. G (D).
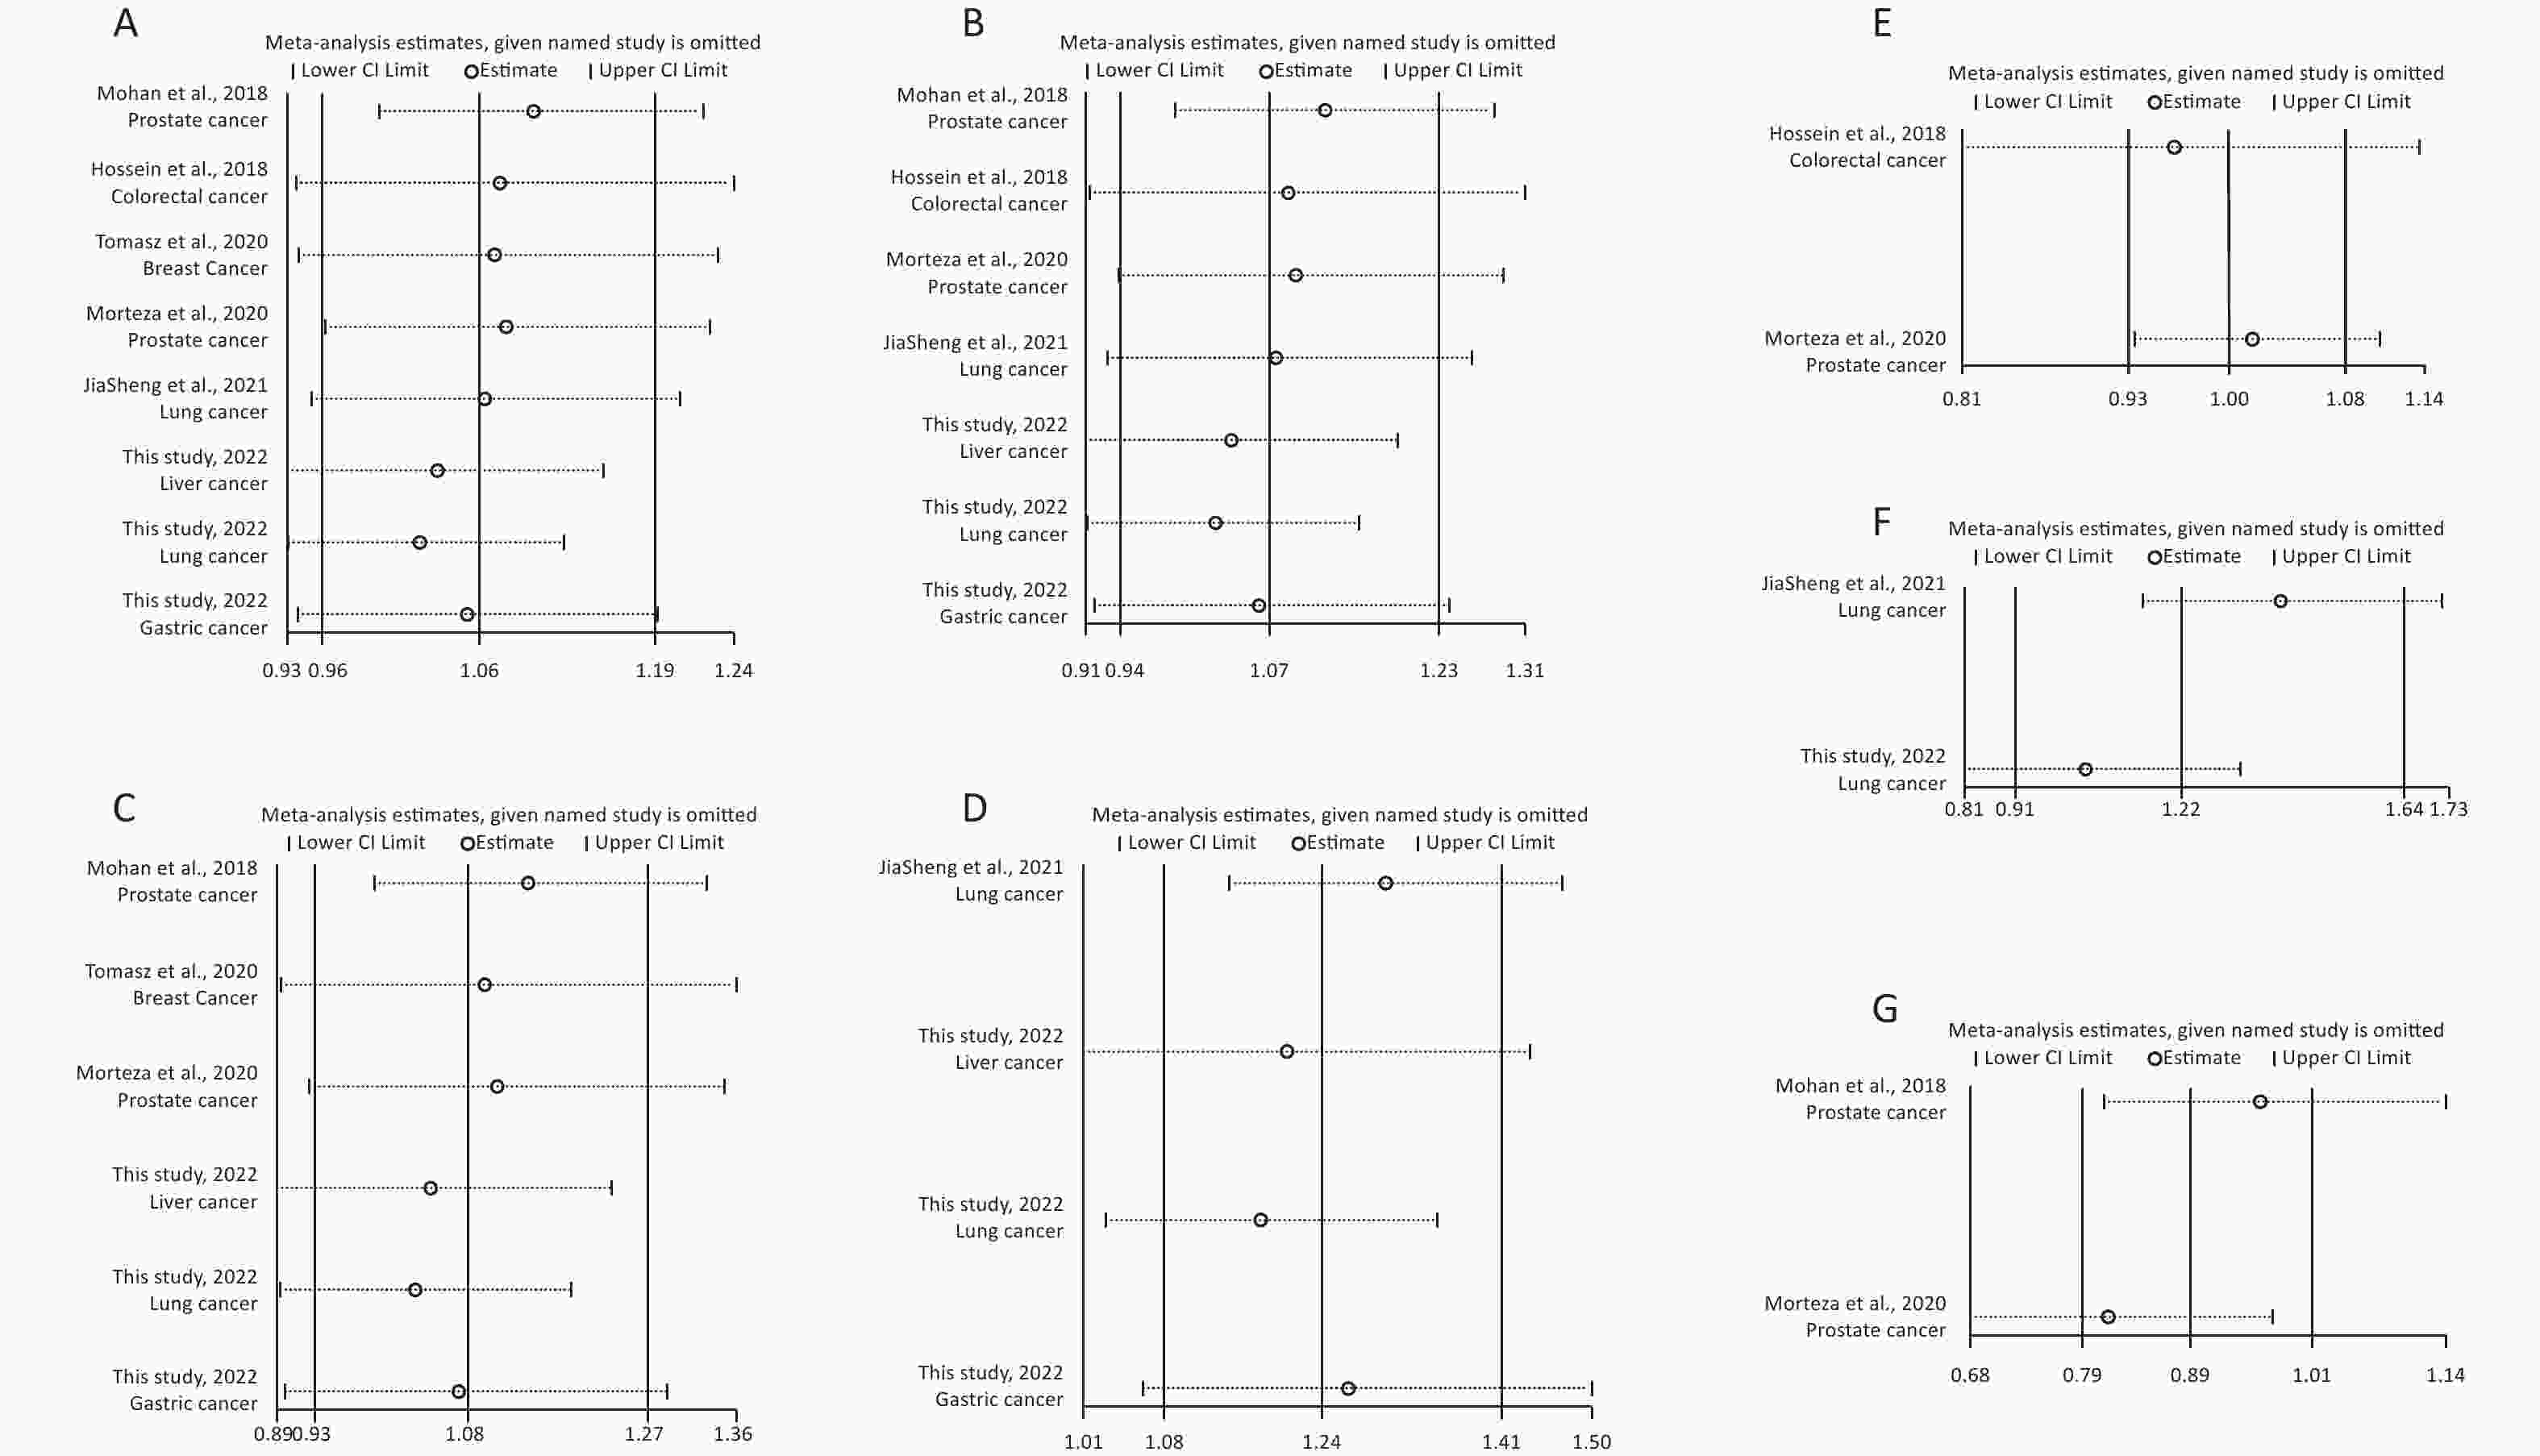
Figure 2. Sensitivity analysis of rs12976445 and overall cancer risk under T vs. C in the total population (A), in the Asian population (B), based on PCR-RFLP (C), in the Chinese population (D) and in the Iranian population (E). Sensitivity analysis of rs12976445 and specific cancer risk (F) lung cancer; (G) prostate cancer.
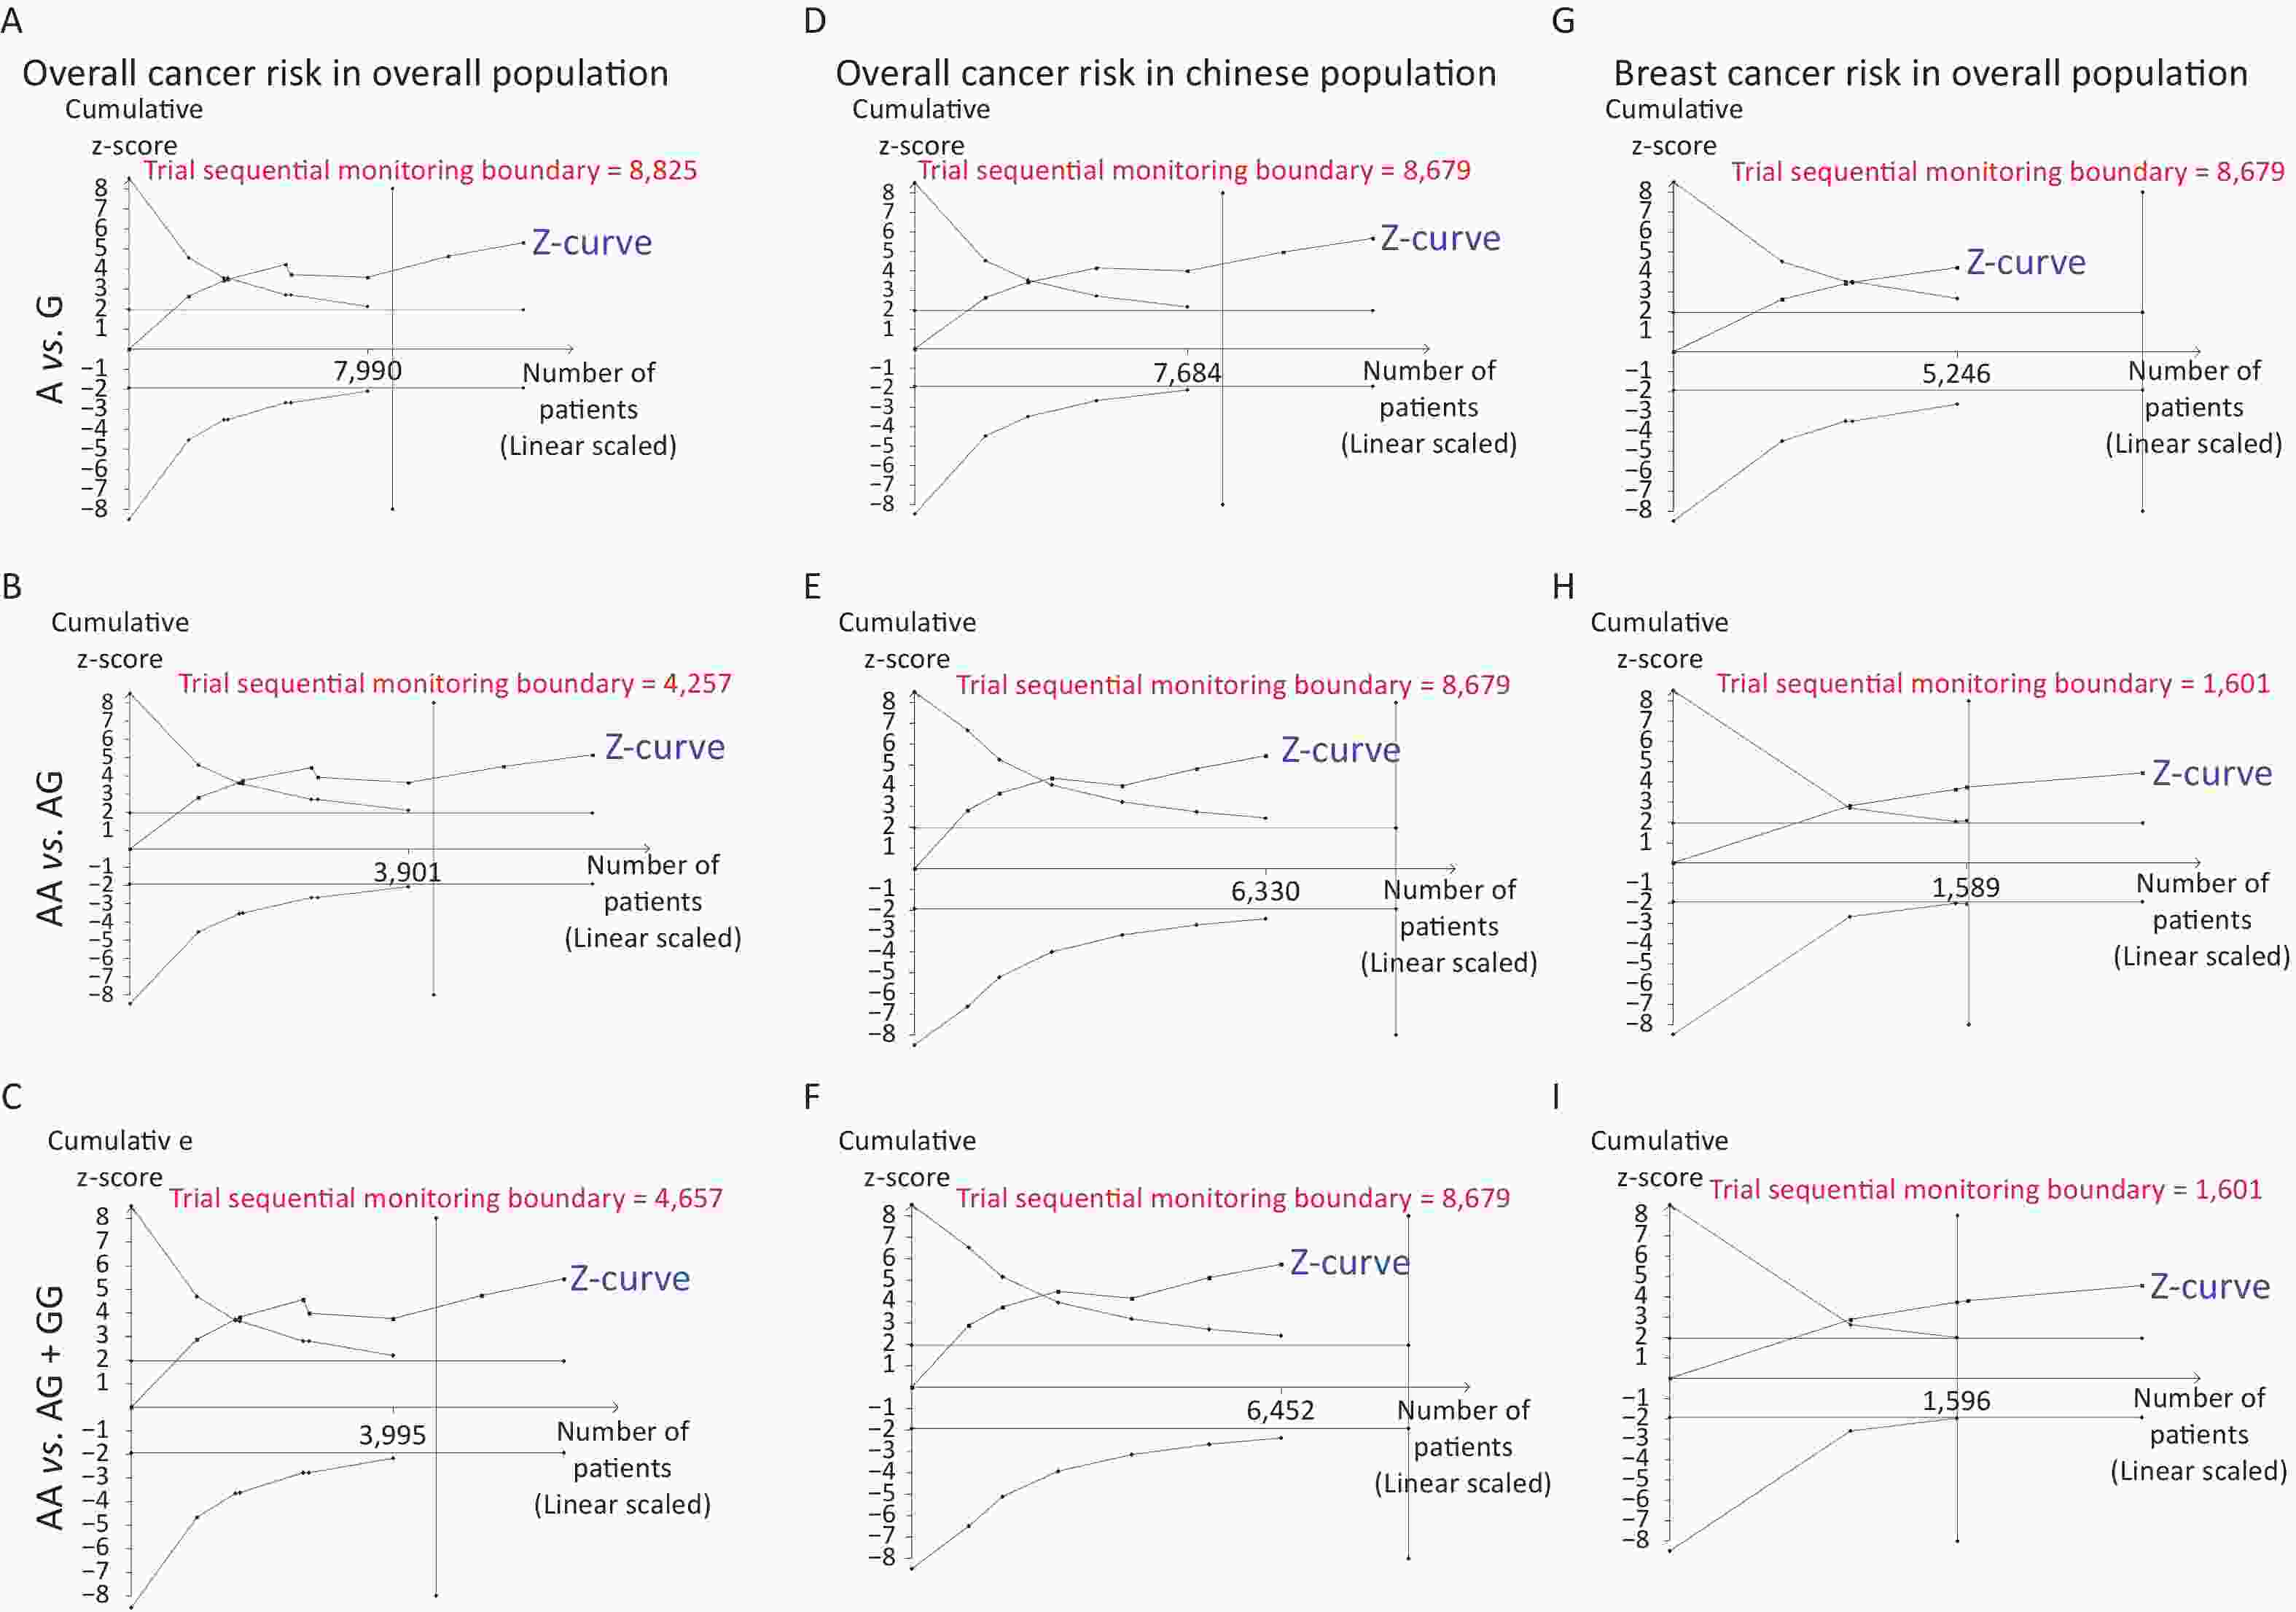
Figure 3. Trial sequential analysis of rs10754339 and overall cancer risk in the total population [(A) A vs. G, (B) AA vs. AG, and (C) AA vs. AG + GG] and the Chinese population [(D) A vs. G, (E) AA vs. AG, and (F) AA vs. AG + GG], trial sequential analysis of rs10754339 and breast cancer risk [(G) A vs. G, (H) AA vs. AG, and (I) AA vs. AG + GG].
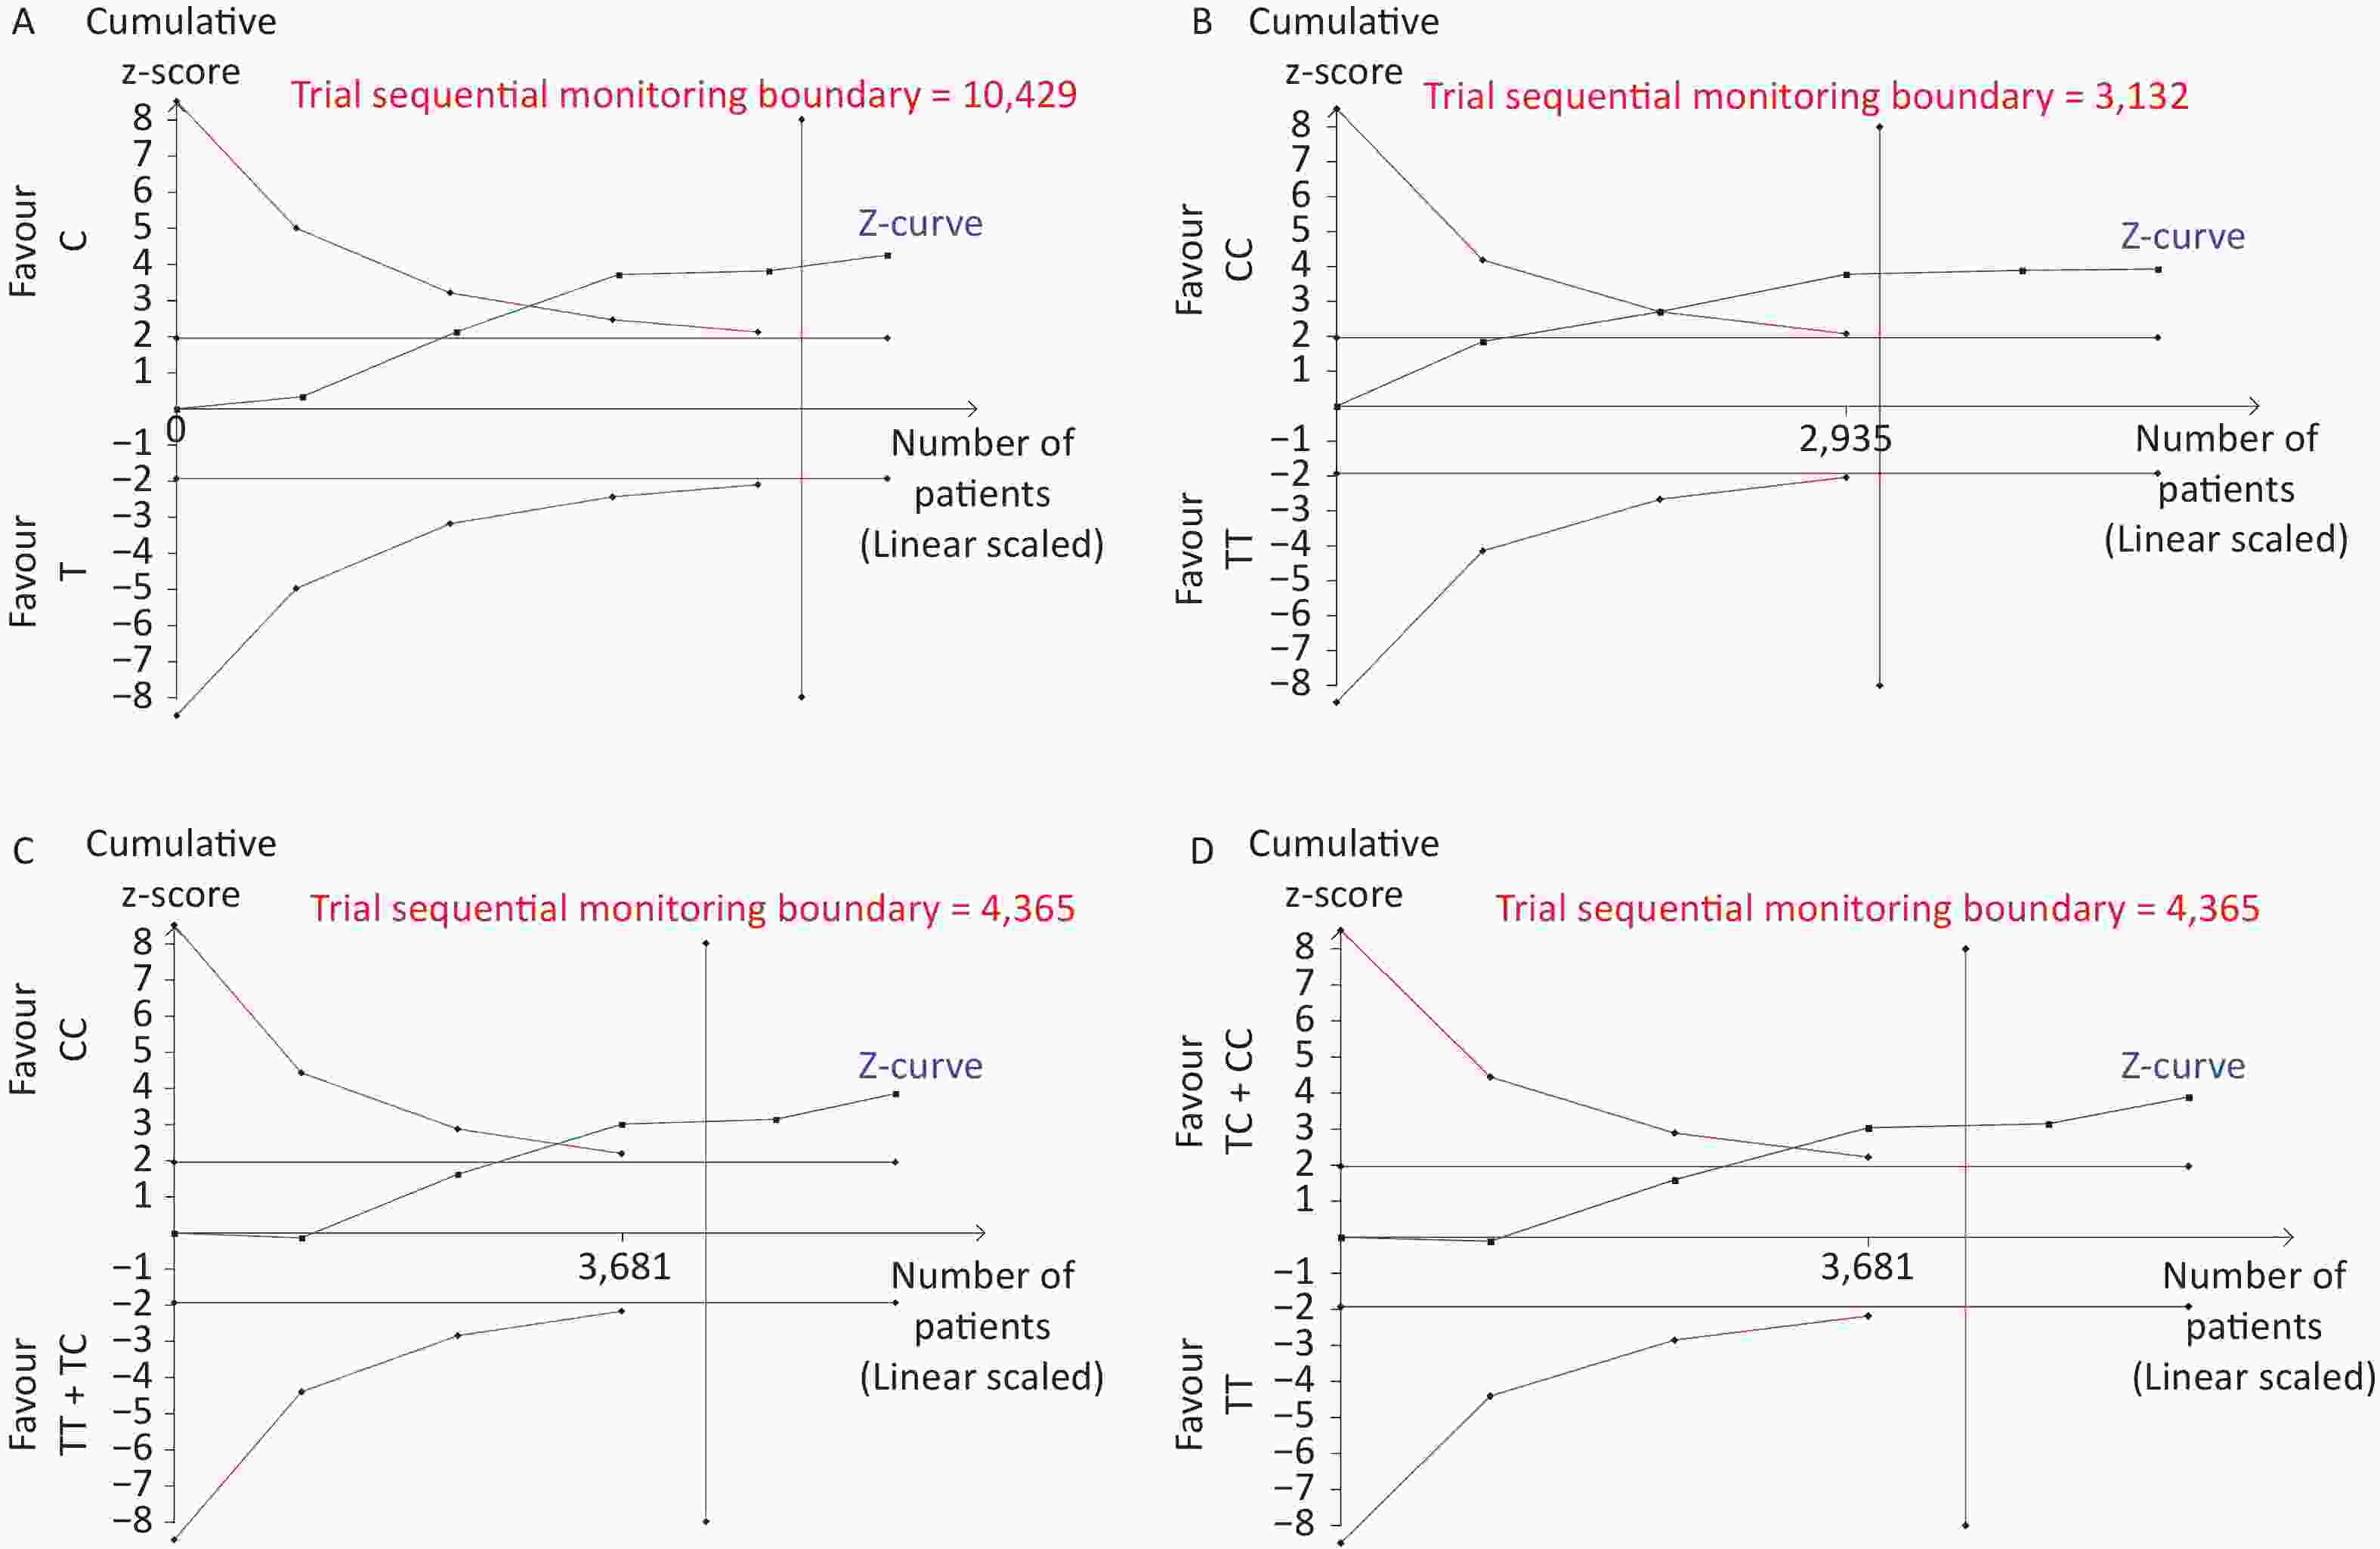
Figure 4. Trial sequential analysis of rs12976445 and overall cancer risk in the Chinese population under T vs. C (A), TT vs. CC (B), TT + TC vs. CC (C), and TT vs. TC + CC (D).
-
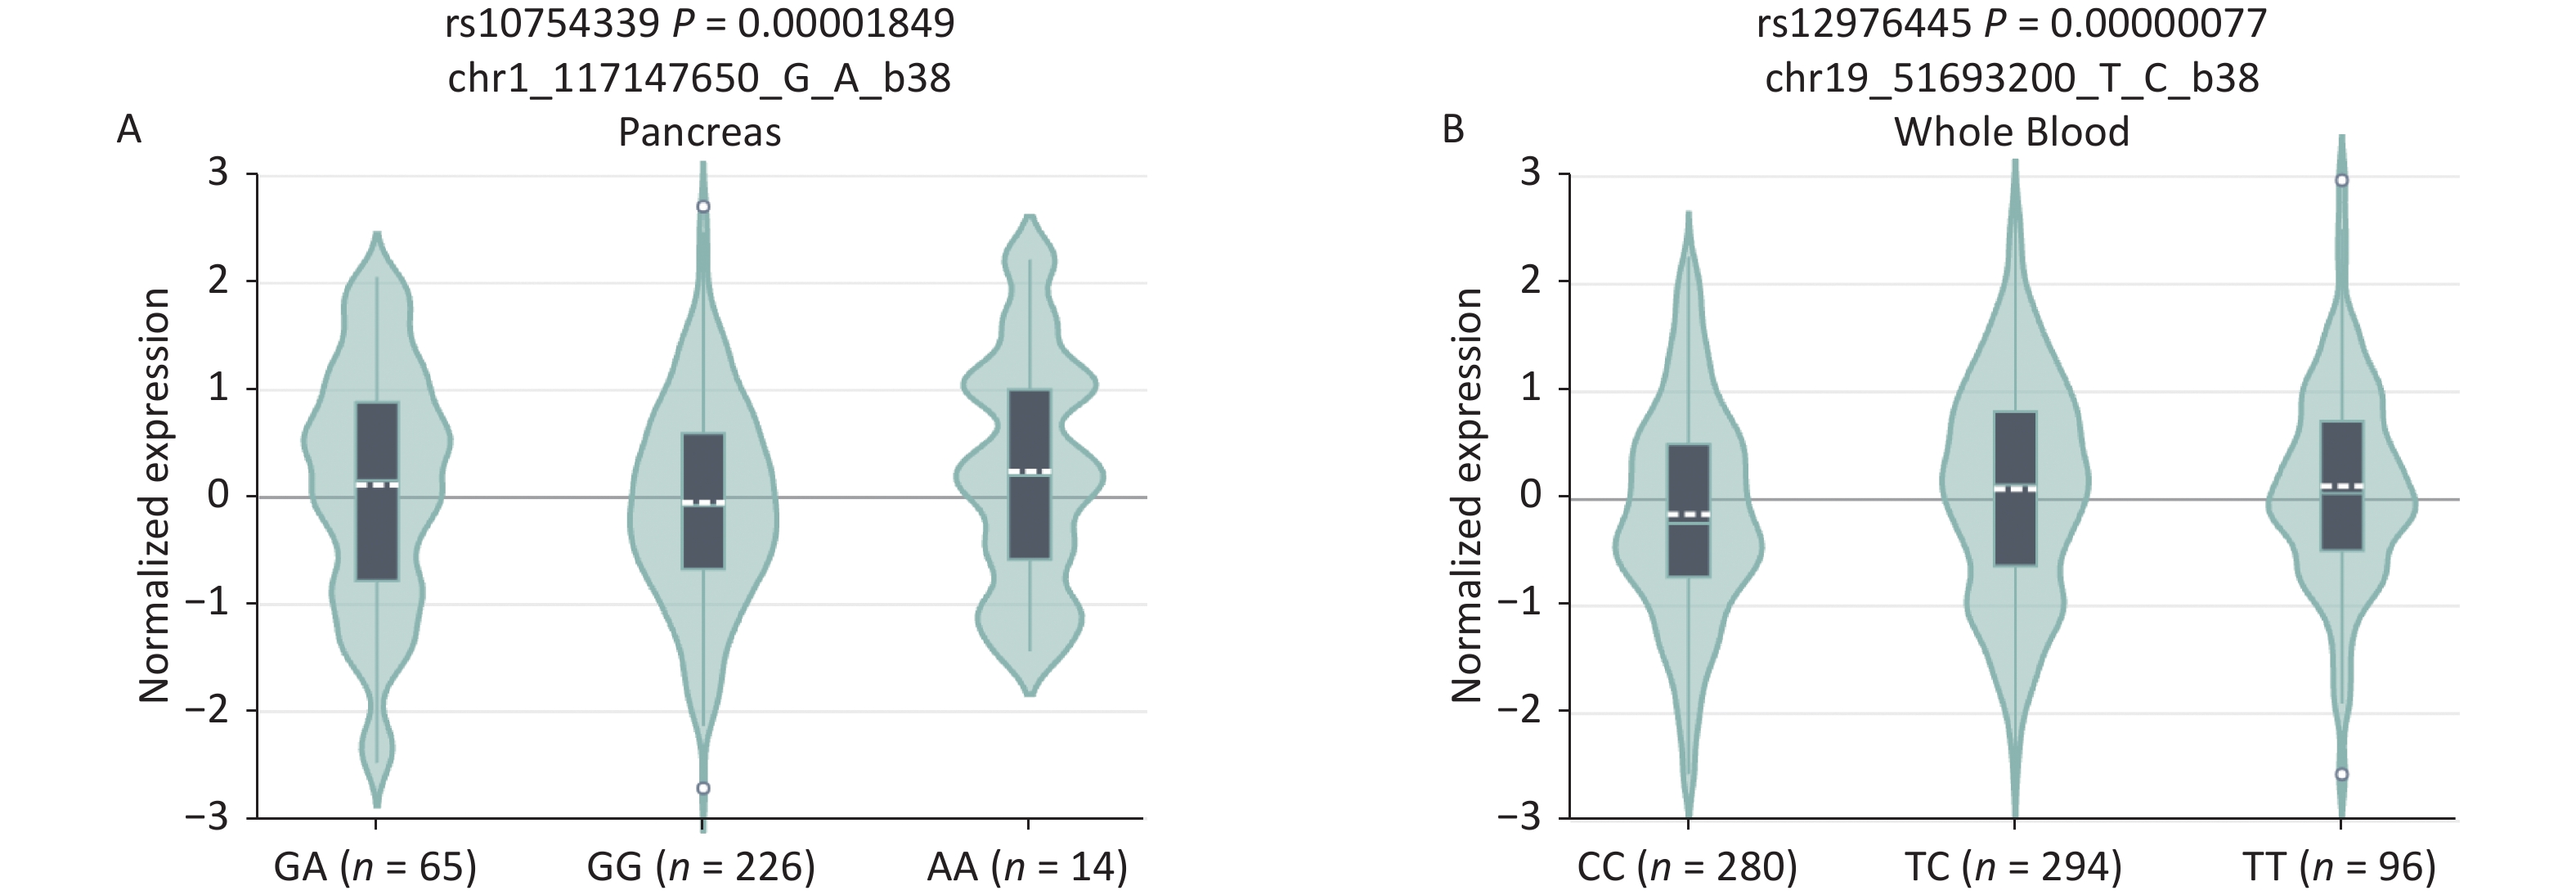
B7-H4, an immune checkpoint, and miR-125a, an immunoregulator, have attracted much attention in cancer immunology research. The rs10754339, located in the 3'-UTR of the B7-H4 gene, has been reported to impair the regulation of miR-506-3p on B7-H4[12]. The rs12976445 within the promoter region of miR‐125a affects miR‐125a expression, and bioinformatic analysis predicted a possible GATA-1 binding site by the presence of rs12976445[13]. Therefore, we evaluated the effects of the rs10754339 and rs12976445 genotypes on the expression levels of the B7-H4 gene and the miR‐125a gene, respectively. Expression quantitative trait loci (eQTL) analysis on the GTEx portal website (http://www.gtexportal.org/) revealed that B7-H4 mRNA differentially expressed in pancreas tissues depending on the three genotypes (P < 0.001) with AA tissues showing the highest expression level. The miR‐125a mRNA is differentially expressed in whole blood depending on the three genotypes (P < 0.001), with TT samples showing the highest expression level (Supplementary Figure S5, available in www.besjournal.com). These findings indicated that the B7-H4 gene rs10754339 and the miR‐125a gene rs12976445 are two functional variants that may affect individual susceptibility to cancer.
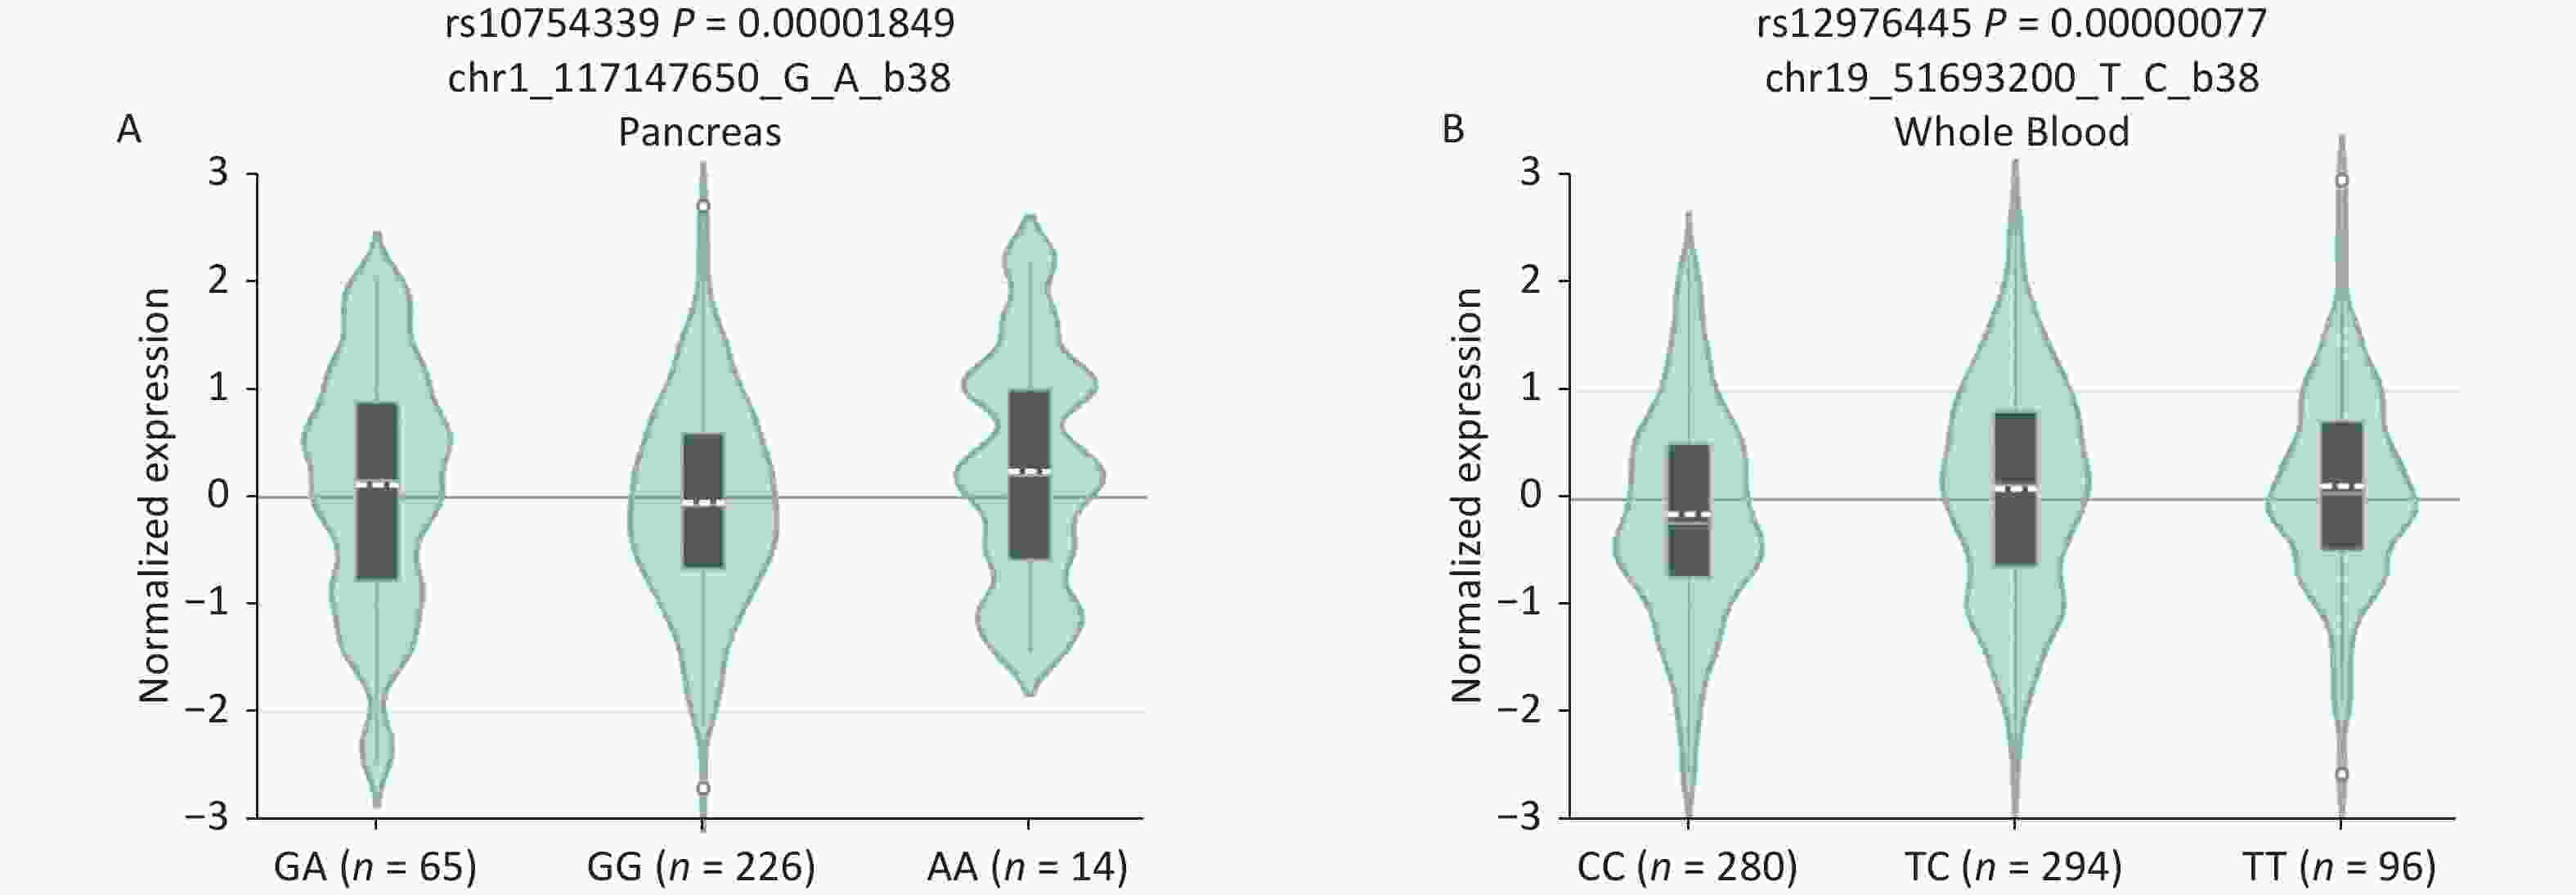
Figure S5. In silico expression analysis of B7-H4 mRNA expression in relation to different genotypes of rs10754339 (A) and miR-125a mRNA expression in relation to different genotypes of rs12976445 (B).
The association of the B7-H4 gene rs10754339 polymorphism with breast cancer has been repeatedly investigated[14-17], and studies have recorded a significant positive association except for Özgöz et al.[16]. This discrepancy might be mainly attributed to the inadequate power in some studies caused by insufficient sample size. Indeed, in the study of Özgöz et al. (31 breast cancer patients/30 healthy women)[16], rs10754339 showed an association in the same direction (ORs > 1 for G allele and AG genotype) as reported in the other three studies[14,15,17]. Additionally, Özgöz et al. revealed that rs10754339 was a genetic marker for bladder cancer[18]. This study has added to the list of cancers associated with rs10754339 by showing that rs10754339 was significantly associated with the risk of lung and gastric cancer. The link between rs10754339 and lung cancer susceptibility might be attributed to the G > A transition inhibiting miR-506-3p during B7-H4 expression[11], leading to the aberrant expression of B7-H4, which finally leads to the occurrence of lung cancer via AMPK/mTOR signaling[9,26]. Although statistically not significant, we observed a similar tendency that the A allele and AA genotype were more frequent in liver cancer patients than in normal individuals, suggesting that rs10754339 has the potential to be a predictive biomarker for liver cancer, but a confirmatory study with a greater number of participants is required.
Previous studies have explored the contribution of miR‐125a gene rs12976445 polymorphism to colorectal cancer (CRC)[19], prostate cancer (PCa)[20,21], breast cancer[22], and lung cancer[23]. Consistent with the findings of Sun et al.[23], we also found a connection between rs12976445 and lung cancer risk. However, we found no significant association of rs12976445 with susceptibility to CRC, breast cancer, liver cancer, or gastric cancer. Interestingly, Hakimian et al. did not find an association between rs12976445 and PCa susceptibility[21], whereas Damodaran et al. came to the opposite conclusion[20]. Two possible reasons may explain the discrepancy. First, the sample sizes of these two studies were too small (300 subjects and 200 subjects, respectively), which might have reduced the statistical power and increased the margin of error. Therefore, their findings may not be completely convincing. Secondly, the different living environments, lifestyles, and genetic backgrounds of different ethnic descents (Iranians and Indians) might also have led to the discrepancy.
To improve the statistical power and resolve the discordant results of previous studies, a meta-analysis was conducted to further evaluate the effects of rs10754339 and rs12976445 on cancer susceptibility. We found that rs10754339 was significantly associated with total cancer risk, especially in the Chinese population, and a strong connection between rs10754339 and breast cancer risk was also observed. Additionally, rs12976445 was significantly associated with total cancer risk only in the Chinese population. The cancer type-stratified analysis showed that rs12976445 was closely related to lung cancer risk, which confirmed the findings of our case-control study. However, no association was observed between rs12976445 and prostate cancer risk and between rs12976445 and total cancer risk based on the PCR-RFLP method.
There are several limitations of this study. First, the studied subjects were all enrolled in the hospital, which could not fully rule out selection bias. Secondly, our findings on the association between rs10754339/rs12976445 and the risk of liver, lung, and gastric cancer apply only to the Hubei Han Chinese; thus, further confirmatory studies in other ethnic populations are required. Thirdly, although rs12976445 was predicted to regulate the expression of miR‐125a by affecting the binding affinity of GATA-1, the direct relationship between rs12976445 and miR‐125a expression still needs to be validated by a functional study. Finally, owing to the limited number of studies for specific cancer types, the cancer type‐stratified analysis was only conducted for rs10754339 and breast cancer, rs12976445 and prostate cancer, and rs12976445 and lung cancer. Therefore, replication studies and updated meta-analysis are needed to gain a better understanding of the correlation between rs10754339/rs12976445 and cancer susceptibility.
In conclusion, our case-control study indicated that the B7-H4 gene rs10754339 is associated with the susceptibility to lung and gastric cancer in the Chinese population and that the miR‐125a gene rs12976445 may be a genetic factor of lung cancer in the Chinese population. Meta-analysis indicated that both rs10754339 and rs12976445 may be contributing to cancer susceptibility in the Chinese population. However, additional studies with larger sample sizes in different ethnic populations are required to confirm our present findings.
-
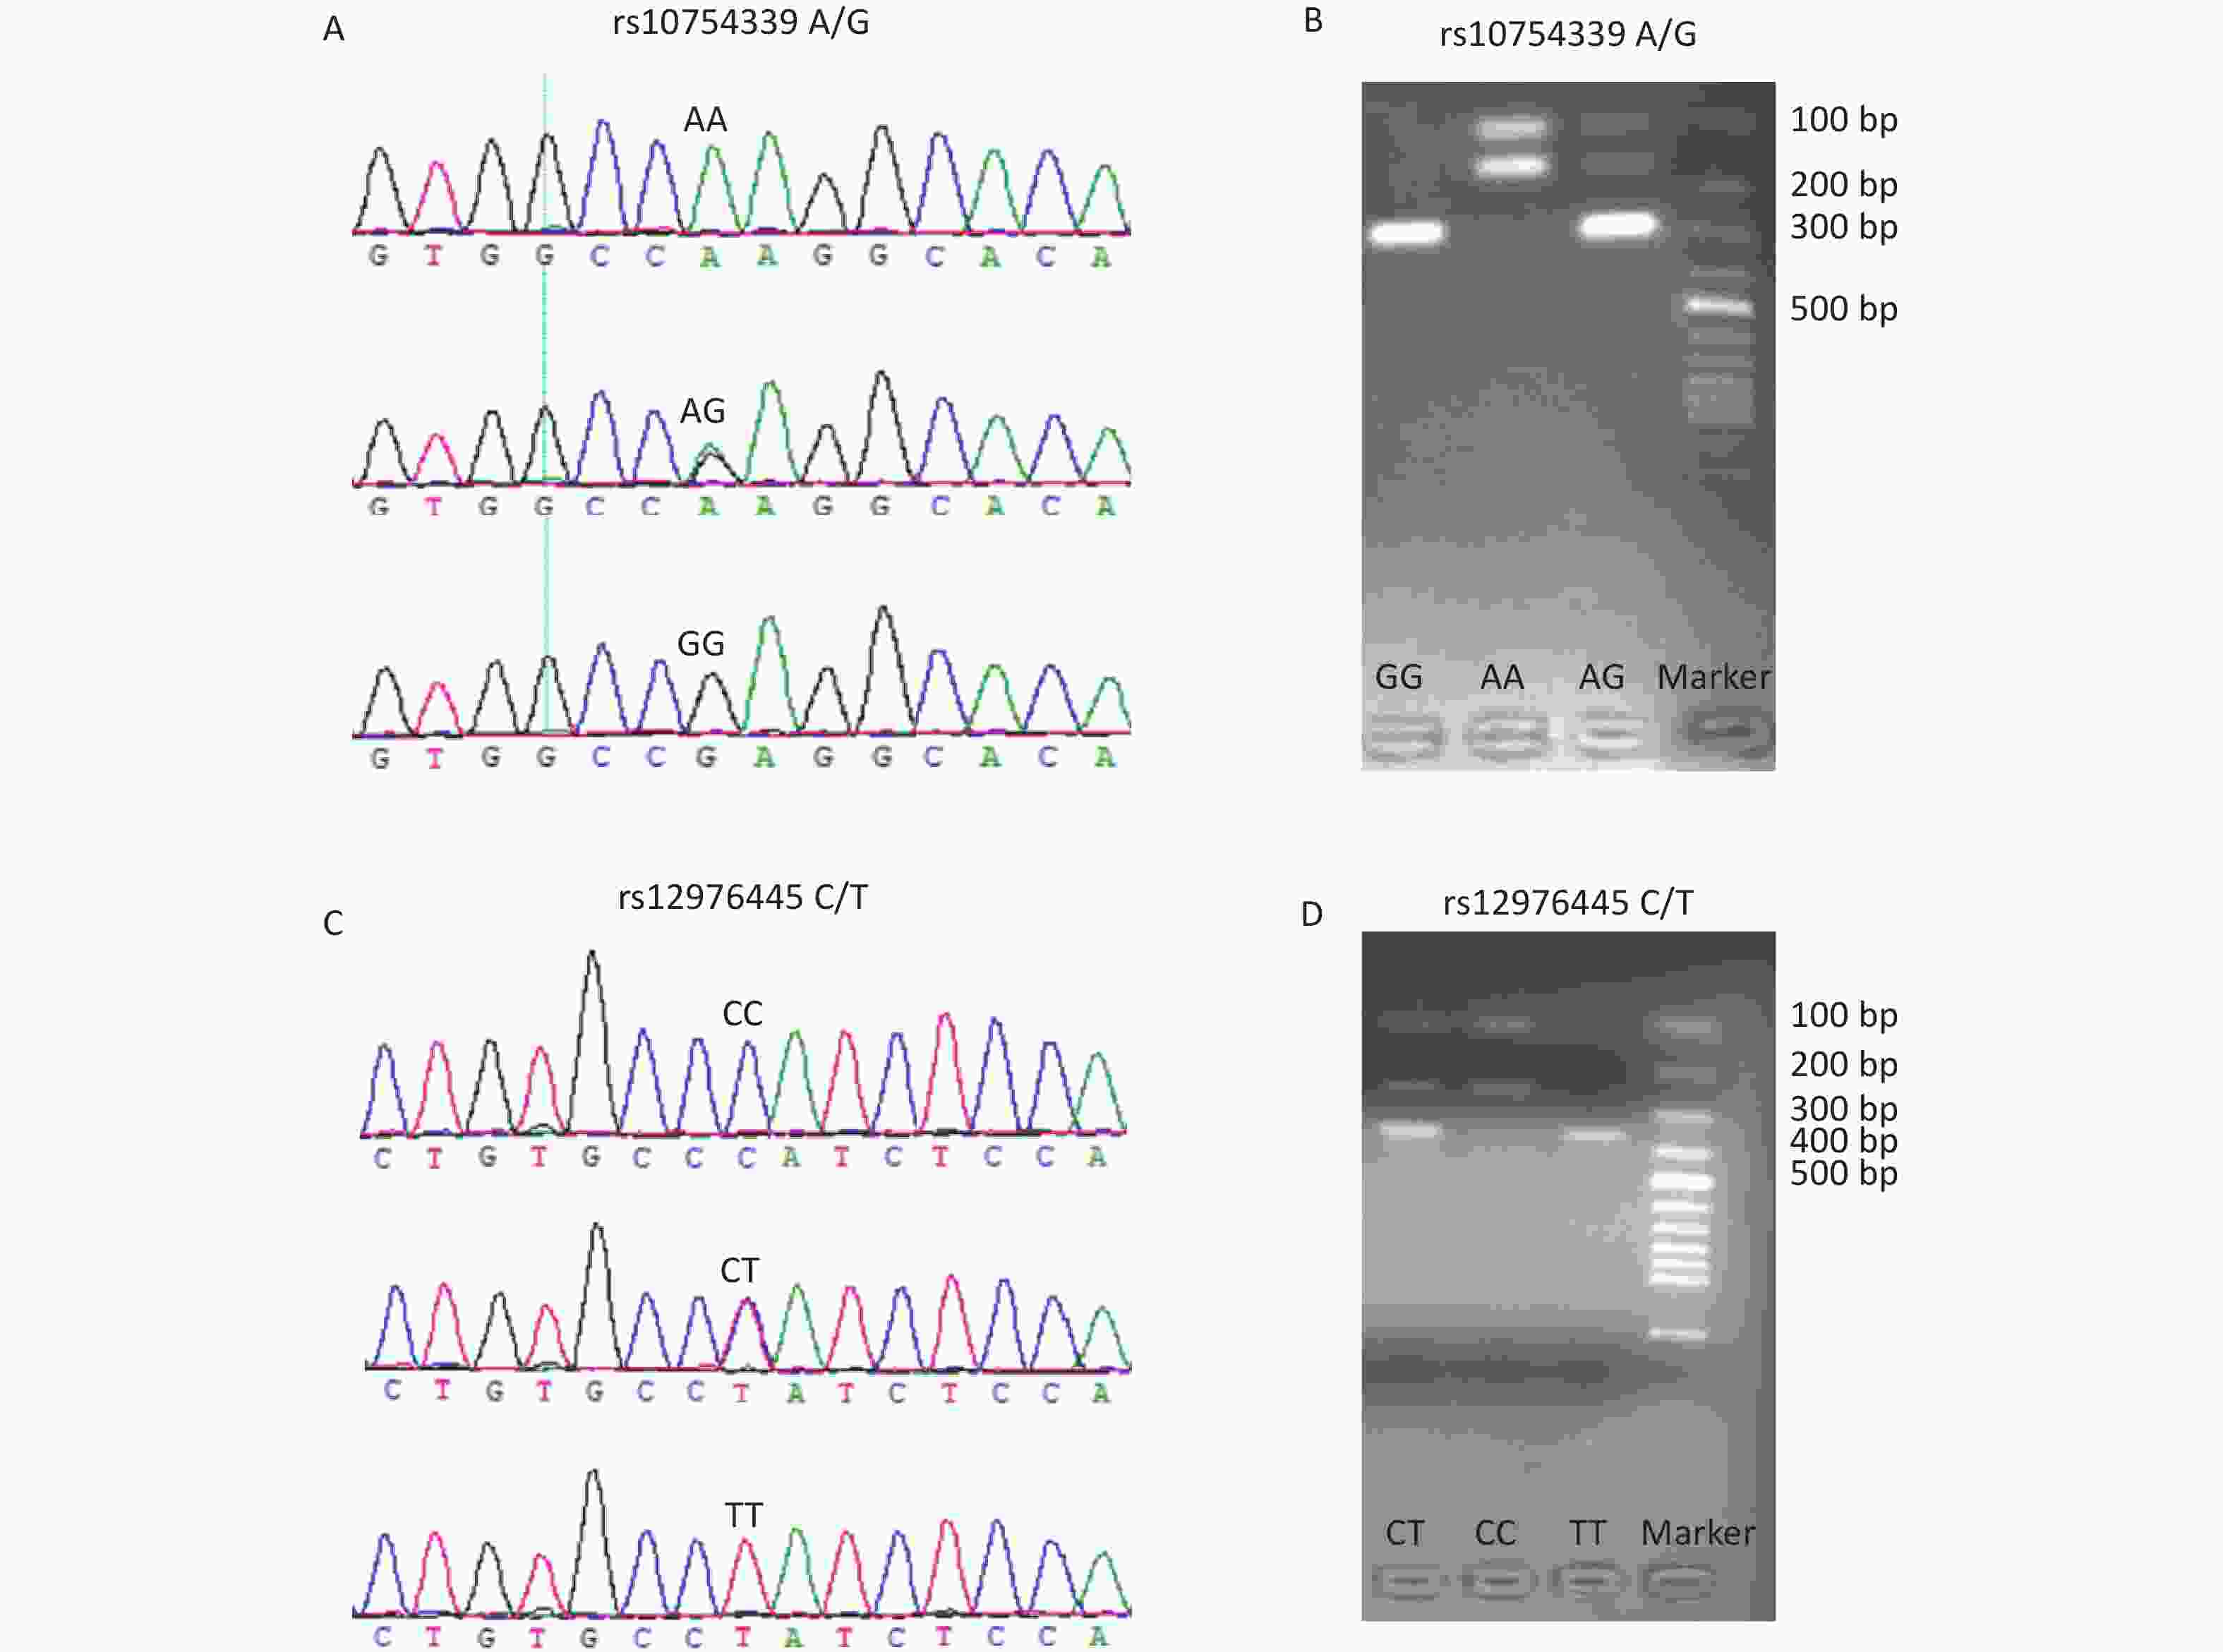
Figure S1. The genotyping diagrams of rs10754339 (A, B) and rs12976445 (C, D) by Sanger sequencing and PCR-RFLP assay.
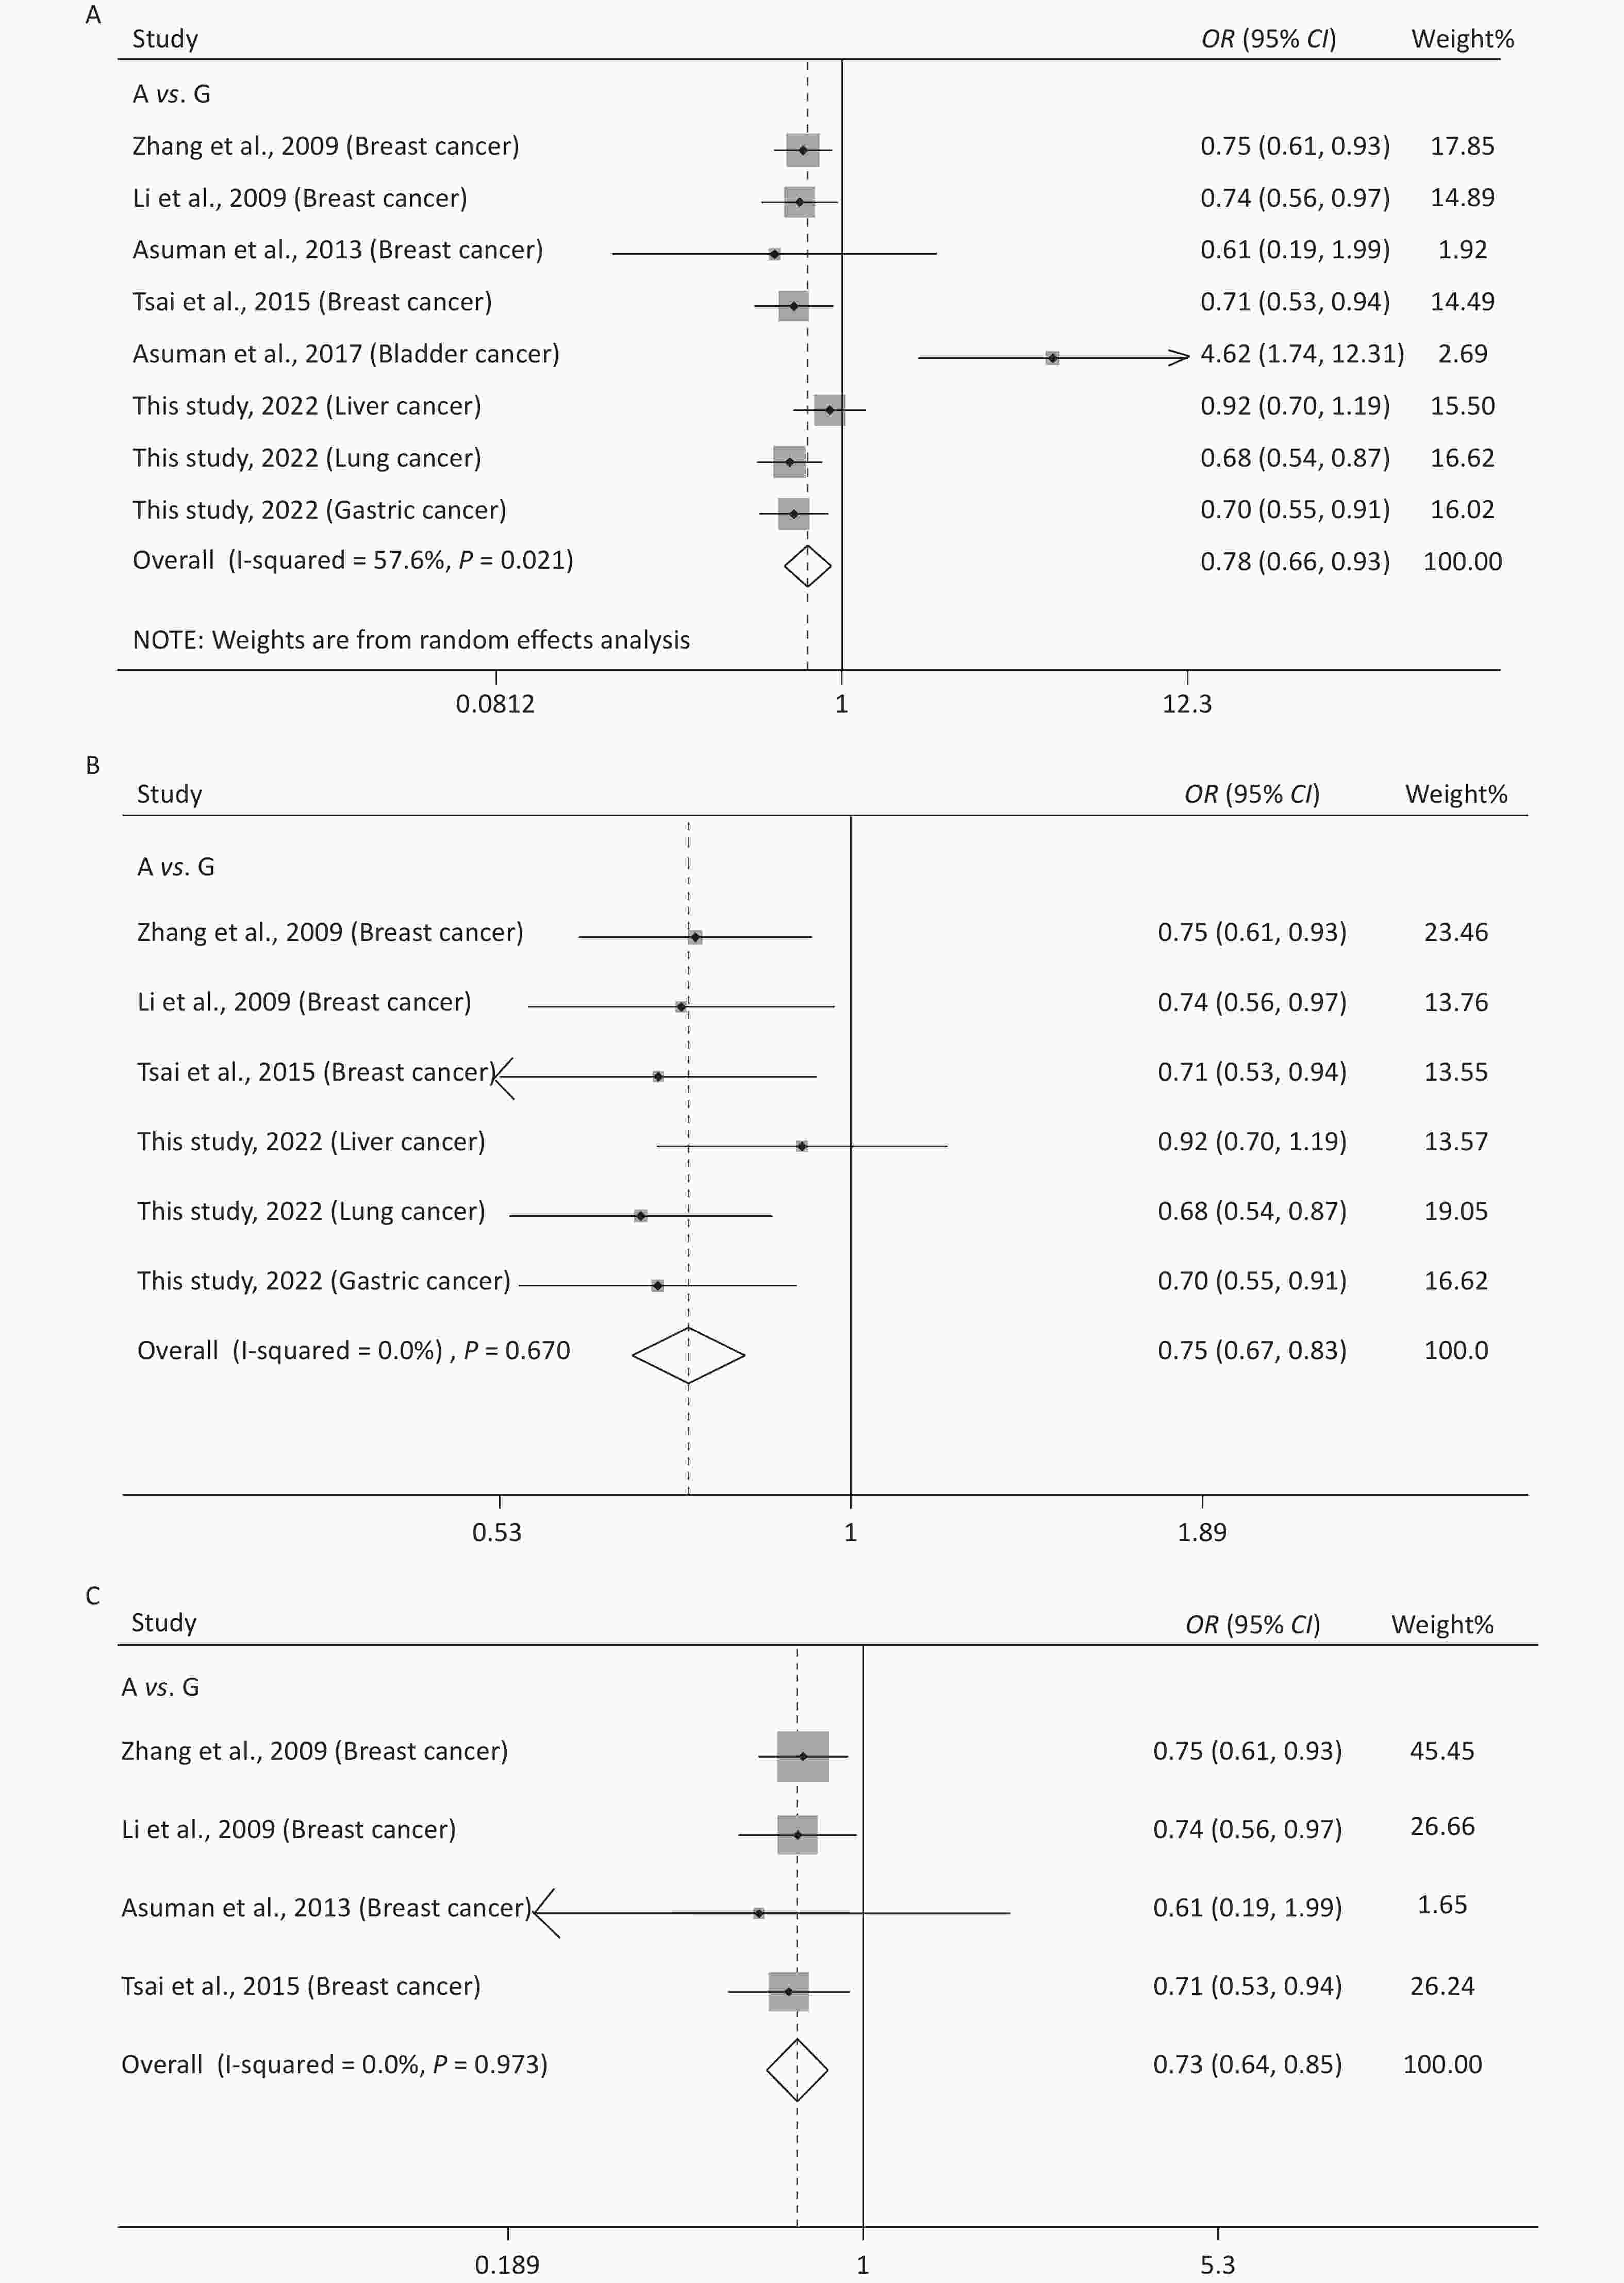
Figure S3. Forest plots for the meta-analysis of 10754339 and overall cancer risk under A vs. G in the total population (A) and the Chinese population (B). Forest plots for the meta-analysis of rs10754339 and breast cancer risk (C).
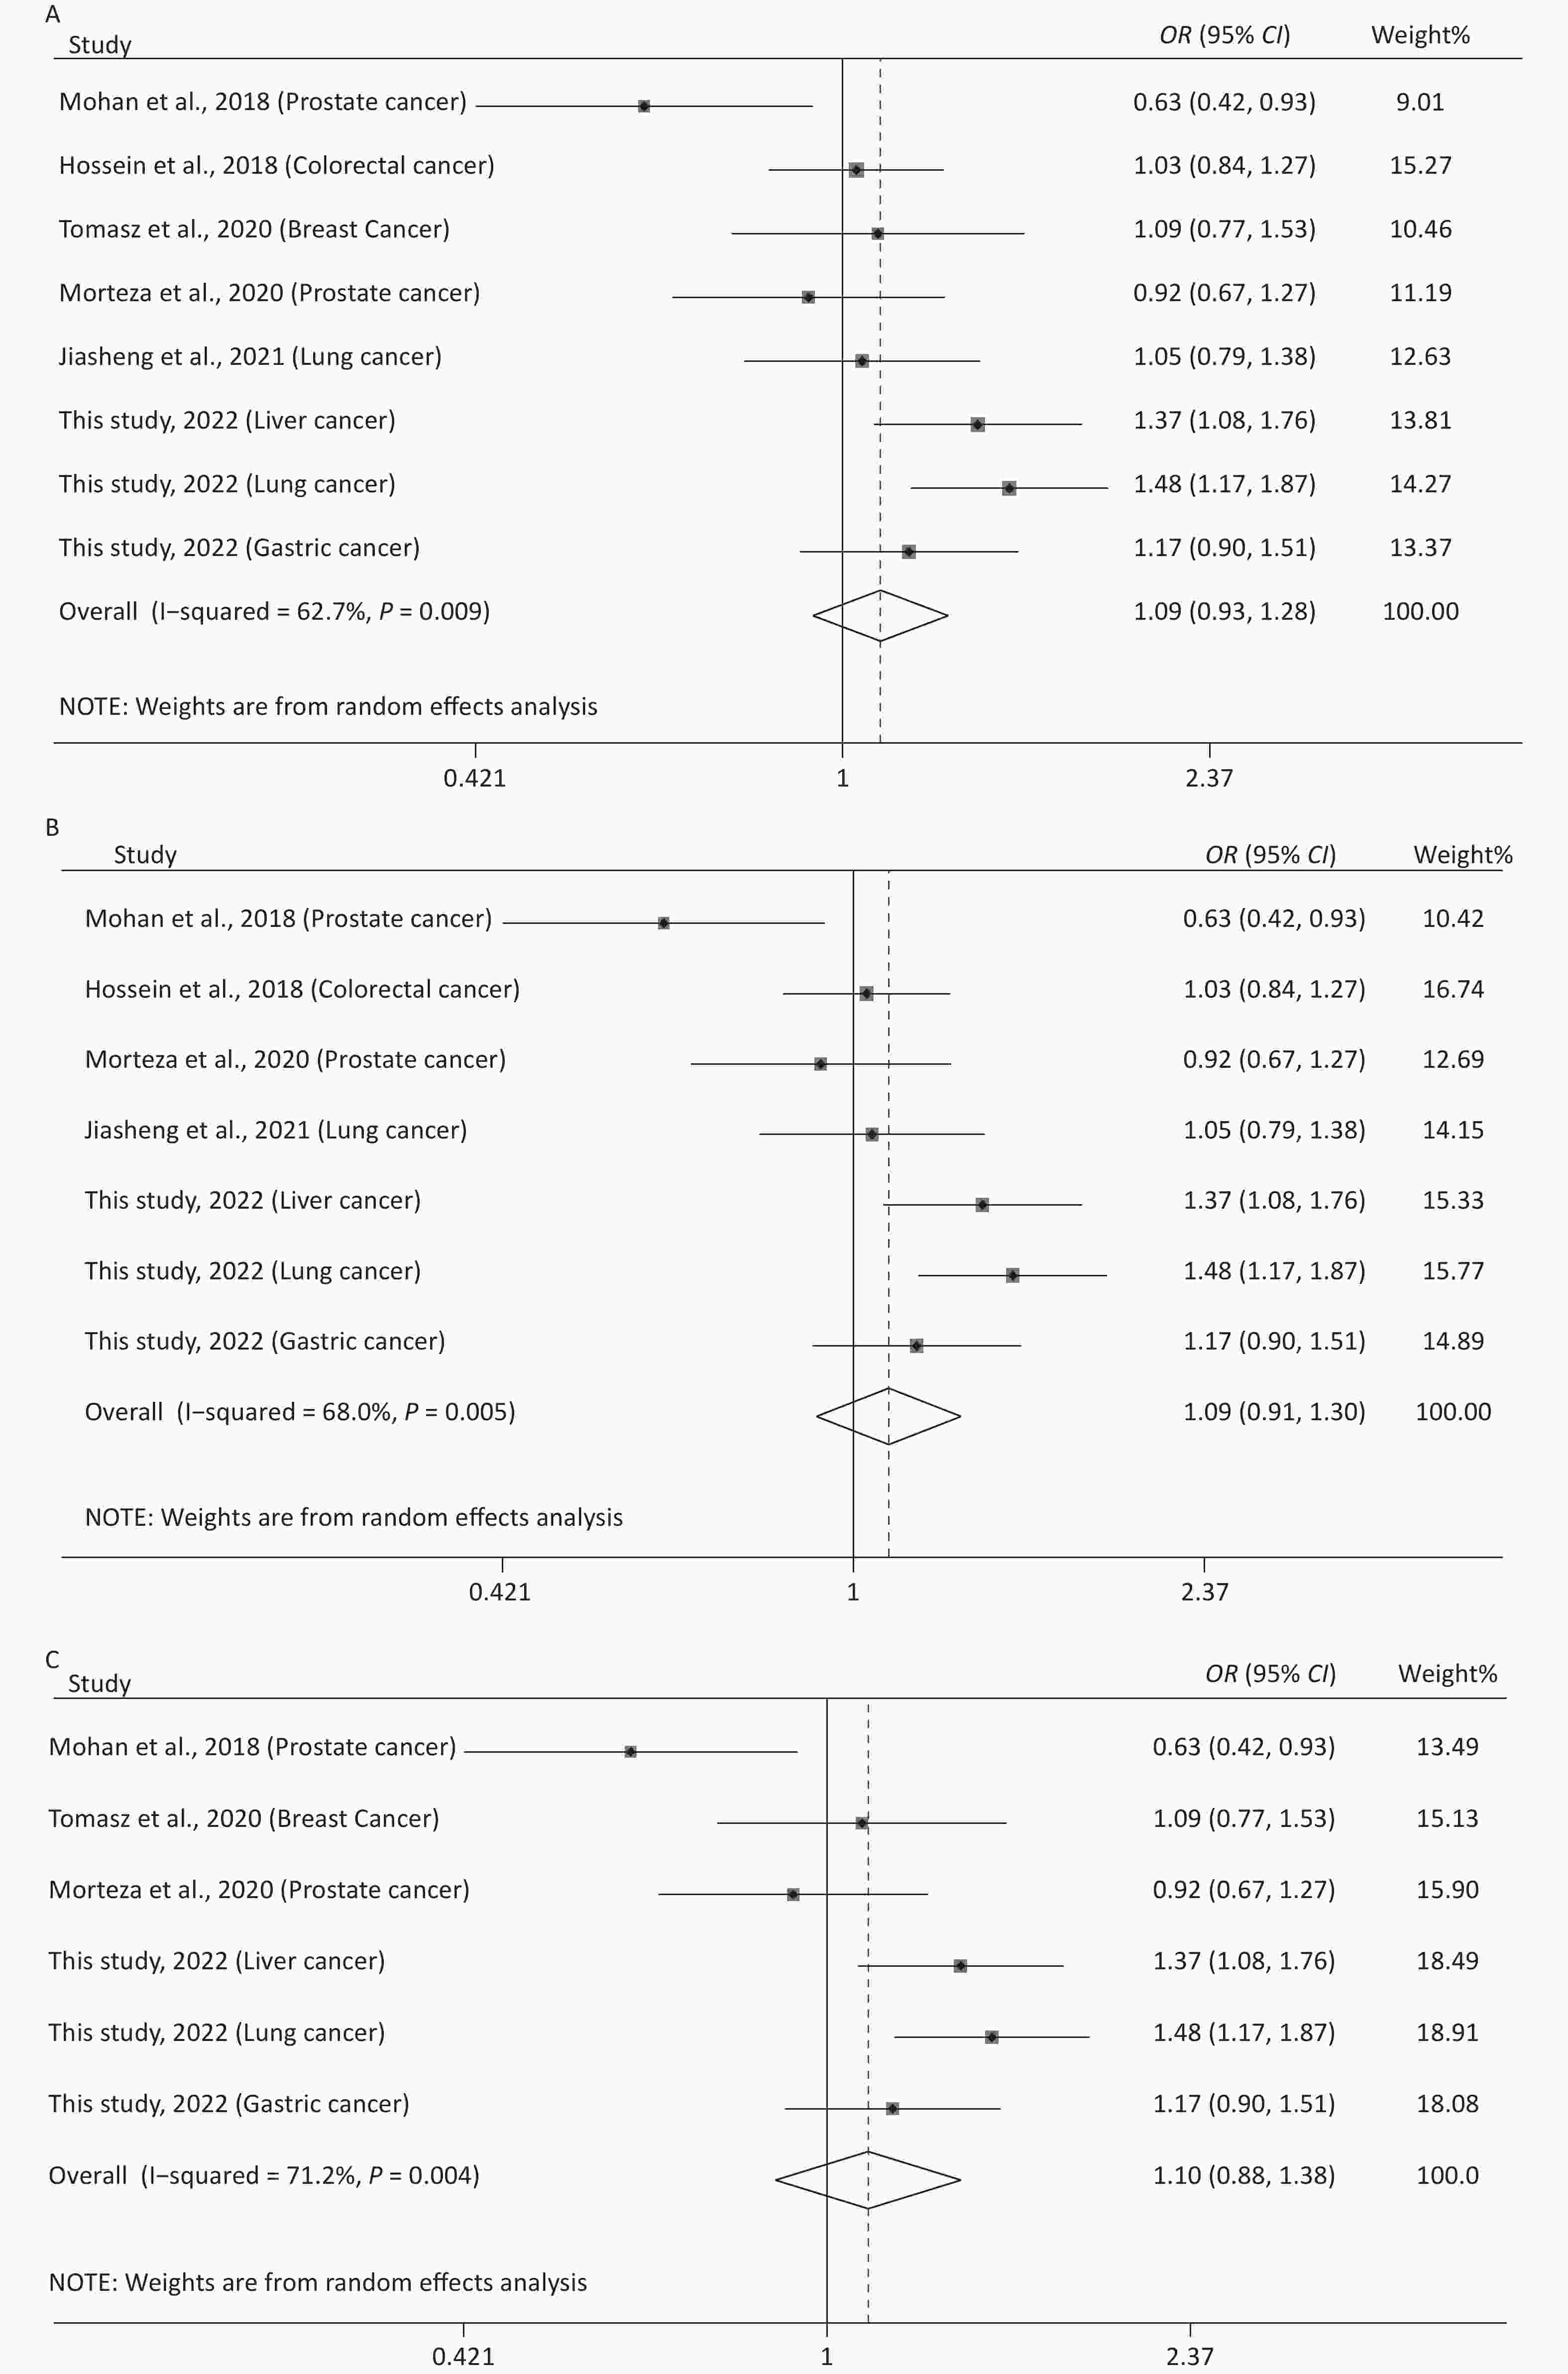
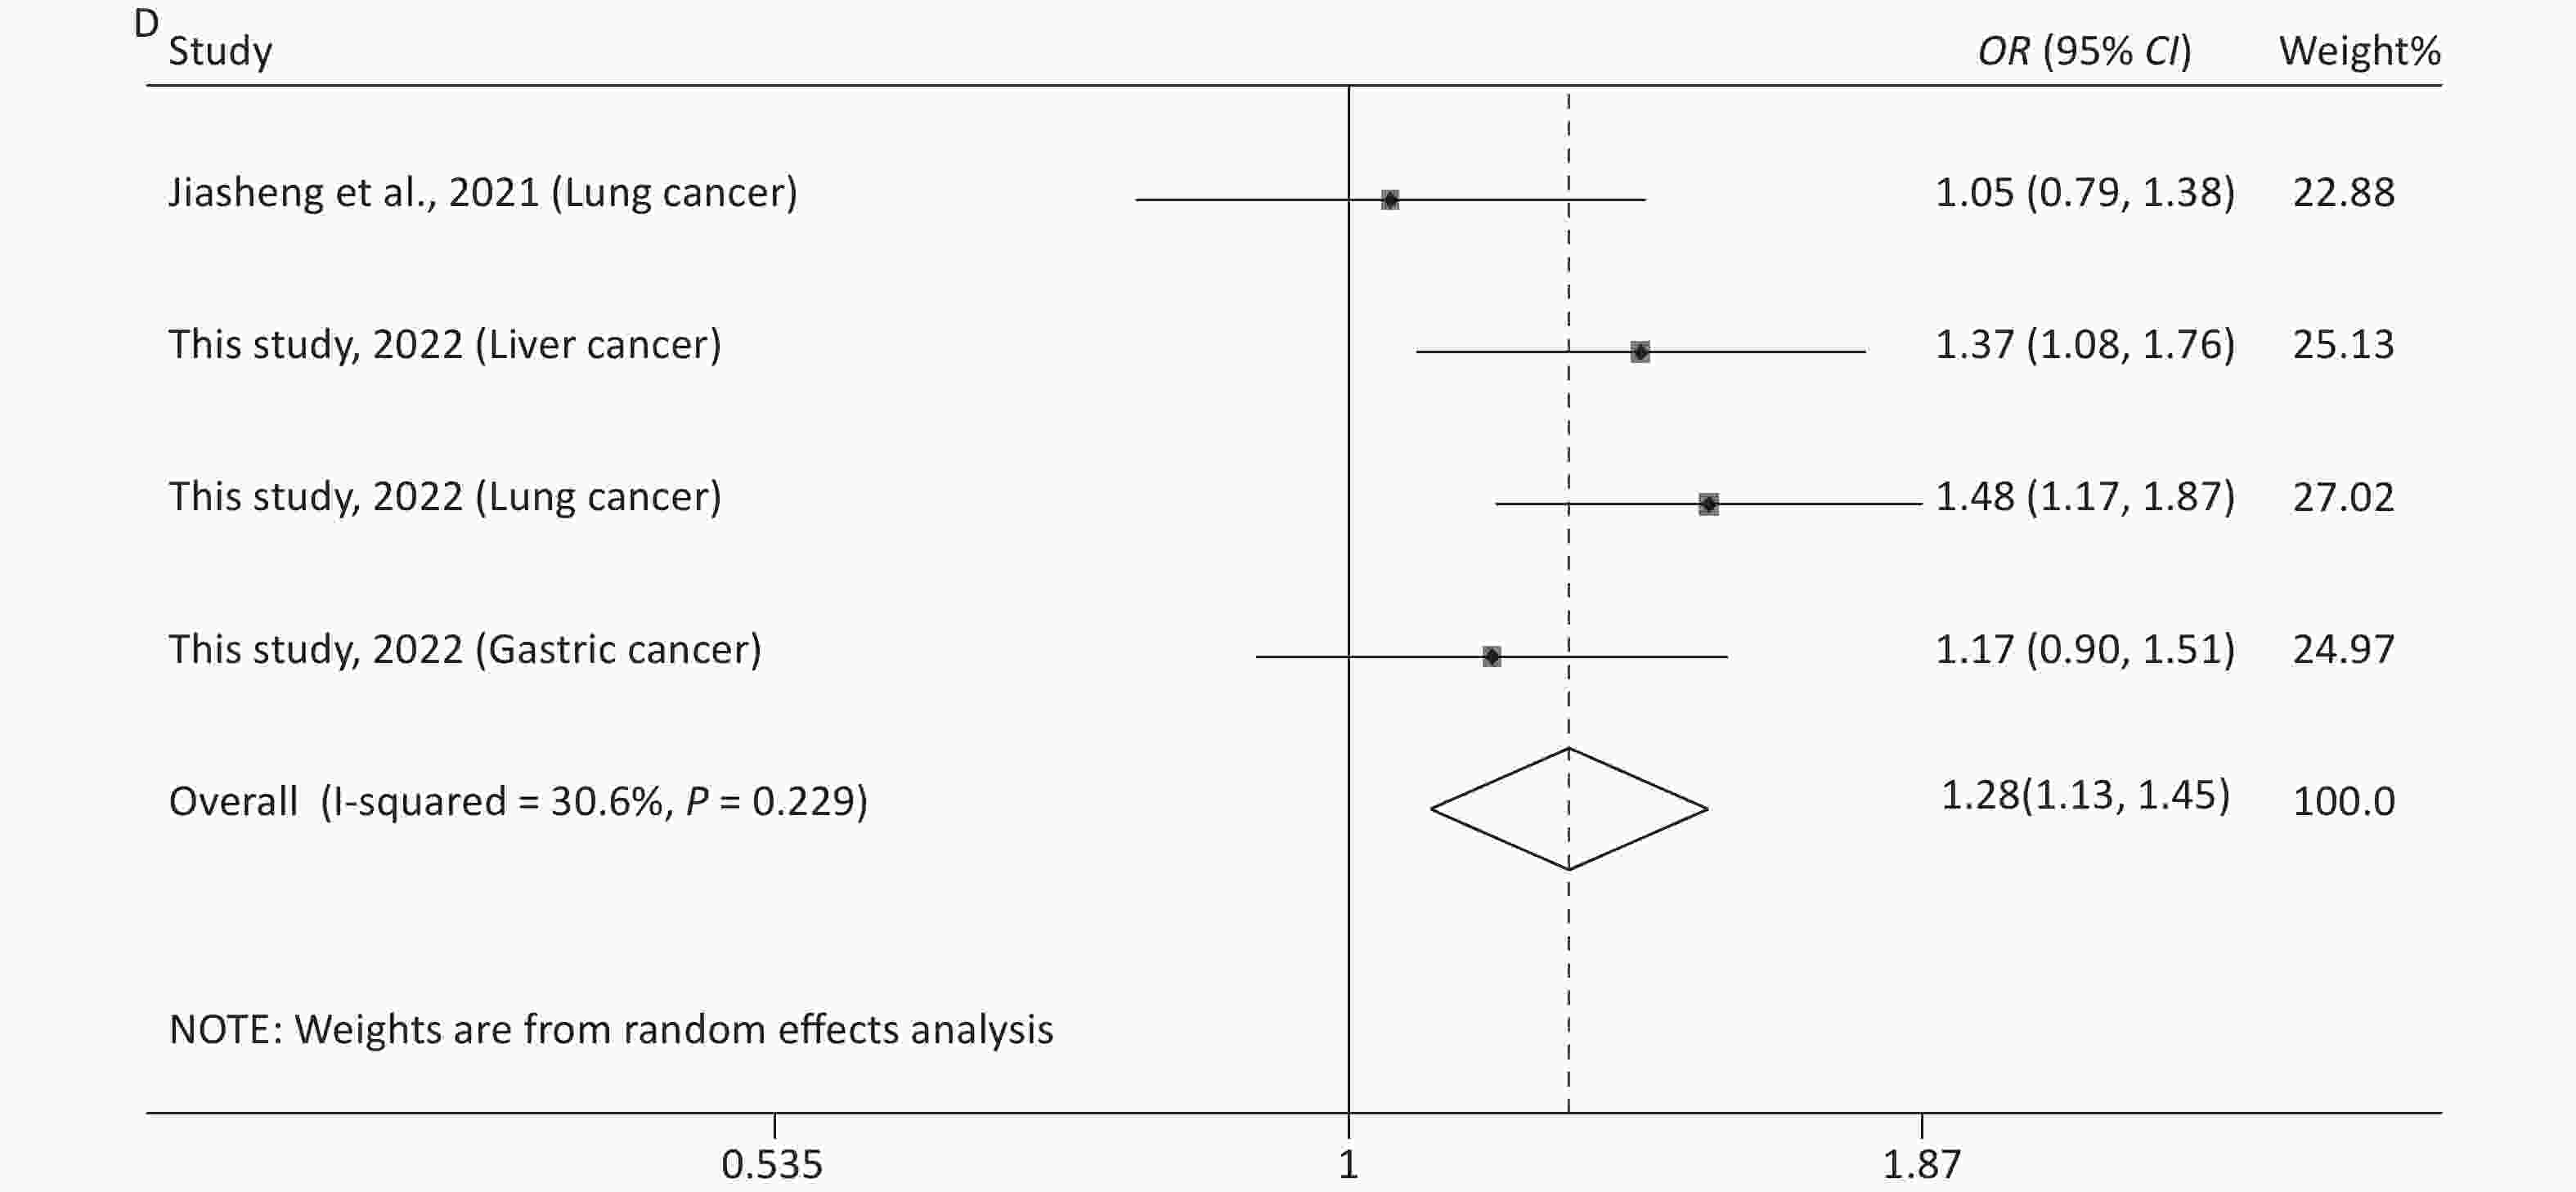
Figure S4. Forest plots for the meta-analysis of rs12976445 and overall cancer risk under T vs. C in the total population (A), in the Asian population (B), based on PCR-RFLP (C), and in the Chinese population (D).
HTML
Studied Subjects
Preparation of DNA Samples
Genotyping of rs10754339 and rs12976445
Statistical Analysis
Meta-Analysis
Principal Characteristics of the Studied Subjects
Effects of rs10754339 and rs12976445 on Cancer Susceptibility
Meta-Analysis of the Association between rs10754339 and Cancer Susceptibility
Meta-Analysis of the Association between rs12976445 and Cancer Susceptibility
Sensitivity Analysis, Publication Bias, and TSA
CONFLICT OF INTEREST The authors declare that they have no conflict of interest in this work.
&These authors contributed equally to this work.
 22281+Supplementary Materials.pdf
|

|

 Quick Links
 DownLoad: