-
Clostridioides difficile (C. difficile), is an anaerobic Gram-positive bacterium found in the human intestine. Prolonged use of antibacterial drugs can result in C. difficile infection (CDI)[1], which is one of the most important hospital-acquired diseases affecting all wards. Isolation-and-culture-based identification and the cell cytotoxicity neutralization assay (CCNA) are considered the “gold standard” for detecting toxins or pathogenic strains[2], with long and time-consuming incubation times. Fluorescent quantitative polymerase chain reaction (PCR) is commonly used in clinical laboratory tests[3]. However, the sensitivity, accuracy, and resolution of detection are limited by low-copy target gene molecules and subtle differences in template concentration. As C. difficile is distributed in feces in the natural environment and the sample matrix is complex, it is difficult to detect pathogens at low levels. Accurately quantifying C. difficile and implementing effective measures to combat C. difficile infections are of utmost importance.
Droplet digital (dd) PCR is a new nucleic acid quantification technique developed based on traditional PCR and qPCR techniques for use in clinical microbiology laboratories and consists of three main components: microdroplet preparation, PCR amplification, and acquisition of fluorescence signals and data analysis[4]. Compared to qPCR, PCR has the advantage of absolute quantification of nucleic acids without the need for standard curves and control samples. It is particularly suitable for detecting small amounts of nucleic acid (tetanus antitoxin, TAT). However, there have been no reports on the detection of C. difficile using digital PCR. This study aimed to establish a microdroplet digital PCR assay to precisely quantify C. difficile nucleic acids in minute quantities present in artificially contaminated fecal samples and clinical isolates. The implementation of this assay would automate pathogen detection and simplify the detection process, addressing the current challenge of standardizing C. difficile detection methods.
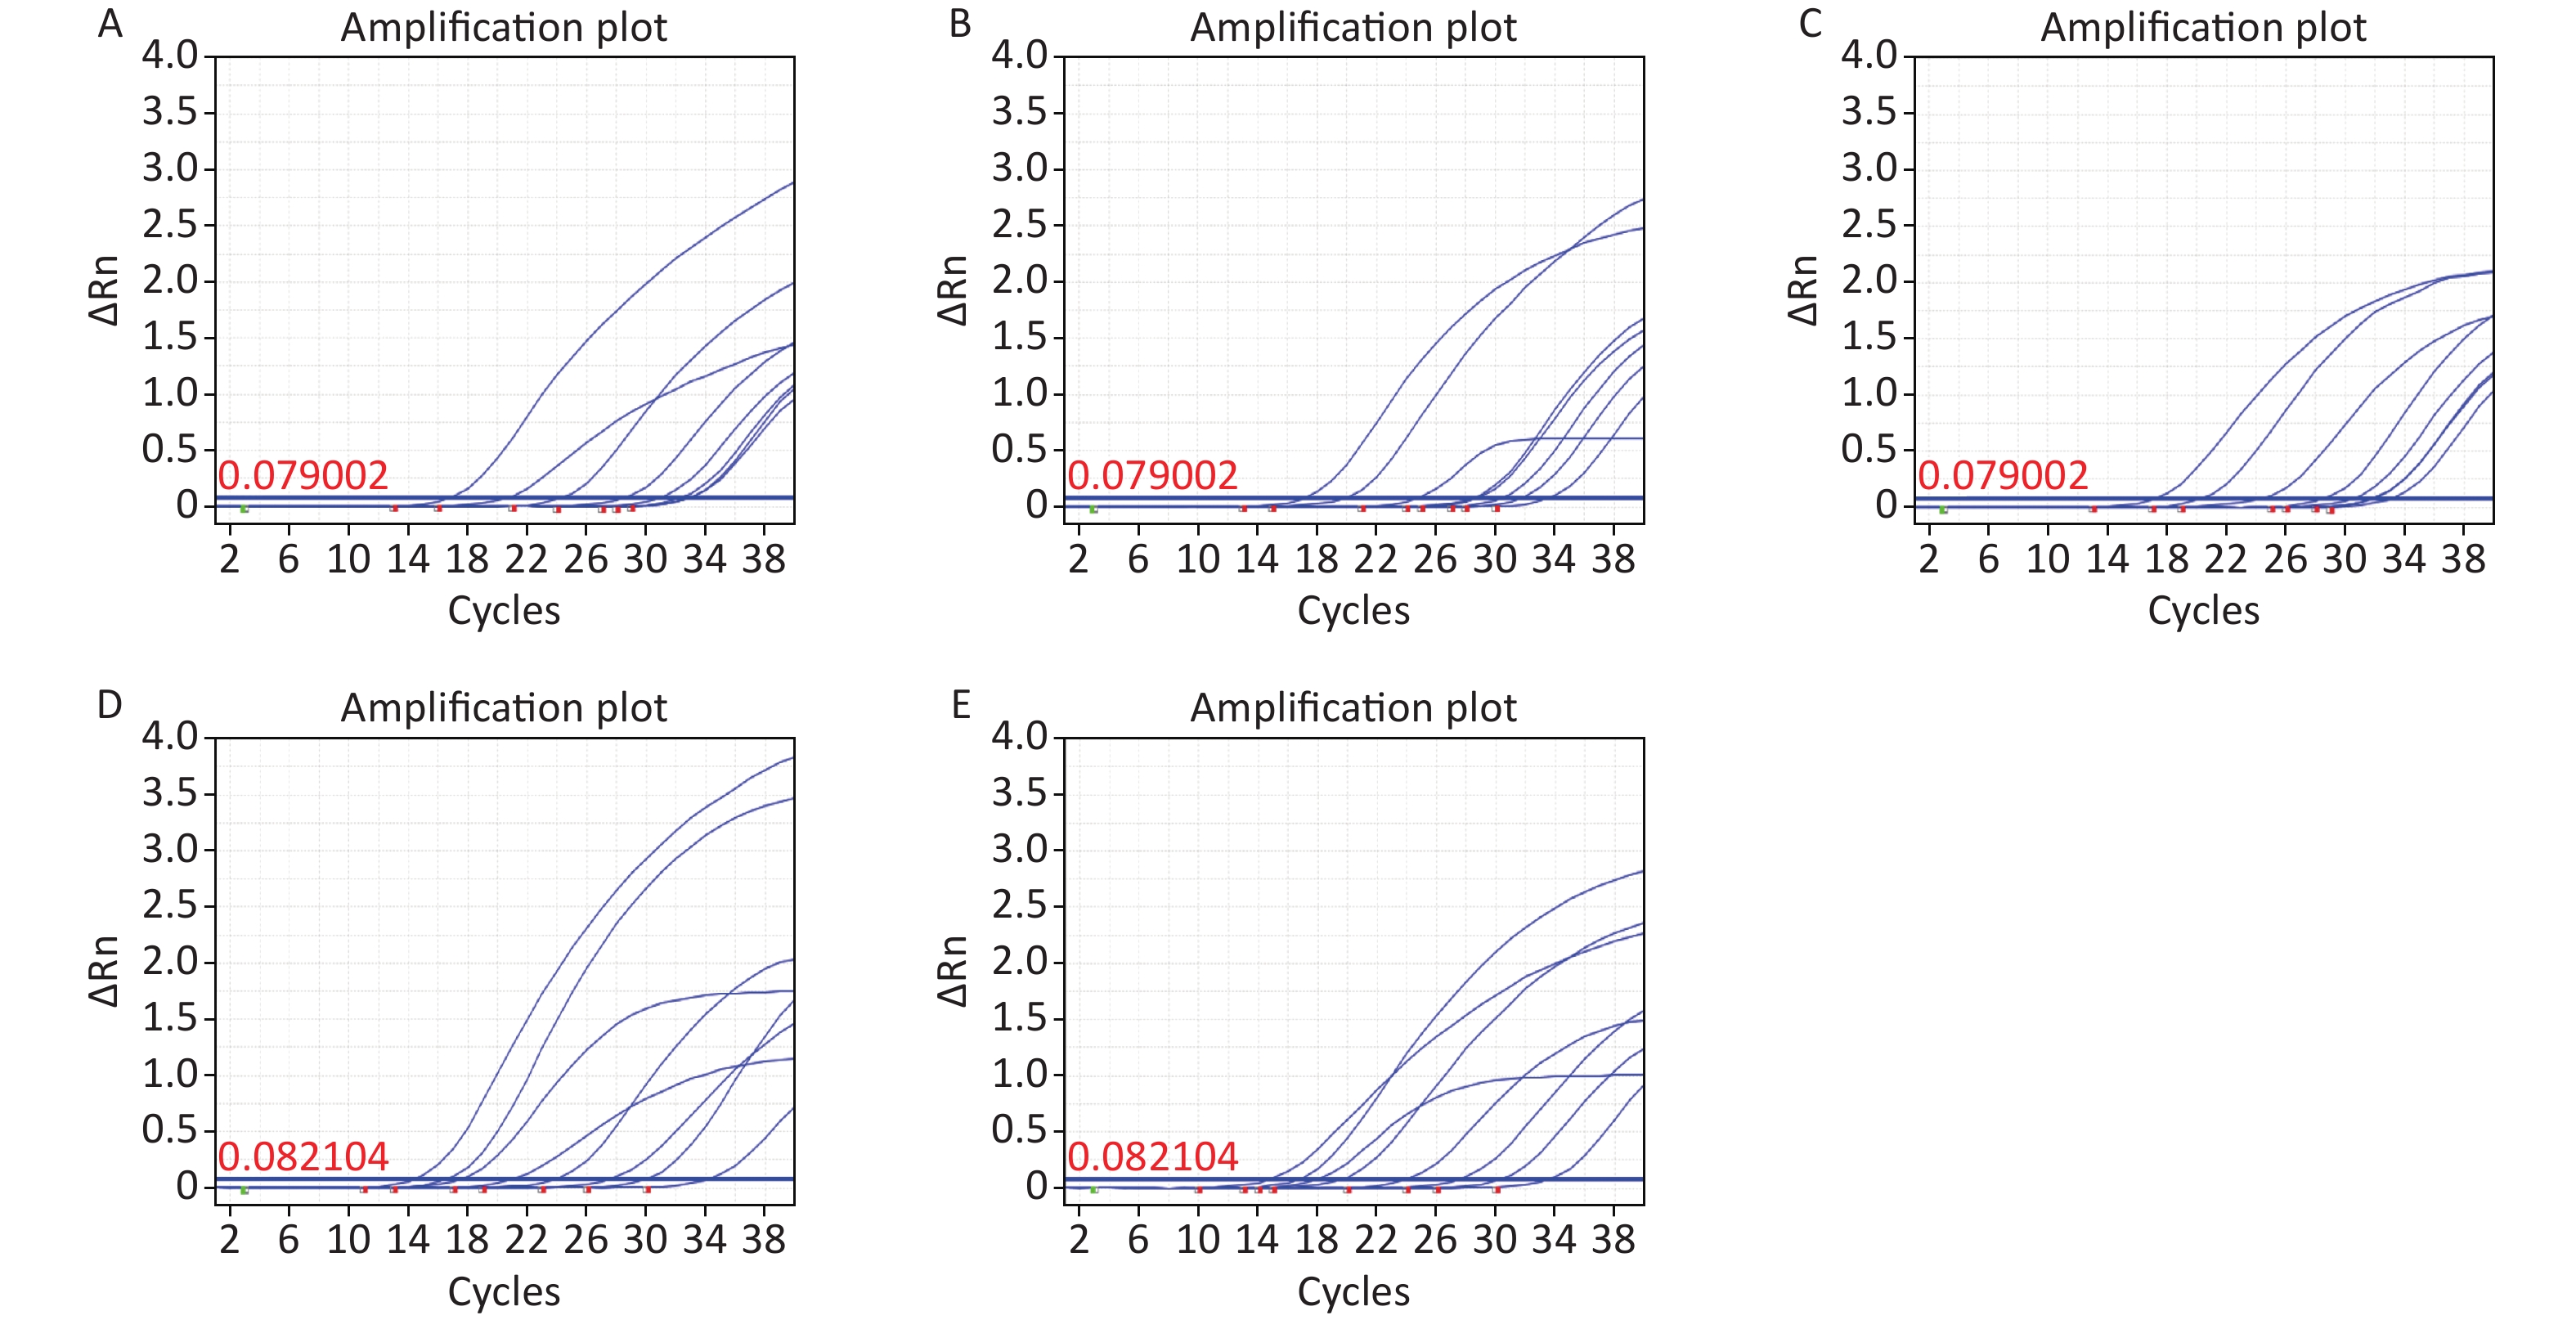
The target sequence of C. difficile specific virulence gene tcdB was obtained from the National Center for Biotechnology Information (NCBI) database (GenBank ID: CP019857.1). A conserved region within this gene was identified using Basic Local Alignment Search Tool (BLAST) sequence alignment software. Subsequently, a set of primers and probes that specifically encoded C. difficile tcdB genes were synthesized (Supplementary Table S1, available in www.besjournal.com), along with PCR primers and plasmid sequences (Supplementary Tables S2–S3, available in www.besjournal.com). Owing to an extensive number of zoned amplification reactions in ddPCR optimization analysis plays a crucial role. The factors considered in this process include utilizing computer-based primer-specific screening, such as the NCBI BLAST for avoiding primer dimers and secondary structures. Methods suitable for RT-qPCR, which are equally suitable for ddPCR; are also considered. Additionally, optimization of the annealing temperature enables the differentiation between positive and negative droplets, while considering the experimental cost implications. Annealing too high or too low results in reduced product quantities and may lead to the formation of nonspecific products[5]. By optimizing the annealing temperatures (52 °C, 54 °C, 56 °C, 58 °C, 60 °C), we can achieve a clear delamination between positive and negative microdroplets. The results show that, at 56 °C (Supplementary Figure S1, available in www.besjournal.com), the reaction gradient showed good amplification efficiency and uniformity.
Primer name Sequence (5’ to 3’) tcdB-f ATATCAGAGACTGATGAG tcdB-r TAGCATATTCAGAGAATATTGT tcdB-p FAM-CTGGAGAATCTATATTTGTAGAAACTG-BHQ Table S1. Primer and probe sequences used for ddPCR and RT-qPCR
Primer name Primer code
sequenceSequence (5’ to 3’) Primer1 tcdb-F3 CCAAAGTGGAGTGTTACAAACAGGTG tcdb-R3 GCATTTCTCCATTCTCAGCAAAGTA Table S2. PCR oligonucleotides for C. difficile tcdB gene
Name Sequence (5' to 3') Suquence 1 (103 bp) ATATCAGAGACTGATGAGGGATTTAGTATAAGATTTATTAATAAAGAAACTGGAGAA
TCTATATTTGTAGAAACTGAAAAAACAATATTCTCTGAATATGCTATable S3. Plasmid sequences for ddPCR and RT-qPCR amplification
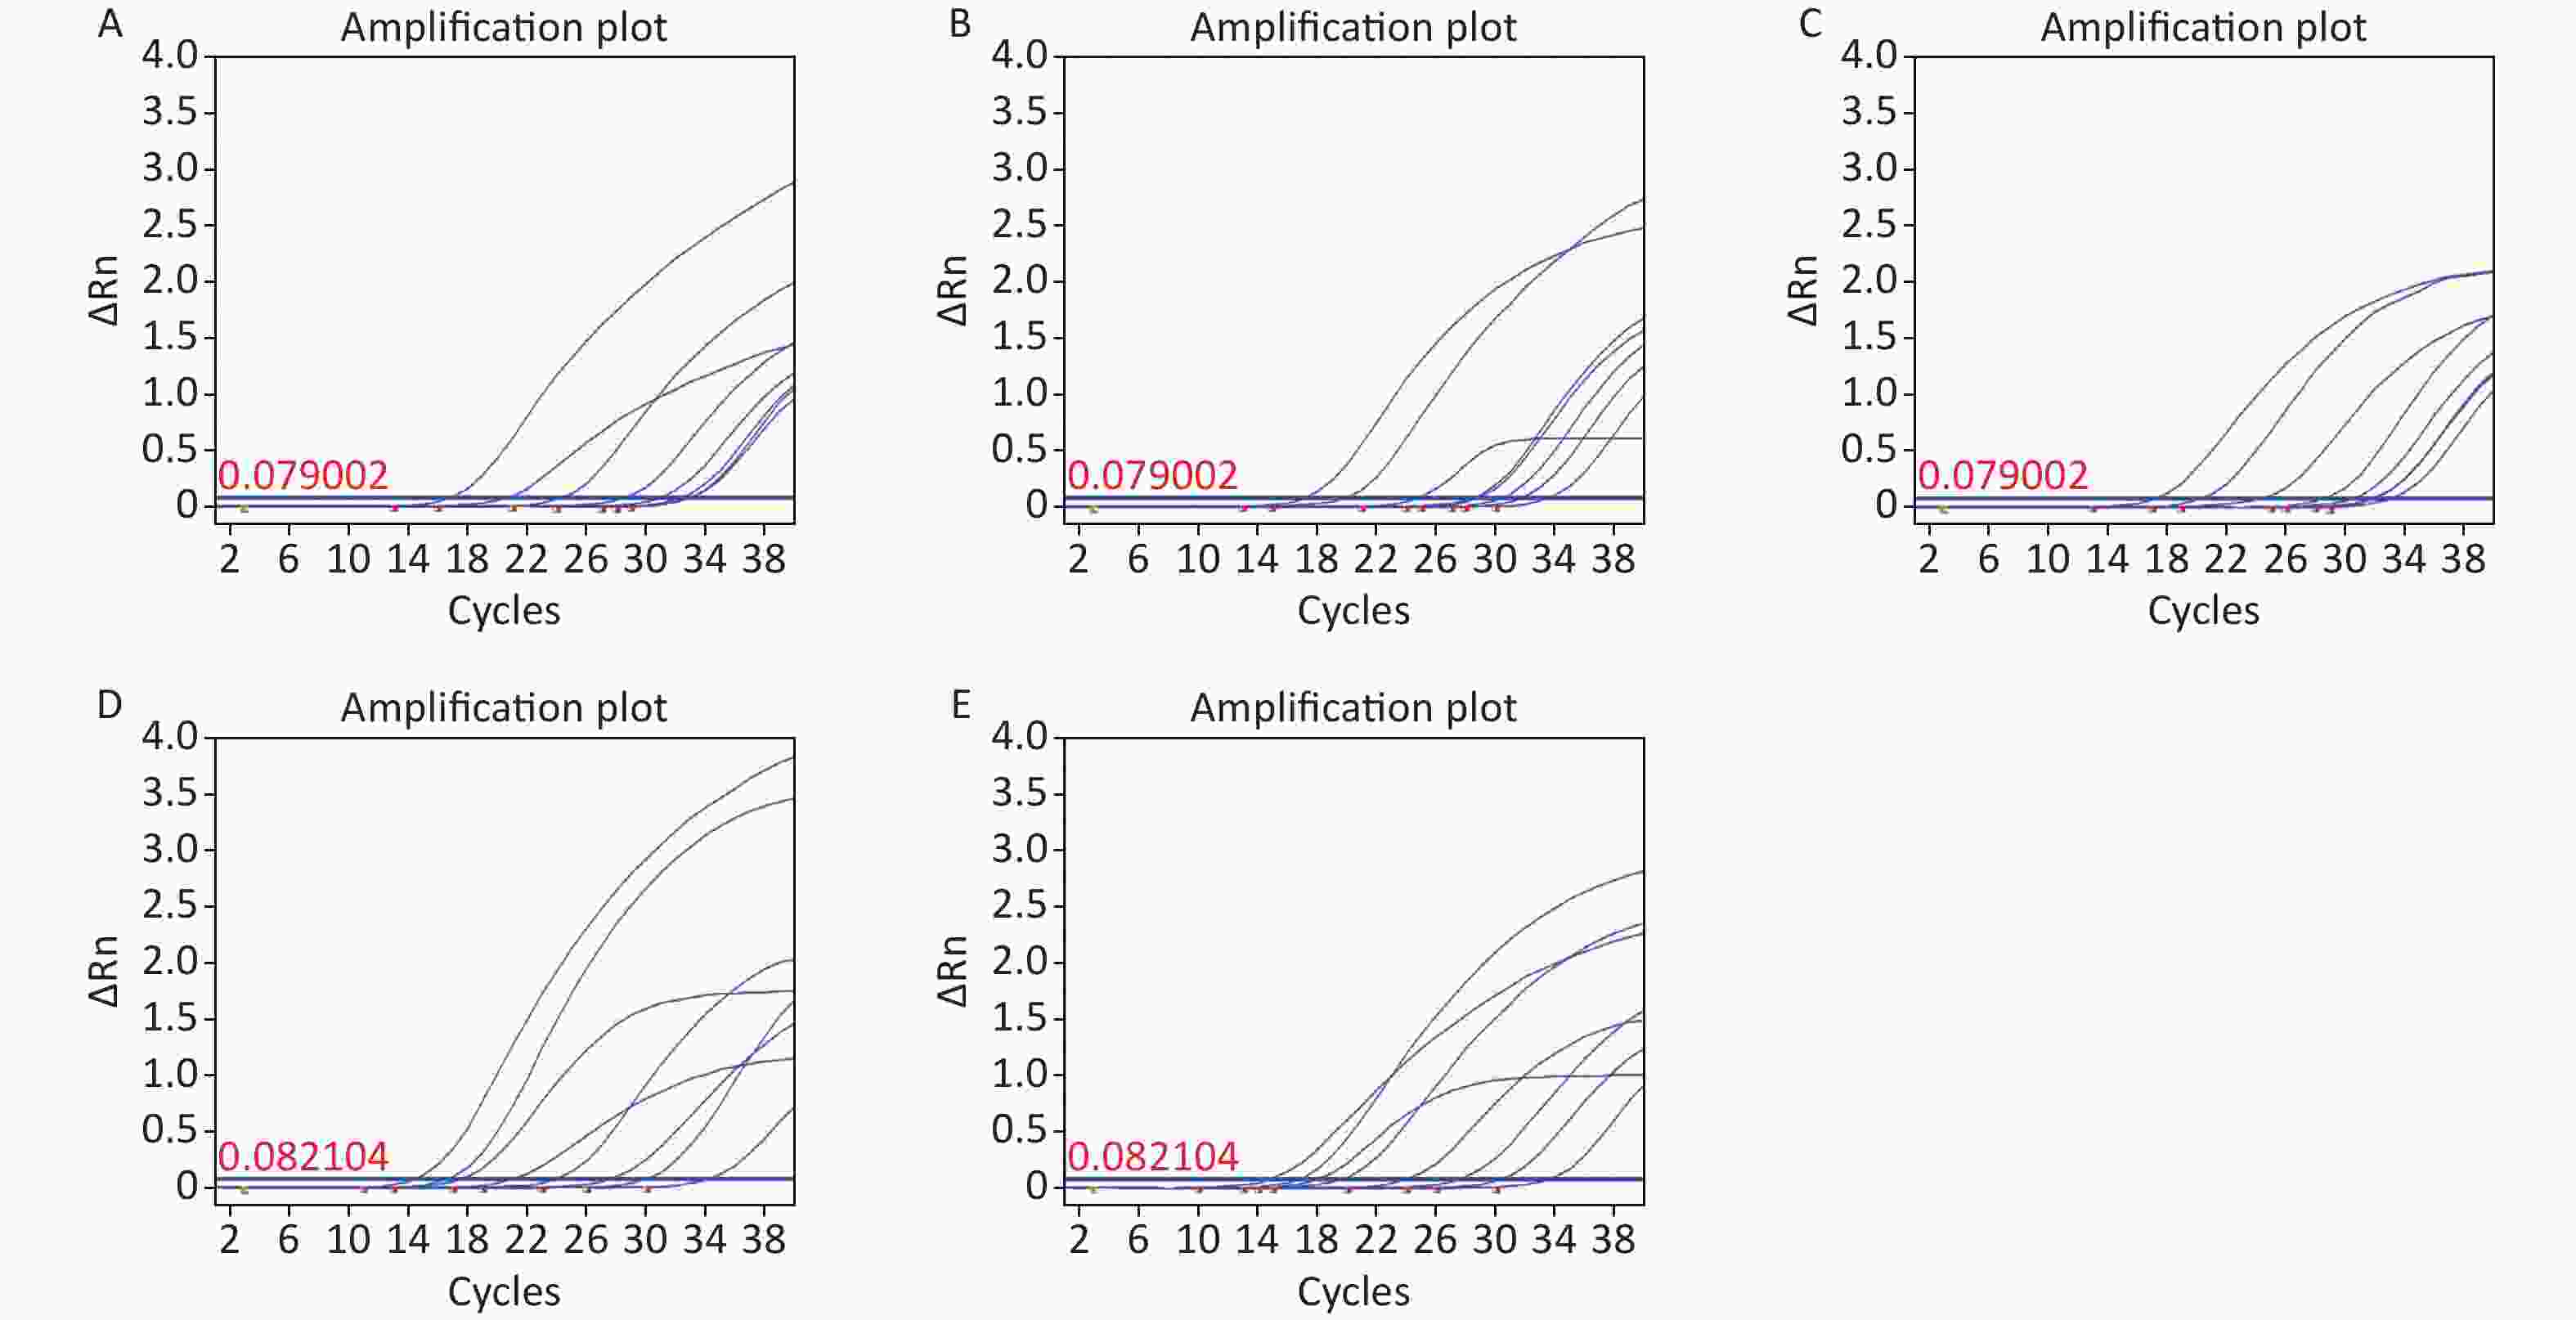
Figure S1. Annealing temperature optimization. (A) 52 °C; (B) 52 °C; (C) 52 °C; (D) 52 °C; (E) 52 °C.
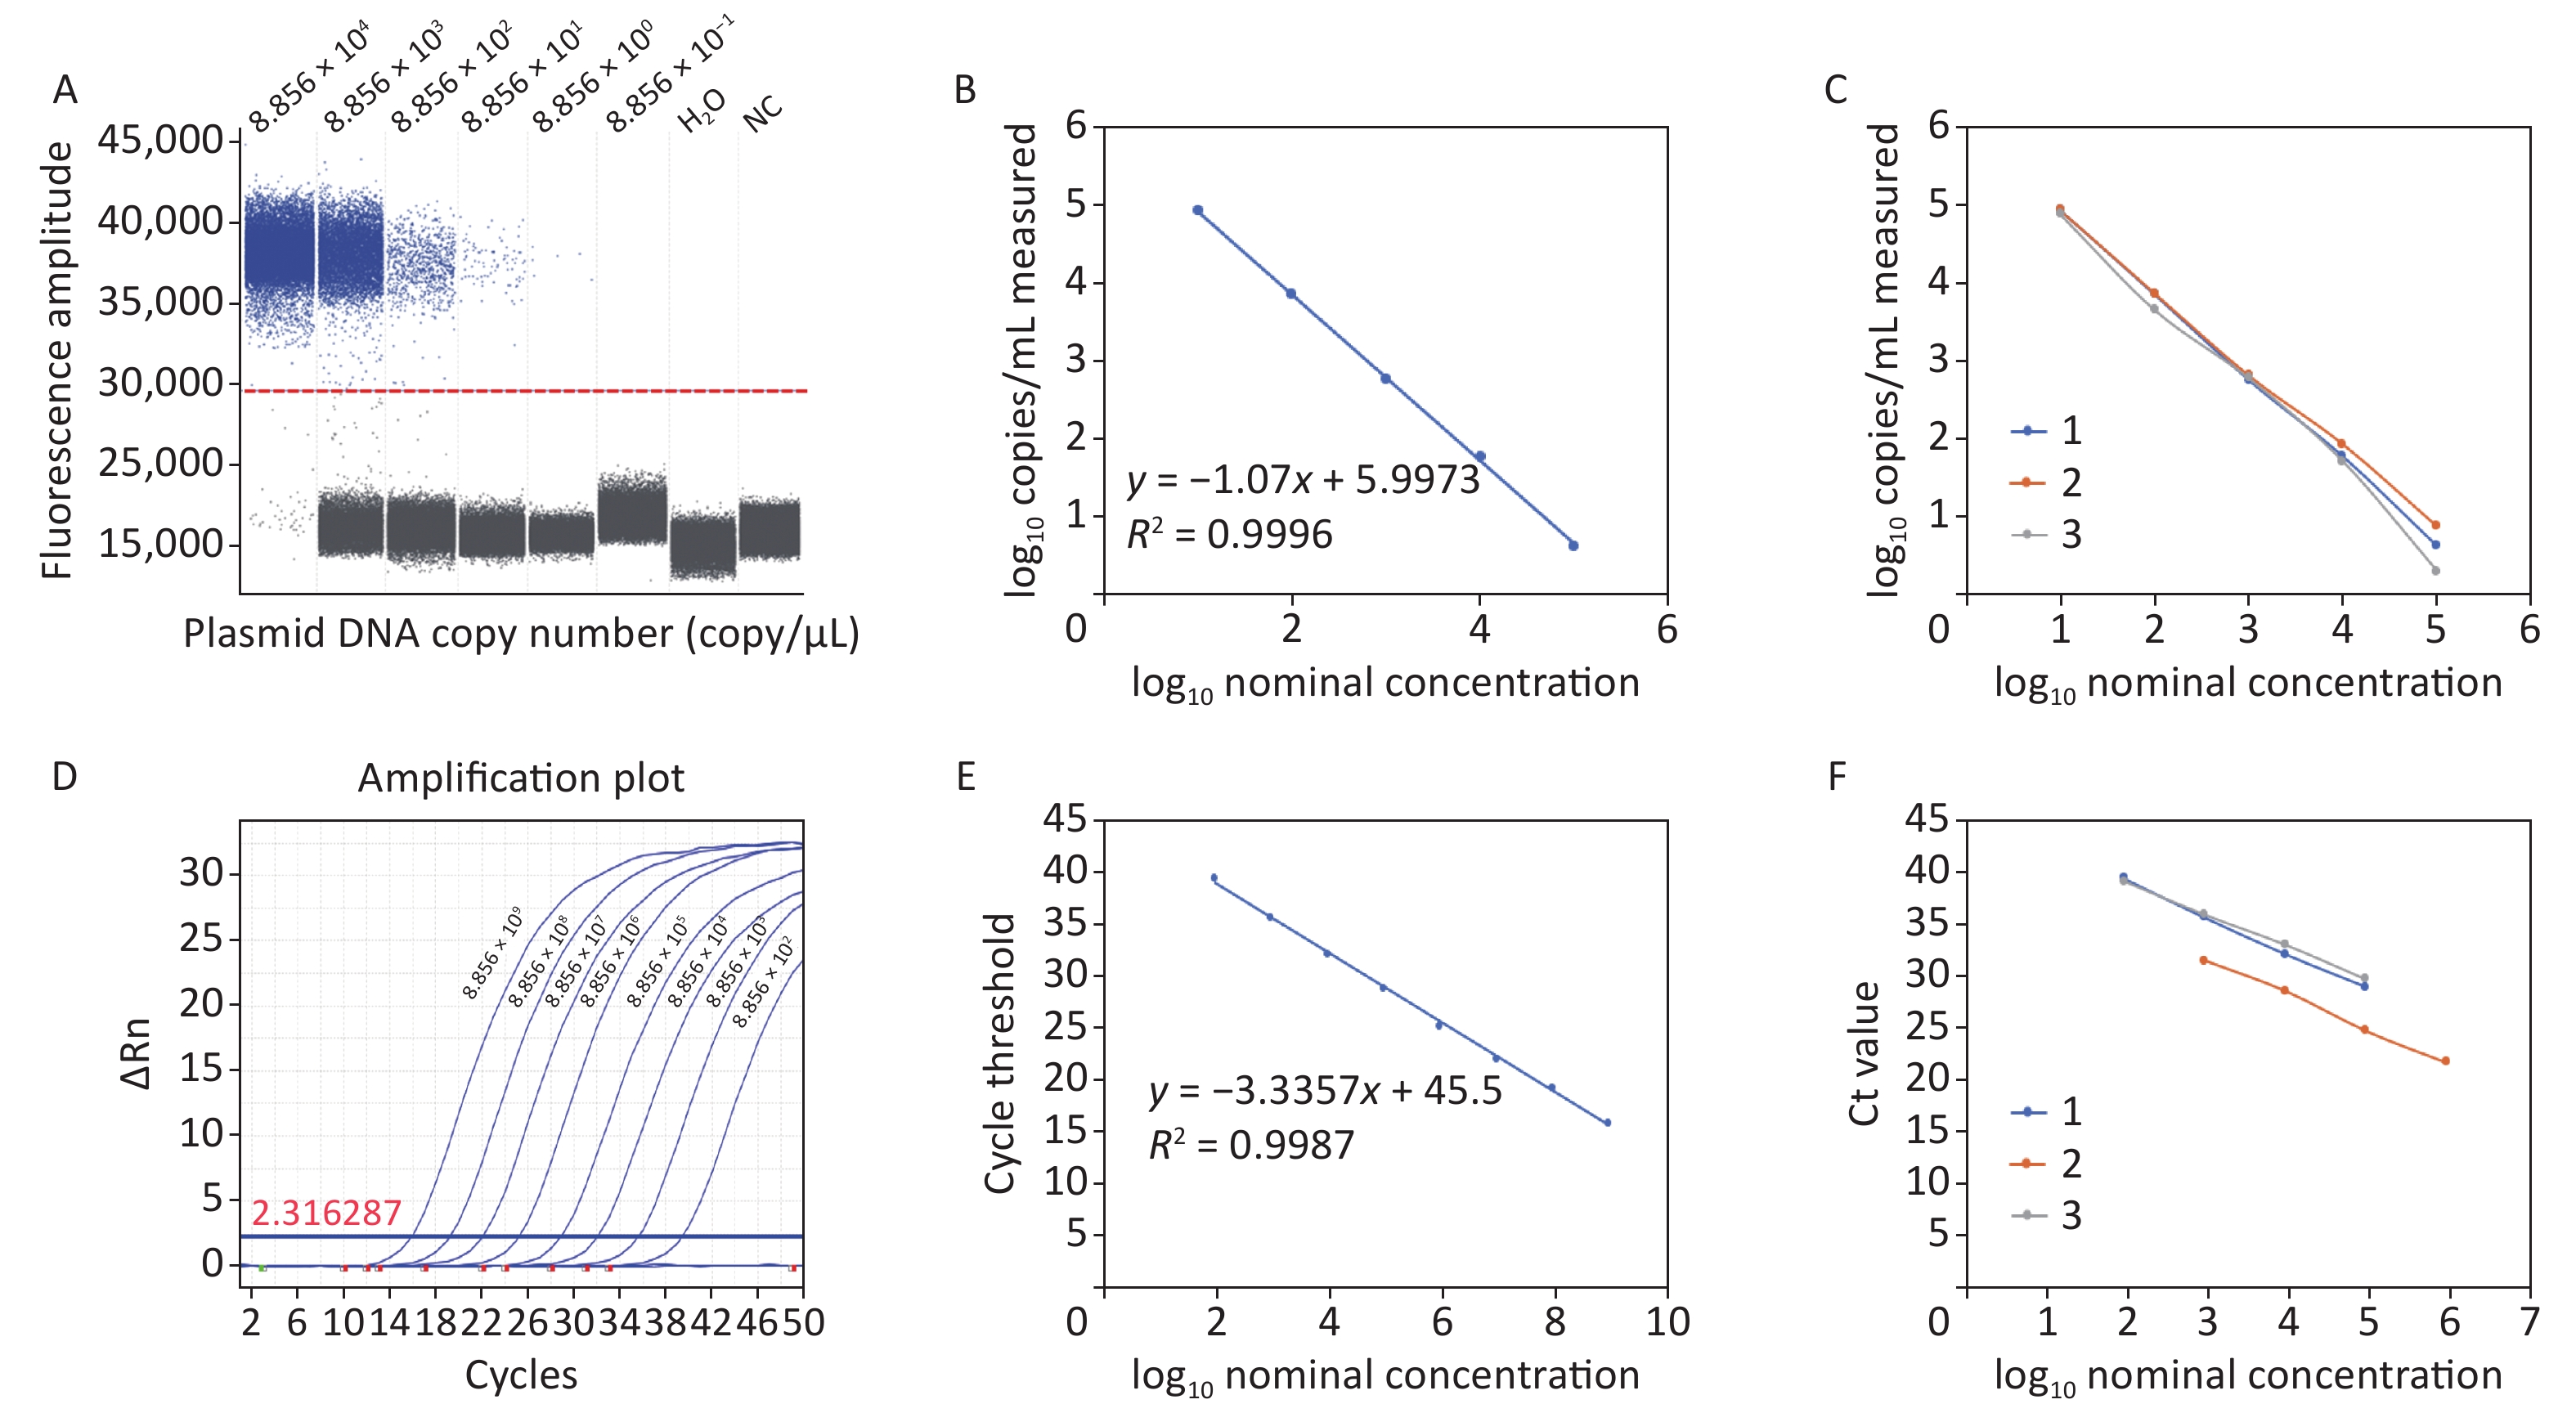
The acquired experimental results showed that the lower limits of detection (LOD) for ddPCR and RT-qPCR against plasmid DNA were 8.856 copies/reaction and 88.56 copies/reaction, respectively (Figure 1A and Figure 1D). The RT-qPCR system failed to generate a meaningful amplification curve when the plasmid DNA copy number was less than 88.56, suggesting limited sensitivity in detecting low levels of C. difficile cDNA. In contrast, ddPCR demonstrated superior performance by detecting C. difficile cDNA at the single-copy level, which represents one of the highest levels of sensitivity achievable in nucleic acid detection. A standard curve was constructed based on the limit of detection (LOD) assay results with a linear correlation of at least 5 log units. The ddPCR results, with a regression coefficient R2
of 0.9996, showed a dynamic detection range of 8.856 × 10⁴ and 8.856 × 100 copies/reaction (Figure 1B). RT-qPCR showed a linear correlation between 8.856 × 10¹¹ copies/reaction and 8.856 × 101 copies/reaction, with a regression coefficient R2 of 0.9988 (Figure 1E). Compared with RT-qPCR, the repeatability results showed that ddPCR had better accuracy and reproducibility (Figure 1C and Figure 1F). Therefore, ddPCR is more stable under quantitative and low-copy number conditions. It is more suitable for the detection of trace C. difficile in a complex sample matrix and achieves absolute quantification. 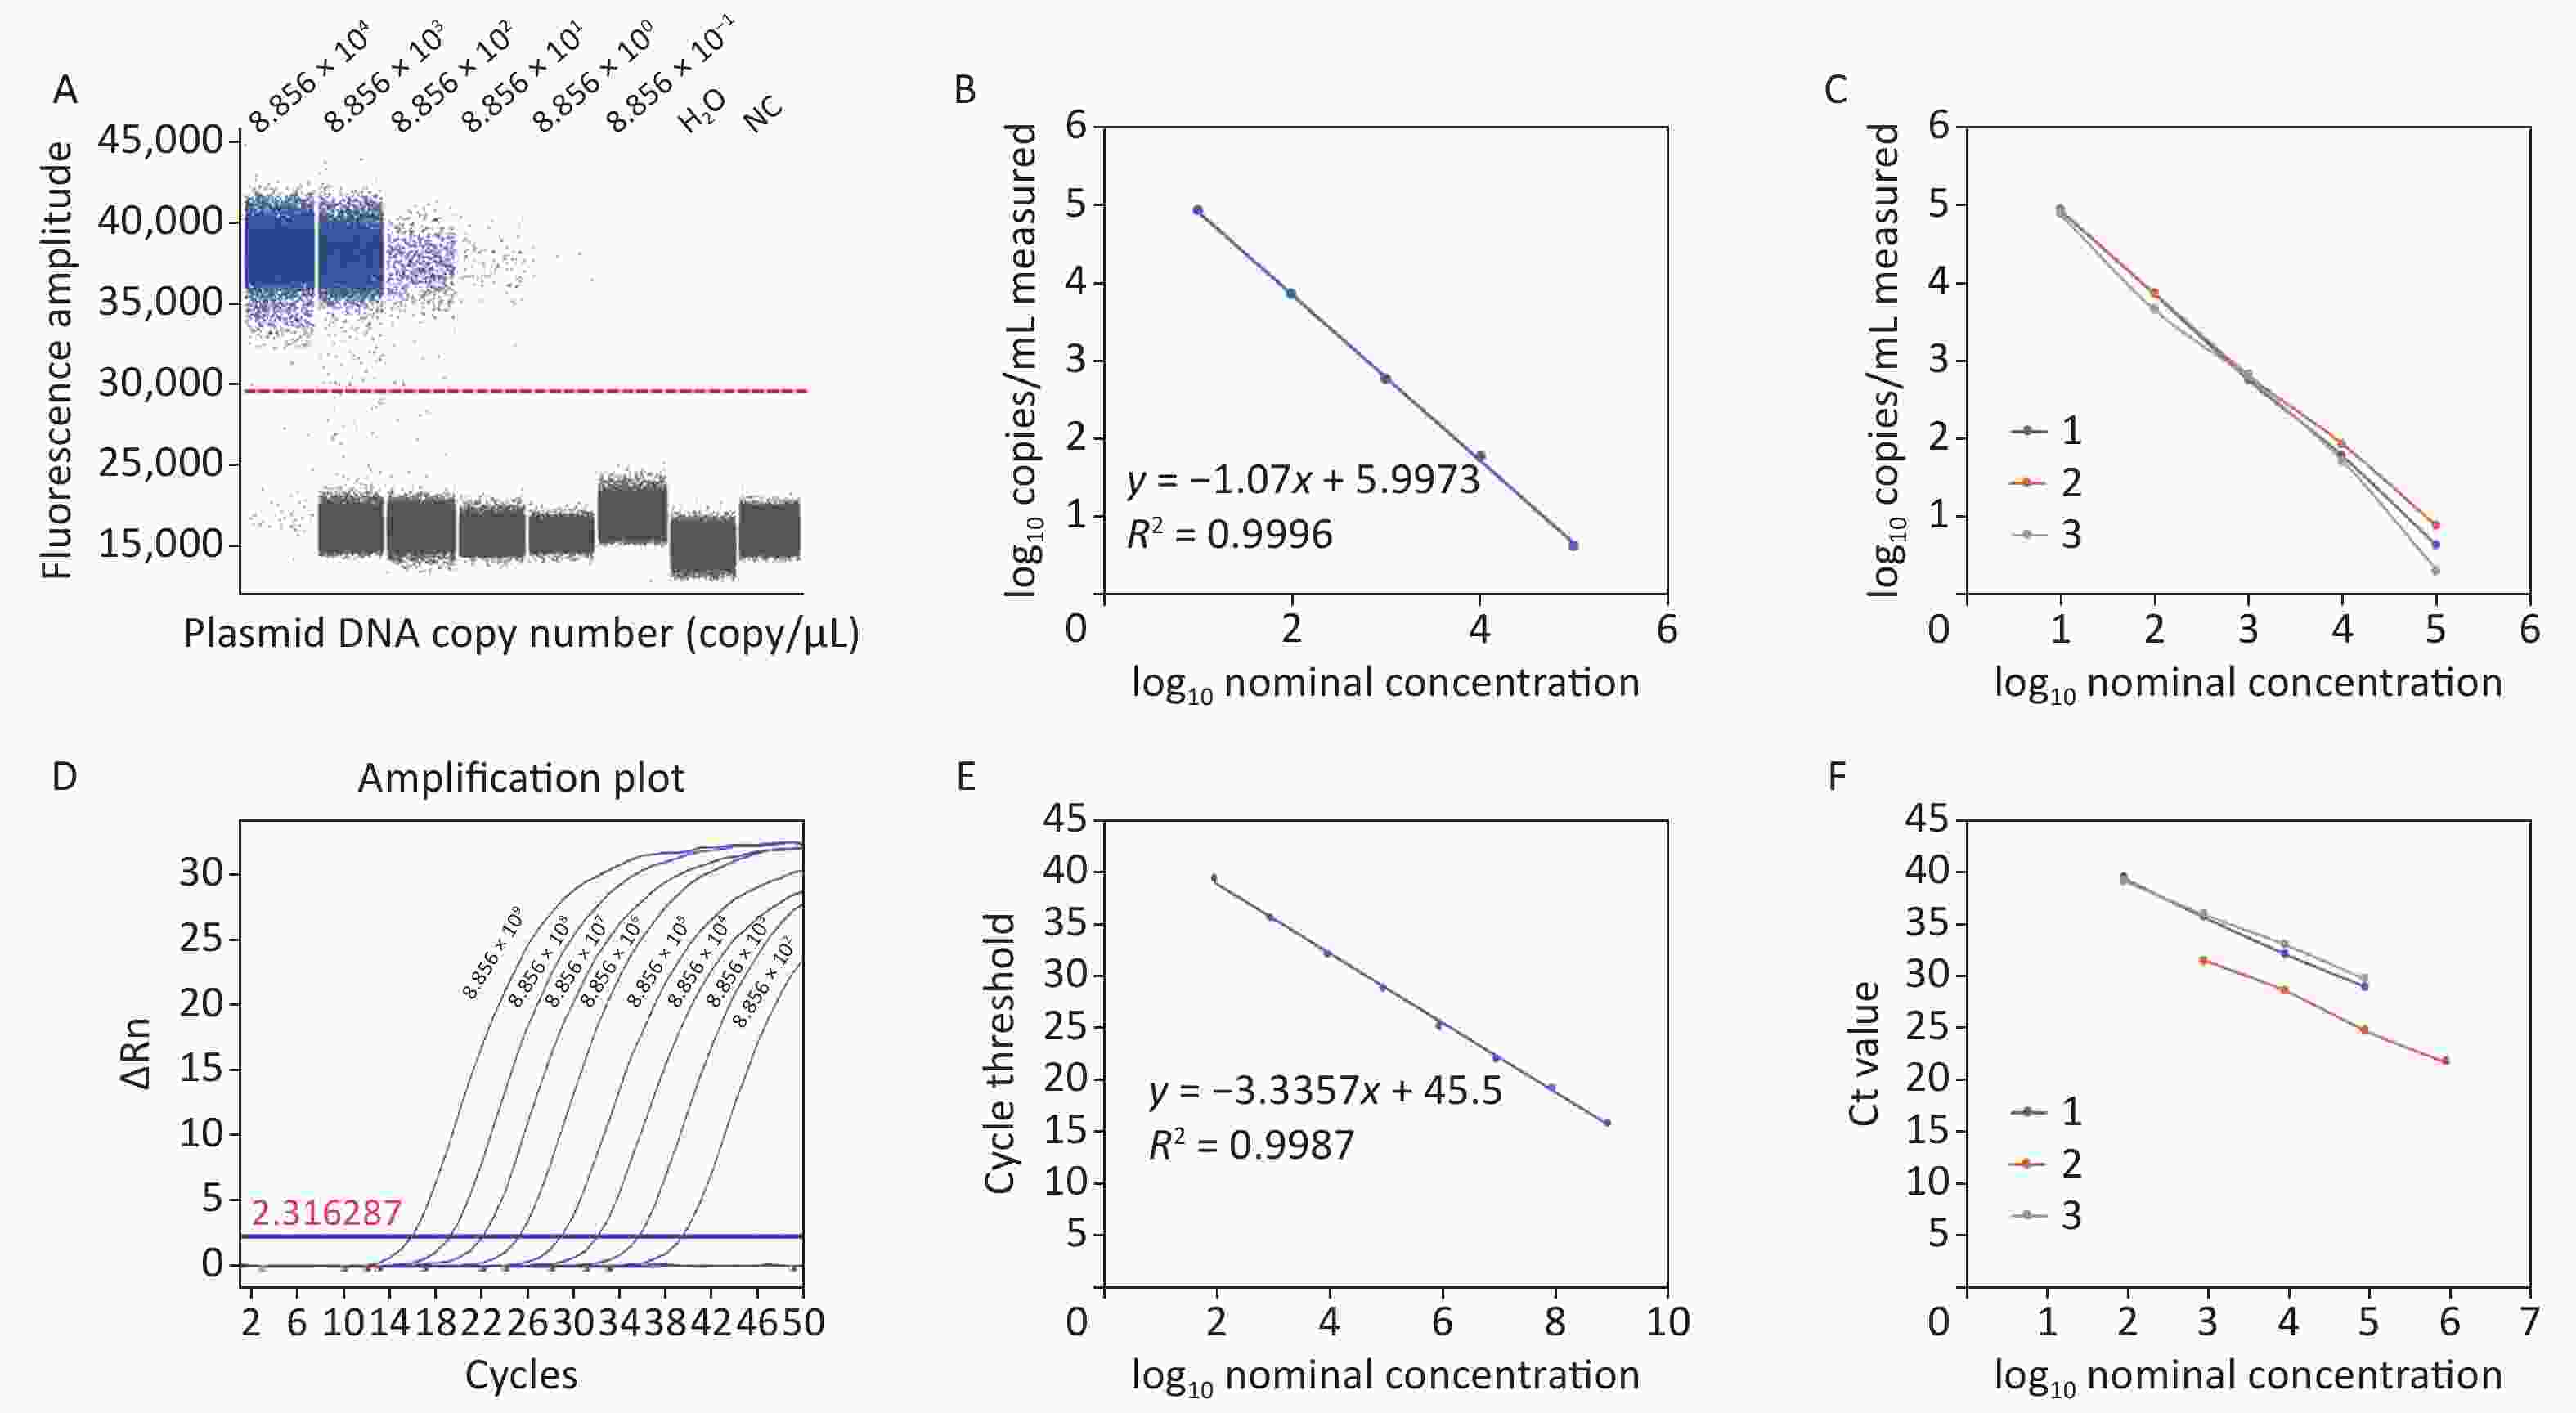
Figure 1. Plasmid detection of ddPCR and RT-qPCR. (A) Plasmid detection limit of ddPCR; (B) Linear correlation of ddPCR; (C) Repeatability of ddPCR; (D) Plasmid detection limit of RT-qPCR; (E) Linear correlation of RT-qPCR; (F) Repeatability of RT-qPCR. PCR, Polymerase chain reaction; ddPCR, Droplet digital PCR; RT-qPCR, Reverse transcription quantitative real-time PCR.
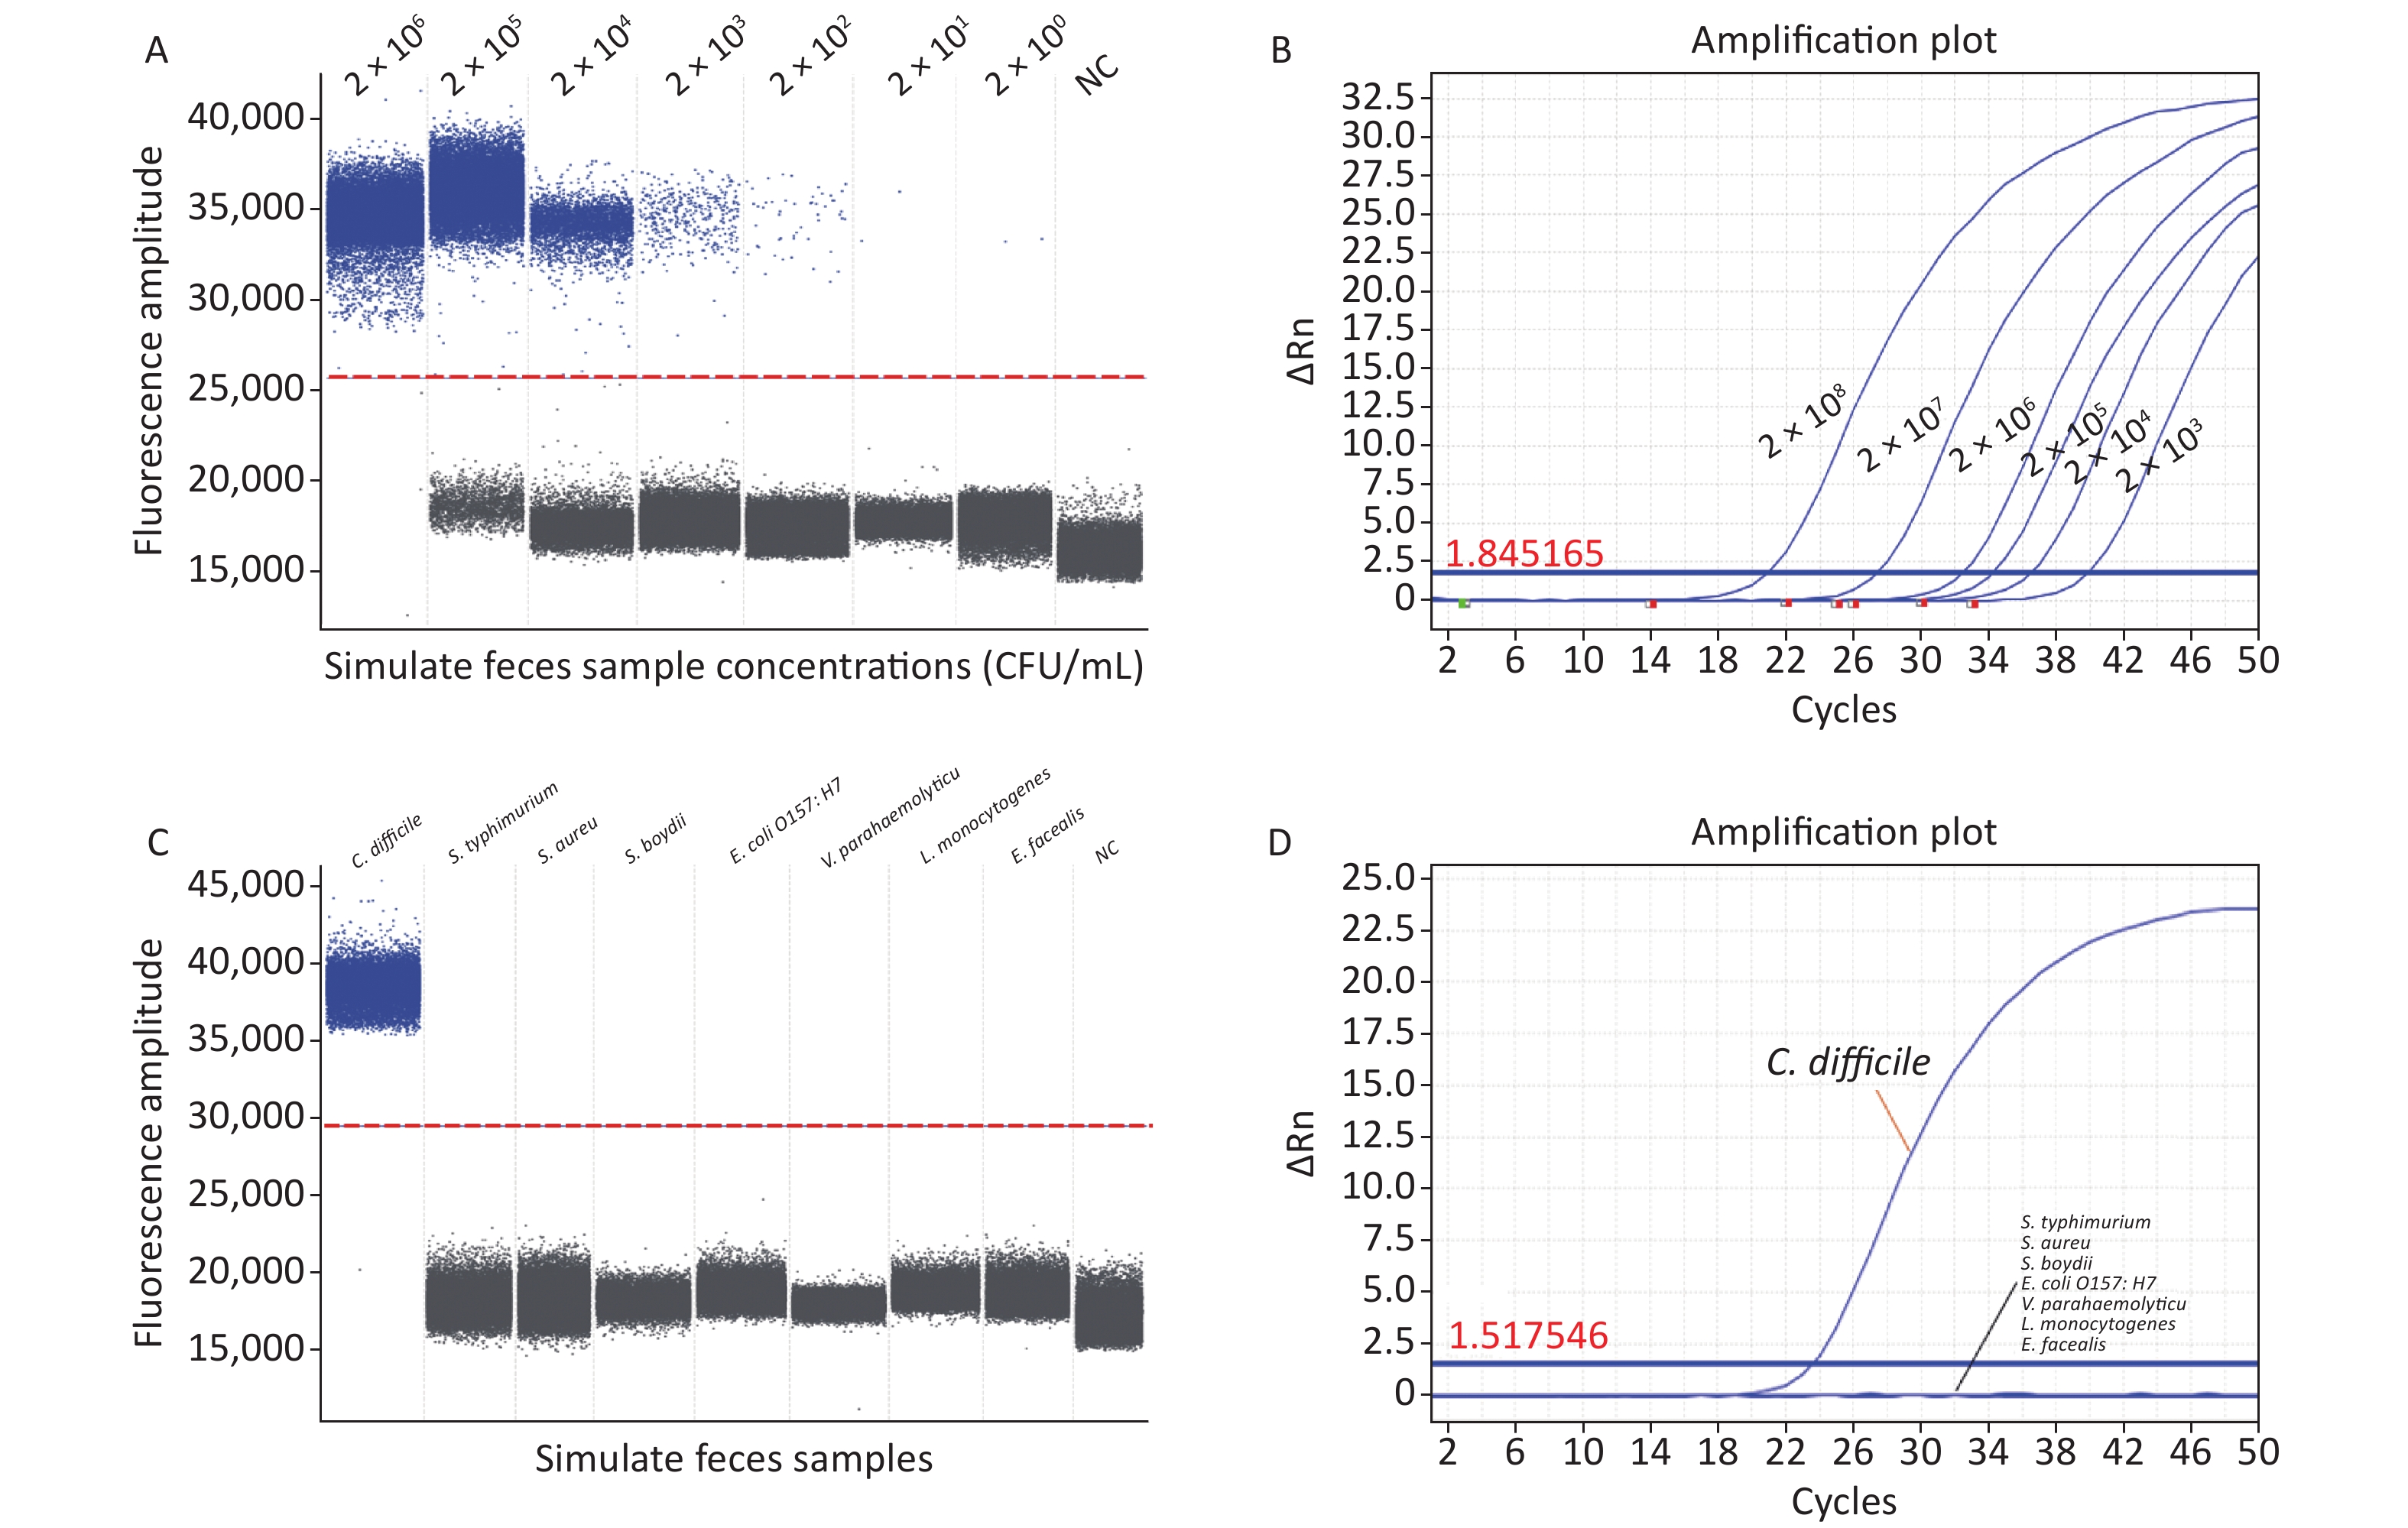
We evaluated the specificity and accuracy of ddPCR using artificially contaminated fecal samples. Our ddPCR method identified C. difficile bacterial nucleic acids at 2 × 101 CFU/mL (Figure 2A) in artificially contaminated fecal samples with a lower detection limit than RT-qPCR (2 × 10³ CFU/mL) (Figure 2B) and was 100-fold more sensitive than RT-qPCR, in agreement with previous studies[6], indicating that ddPCR detection was free from the interference of a complex sample matrix and still had high sensitivity. Furthermore, RT-qPCR requires calibration during the experiment, introducing bias. In contrast, ddPCR quantifies absolute DNA amounts using Poisson's algorithm, eliminating the need for a calibration curve. However, ddPCR has a limitation in accurately quantifying target DNA when the bacterial concentration exceeds 2 × 10⁶ CFU/mL, where the Poisson distribution statistics are not valid; therefore, the dynamic detection range is narrower than that of RT-qPCR. Therefore, to accurately quantify samples, the bacterial solution needs to be diluted to bring it within the measurement range before performing ddPCR experiments, thus increasing the cost and analysis time.
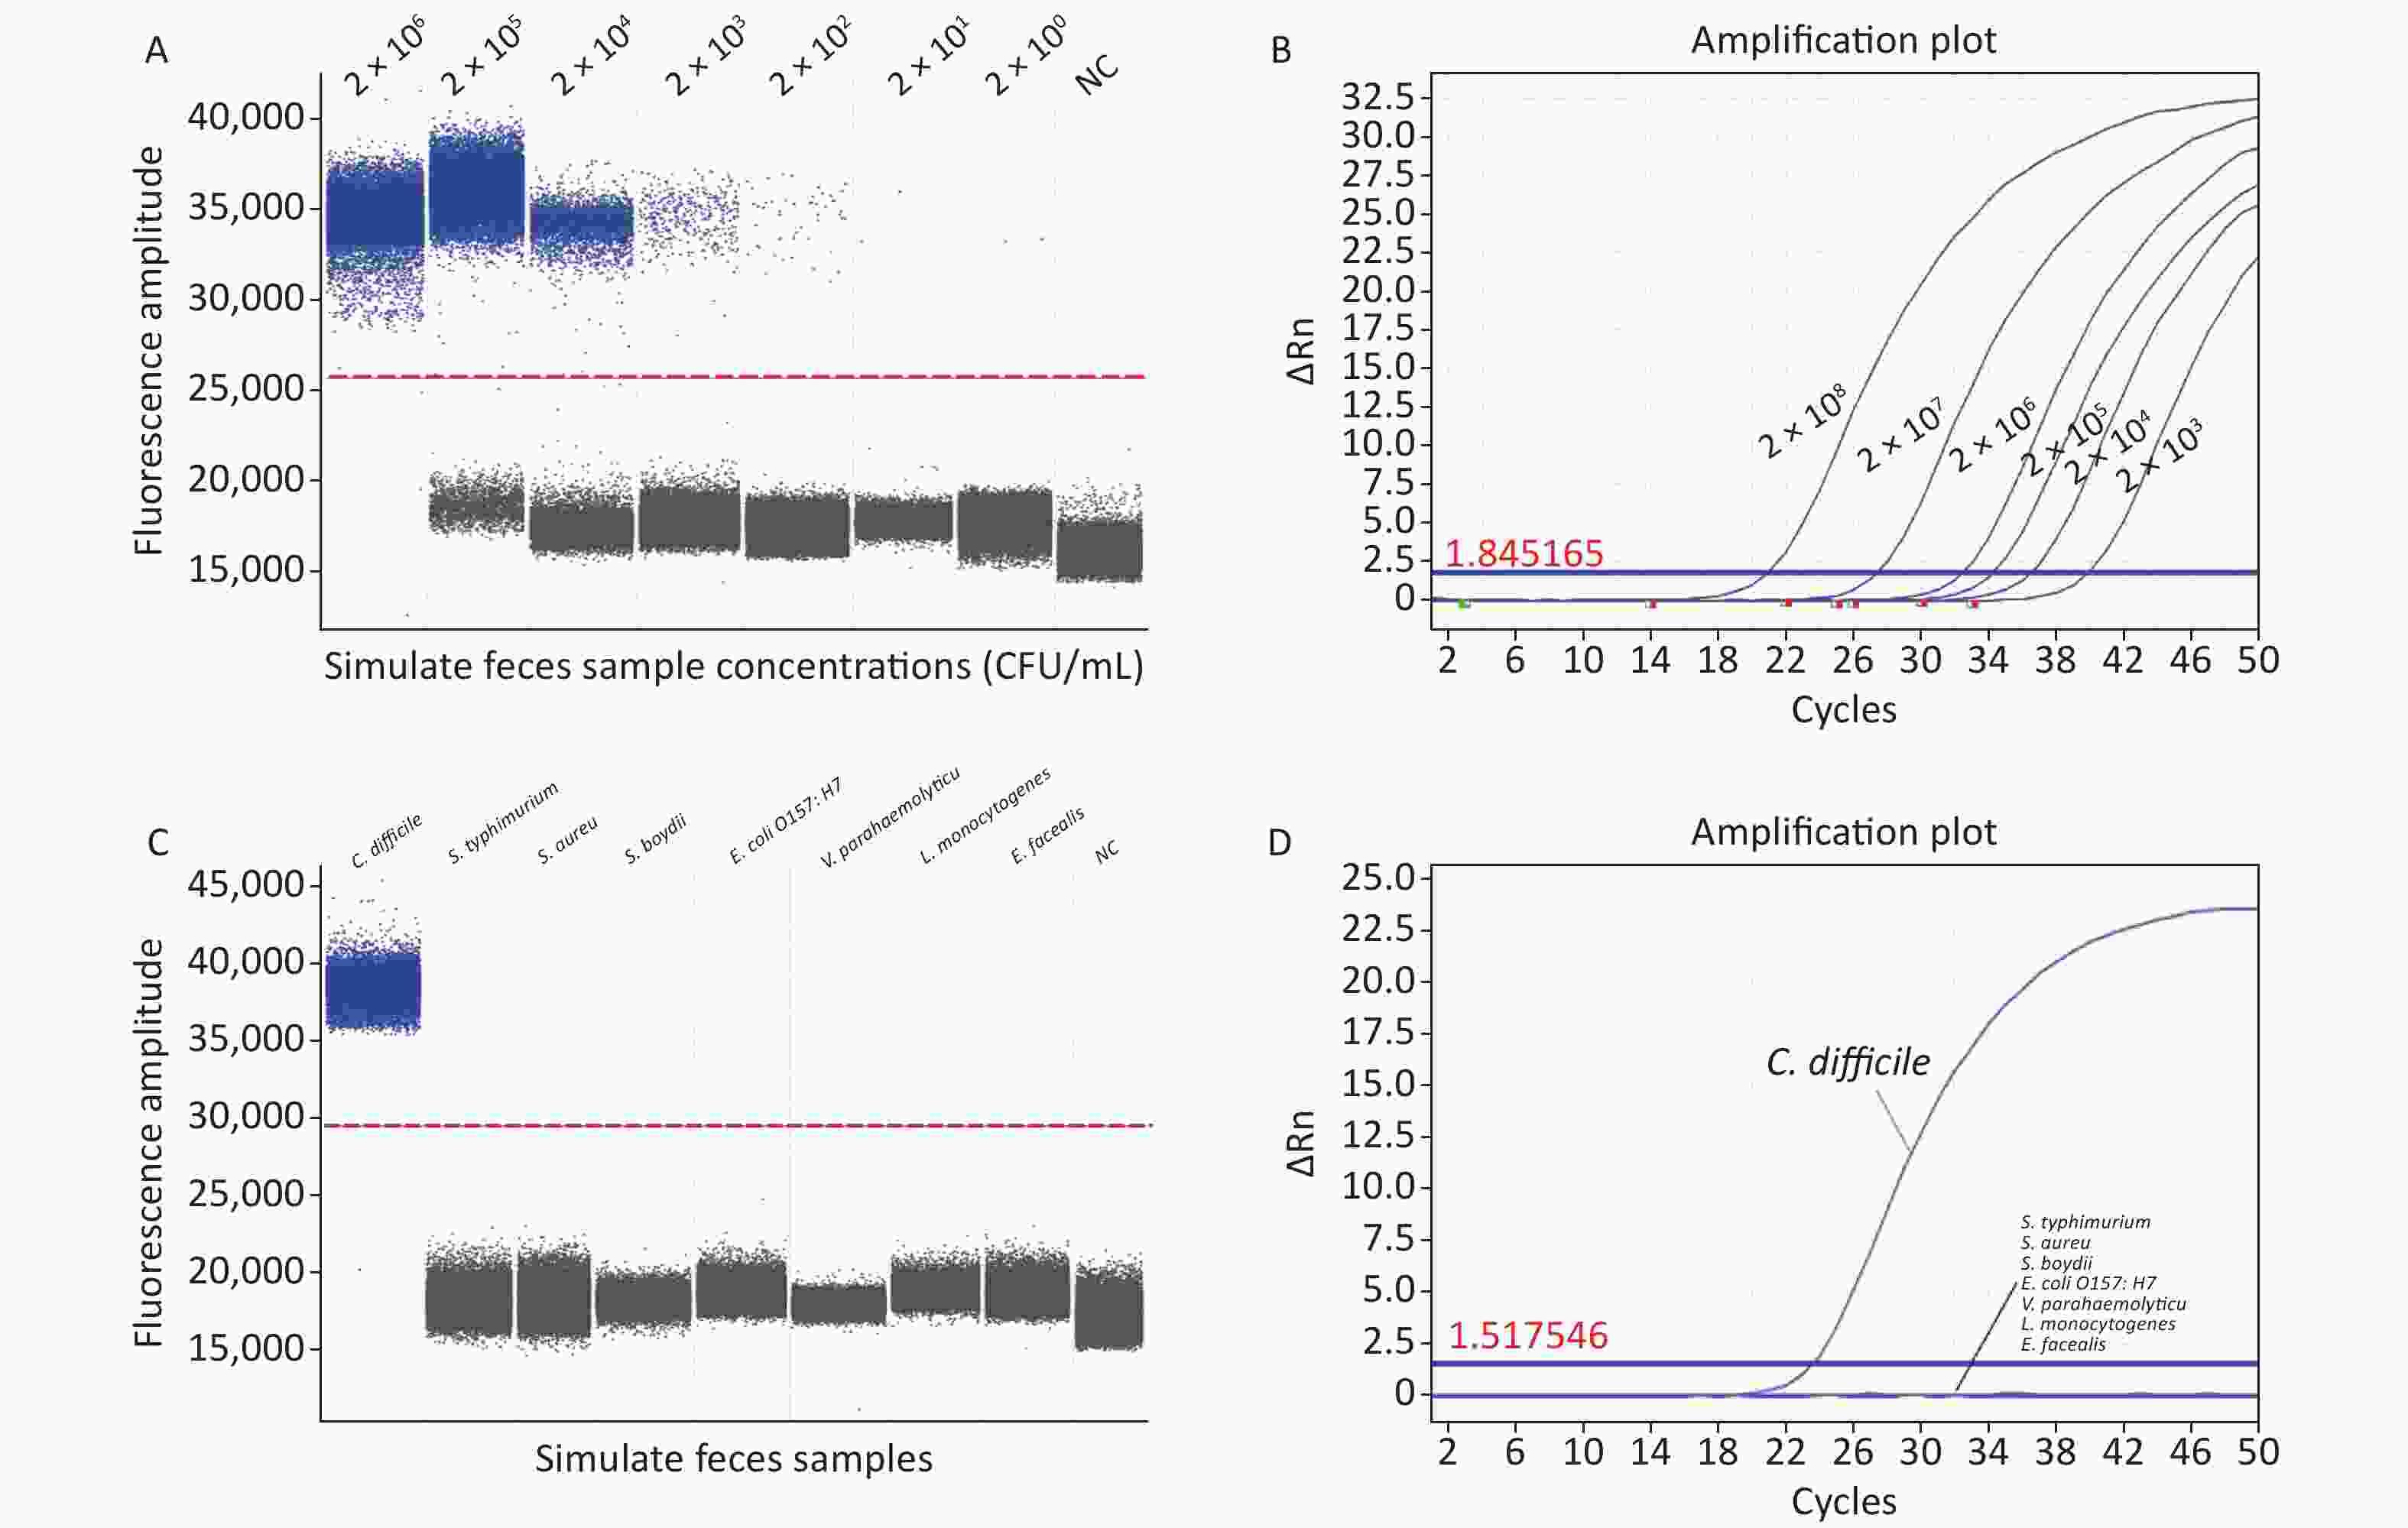
Figure 2. (A) Sensitivity of ddPCR in artificially contaminated feces samples; (B) Sensitivity of RT-qPCR in artificially contaminated feces samples; (C) Specificity of ddPCR in artificially contaminated feces samples; (D) Specificity of RT-qPCR in artificially contaminated feces samples. PCR, Polymerase chain reaction; ddPCR, Droplet digital PCR; RT-qPCR, Reverse transcription quantitative real-time PCR; S. typhimurium, Salmonella typhimurium; S. aureus, Staphylococcus aureus; S. boydii, Shigella boydii; E. coli O157:H7, Escherichia coli O157:H7; V. parahaemolyticus, Vibrio parahaemolyticus; L. monocytogenes, Listeria monocytogenes; E. faecalis, Enterococcus faecalis; NC, negative control.
To avoid false positive errors in the ddPCR, DNA templates of Salmonella typhimurium (S. typhimurium, ATCC13311), Staphylococcus aureus (S. aureus, ATCC49775), Escherichia coli O157:H7 (E. coli O157:H7, ATCC11229), Vibrio parahaemolyticus (V. parahaemolyticus, ATCC17802), Shigella boydii (S. boydii, ATCC9207), Listeria monocytogenes (L. monocytogenes ATCC19111), and Enterococcus faecalis (E. faecalis, ATCC29212) were used to verify the specificity of the ddPCR assay. In the ddPCR experiments, for the negative controls, the FAM fluorescence channel showed no positive signal in any of the experiments performed in this study and no contamination of the ddPCR system. In the positive group, a significantly positive signal was detected in the FAM channel, whereas no signal was detected in the negative group. Non-C. difficile samples did not produce amplification products (Figure 2C); thus, their interference with C. difficile detection was negligible, indicating that the ddPCR method established in this study was consistent with the RT-qPCR results (Figure 2D) and was highly selective for C. difficile in complex fecal matrices.
Seven clinical C. difficile isolates were directly analyzed using the ddPCR method established in this study. The ddPCR assay showed that six clinical isolates harbored the specific toxin tcdB gene, and ddPCR amplification showed positive droplets and negative droplet aggregation (Figure 3A). The clinical C. difficile isolates was 100%, indicating the prevalence of hypervirulent C. difficile strains. Although cases related to the typing and detection of C. difficile infections have mainly been reported in North America and Europe, with limited cases in China. This study confirms the presence of epidemic highly pathogenic C. difficile strains, consistent with previous reports[7]. A limitation of this study is that few isolates were obtained. Therefore, to ensure the rigor of this study, we used RT-qPCR and Sanger sequencing to verify the detection results.

Figure 3. Detection of clinical isolates. (A) ddPCR; (B) RT-qPCR. PCR, Polymerase chain reaction; ddPCR, Droplet digital PCR; RT-qPCR, Reverse transcription quantitative real-time PCR.
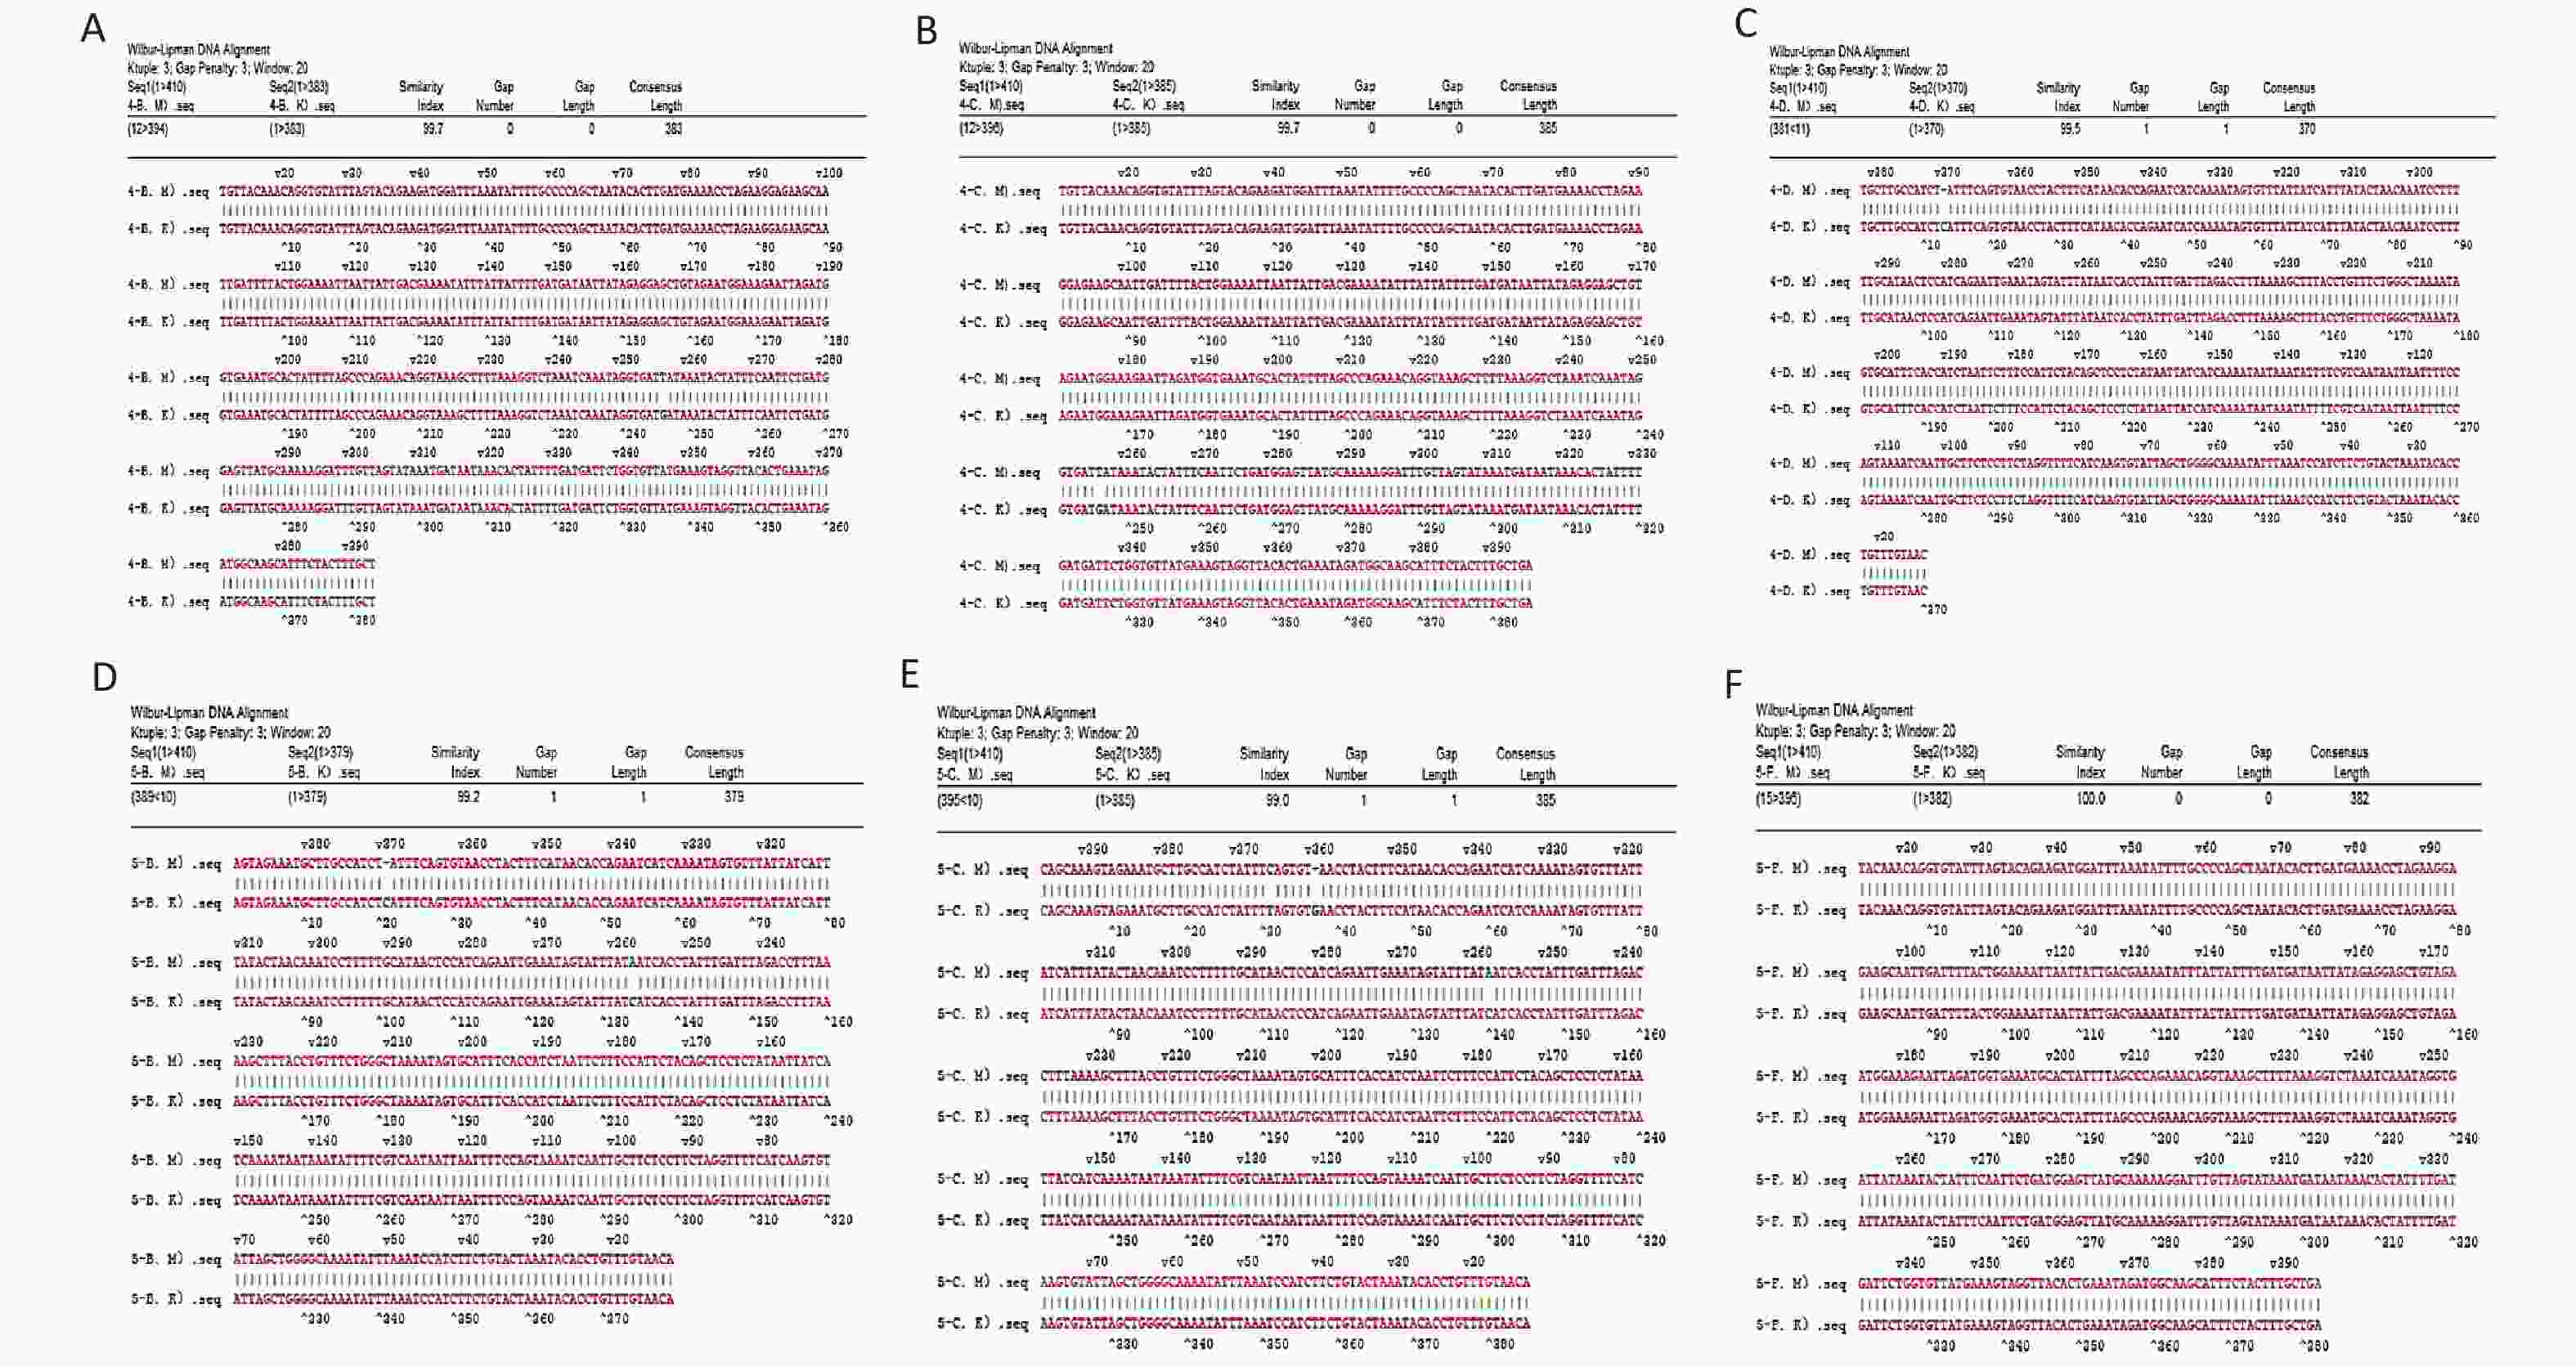
The RT-qPCR fluorescence amplification curve showed that the six isolated strains were positive for the specific toxin tcdB (Figure 3B). The amplified products were sequenced and sequence homology was compared using NCBI and DNAStar software. The results showed that the homology of isolates 106, D4, D5, 112813, 1904084, and 11151 was 99.7%, 99.7%, 99.5%, 99.2%, 99.0%, and 99.0%, respectively (Supplementary Figure S2, available in www.besjournal.com). Sequence alignment showed that the clinical isolates from our hospital were tcdB gene-positive C. difficile strains, and the amplified product was the target DNA sequence. The results obtained from our developed ddPCR assay were consistent with those of RT-qPCR and Sanger sequencing (Supplementary Table S4, available in www.besjournal.com), indicating the accuracy of the ddPCR method. Thus, our established ddPCR method allows for direct quantification of C. difficile in fecal samples by determining the number of positive droplets. This approach enables the assessment of the severity and course of CDI in patients without the need for standard curves or tedious operational steps, such as electrophoresis. Compared to some widely used methods, the ddPCR established in this study showed superior properties in terms of detection limit and sensitivity. The sensitivity and detection limit of this method were lower than many reported assays[8], including the gold standard “the CCNA,” Raman spectroscopy, colorimetric assay, NanoBiT split luciferase assay, and chemiluminescence immunoassay. The LAMP assay reported by Baek et al. had a higher LOD than our assay[9]. The greatest advantage of our method is the absolute quantitative detection of C. difficile directly, which simplifies the detection process using an automated instrument for pathogen detection[10]. ddPCR is suitable for clinical C. difficile microdetection because it is not limited to amplification efficiency and can quantify target genes in fecal samples. In the future, ddPCR may be used as a complementary method to qPCR and may show greater efficacy.
Clinical isolate Method ddPCR Sanger RT-qPCR 106 + + + 11151 + + + 112813 + + + 1904084 + + + D4 + + + D5 + + + 1904082 − − − Table S4. Test results of clinical isolates
The authors have no conflicts of interest to declare.
YIN Cai Hong, and SONG Zhan Yun: Conceptualization, methodology, data curation, and writing–original draft preparation. LIU Xing Xing, WANG Xiao Mu, WANG Ying, and GAO Chen Cheng: software, and investigation. FENG Xin and SONG Xiu Ling: supervision, writing-reviewing and editing.
HTML
 22418+Supplementary Materials.pdf
|

|







 Quick Links
 DownLoad:
