


-
Radon (222Rn) is a radioactive inert gas produced by the decay of Ra (226Ra). Relevant studies have shown a significant correlation between radon exposure and increased incidence of leukemia and lung cancer[1,2]. After smoking, radon is the second most common cause of human lung cancer[3]. The United Nations Scientific Committee on the Effects of Atomic Radiation (UNSCEAR) pointed out that radon is soluble in water, and its solubility decreases rapidly with an increase in temperature[4]. 222Rn in water is a potentially important source of health hazards to human beings because the rocks and soils through which the water circulation process flows, as well as the water itself, contain the nuclide 226Ra.
The presence of uranium minerals in a region leads to a radon concentration in groundwater between 1.13 and 457.35 Bq·L−1. Approximately 10% of the radon concentration in the study sample is higher than the maximum contamination level of 100 Bq·L−1 recommended by the World Health Organization (WHO)[5]. The bottom sediment carried by the river basin into which wastewater from uranium mining facilities is discharged has relatively high natural radioactivity, and the radon concentration dissolved in the water is also relatively high. The radium content in the bottom sediment ranges from 100 to 2,000 Bq·kg−1, and the sludge from mine water treatment has a radium content as high as 1,690 Bq·kg−1[6]. This shows that radon-containing water bodies in uranium mines pose a radioactive pollution hazard to the surrounding environment that cannot be ignored, which endangers the health of uranium mine workers and simultaneously restricts a sustainable social and economic development.
Reducing radon exhalation from the surface of radon-containing water bodies has become a key problem that urgently needs to be addressed for environmental treatment. Current research has focused on the bioremediation of radon-containing water bodies[7-9], establishing multiple barriers to them[10], setting up closed chambers in the upper parts of ponds[5] and using nanomaterials to absorb radon[11]. However, most nanomaterials cannot be synthesized on a large scale at low cost, which limits their practical application in radionuclide contamination management. The use of isolated and confined spaces is also ineffective. Because of the change in the air exchange rate and water level, the radon in the air layer in the confined room is released into the outside atmosphere, and the radon concentration in the air around the mine increases, leading to an increase in the radon dose to the staff and the surrounding public.
In radon pollution prevention and control, the cover method has become one of the effective methods to retard the exhalation of airborne radon[12-14]. Ye et al. designed and manufactured modular floats and studied the effectiveness of modular surface-covering floats in retarding radon release from water surfaces[15]. Their study shows that the proposed modular floats are effective in retarding radon release. Therefore, a numerical simulation was conducted to optimize the coverage effect by considering economic and environmental factors. Numerical simulations are significant in experimental research and practical applications. Experiments to determine the effects of the area coverage rate, diffusion coefficient, and radon transfer velocity on the radon retardation rate have proven to be expensive and costly. A simulation can better reveal the law of the experimental response and be more systematic. Furthermore, the experimental period is longer, and the simulation is more efficient. In addition, the consistency between the simulation and experimental results suggests that the simulation can provide guidance for future engineering design optimization. In terms of research methods, computational fluid dynamics (CFD) has been better applied in the migration and exhalation of airborne radon[16-18]. In view of this, this study considers radon-containing water bodies (including the bottom mud of water bodies) in uranium mines as the research object and adopts a method combining physical experiments and numerical simulations. It establishes a migration model of radon-containing water bodies under different physical parameters based on the water body radon release simulation experimental device and the actual size of the modular float. Further, it compares the numerical simulation results of the radon-retardation effect of radon-containing water bodies with the experimental results. This research has significant scientific value for enriching and developing the theory and methods of radon protection for water bodies in uranium mines. It optimizes the design of radon protection by covering water bodies, thus protecting the environment around mines as well as the health of workers and the public.
-
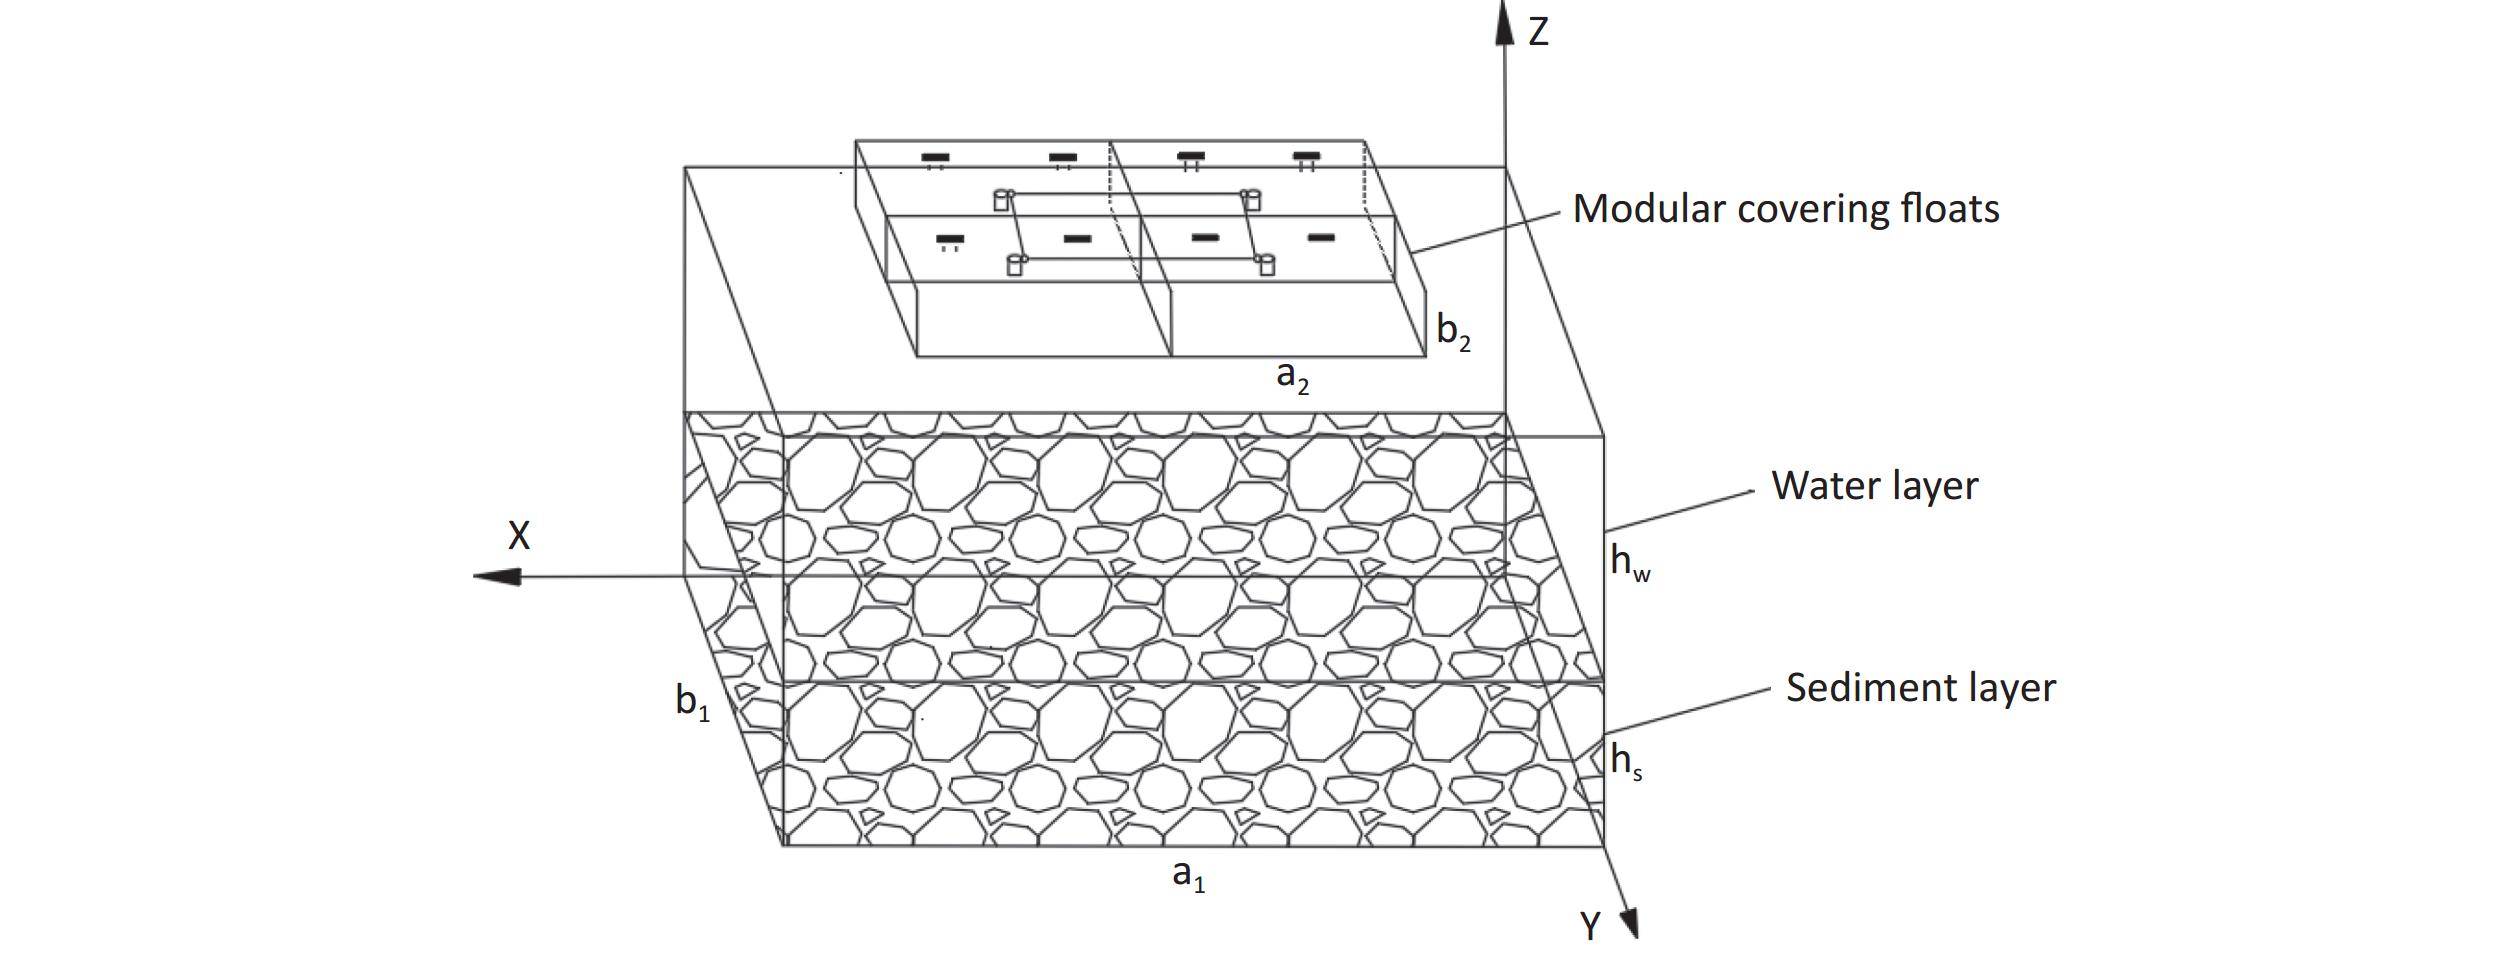
As shown in Figure 1, based on the size of the designed modular floats and the experimental setup constructed by Ye et al.[15], a three-dimensional model was established to study the radon retardation law for covering floats in radon-containing water bodies. The model is primarily composed of two parts: (1) a sediment-containing water body, with the overlying water layer representing the pure water zone and the sediment layer representing the porous zone. The length ($ {a}_{1} $) of the water body is 0.485 m, the width ($ {b}_{1} $) is 0.335 m, the thickness of the overlying water ($ {h}_{\mathrm{w}} $) is 0.1 m, and the sediment thickness ($ {h}_{\mathrm{s}} $) is 0.03 m. (2) Some combined modular floats with side length ($ {a}_{2} $) of the single modular float of 0.155 m and thickness ($ {b}_{2} $) of 0.045 m.
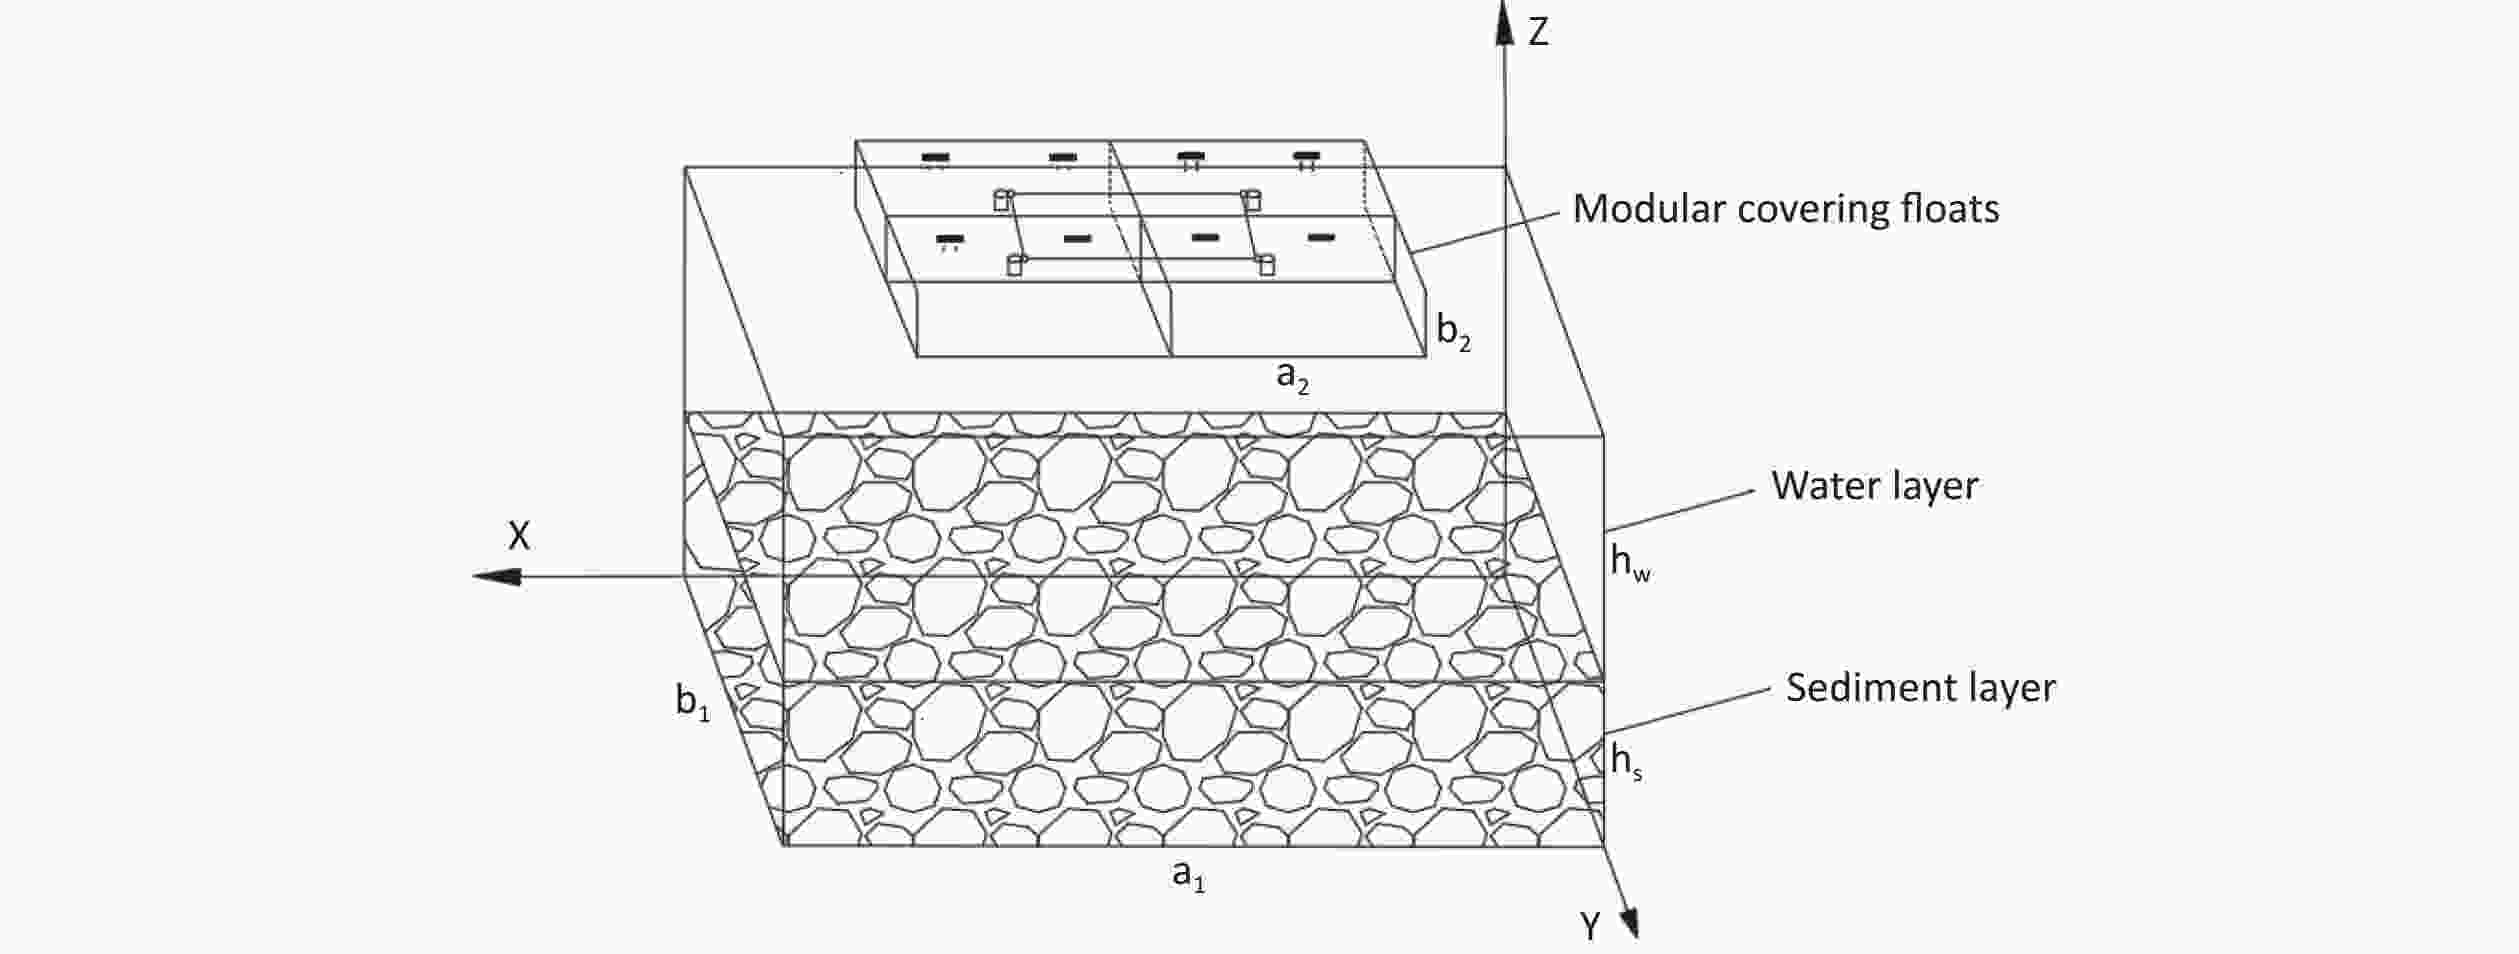
Figure 1. Three-dimensional diagram of water with modular floats.
-
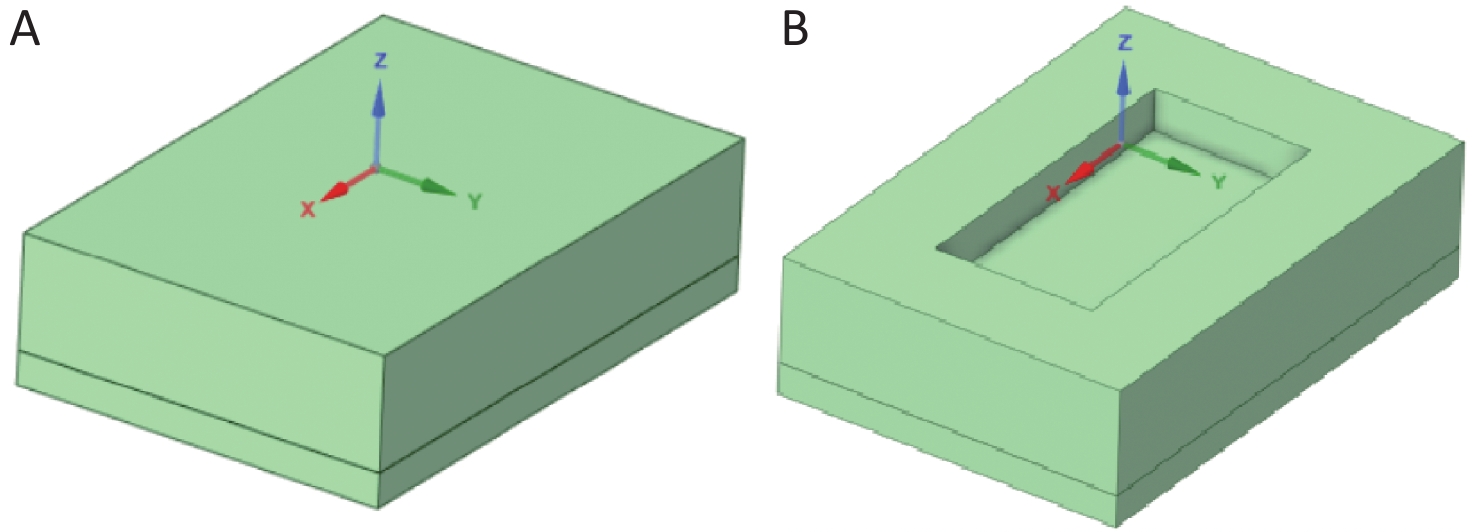
As one of the geometric model pairs, the uncovered and float-covered (with area coverage rate of 29.6%) geometric models are shown in Figure 2. The length × width × thickness of the uncovered water body is 0.485 m × 0.335 m × 0.130 m, whereas the length × width × thickness of the float-covered area is 0.310 m × 0.155 m × 0.040 m (two combined floats)[15].
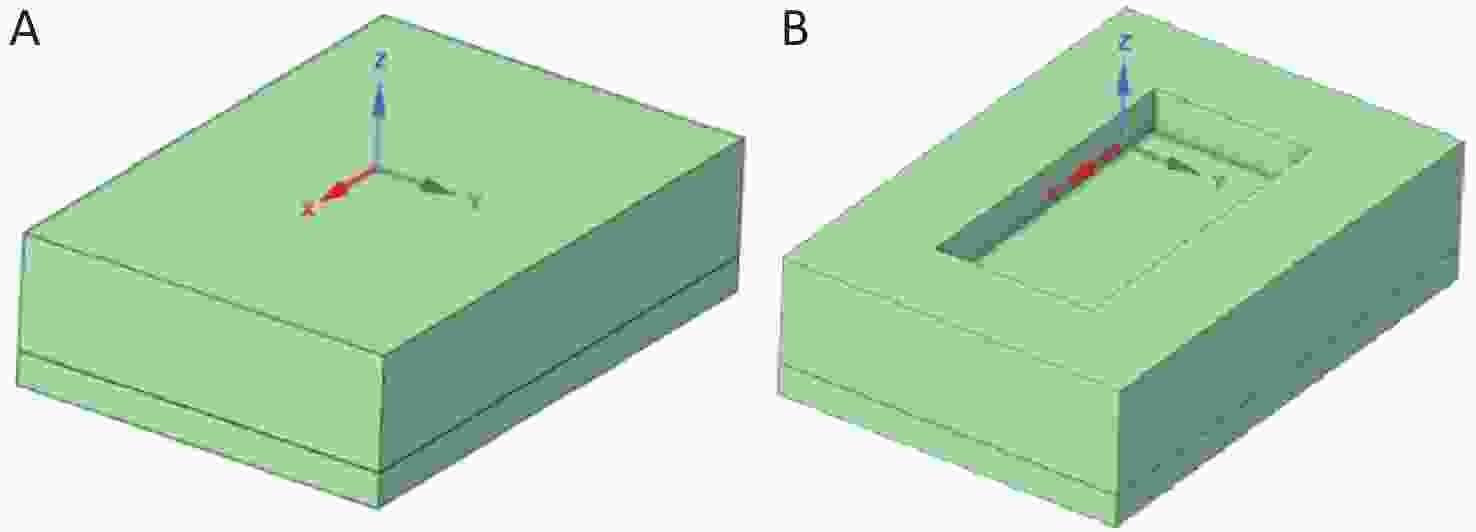
Figure 2. Geometric model of water body (A) uncovered and (B) float-covered (with area coverage rate of 29.6% and immersion depth of 0.04 m) geometric models.
-
The diffusion migration equation of radon in the overlying water layer under steady-state conditions is
$$ {D}_{w}\left[\frac{{\partial }^{2}{C}_{w}}{\partial {x}^{2}}+\frac{{\partial }^{2}{C}_{w}}{\partial {y}^{2}}+\frac{{\partial }^{2}{C}_{w}}{\partial {z}^{2}}\right]-\lambda {C}_{w}+{\alpha }_{w}=0 $$ (1) where $ {C}_{w} $ is water radon concentration in the overlying water layer (x, y, z); Bq/m3; $ {D}_{{w}} $ is the radon diffusion coefficient in the water, m2·s−1; $ \lambda $ is the radon decay constant, 2.1 × 10⁻⁶ s−1; and $ {\alpha }_{{w}} $ is the free radon production rate for the overlying water layer, Bq·m−3·s−1.
The steady-state radon diffusion migration equation for a radium-containing sediment layer is as follows:
$$ \begin{aligned} & {D}_{w,s}\left[\frac{{\partial }^{2}{C}_{w,s}}{\partial {x}^{2}}+\frac{{\partial }^{2}{C}_{w,s}}{\partial {y}^{2}}+\frac{{\partial }^{2}{C}_{w,s}}{\partial {z}^{2}}\right]-\lambda {C}_{w,s}+\\ &\quad \frac{{{\eta \alpha }_{w}+(1-\eta )\;\alpha }_{s}}{\eta }=0 \end{aligned} $$ (2) where $ {C}_{w,s} $ is the water radon concentration in the sediment layer (x,y,z), Bq·m−3; $ D_{{{w},{s}}} $ is the radon diffusion coefficient in the sediment layer, m2·s−1; and $ {\alpha }_{{w},{s}} $ is the free radon production rate for the sediment, Bq·m−2·s−1.
$ {\alpha }_{{w}} $ and $ {\alpha }_{{w},{s}} $, as well as $ {D}_{{w},{s}} $ are given in Equation (1) and Equation (2), as follows:
$$ {\alpha }_{w}=\lambda {A}_{w} $$ (3) $$ {\alpha }_{w,s}=\lambda {{\rho }_{s}A}_{w,s}{S}_{e} $$ (4) $$ {D}_{w,s}=\tau {D}_{w} $$ (5) where $ {A}_{{w}} $ is the radium activity concentration in the overlying water layer; Bq·m−3; $ {A}_{{w},{s}} $ is the radium activity concentration in the sediment, Bq·kg−1; $ {\rho }_{s} $ is the density of the sediment, kg·m−3; $ {S}_{{e}} $ is the radon emanation coefficient of the sediment, %; and $ \tau $ is the dimensionless pore distortion of the sediment layer, which is taken as 0.66[19].
The radon retardation rate $ f $ can be expressed as follows:
$$ f=\left(1-\frac{JS}{{J}_{0}{S}_{0}}\right)\times 100\text{%} $$ (6) where $ {J}_{0} $ is the average radon exhalation rate of the exposed water without coverage, Bq·m−2·s−1; $ {S}_{0} $ is the exposed surface area of the water body without coverage, m2; $ J $ is the average radon exhalation rate of the exposed water with coverage, Bq·m−2·s−1; and $ S $ is the exposed surface area of water with coverage, m2.
The radon release rate of the water surface can be calculated as
$$ {R}_{w,s}=\frac{{\stackrel-{J}}_{w}{S}_{f}}{{{\alpha }_{w,s}V}_{s}+{\alpha }_{w}{V}_{w}} $$ (7) where $ {\stackrel{-}{J}}_{w} $ is the average radon exhalation rate of the water surface, Bq·m−2·s−1; $ {S}_{f} $ is the exposed surface area of the water body, m2; $ {V}_{s} $ is the volume of the sediment layer, m3; and $ {V}_{w} $ is the volume of the overlying water layer, m3.
-
The bottom and four walls of the water body are set as wall boundaries ($ \dfrac{\partial \complement }{\partial Z}=0) $. A user-defined function (UDF) is established based on the relationship between the radon transport flux at the gas–liquid interface and the radon exhalation rate of the overlying water surface, that is, $ k({C}_{w1}-\beta {C}_{a})=-{D}_{w1}\dfrac{\partial {C}_{w1}}{\partial Z} $. When the radon concentration in the air is 0 Bq·m−3, the boundary condition of the water surface is $ {C}_{w1}=\dfrac{-{D}_{w1}\dfrac{\partial {C}_{w1}}{\partial Z}}{k} $. When the radon concentration in the air is $ {C}_{a} $ Bq·m−3, the boundary condition of the water surface is $ {C}_{w}=\dfrac{-{D}_{w1}\dfrac{\partial {C}_{w1}}{\partial Z}+k\beta {C}_{a}}{k} $. In this study, the radon concentration in the air was considered to be 0 Bq·m−3.
-
Using the laminar flow model and COUPLE algorithm, a UDF was written to set the radium activity concentration and the radon diffusion coefficient in the overlying water and sediment layers. The criterion for numerical convergence was that the maximum relative difference between two successive iterations should be less than 10−11.
The geometric model was meshed using a hexahedral-structured mesh to simulate the migration and exhalation laws of radon in water under different coverage conditions and to save computation time under a limited configuration. An independent test of the geometric model mesh was performed to ensure the accuracy and reliability of the simulation results. Three different mesh sizes were set in the water body when the area coverage rate was 29.6% and the immersion depth was 0.04 m: 0.002, 0.003, and 0.004 m, and the number of meshes were 2,362,480, 712,494, 295,482, respectively. The results of the radon exhalation rate on the water surface were 0.037,930,82, 0.037,911,93, and 0.037,876,45 Bq·m−2·s−1. The relative deviation of the calculation results for the different meshes can be ignored; therefore, a size of 0.003 m was selected for meshing. The number of cells with which all cases were calculated ranged from 223,000 to 712,494.
-
In light of the pertinent literature, the radium activity concentration ($ {A}_{\mathrm{w}} $) in the overlying water layer ranged from 1 to 30 Bq·L−1[20] and that in sediment ($ {A}_{\mathrm{s}} $) ranged from 0.15 to 13.7 Bq·g−1[21-23]. As a result of biological disturbance and environmental temperature, the equivalent diffusion coefficient ($ {D}_{\mathrm{w}} $) of radon in the overlying water layer ranged from 2 × 10⁻⁹ to 2.19 × 10⁻⁵ m2·s−1[24-26], whereas the radon transfer velocity at the gas–liquid interface (k), without or at low wind speed, was between 1 × 10⁻⁷ and 1 × 10⁻⁵ m·s−1[27-30]. Accordingly, $ {A}_{\mathrm{w}} $ was taken as 20 Bq·L−1, and $ {A}_{\mathrm{s}} $ was assumed as 5.25 Bq·g−1. To simulate the different unperturbed states in the water body, $ {D}_{\mathrm{w}} $ was taken as 1.0 × 10⁻⁹, 5 × 10⁻⁹, 1.0 × 10⁻⁸, and 5 × 10⁻⁸ m2·s−1, and K was assumed as 1 × 10⁻⁷, 5 × 10⁻⁷, 1 × 10⁻⁶, and 5 × 10⁻⁶ m·s−1 respectively.
-
In addition to the above values of physical parameters, the area coverage rate ($ P $) was taken as 29.6%, 59.1%, and 88.7% and the immersion depth ($ h $) was assumed as 0.02, 0.04, 0.06, and 0.08 m, respectively, owing to the difference in coverage conditions[15].
-
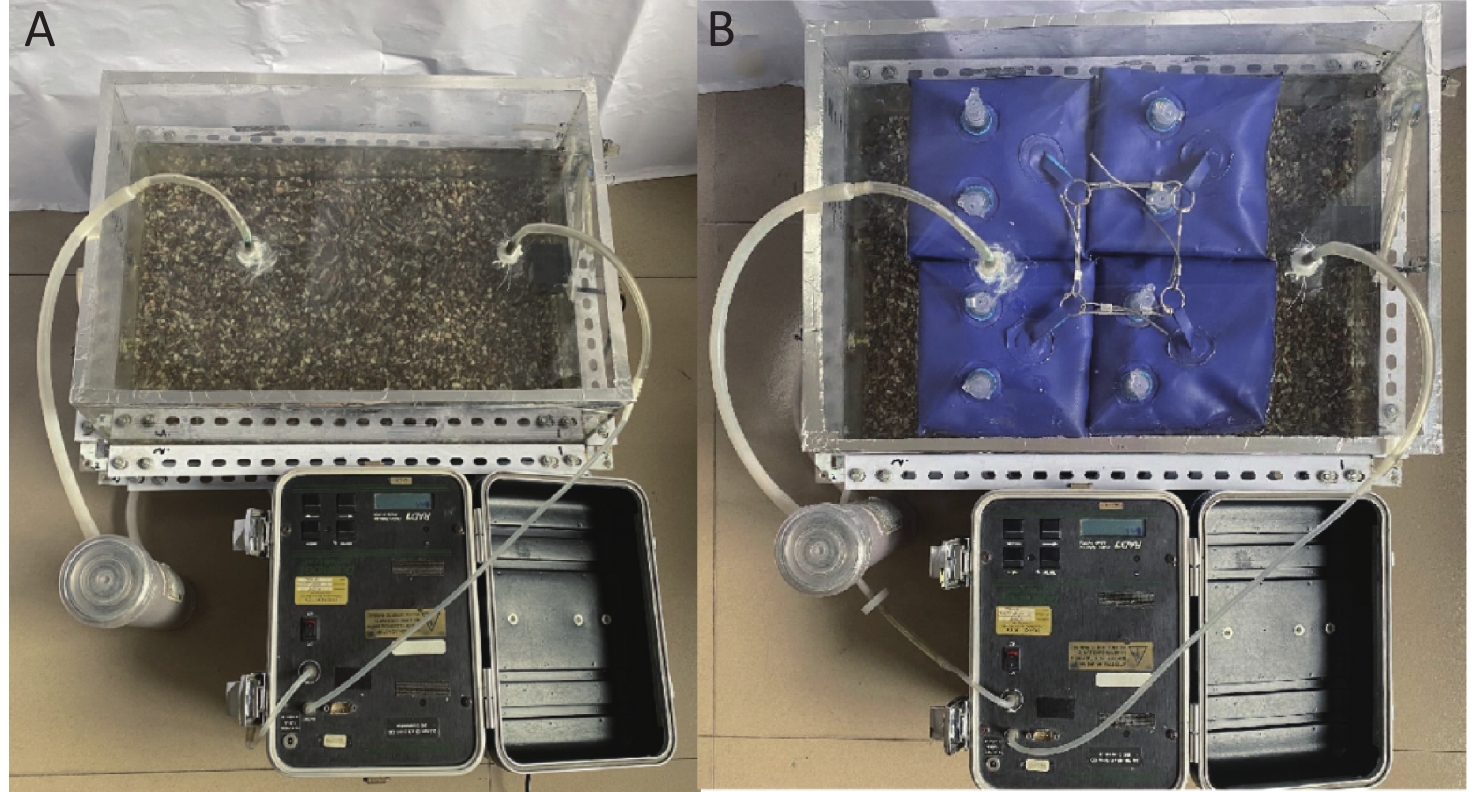
Figure 3[15] shows the experimental setup, which was primarily composed of two parts: (1) a sample holding setup (an acrylic container with an inner length of 0.485 m and an inner width of 0.335 m); (2) a radon concentration measurement system consisting of a RAD7 radon detector (Durridge Company Inc., USA), a gas drying unit, and vinyl tubing; and 3) some combined modular floats covering the water surface.
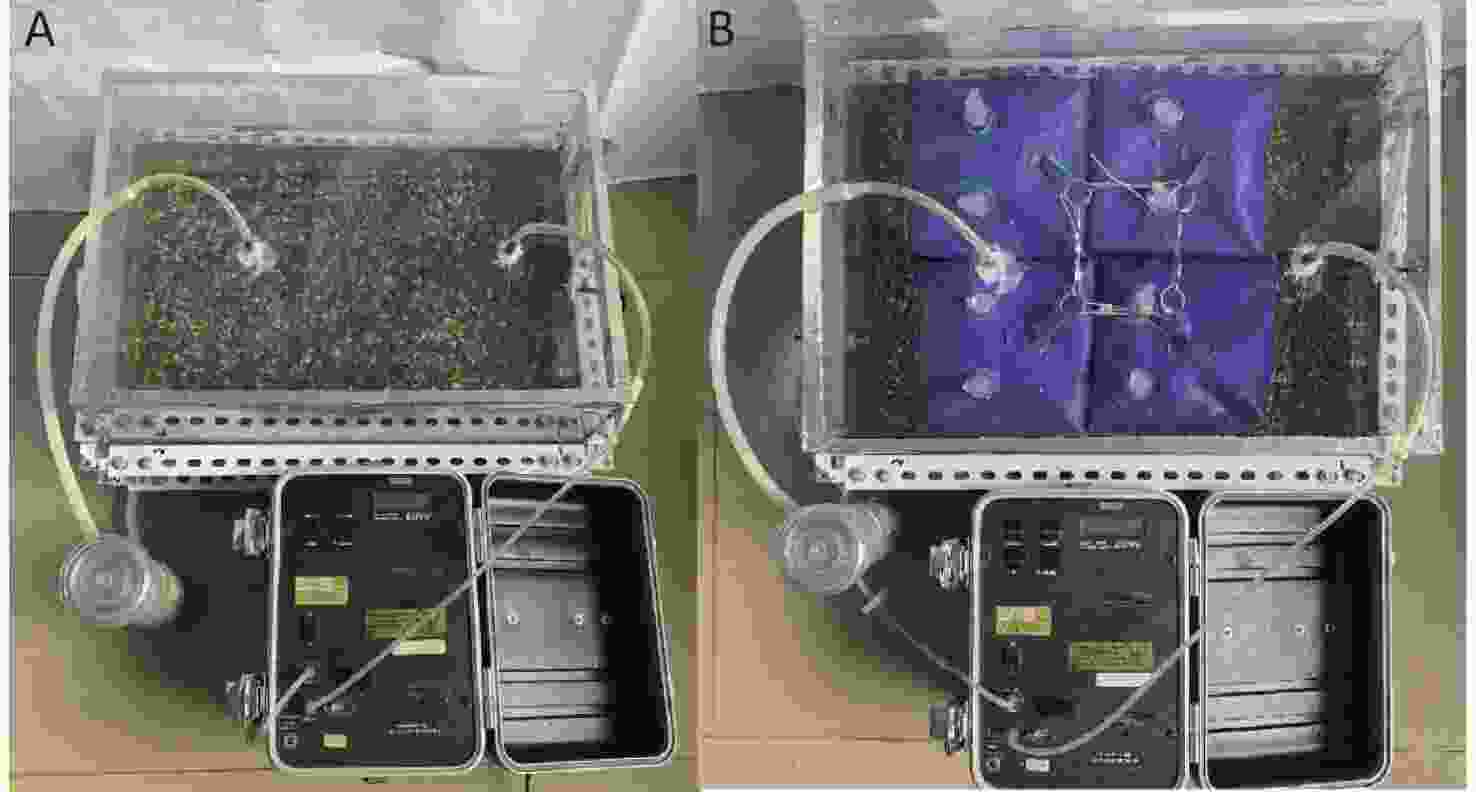
Figure 3. Experimental setup:[15] (A) uncovered water, (B) covered water.
-
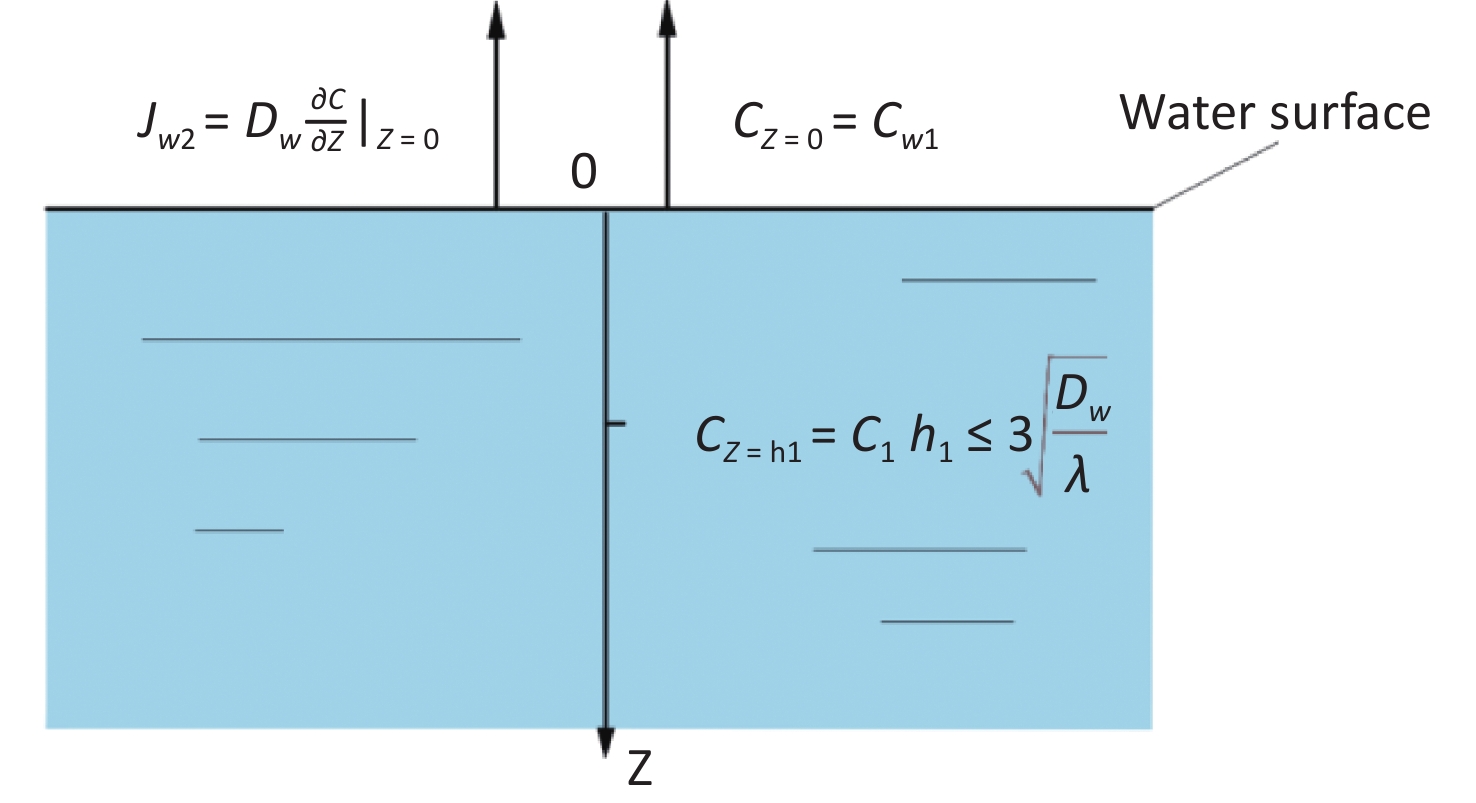
The estimation model for the radon diffusion coefficient in water was established, as shown in Figure 4.
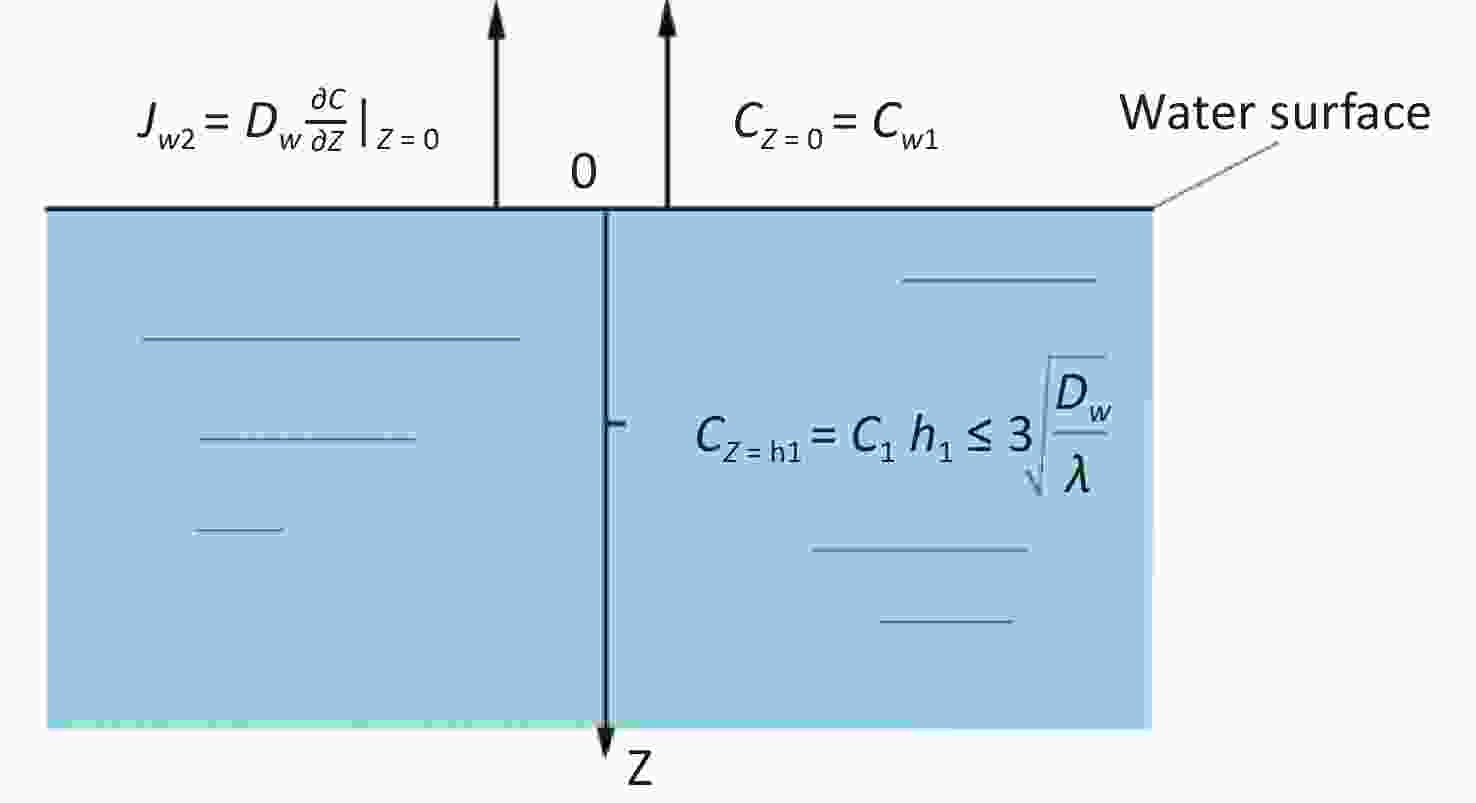
Figure 4. Estimation model diagram of radon diffusion coefficient in water.
The radon diffusion migration equation of water body is
$$ {D}_{w}\frac{{\partial }^{2}{C}_{w}}{\partial Z}-\lambda {C}_{w}+{a}_{w}=0 $$ (8) The boundary conditions are as follows:
$$ {J}_{w2}={D}_{w}\frac{\partial \complement }{\partial Z}{|}_{Z\;=\;0} $$ (9) $$ C\;(Z=0)={C}_{w1} $$ (10) where $ {C}_{w1} $ is the surface radon concentration in the pure water zone, Bq·m−3.
The analytical solution of radon concentration in Equation (10) is
$$ \begin{aligned} & \mathrm{C}\left(\mathrm{Z}\right)=\frac{a_w}{\lambda}\left[1-\mathrm{c}\mathrm{o}\mathrm{s}h_w\left(Z\sqrt{\frac{\lambda}{D_w}}\right)\right]+\left(\frac{J_{w2}}{\sqrt{\lambda D_w}}\mathrm{s}\mathrm{i}\mathrm{n}h_w\ Z\sqrt{\frac{\lambda}{D_w}}\right)+ \\ & C_{w1}\mathrm{c}\mathrm{o}\mathrm{s}h_w\left(Z\sqrt{\frac{\lambda}{D_w}}\right)\end{aligned} $$ (11) where $ h_w $ is the depth of water, m.
Based on these following parameters: $ {C}_{z \;=\;\; 0\;{\mathrm{m}}} $ = 181,427 ± 4,540 Bq·m−3, $ {C}_{z\;=\;0.02\;{\mathrm{m}}} $ = 348,276 ± 6,500 Bq·m−3, $ {\stackrel{-}{J}}_{w2} $ = 0.127 ± 0.001 Bq·m−2·s−1, $ {\alpha }_{\mathrm{w}} $= 0.0134 Bq·m−3·s−1, and $ \lambda $ = 2.1 × 10⁻⁶ s−1, the radon diffusion coefficient in water ($ {D}_{{w}} $ = (1.58 ± 0.041) × 10−8 m2·s−1) was obtained by solving Equation (11).
-
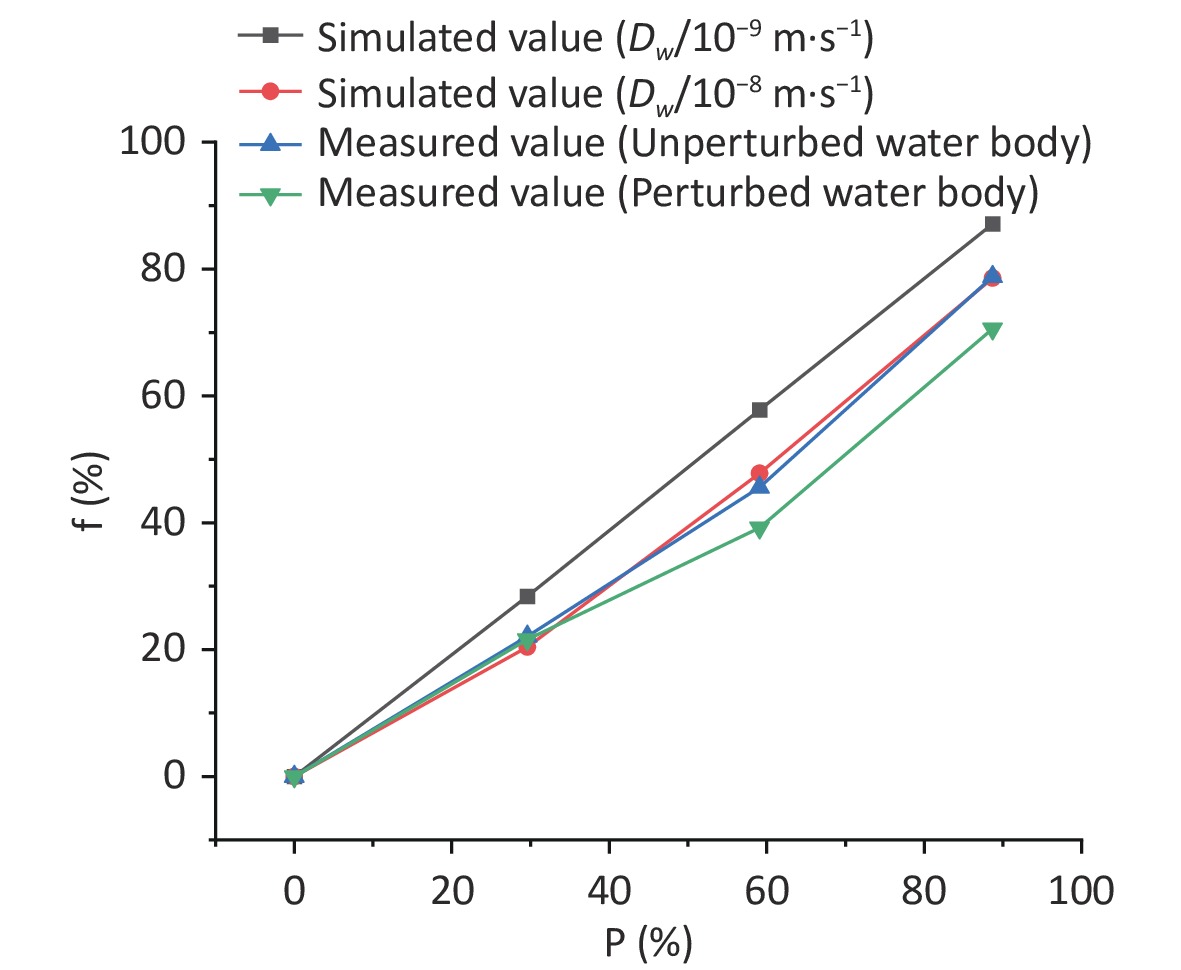
Figure 5 shows the experimental and simulated variation values of the radon retardation rate with the area coverage rate at an immersion depth of 0.04 m. The figure shows the simulated values for two diffusion coefficients ($ {D}_{\mathrm{w}} $= 1 × 10⁻⁹ m2·s−1 and $ {D}_{\mathrm{w}} $= 1 × 10⁻⁸ m2·s−1) as well as the measured values for two types of water bodies (unperturbed and perturbed water bodies). It can be observed from Figure 5 that when the immersion depth is the same, the numerical simulation results of the variation trend of the radon retardation rate in radon-containing water with the area coverage rate match well with the experimental results; that is, both increase with an increase in the area coverage rate. Particularly, a high match between the simulated variation values ($ {D}_{\mathrm{w}} $= 1 × 10⁻⁸ m2·s−1) results and the experimental variation values ($ {D}_{\mathrm{w}} $ = (1.58 ± 0.041) × 10−8 m2·s−1) is observed. Therefore, it is feasible to use CFD to study the radon retardation behavior of covering floats in radon-containing water.
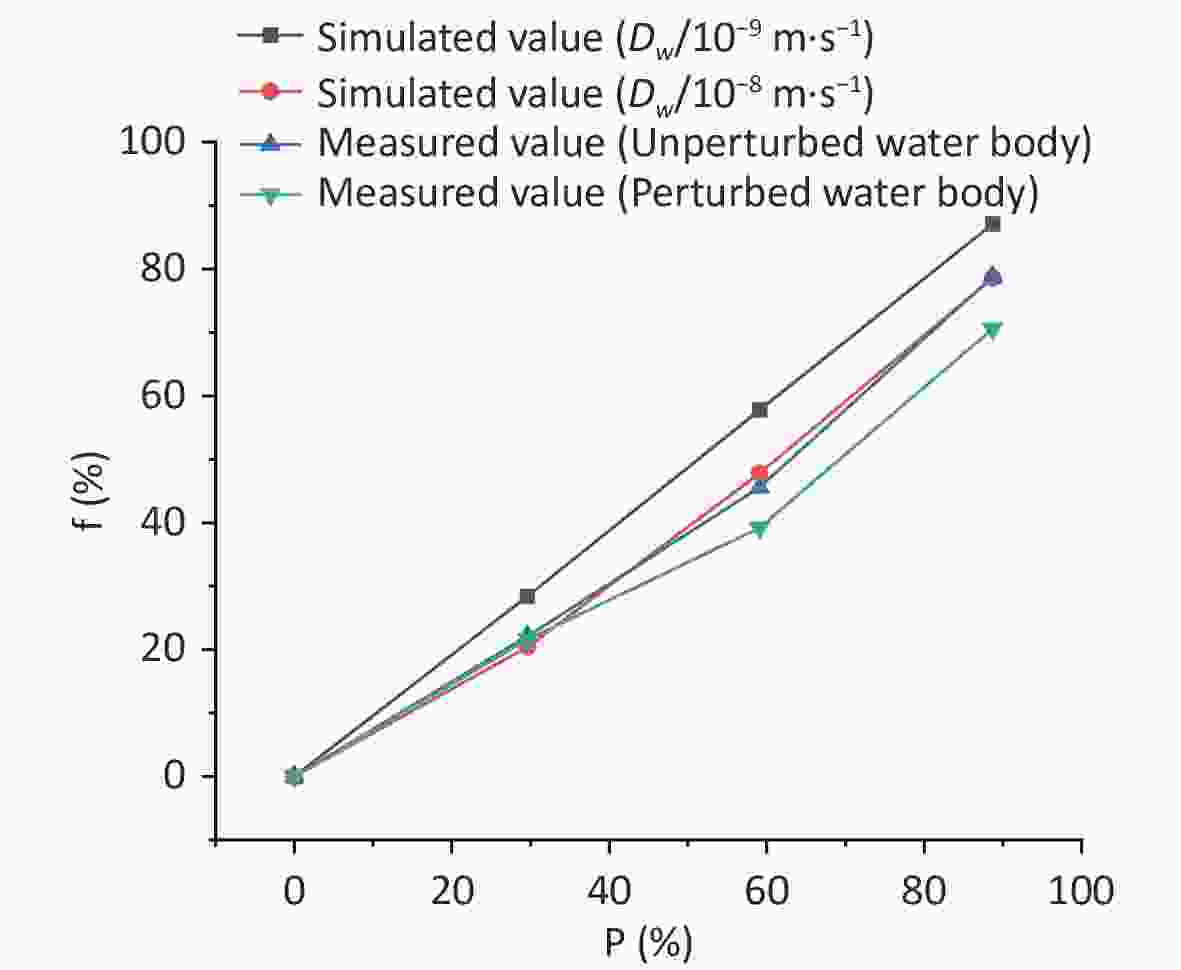
Figure 5. Variation of radon retardation rate with area coverage rate at immersion depth of 0.04 m. Dw, radon diffusion coefficient.
-
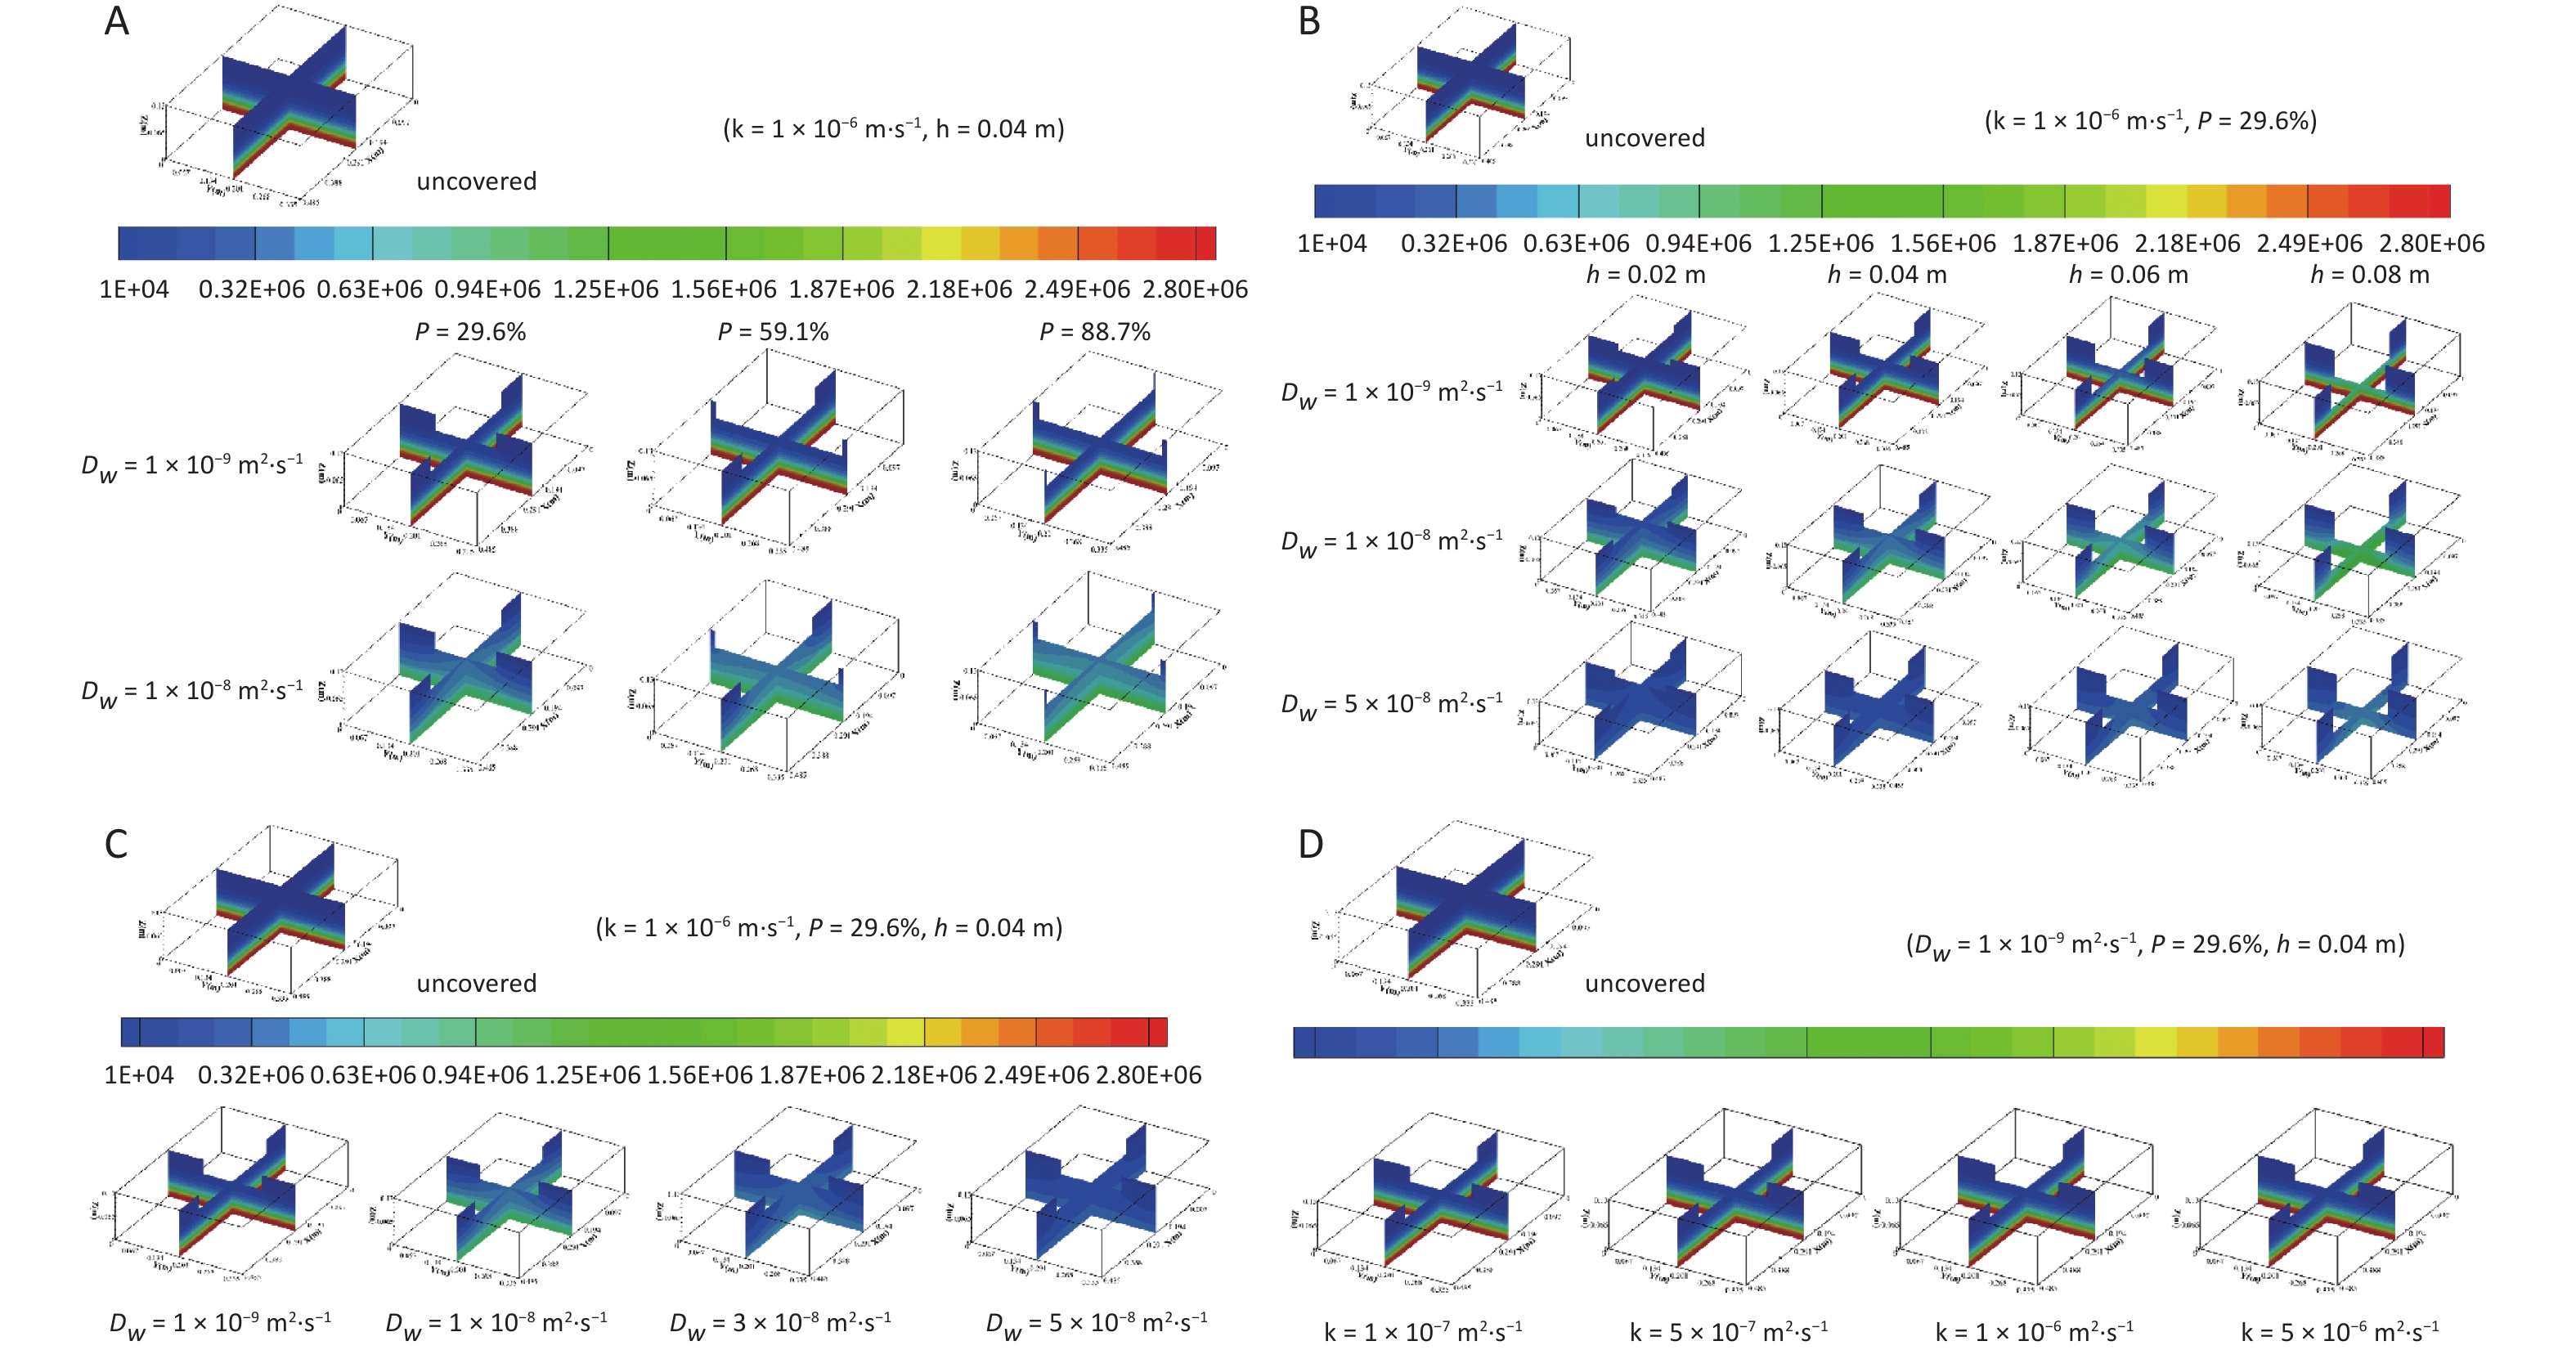
The distribution of radon concentrations in the water bodies with different coverage rates is shown in Figure 6A. The following can be observed from Figure 6A: 1) the concentration around the float is high in the center and low in the periphery, showing a gradient distribution around the float. 2) The radon concentration distribution in water under different coverage rates is affected by the diffusion coefficient. When the diffusion coefficient ($ {D}_{{w}}$) is less than 1 × 10⁻⁹ m2·s−1, the radon concentration distribution does not change significantly with the increase in area coverage rate; when the diffusion coefficient ($ {D}_{{w}}$) is greater than 1 × 10⁻⁸ m2·s−1, the larger the area coverage rate is, the larger the concentration gradient in the sediment layer, and the concentration gradient around the float becomes smaller. 3) Under the same diffusion coefficient, the average radon concentration of the water body progressively increases with an increase in the area coverage rate. For example, when the diffusion coefficient is 1 × 10⁻⁸ m2·s−1 and the area average rate increases from 29.6% to 88.7%, the average radon concentration in the overlying water layer increases from 239,556.9 to 325,718.7 Bq·m−3, whereas that in the sediment layer increases from 2,296,108 to 2,305,312 Bq·m−3.
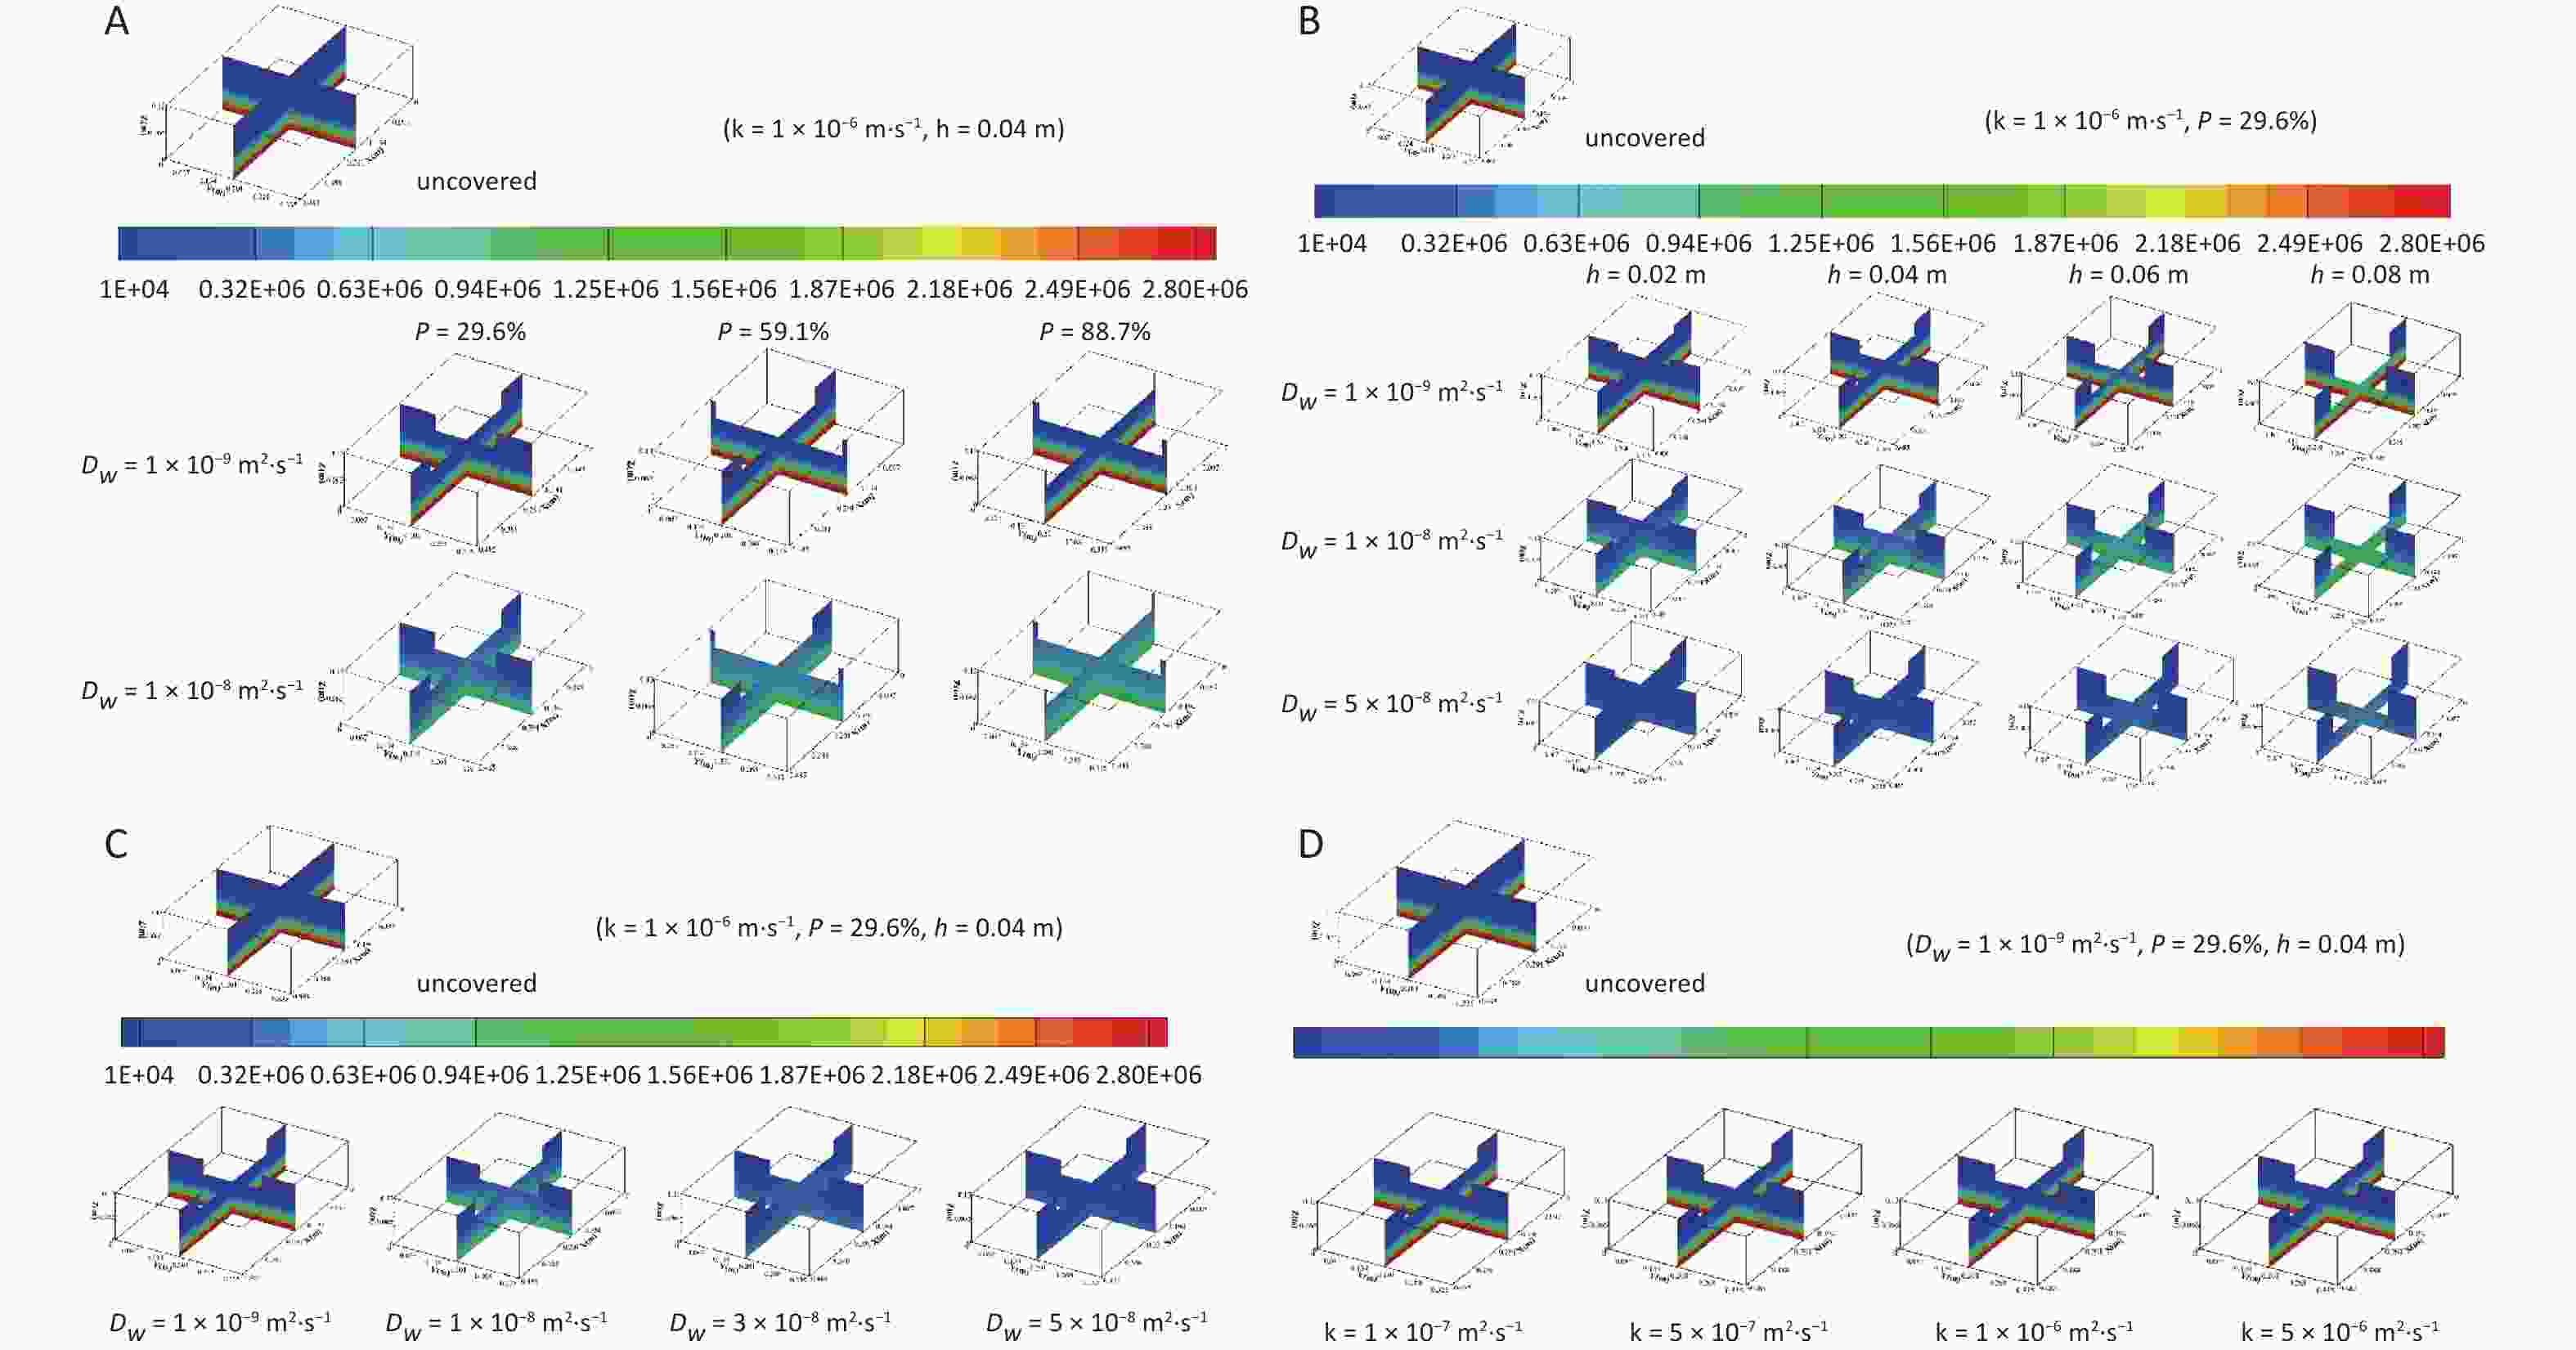
Figure 6. Radon concentration distribution in water bodies with different (A) immersion depths, (B) area coverage rates, (C) diffusion coefficients, and (D) radon transfer velocities at the gas–liquid interface. Dw, radon diffusion coefficient.
The radon concentration distributions in water bodies at different immersion depths are shown in Figure 6B. It can be observed from Figure 6B: 1) under the same diffusion coefficient, the radon concentration gradient in the area around the float and in the sediment area increases with increasing immersion depth. 2) Regardless of how the diffusion coefficient changes, the radon concentration in both the overlying water and sediment layers increases with the increase in immersion depth. For example, when the diffusion coefficient is 1 × 10⁻⁸ m2·s−1 and the immersion depth varies from 0.02 to 0.08 m, the average radon concentration in the overlying water layer increases from 281,541.9 to 320,034.7 Bq·m−3 and that in the sediment layer increases from 839,690.5 to 960,979.8 Bq·m−3.
Radon concentration distributions in water bodies with different diffusion coefficients are exhibited in Figure 6C, which shows that under the same coverage conditions, the radon concentration gradient in the area around the float and the radon concentration in the sediment layer decrease with an increase in the diffusion coefficient, whereas the radon concentration gradient in the sediment layer and the radon concentration in the overlying water layer first increase and then decrease.
The corresponding concentration distributions of radon for different transfer velocities at the gas–liquid interface are shown in Figure 6D. It can be observed from Figure 6D that under the same coverage conditions, the average radon concentration in the water body decreases with an increase in radon transfer velocity at the gas–liquid interface, and more radon is released to the air from the water surface.
-
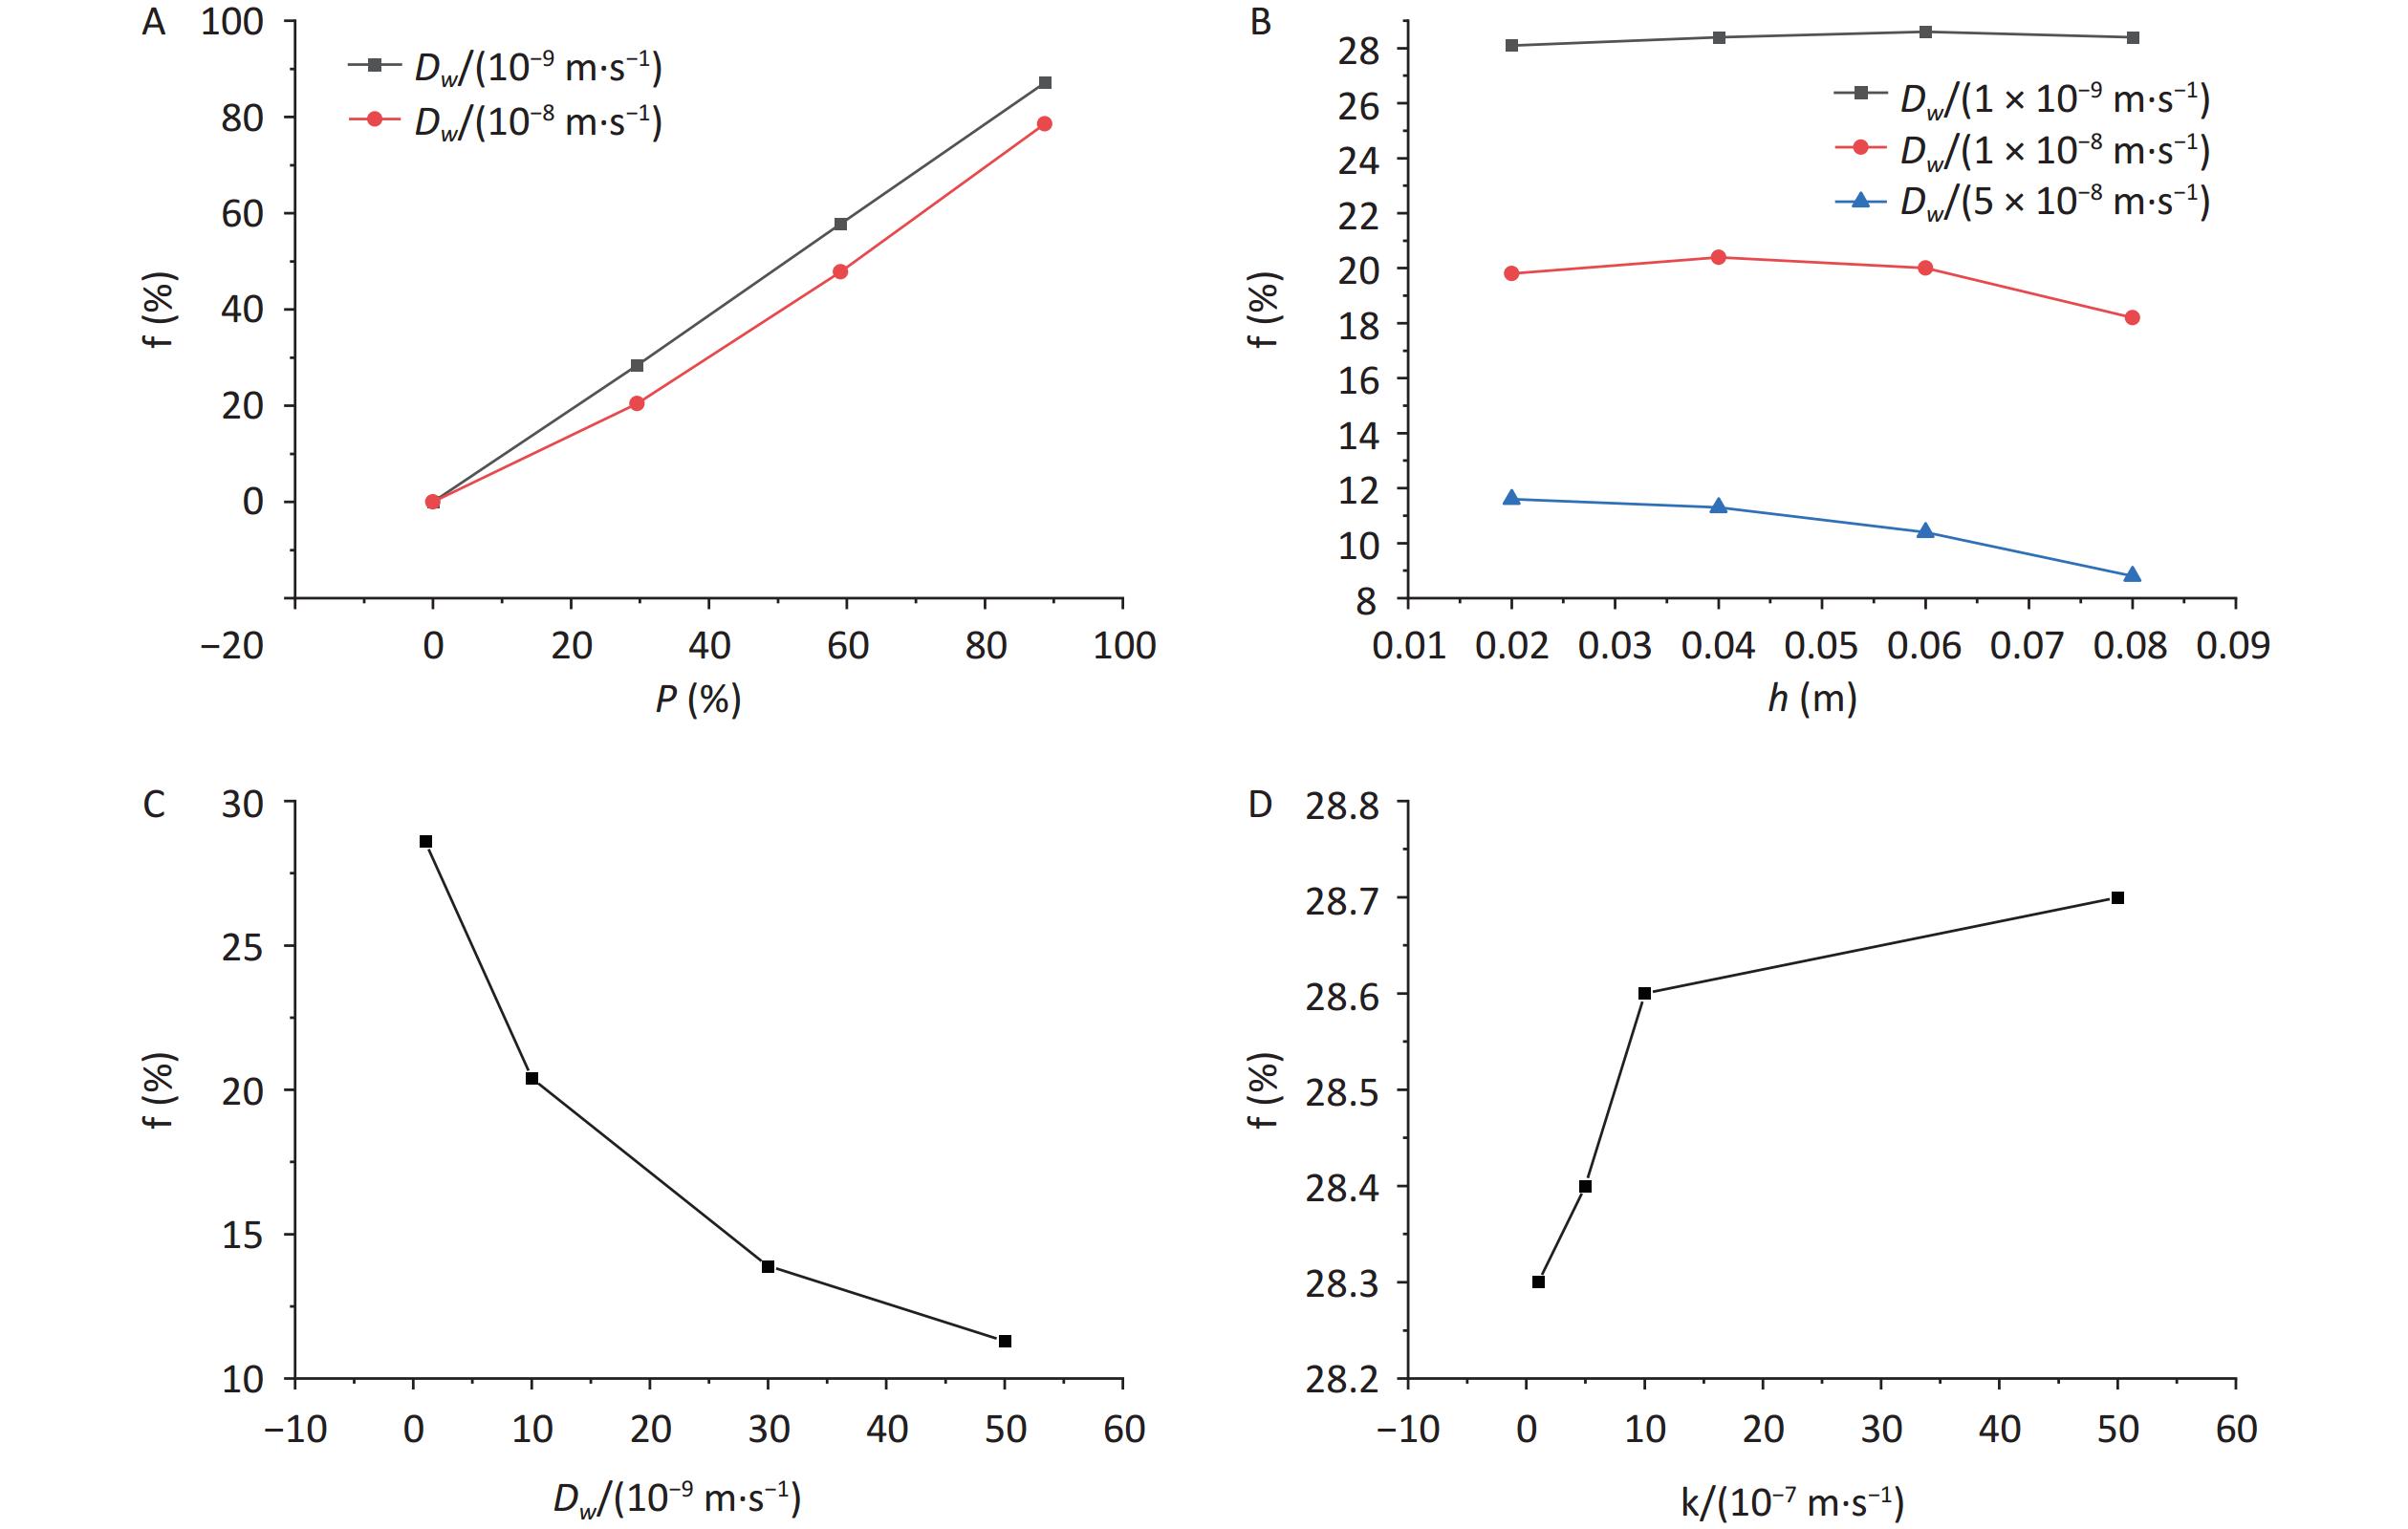
The calculations of the radon retardation rate with different parameters are listed in Table 1. The variations in the radon retardation rate with the area coverage rate, immersion depth diffusion coefficient, and radon transfer velocity at the gas–liquid interface are shown in Figure 7.
Parameters Radon retardation
rate f / %
Dw = 1 × 10⁻⁹ m2·s−1P = 0 0 P = 29.6% 28.4 P = 59.1% 57.8 P = 88.7% 87.1
Dw = 1 × 10⁻⁸ m2·s−1P = 0 0 P = 29.6% 20.4 P = 59.1% 47.8 P = 88.7% 78.6
Dw = 1 × 10⁻⁹ m2·s−1h = 0.02 m 28.1 h = 0.04 m 28.4 h = 0.06 m 28.6 h = 0.08 m 28.4
Dw = 1 × 10⁻⁸ m2·s−1h = 0.02 m 19.8 h = 0.04 m 20.4 h = 0.06 m 20 h = 0.08 m 18.2
Dw = 5 × 10⁻⁸ m2·s−1h = 0.02 m 11.6 h = 0.04 m 11.3 h = 0.06 m 10.4 h = 0.08 m 8.8
P = 29.6%
h = 0.04 mDw = 1 × 10⁻⁹ m2·s−1 28.4 Dw = 1 × 10⁻⁸ m2·s−1 20.4 Dw = 3 × 10⁻⁸ m2·s−1 13.9 Dw = 5 × 10⁻⁸ m2·s−1 11.3 K = 1 × 10⁻⁷ m·s−1 28.3 K = 5 × 10⁻⁷ m·s−1 28.4 K = 1 × 10⁻⁶ m·s−1 28.6 K = 5 × 10⁻⁶ m·s−1 28.7 Note. Dw, radon diffusion coefficient; P, percentage; h, height. Table 1. Calculations of radon retardation rate
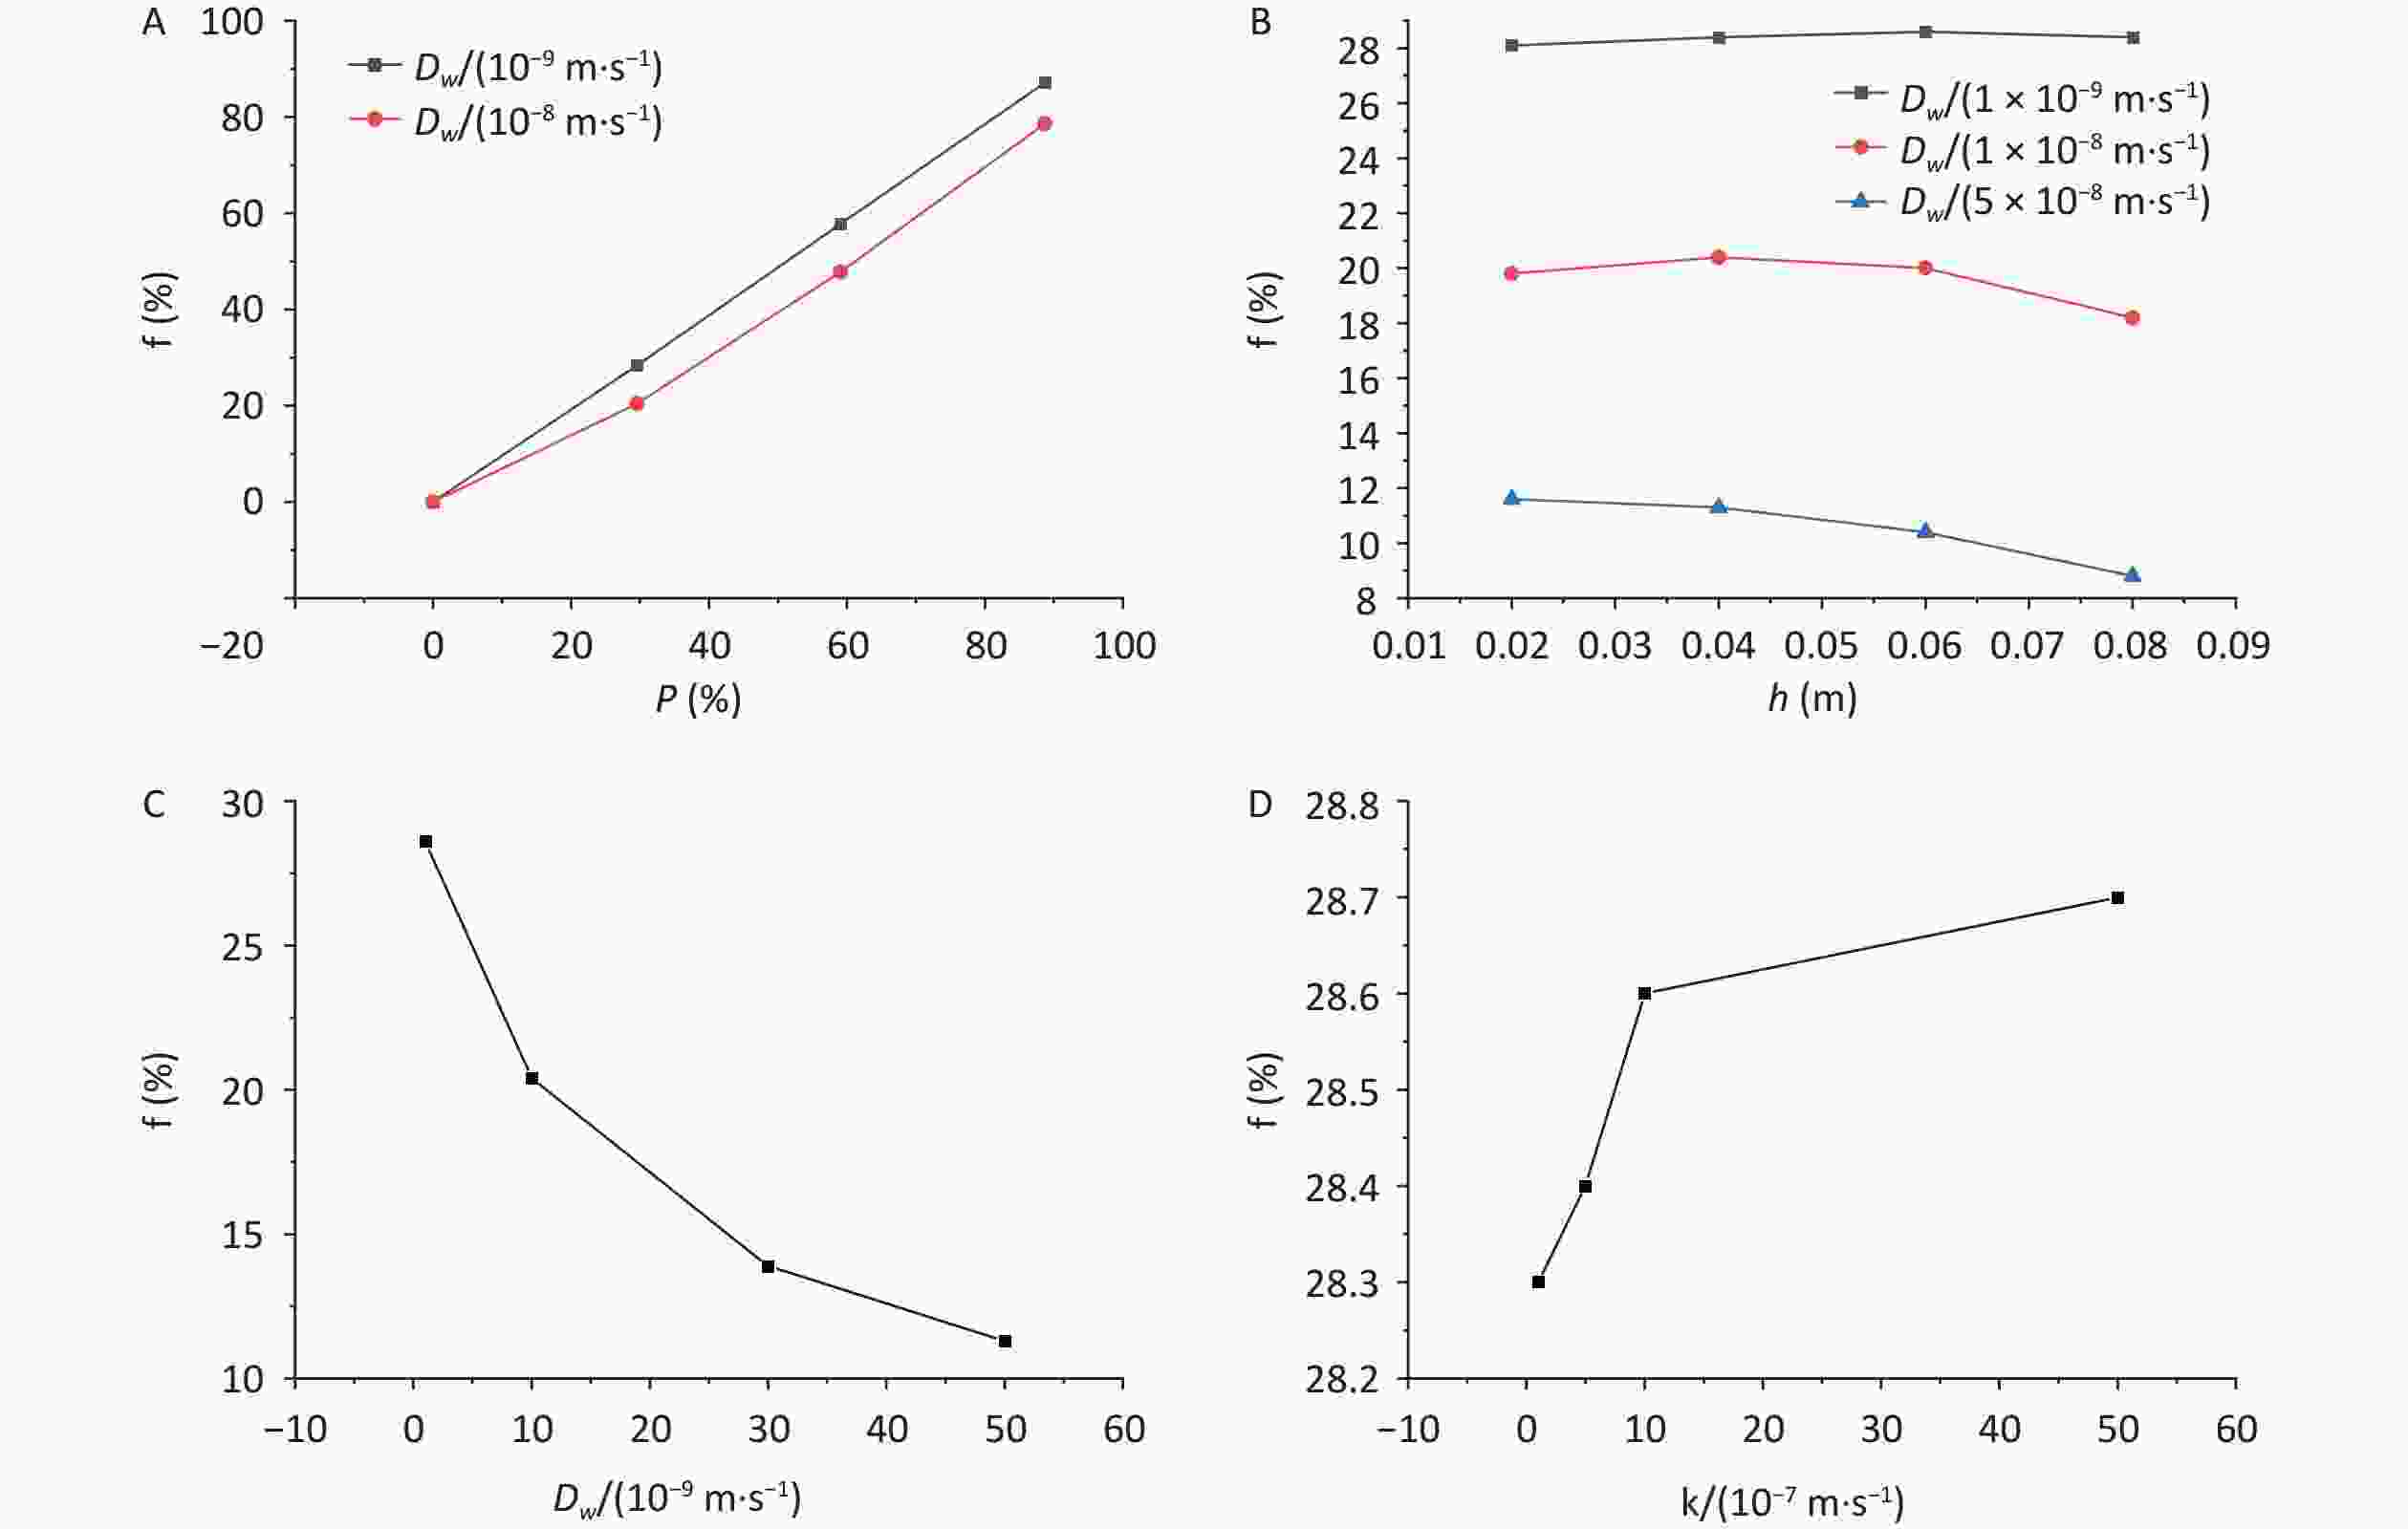
Figure 7. Variations in radon retardation rate with (A) area coverage rate, (B) immersion depth, (C) diffusion coefficient, and (D) radon transfer velocity at the gas–liquid interface. Dw, radon diffusion coefficient; P, percentage; h, height.
The variation in the radon retardation rate with the area coverage rate is shown in Figure 7A. As shown in Figure 7A, regardless of how the diffusion coefficient changes, the radon retardation rate increases with an increase in the area coverage rate, and the smaller the diffusion coefficient is, the better the radon retardation effect. Compared with those water bodies with diffusion coefficient of 1 × 10⁻⁸ m2·s−1, the radon retardation rates of the water bodies with diffusion coefficient of 1 × 10⁻⁹ m2·s−1 were increased by 28.2% and 9.8% at area coverage rate of 29.6% and 88.7%, respectively, when the immersion depth was kept the same at 0.04 m.
The variation in the radon retardation rate with the immersion depth is exhibited in Figure 7B. As shown in Figure 7B, when the thickness of the overlying water layer is small, such as 0.1 m, the radon retardation effect at different immersion depths is affected by the diffusion coefficient. For example, if the diffusion coefficient is less than 1 × 10⁻⁸ m2·s−1, the radon retardation rate increases first and then decreases with the increase in immersion depth. if the diffusion coefficient is greater than 5 × 10⁻⁸ m2·s−1, the smaller the immersion depth is, the better the radon retardation effect. For example, when the diffusion coefficient is 1 × 10⁻⁹ m2·s−1, the radon retardation rates increase by 1.8% when the immersion depth is increased from 0.02 to 0.06 m, and they decrease by 0.7% when the immersion depth is increased from 0.06 to 0.08 m. When the diffusion coefficient is 1 × 10⁻⁸ m2·s−1, the radon retardation rates increase by 3.0% when the immersion depth is increased from 0.02 to 0.04 m and decrease by 10.8% when the immersion depth is increased from 0.04 to 0.08 m. When the diffusion coefficient is 5 × 10⁻⁸ m2·s−1, the radon retardation rates decrease by 34.1% when the immersion depth is increased from 0.02 to 0.08 m.
The variation in the radon retardation rate with the diffusion coefficient is shown in Figure 7C. It can be observed from Figure 7C that under the same covering condition, the radon retardation rate decreases with the increase in diffusion coefficient, and the decreasing rate gradually slows down. For example, when the immersion depth is 0.04 m and the area coverage rate is 29.6%, the radon retardation rates decrease by 60.2% when the diffusion coefficient is increased from 1 × 10⁻⁹ to 5 × 10⁻⁸ m2·s−1.
The variation in the radon retardation rate with the radon transfer velocity is shown in Figure 7D. As can be observed from Figure 7D, the water radon retardation rate increases with the increase in the radon transfer velocity at the gas–liquid interface, but the change is small. For example, the radon retardation rate increases by 0.01% when the radon transfer velocity is increased from 1 × 10⁻⁷ to 5 × 10⁻⁶ m·s−1 for a radon-containing water body under the same coverage condition.
-
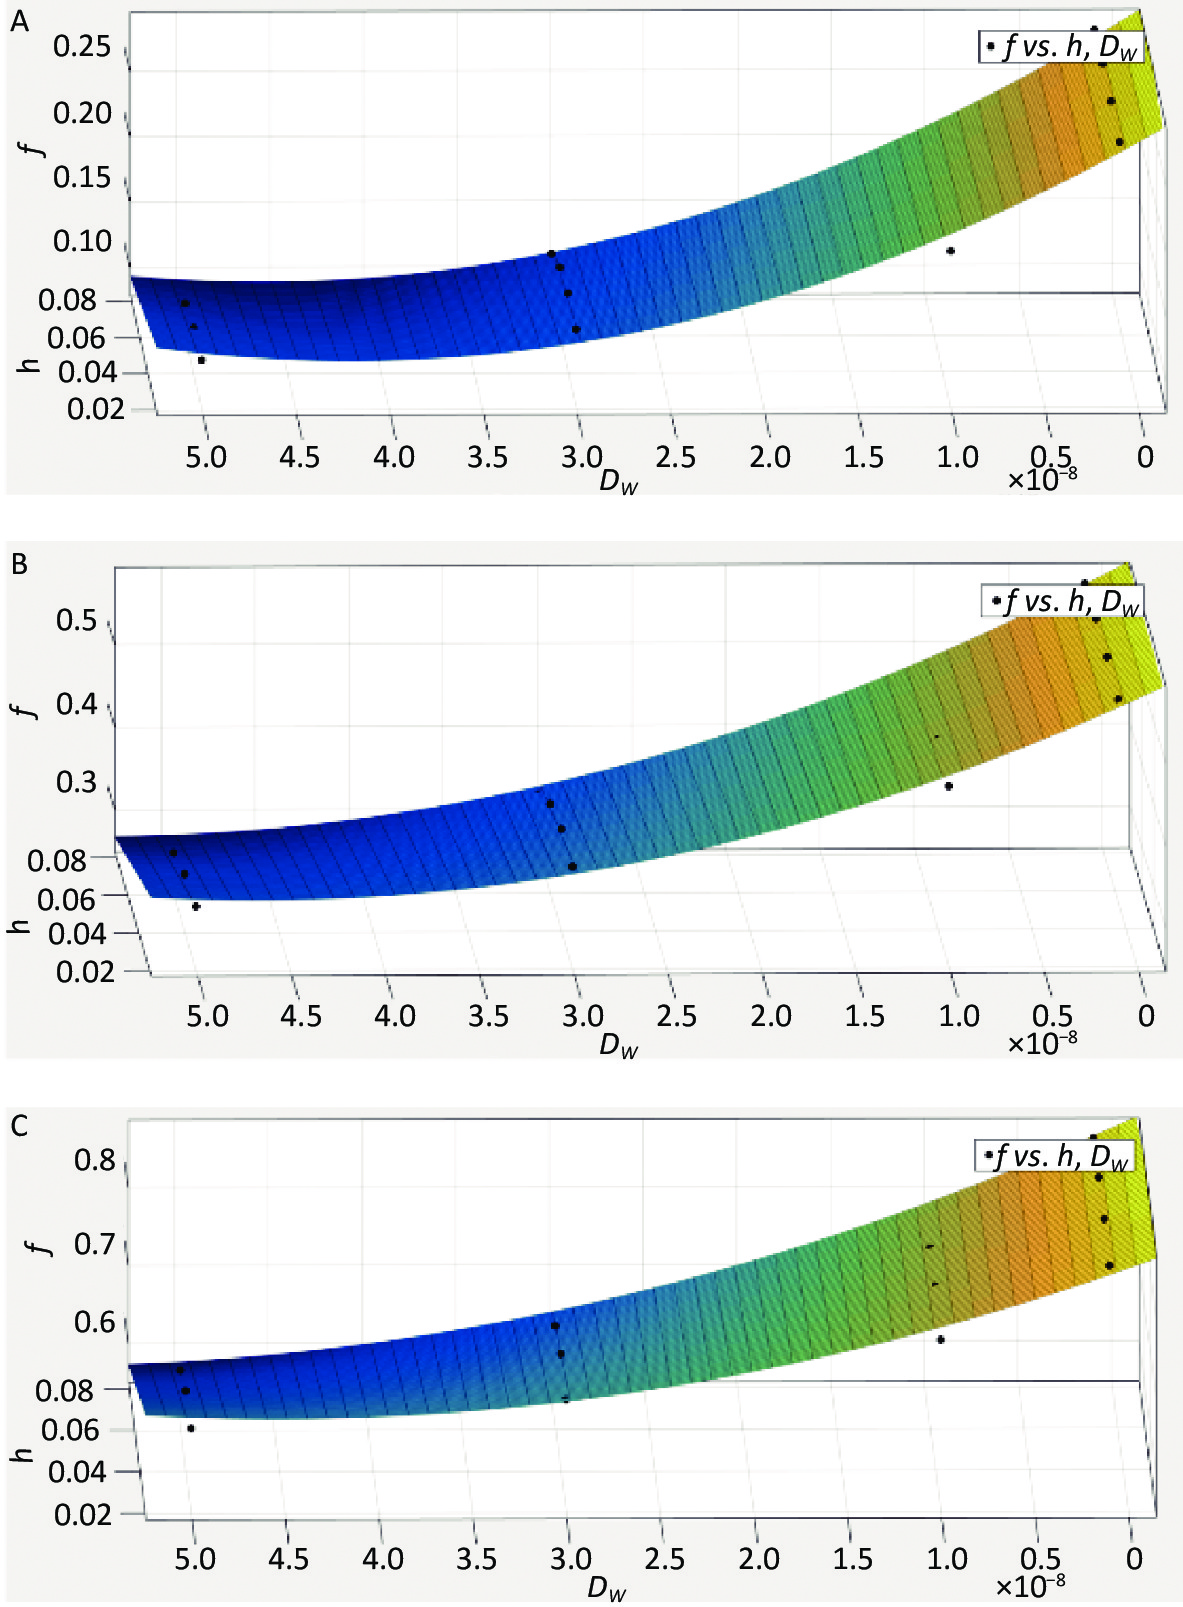
The influence of the radon transfer velocity at the gas–liquid interface on radon release and the retardation effect in water bodies is minor and negligible when compared to the area-coverage rate, immersion depth, and diffusion coefficient. Based on the physical conditions and numerical simulation results of this study, the radon retardation rates of water bodies were optimally fitted for three area coverage rates (29.6%, 59.1%, 88.7%), four immersion depths (0.02, 0.04, 0.06, 0.08 m), and four diffusion coefficients (1 × 10⁻⁹, 1 × 10⁻⁸, 3 × 10⁻⁸, 5 × 10⁻⁸). The results are presented in Figure 8A, Figure 8B, and Figure 8C, along with the appropriate fitting Equation (12), Equation (13), and Equation (14).
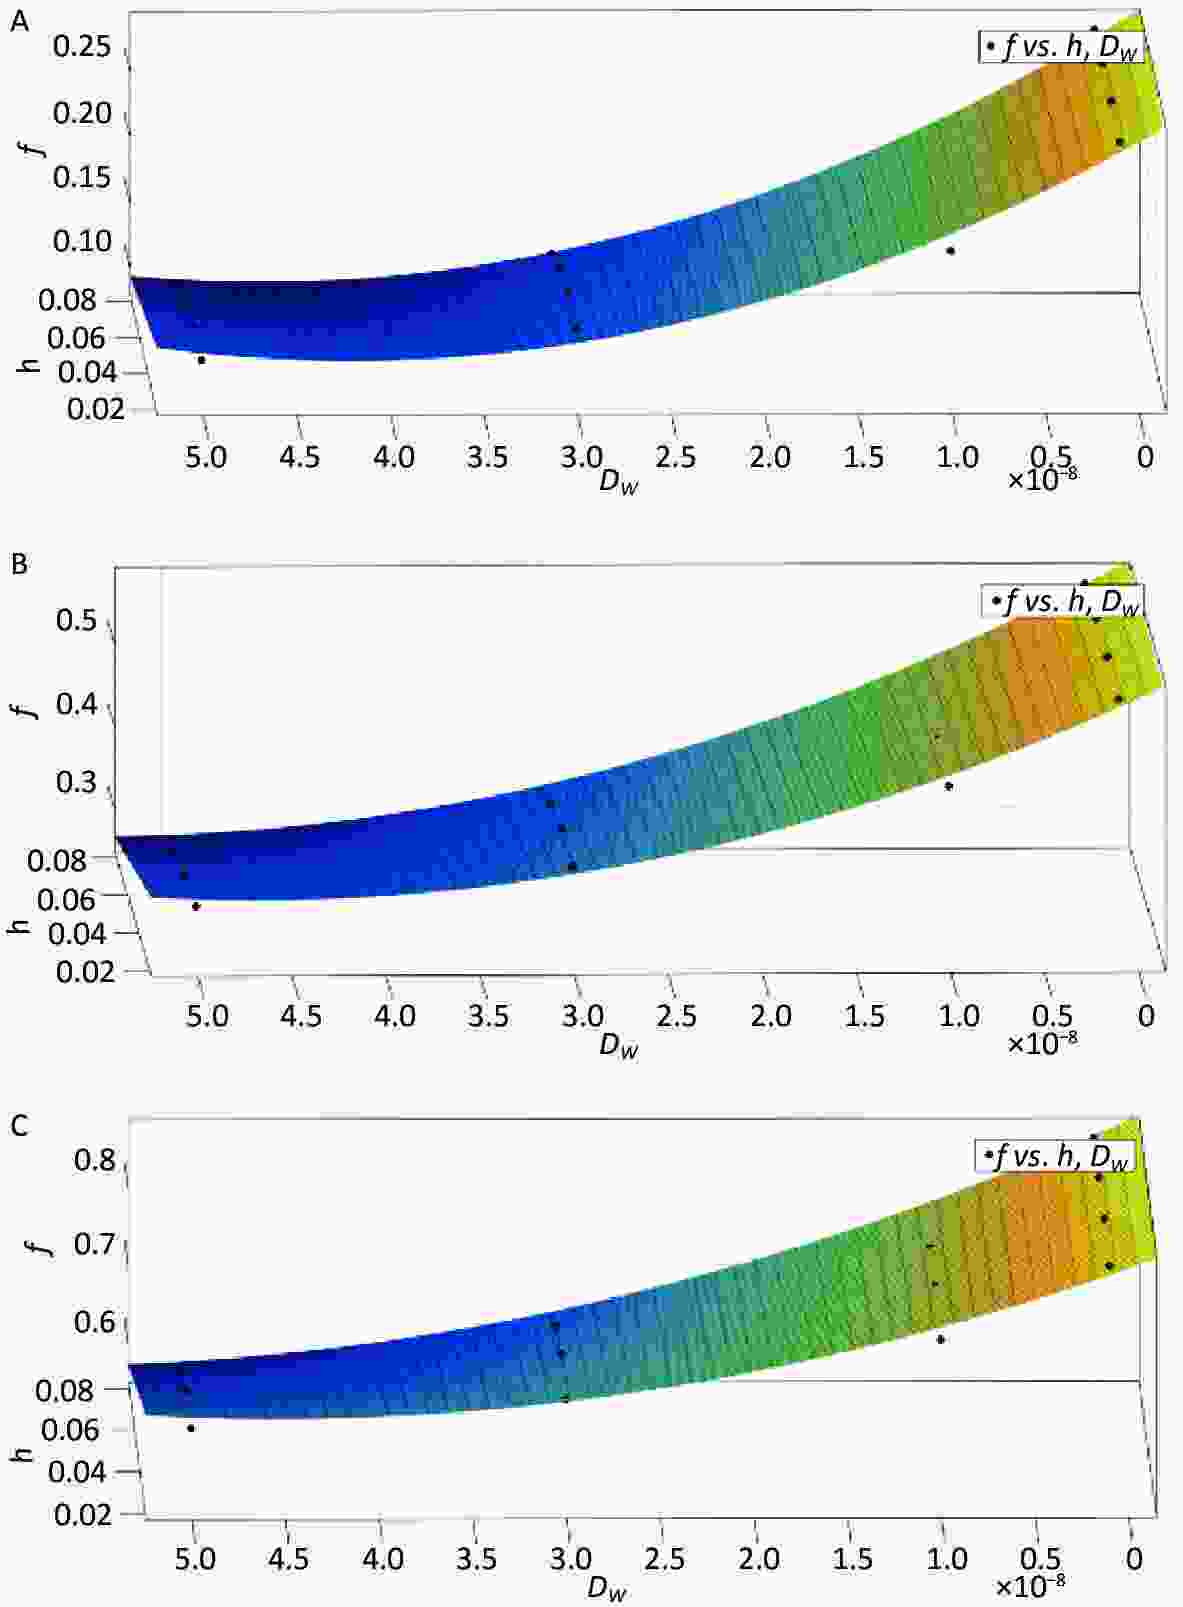
Figure 8. Estimation model of radon retardation rate (A) (P = 29.6%), (B) (P = 59.1%), (C) (P = 88.7%).
$$ \begin{aligned} {f}=\; & 0.2864-0.058\times {h}-7776000\times {{D}}_{{w}}-9.521\times {10}^{6} \times \\ & {h}\times {{D}}_{{w}}+9.477\times {10}^{13}\times {{{D}}_{{w}}}^{2} (R^{2} = 0.9766) \end{aligned}$$ (12) $$ \begin{aligned} {f}=\;& 0.5813-0.04255\times {h}-9972000\times {{D}}_{{w}}-2.129\times {10}^{7}\times\\ & {h}\times {{D}}_{{w}}+1.111\times {10}^{14}\times {{{D}}_{{w}}}^{2} (R^{2} = 0.9837) \end{aligned} $$ (13) $$ \begin{aligned} {f}=\;&0.8689-0.05516\times {h}-7926000\times {{D}}_{{w}}-3.297\times {10}^{7}\times\\ & {h}\times {{D}}_{{w}}+9.382\times {10}^{13}\times {{{D}}_{{w}}}^{2} (R^{2} = 0.9702) \end{aligned}$$ (14) The estimation model for the radon retardation rate of covering floats in a water body under the synergistic effect of multiple factors (area coverage rate, immersion depth, and diffusion coefficient) was obtained as follows:
$$ \begin{aligned} {f}=\;& 0.01625+0.00943\times P-0.49844\times {h}\\ &-4.4997\times {10}^{6}\times {{D}}_{{w}} (R^{2} = 0.9764) \end{aligned} $$ (15) 1) From Figure 8A, Figure 8B, and Figure 8C, it can be observed that the effect of the immersion depth on the radon retardation rate is limited by the value of the diffusion coefficient under the condition of the same area coverage rate. 2) It can be observed from Equation (12), Equation (13), and Equation (14) that, when the areal coverage rate is 29.6%, the radon retardation rate can reach 28.64%; when the areal coverage rate is 59.1%, the radon retardation rate can reach 58.13%; and when the areal coverage rate is 88.7%, the radon retardation rate can reach 86.9%. 3) Equation (15) shows that, under the synergistic effect of multiple factors, the radon retardation rate is positively correlated with the area coverage rate and negatively correlated with the diffusion coefficient and immersion depth.
-
This is a numerical simulation study of the radon retardation behavior of covering floats in radon-containing water. There has been some research on radon transportation in water[29-31], but it is new to incorporate covering methods for the same. The advantage of this study is that the distribution of radon concentrations in water can be visualized in the Figure 6, which reveals a deeper law of radon migration in water under different covering conditions. For example, with the same diffusion coefficient, the radon concentration gradient in the area around the float and in the sediment area increases with increasing immersion depth. This phenomenon can be explained as follows: a part of the radon decays before reaching the bottom of the float when the immersion depth is small, the diffusion distance of radon in the vertical direction decreases with increasing immersion depth, and more radon diffuses upward from both sides of the float and is released from the water surface before decaying. In addition, Figure 6C shows that under the same coverage conditions, the radon concentration gradient in the area around the float and the radon concentration in the sediment layer decrease with an increase in the diffusion coefficient, whereas the radon concentration gradient in the sediment and the radon concentration in the overlying water layer first increase and then decrease. This phenomenon can be explained as follows. The concentration in the overlying water layer includes the radon generated by itself and the radon transmitted by the sediment. More radon in the sediment layer is transferred to the overlying water layer. An increase in the diffusion coefficient results in a decrease in the radon concentration in the sediment layer and an increase in the radon concentration in the overlying water layer. More radon in the overlying water layer is released from the water surface with further increase in the diffusion coefficient, resulting in a gradual decrease in the radon concentration in the overlying water layer. The radon-containing water body was taken into account as a whole in the existing research on radon migration and exhalation in water[6,31]. Radon mass transport processes vary between various areas of the water and at various interfaces of the water body. We consider that not only the migration and exhalation processes of radon in the overlying water layer but also the transfer process of radon in the sediment to the overlying water layer systematically reveal the mass transfer process of radon in water under different coverage conditions.
At present, most water radon studies focus on the migration and exhalation law of water radon under the action of a single factor[32-34], and a single factor can only reveal the law under idealized conditions. In reality, water radon migration and exhalation are affected by the interaction of various factors of the exhalation law. For example, this research found that when the thickness of the overlying water layer is small, such as 0.1 m, the radon retardation effect under different immersion depths is affected by the diffusion coefficient. This phenomenon can be explained by mass conservation. According to Equation (9), the amount of radon produced by the sediment and the exposed area of the water surface remains unchanged, and the volume and amount of decayed radon of the overlying water decrease with an increase in immersion depth, resulting in an increase in radon concentration in the overlying water layer. When the diffusion coefficient is small, it is more difficult for radon from the sediment layer to migrate to the overlying water layer; therefore, the radon release rate at the water surface first decreases and then increases. However, when the diffusion coefficient is large, radon from the sediment layer is more likely to migrate to the overlying water layer, resulting in a continuous increase in the radon release rate.
Radon exhalation is affected by factors such as diffusion coefficient, free radon production rate, and radium activity concentration[32,35-36]. In recent years, covering methods have been shown to be one of the most effective methods for retarding the exhalation of radon in rocks, soil, housing building materials, and uranium tailings[14,37-38]. These studies revealed that the diffusion coefficient of the material and the mulch thickness influenced the effect of the covering method on radon exhalation. Therefore, we found that the radon retardation effect of covering floats in radon-containing water is affected by the area coverage rate, immersion depth, diffusion coefficient, and radon transfer velocity at the gas−liquid interface. We not only demonstrated the viability of this numerical simulation by experimental validation, but also studied the relationship between the radon retardation rate and these parameters. The optimized model uses multivariate linear fitting under the synergistic effects of multiple factors, which is important for practical engineering. Fitting Eq. (15) has guiding significance for the radon prevention design of covered floats in radon-containing water; that is, under the synergistic effect of multiple factors, the area coverage rate should be increased, and the influence of some environmental factors should be minimized to reduce the diffusion coefficient. When the thickness of the overlying water layer of the sediment-containing water body is small, such as 0.1 m, the immersion depth of the float should be optimized according to the radon diffusion coefficient on the premise that the float can effectively cover the water surface. For example, if the diffusion coefficient is greater than 5 × 10⁻⁸ m2·s−1, the smaller the immersion depth is, the better the radon retardation effect.
-
To reveal the behavior of the modular floats in reducing radon release from water bodies based on the actual size of the simulated experimental device, CFD was used to simulate and compare the effects of different coverage conditions on radon retardation in radon-containing water bodies. The radon retardation rates of the simulated results were determined and the radon retardation effects were optimized and fitted. The simulated variation values of the radon retardation rate with the coverage area rates and the experimental results were compared. From the results, the following conclusions are drawn:
(1) Under the same coverage condition, the radon retardation rate of a radon-containing water body only increased by 0.01% when the radon transfer velocity at the gas−liquid interface increased from 1 × 10⁻⁷ to 5 × 10⁻⁶ m·s−1. Under the same immersion depth (0.04 m), the radon retardation rate decreased by 60.2% when the diffusion coefficient increased from 1 × 10⁻⁹ to 5 × 10⁻⁸ m2·s−1, whereas it increased by 2.1 times when the area coverage rate increased from 29.6% to 88.7%. When the thickness of the overlying water layer of the sediment-containing water body is small, such as 0.1 m, the immersion depth of the float should be optimized according to the radon diffusion coefficient on the premise that the float can effectively cover the water surface.
(2) Based on the physical conditions and numerical simulation results of this study, the following estimation model of the radon retardation rate of radon-containing water body coverage was constructed using the synergistic impacts of three factors: area coverage rate, immersion depth, and diffusion coefficient: $ f=0.01625+0.00943\times P\ - 0.49844\times h-4.4997\times10^6\times D_w $ (R2 = 0.9764). Under the synergistic effect of multiple factors, the radon retardation rate was positively correlated with the area coverage rate and negatively correlated with the diffusion coefficient and immersion depth.
(3) The numerical simulation results of the variation trend of the radon retardation rate in radon-containing water with the area coverage rate matched well with the experimental results.
HTML
Physical Model
Numerical Method
Geometric Model
Mathematical Model
Boundary Conditions
Meshing Division
Simulation Parameters
Coverage Parameters
Experimental Verification
Experimental Setup and Related Parameters
Estimation Method of Radon Diffusion Coefficient
Comparison of Experimental and Simulated Results
Effect of Parameters on Radon Concentration
Effect of Parameters on Radon Retardation
Estimation Model of Radon Retardation Rate
DECLARATION OF COMPETING INTEREST The authors do not have any possible conflicts of interest.

 Quick Links
 DownLoad: