-
Mercury (Hg) is a liquid metal that flows under normal temperature and pressure. Because of its physical properties, such as low viscosity, high density, high electrical conductivity, and ability to mix with other metals, Hg is widely used in chemical, metallurgy, electrical equipment manufacturing, pharmaceutical, and transportation industries, and has military applications[1]. Mercury can enter the body through the respiratory, integumentary, and digestive systems. During the production and use of Hg, workers are prone to inhalation of air containing Hg vapor. Due to its fat solubility, more than 70% of inhaled Hg vapor can be absorbed[2]. Hg toxicity in the human body includes cytotoxicity, neurotoxicity, teratogenicity, hepatotoxicity, nephrotoxicity, and immunotoxicity. Studies have shown that Hg exposure can cause paresthesia, visual field narrowing, ataxia, and dysarthria. High levels of inorganic Hg can lead to cell apoptosis, abortion, fetal death, cerebral palsy, vision or hearing loss, and other serious complications[3]. Population cohort, in vitro, and in vivo studies have reported that high levels of Hg exposure may lead to islet b-cell dysfunction, increasing the risk of diabetes[4-6]. The toxicity of inorganic Hg can disrupt the pro-oxidation-antioxidant balance, leading to increased free radical production and resulting in oxidative stress in the kidneys and liver[7,8]. Although, the mechanism of renal toxicity caused by Hg is not fully understood, numerous studies have suggested that Hg primarily affects the proximal renal tubules[9,10]. Animal studies have demonstrated that rats treated with mercury chloride (HgCl2) exhibit significant alterations in glomerular structures, deformation of renal tubules, and thinning of renal tubule epithelial cells, triggering robust inflammatory responses[11]. These findings support Berlin’s conclusion that approximately 50% of inorganic Hg accumulates in the kidneys within hours of exposure[12].
Mercury has been shown to have complex and serious effects on the immune system[13]. Metallic Hg exposure affects cytokine levels by inducing T and B lymphocyte proliferation with assistance from costimulatory molecules such as CD40L[14]. Numerous studies have shown that Hg can trigger autoimmunity via multiple routes of exposure, including subcutaneous injection, oral or inhalation[15-17]. Researchers have reported that Hg exposure can cause oxidative stress, apoptosis, motor and cognitive impairments, and neural loss in vitro[18]. Some studies have used mRNA high-throughput sequencing technology to explore the toxic mechanism of low-dose Hg exposure in newborns and found that it may be related to mitophagy and oxidative stress. Exposure to low Hg levels may increase the risk of neonatal neurodegenerative diseases[19]. Recent studies have reported that high Hg levels in mothers who ate less fish during pregnancy are associated with lower adiponectin levels in children and increased levels of interleukin-6 (IL-6), interleukin-1β (IL-1β), tumor necrosis factor-α (TNF- α), and leptin in children[20].
The tumor suppressor phosphatase and tension homolog (PTEN), discovered in 1997, is a tumor suppressor gene that is frequently lost in cancer[21]. PTEN is a dual lipid and protein phosphatase with biological effects primarily determined by its ability to dephosphorylate the lipid substrate phosphatidylinositol-3,4,5-triphosphate (PIP3)[22]. Studies have confirmed that PTEN serves as a negative regulator of the phosphatidylinositol-3 kinase (PI3K) / the protein kinase B (PKB/AKT) signaling pathway and plays a key role in growth regulation, survival, and metabolism[23,24]. PI3K and AKT are well known for their roles in regulating cell growth, proliferation, cell cycle, and glucose metabolism[25].
IL-6 is a soluble mediator often involved in inflammation[26]. When the body is infected or has tissue damage, serum IL-6 levels increase rapidly and activate liver, immune, or blood cells, producing relevant responses to eliminate infectious agents and promote tissue healing[27]. IL-6 plays an important role in the development of acute inflammatory diseases, chronic diseases, or cancer[26].
This study was conducted according to the following key steps: 1) Bioinformatics analysis was performed on the results of the gene expression chips to identify the genes related to Hg exposure; 2) Differentially expressed genes were confirmed by using quantitative reverse transcription polymerase chain reaction (qRT-PCR); 3) A 293T cell model exposed to Hg and a cell model with low PTEN expression was established. The key differential gene, PTEN, which is associated with Hg exposure, was cross-validated using qRT-PCR, Western blotting, and an Enzyme-linked immunosorbent assay (ELISA). This study aimed to identify the differentially expressed gene (DEG) PTEN by integrating results from both population and cell models. Furthermore, we aimed to elucidate the mechanisms underlying kidney injury resulting from exposure to high Hg levels.
-
The sampling time, location, and quantity at each sampling point were determined according to the Sampling Code for Monitoring and Monitoring of Hazardous Substances in the Air of Workplaces (GBZ 159-2004)[28]. The concentration of Hg in the air was determined by atomic fluorescence spectrometry as specified in the “Determination of Toxic substances in the air of the Workplace Part 18: Mercury and its Compounds” (GBZ/T 160.14-2004)[29].
-
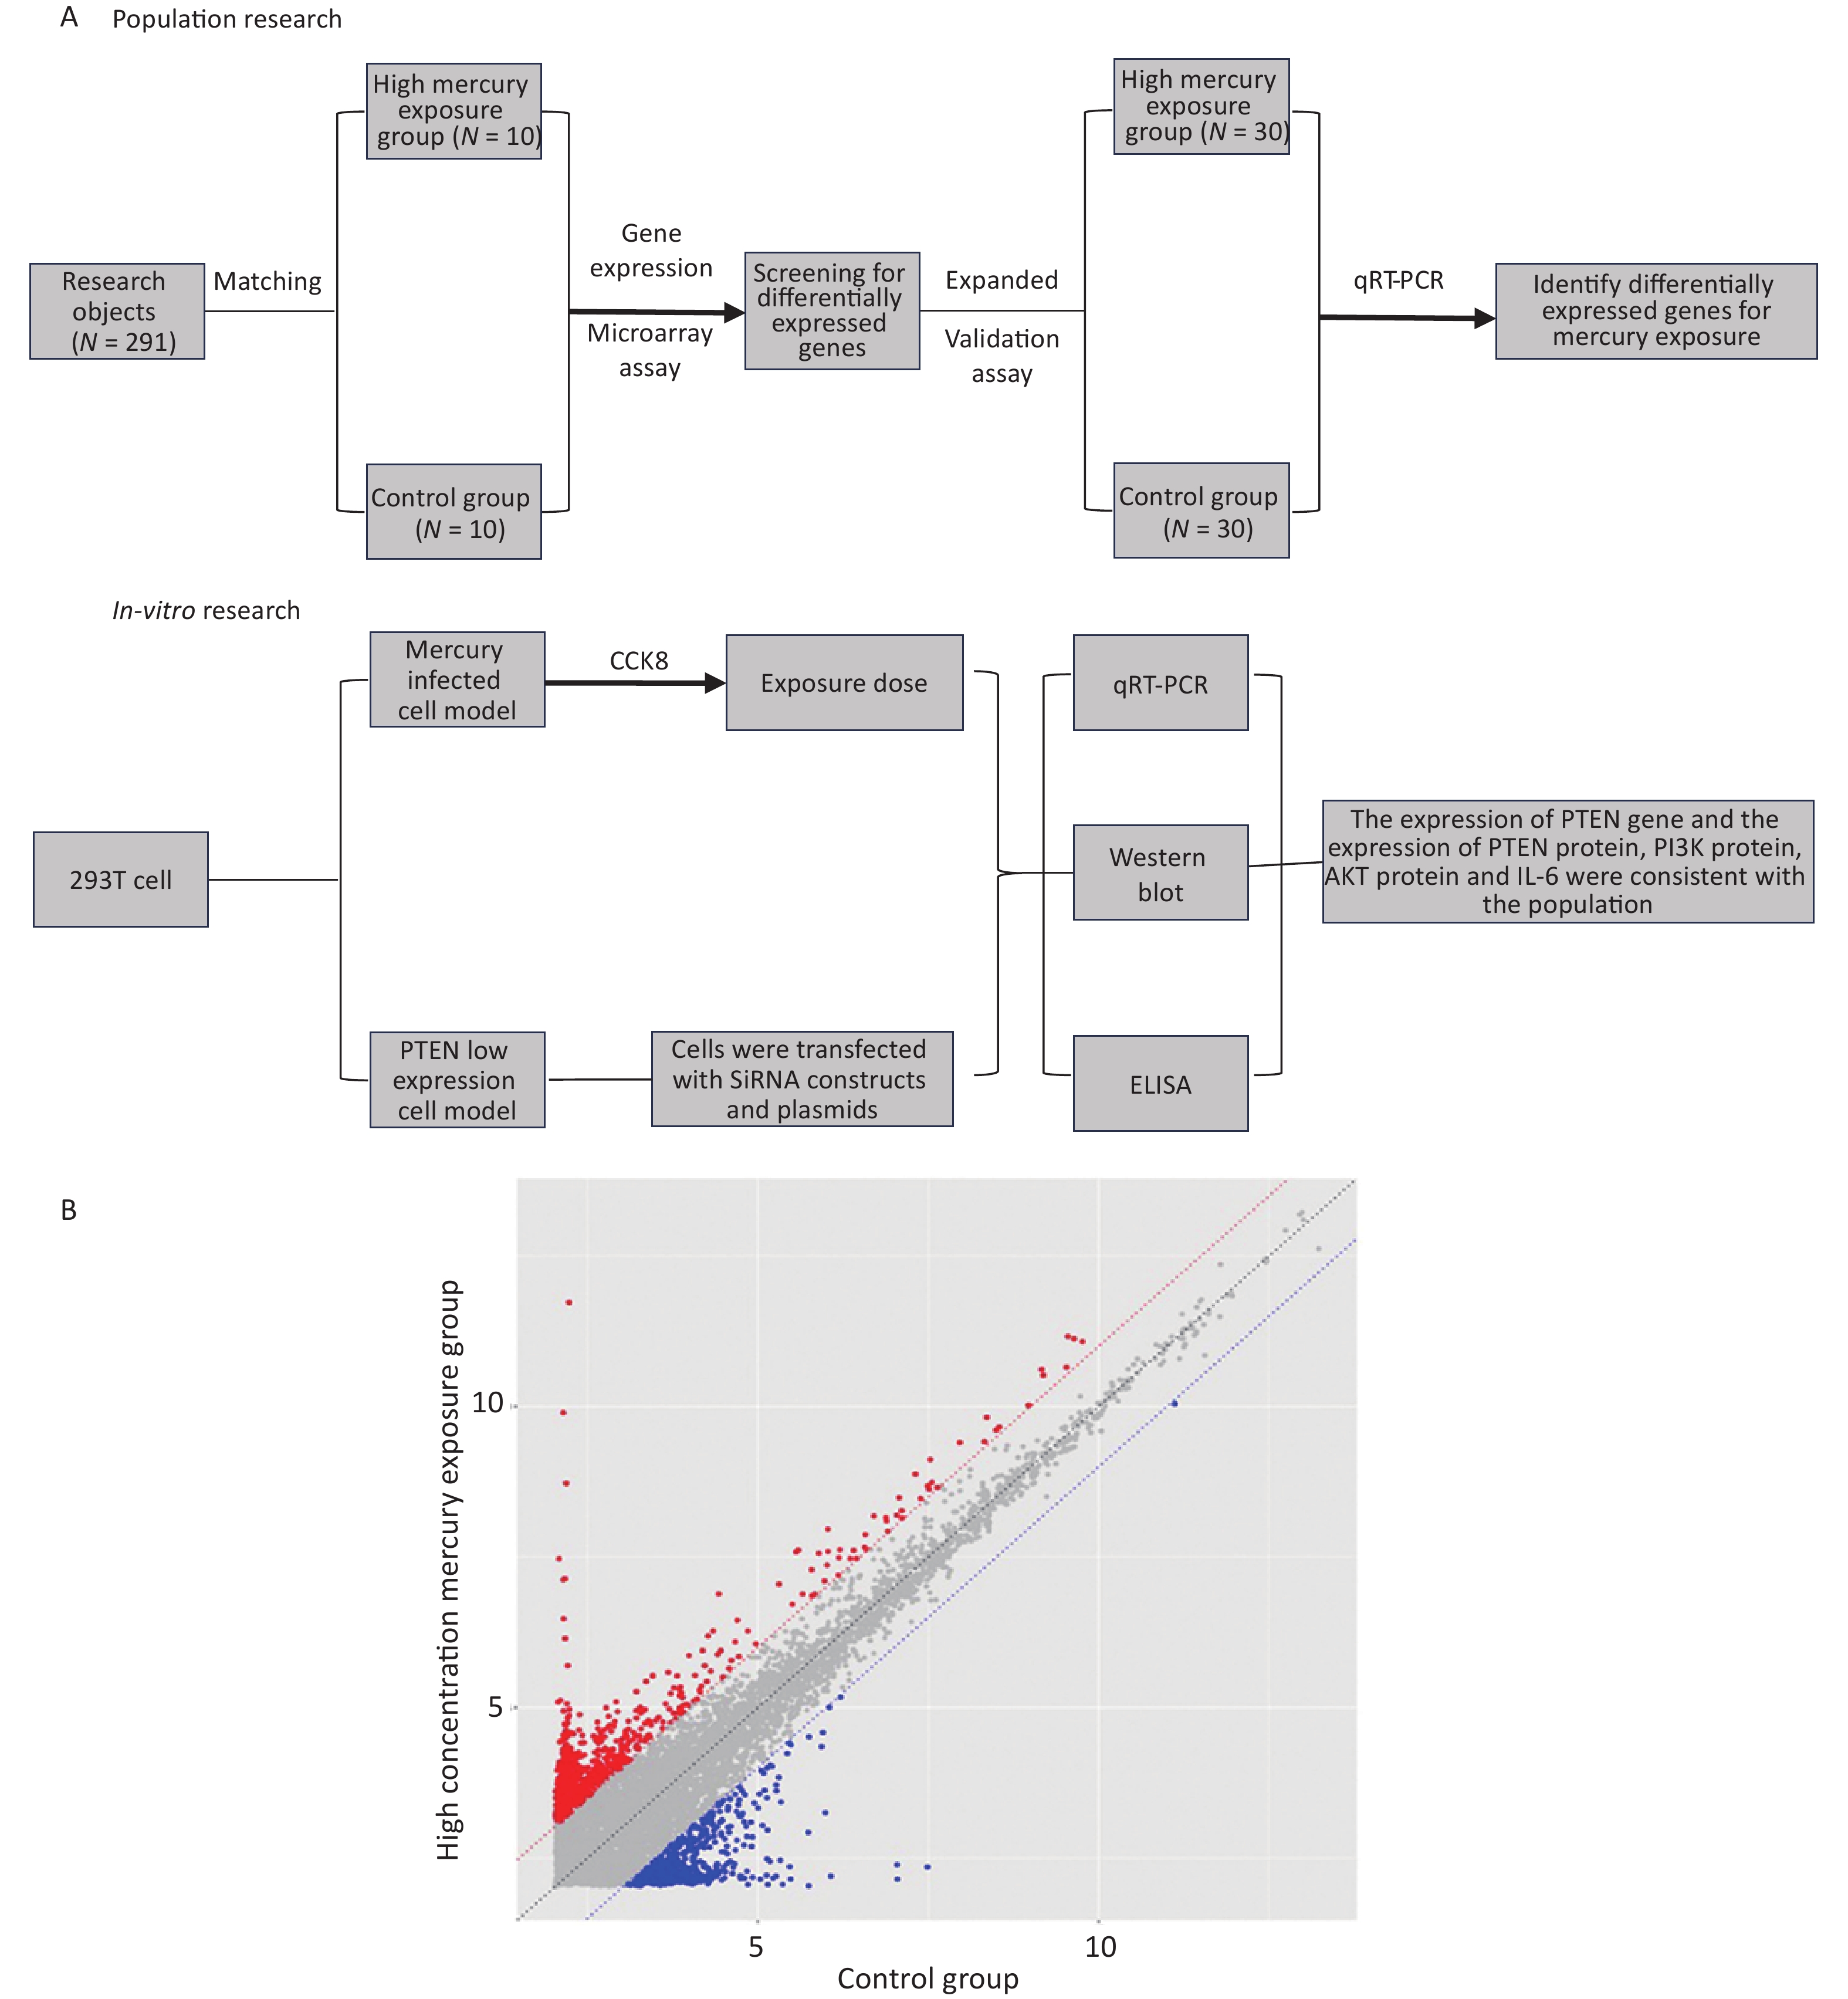
Figure 1A presents the technical process of this study and, summarizes the research approach. In this study, both the population and in vitro cell studies were conducted separately, and the results were integrated for analysis and discussion.
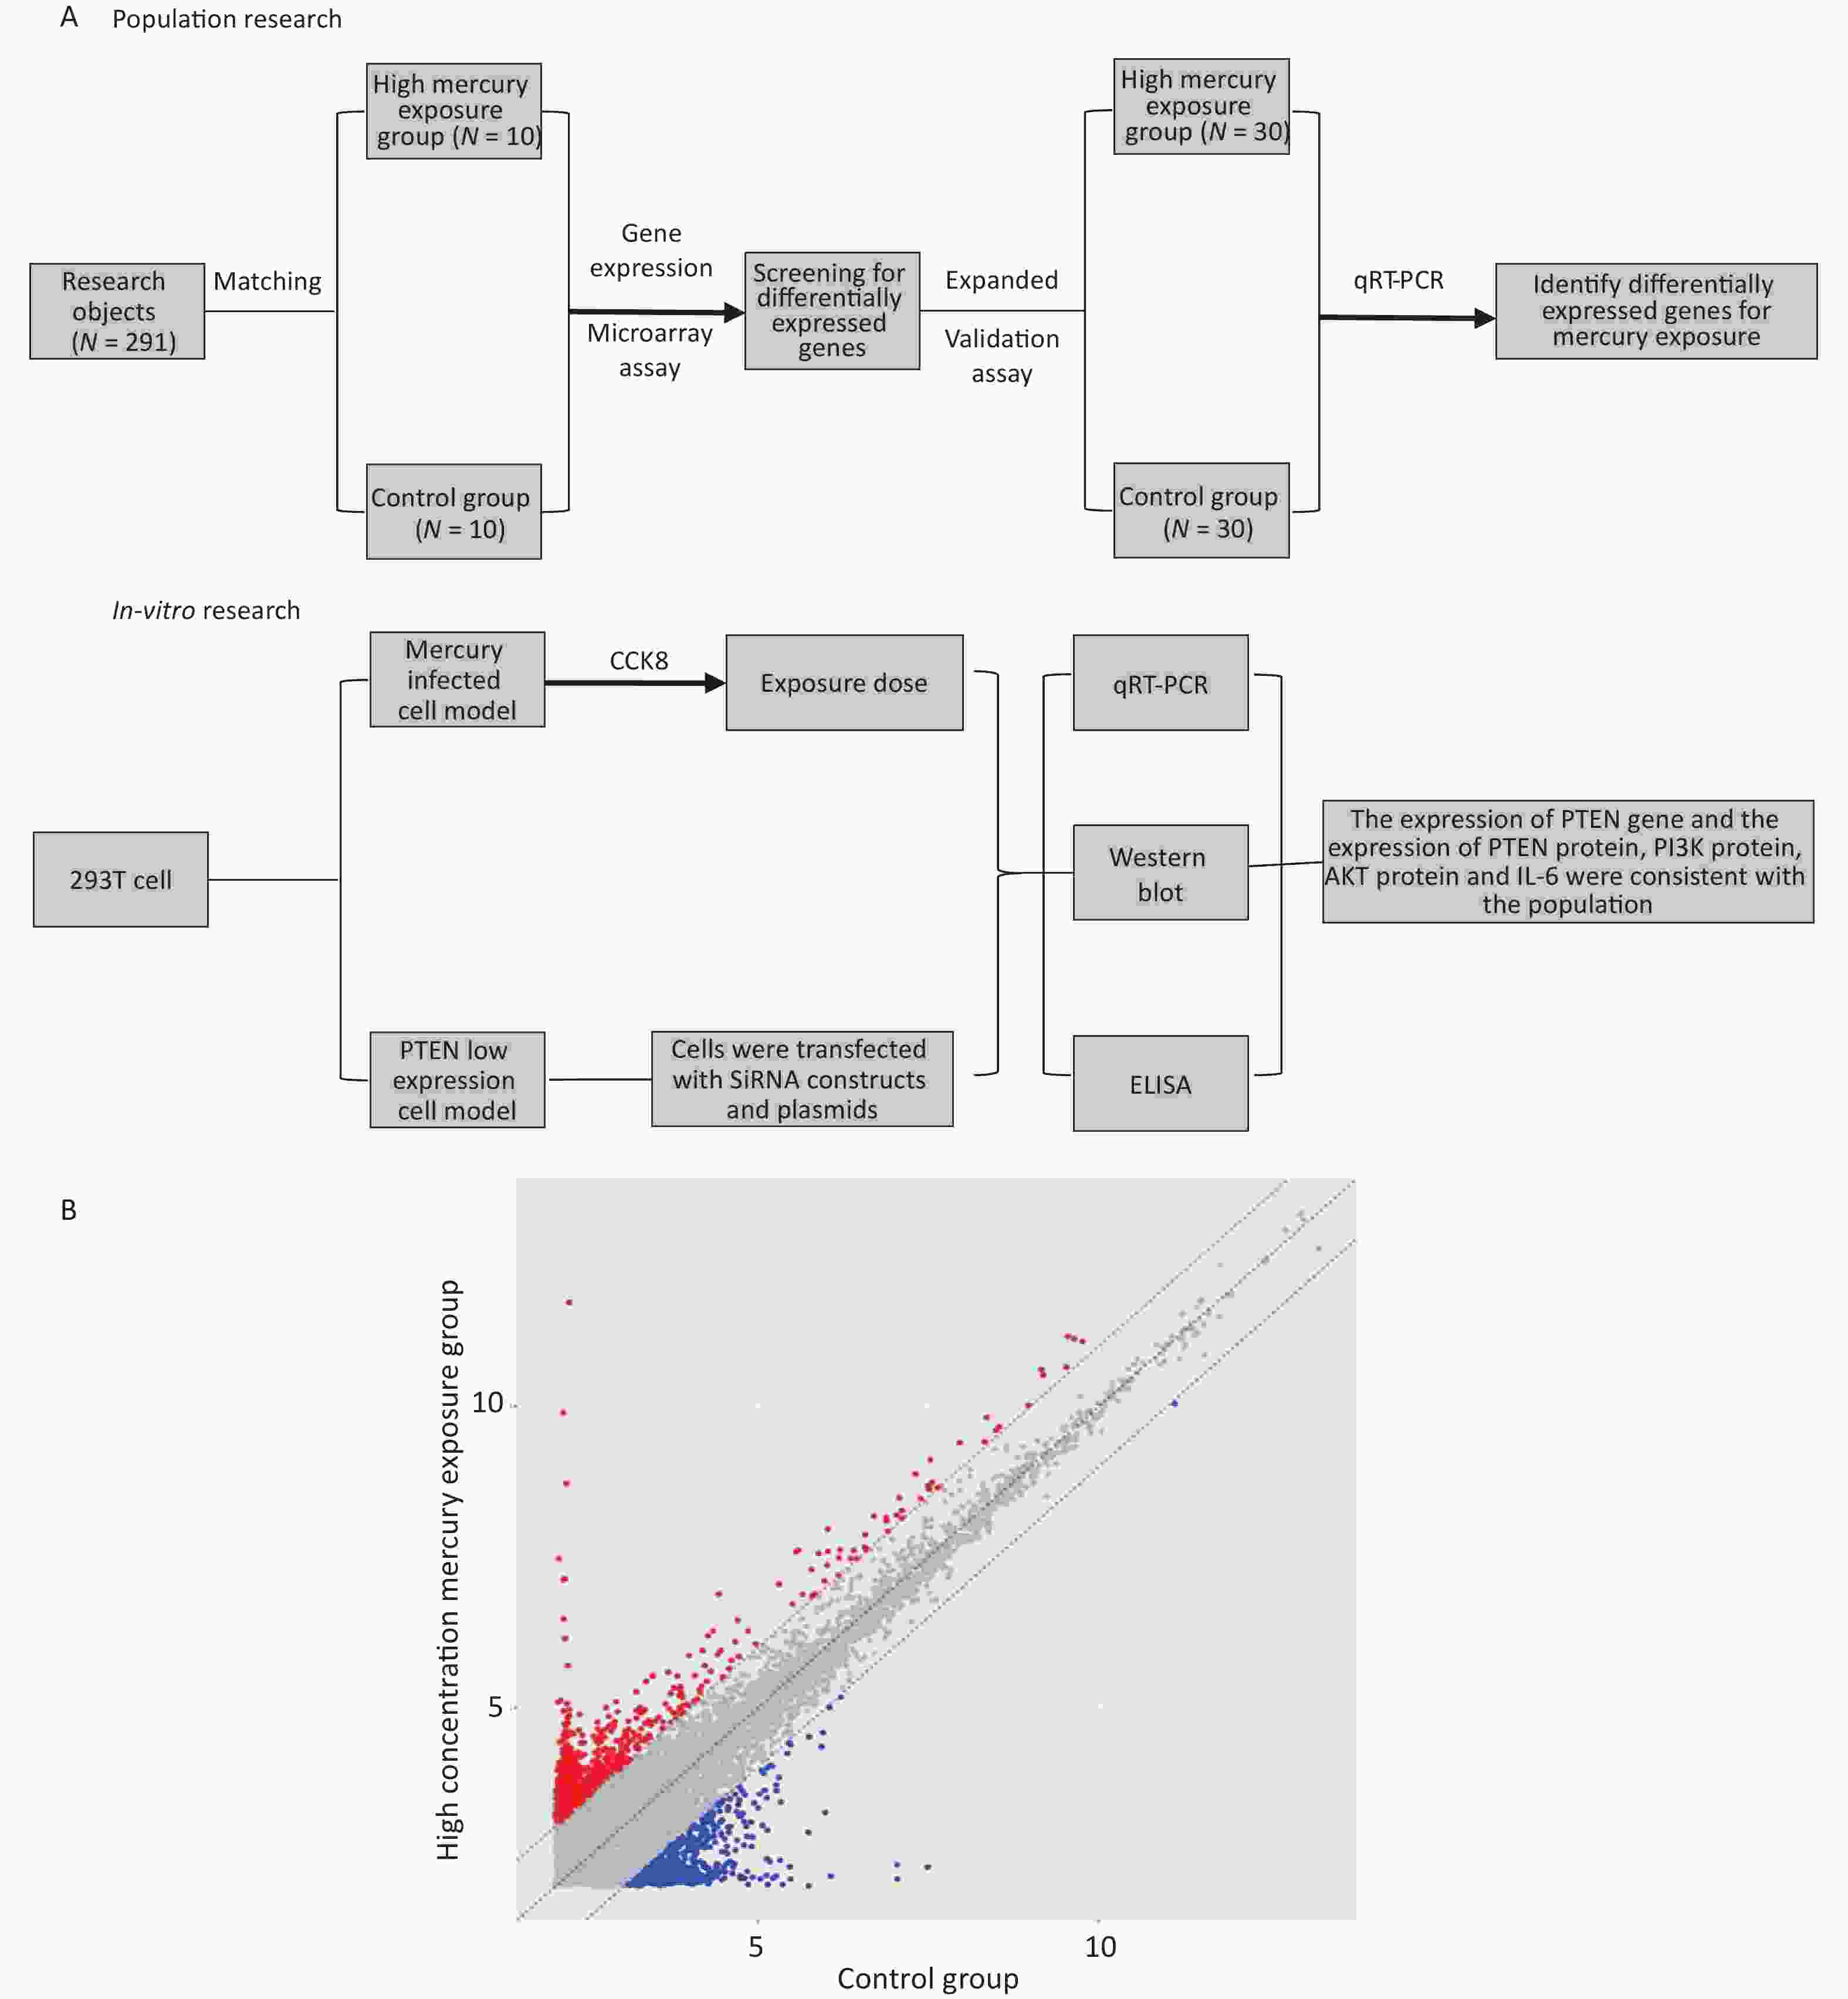
Figure 1. Study design and differentially expressed genes (DEGs). (A) Study design and (B) Scatter plot of DEGs. Red indicates upregulation and blue indicates downregulation.
A total of 291 workers from a plant in Jiangsu Province, China in 2016 were included in this study. All the participants voluntarily participated and signed an informed consent form. This study was approved by the Ethics Committee of Jiangsu CDC (Center for Disease Control and Prevention). According to WS/T 265-2006 “Biological Exposure Limits of Occupational Mercury Exposure”[30], the subjects were divided into high-concentration Hg exposure group and a control group (low-concentration Hg exposure group). In the preliminary screening stage of the gene expression chip experiment, 10 individuals were selected, and in the population expansion validation stage, 30 individuals were selected from each group. Inclusion criteria for the high-concentration Hg exposure group were as follows: 1) Work experience involving Hg exposure for over 3 years; 2) high urine Hg levels [urine Hg value ≥ 200 μg/g creatinine (Cr)]; 3) no history of primary nervous system or kidney diseases; and 4) no prolonged use of neurotoxic or nephrotoxic drugs. The control group participants engaged in long-term Hg-related work, had increased urine Hg levels (urine Hg value > 35 μg/g Cr and < 200 μg/g Cr), and the remaining inclusion criteria matched those of the high-concentration Hg exposure group. The control group was selected based on a 1:1 matching principle, with the following matching factors: 1) age differences ≤ 5 years; 2) sex; and 3) similar work experience with Hg exposure (≤ 5 years). The investigator received standardized training, conducted a one-to-one questionnaire survey with the subjects, and informed them about the purpose of the study. The questionnaire mainly included the following: 1) basic information (sex, age, etc.); 2) informed consent; 3) occupation history (type of work, length of service in Hg-related industry); 4) smoking and alcohol consumption history; and 5) disease history (chronic, and liver, and kidney diseases). Informed consent was obtained from all participants included in the study.
In the morning, 4 mL of blood was drawn from each participant and placed in a collection tube containing separation gel (BD, USA). After blood stratification, centrifuge at 3,300 rpm for 3 min. After centrifugation, 1.5 mL supernatant was extracted into a 2 mL eppendorf (EP) tube and stored at –80 °C. The participants were instructed to wash their hands in advance and collect their urine in a 50 mL sterile centrifuge tube. WS/T 25-1996 “Cold atomic Absorption Spectrometric Determination of Mercury in Urine (II) Acid Stannous Chloride Reduction Method”[31] was used as the standard for the determination of Hg in urine, while WS/T 97-1996 “Spectrophotometric Determination of Creatinine in Urine”[32] was used as the standard for the determination of urine creatinine.
-
Serum samples were collected from 10 participants in each group, and total RNA was extracted using the miRNeasy Serum/Plasma Kit (no.217184, QIAGEN, Germany). The extracted RNA was analyzed using a Nanodrop One (Thermo Scientific, USA) to ensure OD260/OD280 values between 1.8–2.0 without contamination.
Serum samples were thawed at 4 °C and then centrifuged for 10 min at 12,000 rpm. After centrifugation, 200 μL of the supernatant was transferred to RNase EP tubes. Next, 1 mL of QIAzol Lysis was added and incubated for 5 min, followed by the addition of 200 μL of trichloromethane and incubation for another 3 min. The mixture was centrifuged for 15 min at 12,000 rpm. A total of 600 μL of the supernatant was carefully collected in a clean 1.5 mL RNase EP tube, and 900 μL of 100% ethanol was added. The resulting solution was loaded onto a spin column and centrifuged for 15 s at 12,000 rpm. Sequentially, RWT buffer, RPE buffer, and 80% ethanol were added, followed by centrifugation for 15 s at 12,000 rpm in each step. RNase-free water was added to the spin- column membrane, allowed to stand for 10 min, and then centrifuged for 1 min. The extracted RNA was stored at –80 °C.
-
This study was conducted by the Bohao Biological Company (Shanghai), and a Human circRNA 1.0 chip was used for initial screening. In this study, 10 serum total RNA samples were collected from both the workers exposed to high Hg concentrations and control workers (1:1 matching). These samples were then mixed into RNA pools and transported to Bohao for analysis at a low temperature. The screening criteria for gene expression microarray results were as follows: the Fragments Per Kilobase Million (FPKM) value of gene expression in the high-concentration Hg exposure group divided by the FPKM value of gene expression in the control group (FC) was required to be either ≥ 2 or ≤ 0.5.
-
The qRT-PCR experiment was conducted using a custom kit (dye method) provided by Shanghai Genepharma Company, with GAPDH as the internal reference. The primer sequences are listed in Table 1. All experimental steps were performed on ice. For the pre-denaturation test, 1.2 μL of gene-specific RT primer and 2 μL RNA template were mixed in eight tubes. The mixture was heated in a PCR apparatus at 70 °C for 5 min, and immediately placed on ice after heating. For the reverse transcription experiment, 4 μL of MMLV RT Buffer, 0.75 μL dNTP, 0.2 μL MMLV reverse transcriptase, and 11.85 μL RNase-Free H2O were added to the same eight tubes. After sealing the lids, the eight tubes were placed in the PCR instrument for the reverse transcription (42 °C for 45 min, followed by 85 °C for 5 min). For the qRT-PCR, a premixed solution containing 2.5 μL of real-time PCR Master Mix, 0.1 μL of gene-specific primer set, 0.05 μL of Taq DNA polymerase, 1.85 μL sterile water was prepared. Subsequently, 0.5 μL of cDNA and 4.5 μL of the premixed solution was added to each well in a 384-well plate, to obtain total reaction volume of 5 μL per well (in triplicate). The plates were sealed with a transparent membrane and centrifuged for 5 min at 3,500 rpm before being placed in a Quant Studio 7 Flex instrument. The reaction conditions were as follows: 95 °C for 3 min (1 cycle), followed by 40 cycles of 95 °C for 12 s and 62 °C for 40 s. The reaction system was set to 5 μL, and the fluorescence signal was collected in the final step.
Gene Sequence (5’→3’) Product size (bp) PTEN F:GCACTGTTGTTTCACAAGATGATG
R:GCAGACCACAAACTGAGGATTG81 SOX8 F:GAACGCATTCATGGTGTGGG
R:TAGTCGGGGTGGTCCTTCTT189 SOX6 F:AGGGAGTCTTGCCGATGTG
R:CAGGCTCTCAGGTGTACCTTTA181 KDM1A F:GTGCAGTACCTCAGCCCAAAG
R:TCTCCCGCAAAGAAGAGTCGT190 RNF2 F:TGCATCATCACAGCCCTTAGAAG
R:TTGTGCTTGTTGATCCTGGCT182 GAPDH F:CATGAGAAGTATGACAACAGCCT
R:AGTCCTTCCACGATACCAAAGT113 Note. PTEN, Phosphatase and tensin homolog; SOX8, SRY-box transcription factor 8; SOX6, SRY-box transcription factor 6; KDM1A, Lysine demethylase 1A; RNF2, ring finger protein 2; GAPDH,Glyceraldehyde-3-phosphate dehydrogenase. Table 1. List of primers for differentially expressed mRNAs of the candidates
The qRT-PCR results for the candidate genes were analyzed, relative expression levels were calculated, and paired t-tests were performed for statistical analysis, with statistical significance set at P < 0.05. The relative expression of candidate genes was represented as –ΔCT = [CT (target gene) – CT (GAPDH)] × (–1). The expression levels of candidate genes were expressed as 2–ΔCT .
-
Human embryonic kidney cells HEK-293T (CL-0005) were obtained from Punosel Life Technology Co. Ltd. (Wuhan, China) and cultured according to the manufacturer’s instructions. Complete Dulbecco’s Modified Eagles Medium (DMEM) was prepared using DMEM high-glucose medium (GIBCO, USA), fetal bovine serum (GIBCO, USA), penicillin, and streptomycin (Hyclone, USA) in a ratio of 100:10:1. The cell cultures were maintained in 100 mm cell culture dishes (Corning, USA) in an incubator at 37 °C with a carbon dioxide concentration of 5%.
-
Cells were seeded into 96-well plates (Corning, USA), and 100 μL of complete culture medium and approximately 4 × 10³ cells were placed in each well. Blank control wells contained 100 μL of cell culture medium but no cells. The plates were then placed in a constant-temperature incubator with 5% CO2 at 37 °C. After the cells achieved adherent growth, they were treated with various concentrations of HgCl2 (Shanghai Chemical Reagent Factory, China). Each concentration was tested in triplicate, resulting in final exposure concentrations of 100, 50, 40, 30, 20, 10, 5, and 0 μmol/L. After 24 h of exposure, 10 μL of CCK-8 solution (Beyotime, China) was added to each well. After incubation for 0.5, 1, 2, and 4 h, the absorbance was measured using a microplate reader to determine the exposure concentration.
-
The cells were seeded into 6-well plates (Corning, USA) and allowed to incubate for 24 h. Subsequently, the cells were exposed to HgCl2 at concentrations of 25, 10, and 0 μmol/L. RNA extraction was performed 24 h after exposure, and protein extraction was performed 48 h after exposure. The concentration was determined using literature references and CCK-8 analysis.
-
The cells were seeded into 6-well plates (Corning, USA) one day prior to the experiment. For transfection, the (Genepharma, China) dried siRNA product (1.00 OD260/ tube) was centrifuged, and 125 μL of DEPC water was added. OPTI-MEM serum-free medium (1,600 μL) was placed in each well of the 6-well plate. The EP tubes were numbered, and 200 μL of OPTI-MEM and 10 μL of siRNA were placed in one tube. The mixture was stirred and allowed to stand for 5 min. In another tube, 200 μL of OPTI-MEM and 5 μL lip2000 were added, and the mixture was stirred and allowed to stand for 5 min. Medium mixed with lip2000 was then added to the medium mixed with siRNA, and after 20 min, the transfection complex was formed. Next, 400 μL of the transfection complex was added to each well and mixed. After 5 h, the medium was replaced with complete DMEM, and transfection was examined using a fluorescence inverted microscope (Olympus, Japan) after 6 h. RNA and protein extraction was performed 24 and 48 h after transfection.
-
The cells were washed twice with PBS, and then 1 mL of RIPA buffer supplemented with 10 μL of PMSF was applied for cell lysis. The protein concentration was determined using a BCA protein concentration assay kit (Beyotime, China). Protein samples were prepared by mixing sodium dodecyl sulfate-polyacrylamide gel electrophoresis (SDS-PAGE) protein loading buffer (5x) and RNase-free water.
-
Protein samples were separated using 10% SDS-PAGE (Beyotime, China) and subsequently transferred to a PVDF membrane (Millipore, USA). The PVDF membranes were then immersed in a blocking solution (Solarbio, USA) at room temperature for 1 h. The primary antibody (Abcam, UK) was prepared in the blocking solution and incubated with the PVDF membrane overnight at 4 °C. Next, the secondary antibody (Abcam, UK) was diluted and used to incubate the PVDF membrane for 1 h. Finally, a mixture of components A and B from the Clarity Max Western ECL Substrate (Bio-Rad, UK) was applied to the membrane, which was then placed in a Bio-Rad gel system for imaging.
Primary antibodies against PTEN, PI3K, AKT, and GAPDH were used. All antibodies were rabbit monoclonal. The antibodies were diluted to the following concentrations: PTEN, at 1/2,000; PI3K, at 1/1,000; AKT, at 1/1,000; and GAPDH, at 1/2,500. The secondary antibody was a goat anti-rabbit antibody, which was used at a dilution of 1/10,000.
-
An IL-6 ELISA kit (Nanjing Jiancheng Bioengineering Institute, China), was used. The cell culture medium was collected in sterile EP tubes and centrifuged at 2,500 rpm for 20 min. The resulting supernatant was transferred to a new sterile EP tube. Standard solutions were prepared by diluting 150 μL of standard dry powder to achieve concentrations of 480, 240, 120, 60, 30, and 0 ng/L. Subsequently, 50 μL of standard and cell culture solutions were added to the designated standard and sample wells, respectively, with each setup performed in triplicate. Following completion of the experiment, absorbance was measured at 450 nm using an enzyme-labeled instrument. The results were calculated using ELISAcalc.
-
EpiData (version 3.1) was used for demographic data, and verification. SPSS (version 22.0) was used for data organization and analysis. Genes meeting the screening criteria from the gene expression microarray results were subjected to Gene Ontology (GO) and Kyoto encyclopedia of Genes and Genomes (KEGG) enrichment analysis using the Metascape website (http://metascape.org/gp/index.html#/main/step1). Differentially expressed genes (DEGs) with the highest enrichment fractions were selected as candidate genes for this experiment.
A relative quantitative method was used for qRT-PCR analysis of candidate genes. The relative expression of candidate genes was represented as –ΔCT, where –ΔCT = (CT (target gene) – CT (GAPDH)) × (–1). The expression of candidate genes was further expressed as 2–ΔCT. SPSS (version 22.0) was used to analyze the expression levels of candidate genes in the exposure (high-concentration Hg) and control groups, and the relative expression levels were visualized using GraphPad Prism (version 6.0). GraphPad Prism was used for Spearman’s correlation analysis between urinary Hg values (log10 converted) and the relative expression of candidate genes.
-
Table 2 shows the test results for Hg vapor concentrations in the workplace. The Hg vapor concentration in the working environment exceeded 0.02 mg/m3 (PC-TWA) in seven job categories (sealed tube, fixed point, semicolon, assembly, sealing the head, inspection, and packaging).
Type of work Sources of occupational hazards Mode of operation Mercury vapor concentration in the workplace (mg/m3) Sealed tube Centrifuge Mechanization 0.032 Fixed point Floating mercury Artificialization 0.021 Semicolon Floating mercury Artificialization 0.021 Assembly Floating mercury Artificialization 0.030 Sealing the head Heading machine Mechanization 0.032 Inspection Floating mercury Artificialization 0.022 Packaging Floating mercury Artificialization 0.031 Table 2. Mercury vapor concentration range in an internal scale thermometer workshop
-
At the preliminary screening stage, there were no significant differences in sex, age, working years, alcohol consumption, or smoking between the two groups (P > 0.05). However, the mean urinary Hg levels were 1024.7 μg/g creatinine (Cr) in the exposed group and 55.7 μg/g Cr in the control group (P < 0.001, Table 3).
Variables High concentration mercury exposure group (n = 10) Control group (n = 10) P Gender (female%) 80 80 − Age (years) 41.90 ± 5.90 41.90 ± 6.54 0.871 Working-age (years) 19.10 ± 8.19 18.40 ± 8.83 0.954 Drinking (yes/no) 0/10 0/10 − Smoking (yes/no) 0/10 0/10 − Urine mercury (μg/g Cr) 1024.7
(477.03–2060.15)55.7
(47.98–73.48)< 0.001 Note. The age and working years in the table are expressed as mean ± SE, and the urine mercury value is expressed as the median (upper and lower quartile). The difference was statistically significant (P < 0.05). Table 3. Demographic characteristics of the subjects in the initial screening stage
-
The results of the gene expression chip showed that there were 269 DEGs in the exposure group compared to the control group. Among them, 203 genes were upregulated, and 66 genes were downregulated (Figure 1B).
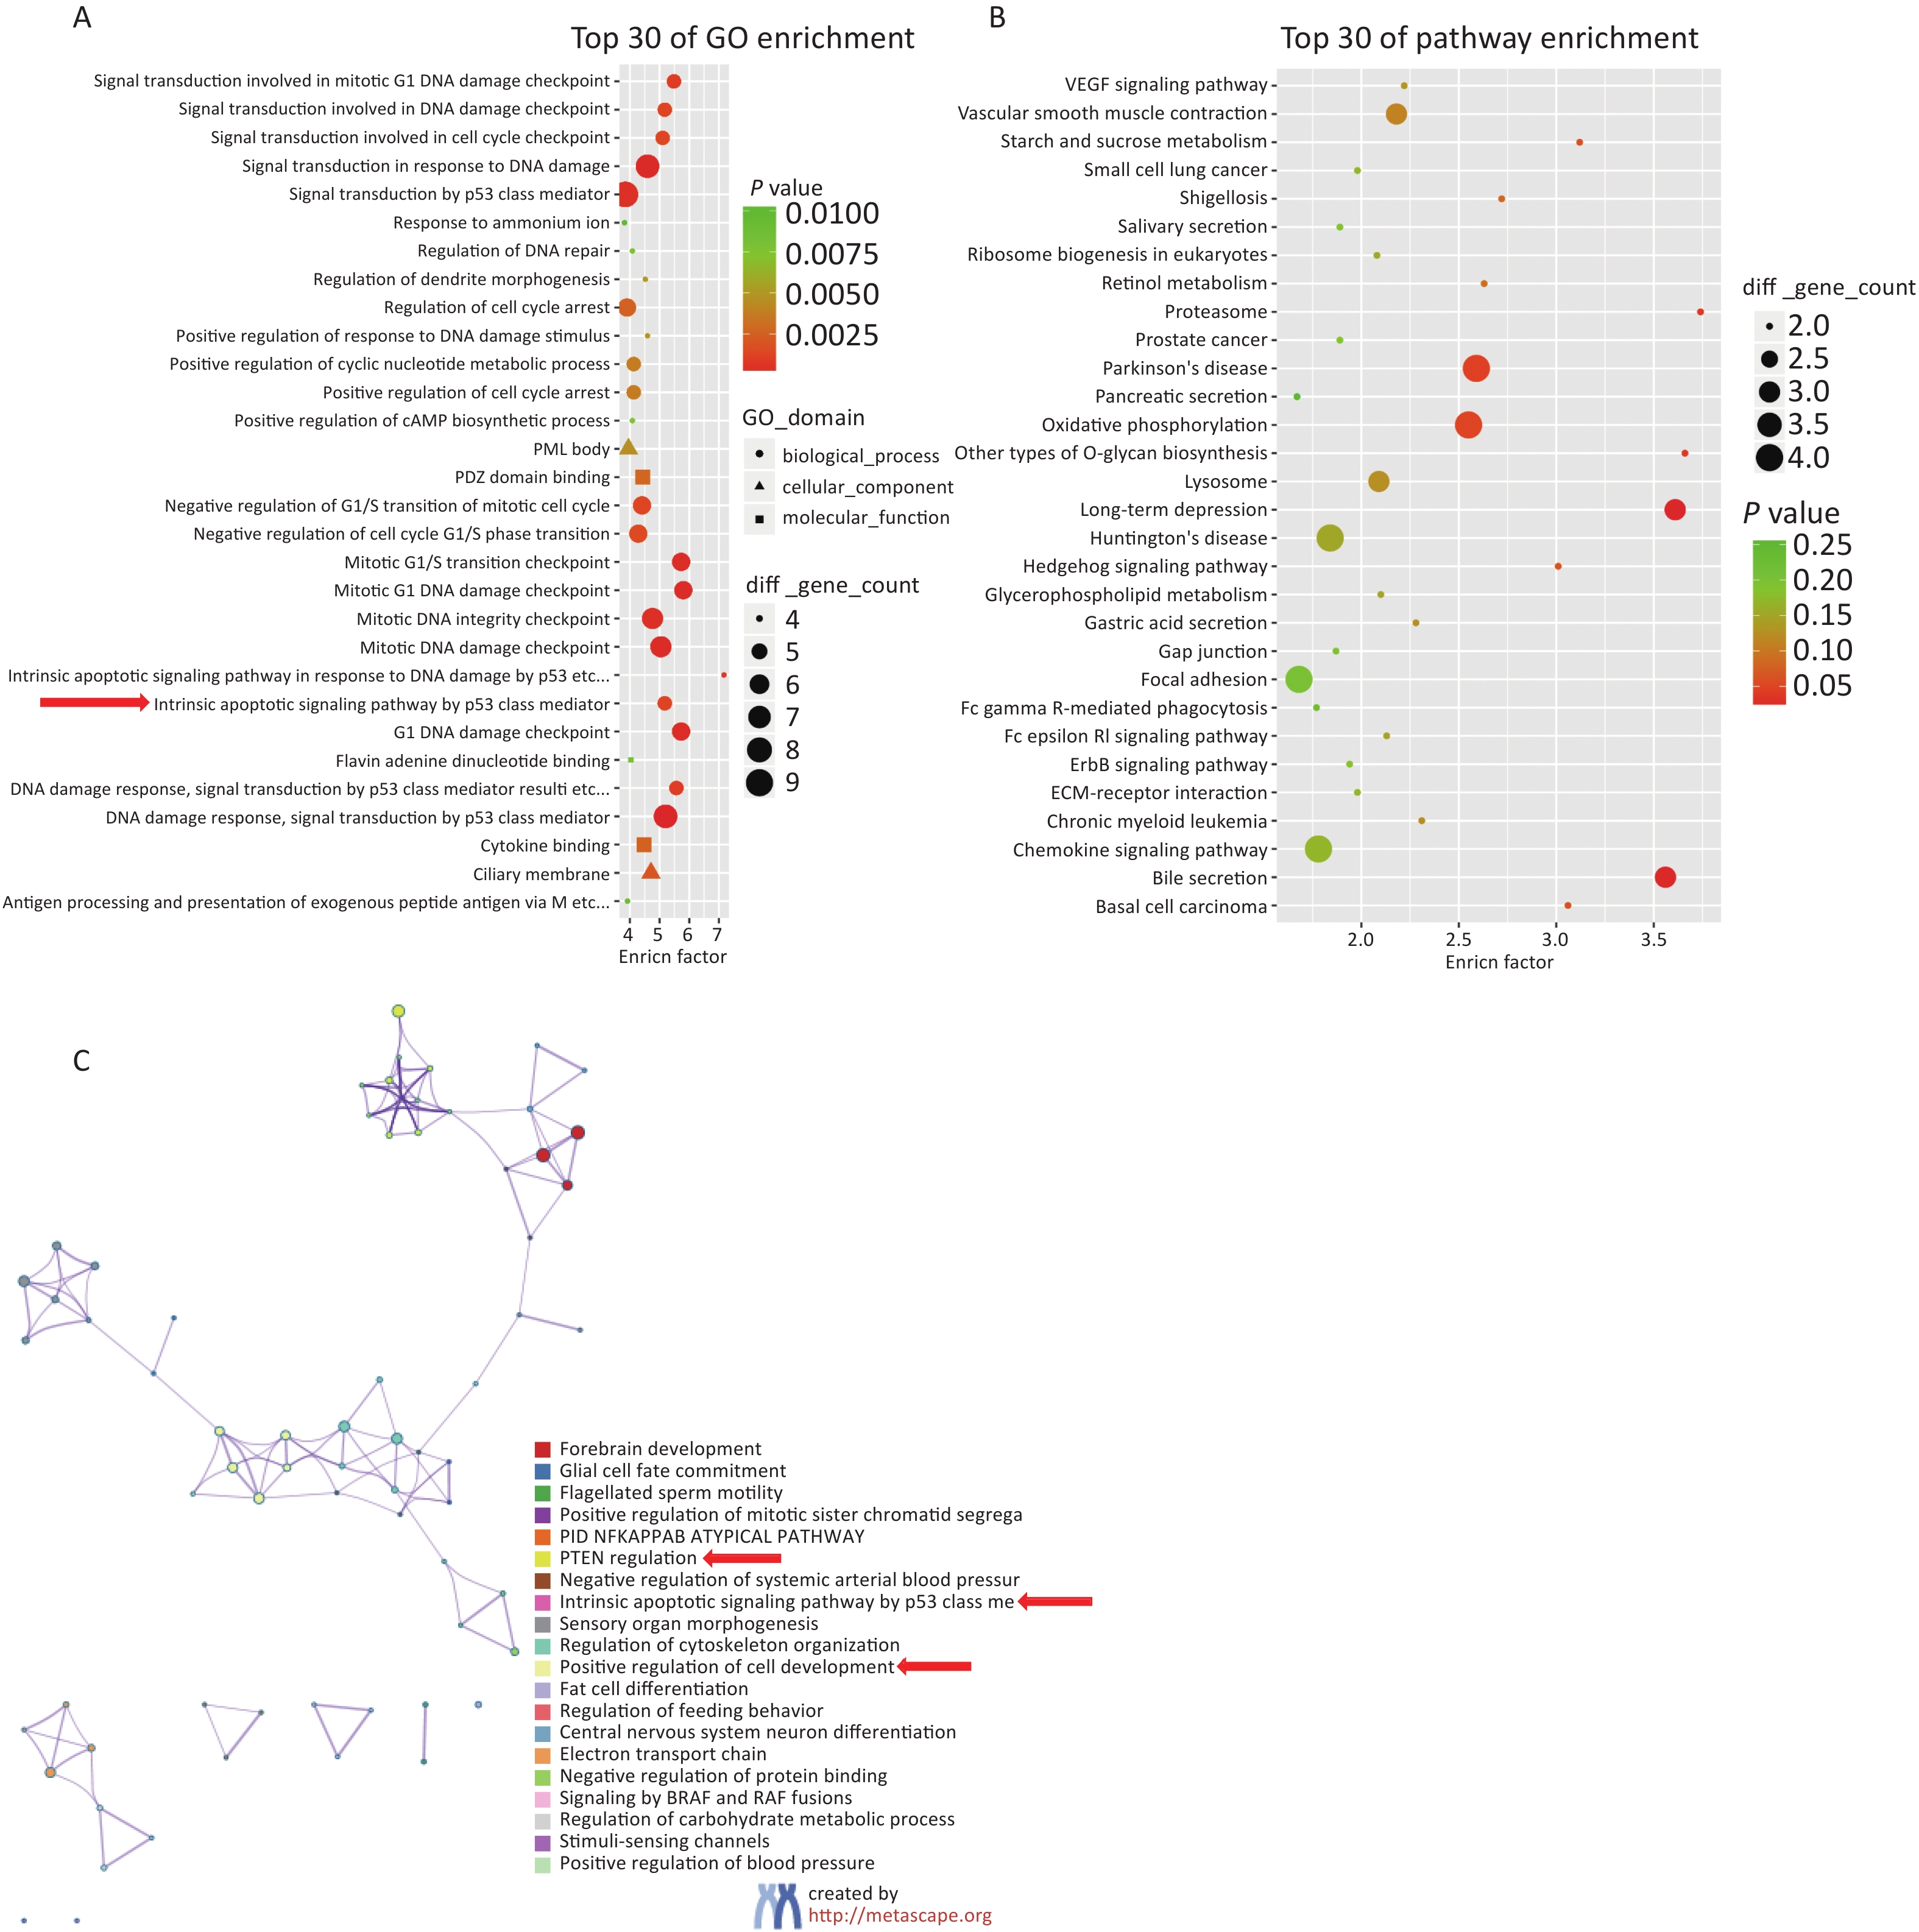
Based on the screening criteria [a gene expression FPKM value in the Hg exposure or control group (FC) ≥ 2 or (FC) ≤ 0.5], the DEGs were subjected to GO and KEGG bioinformatic enrichment analysis. Figure 2A shows the top 30 biological functions with the highest scores in the GO enrichment analysis. Figure 2B shows the top 30 regulatory pathways with the highest scores in the KEGG enrichment analysis. Figure 2C shows the relationships between the enriched items in the form of a network diagram.
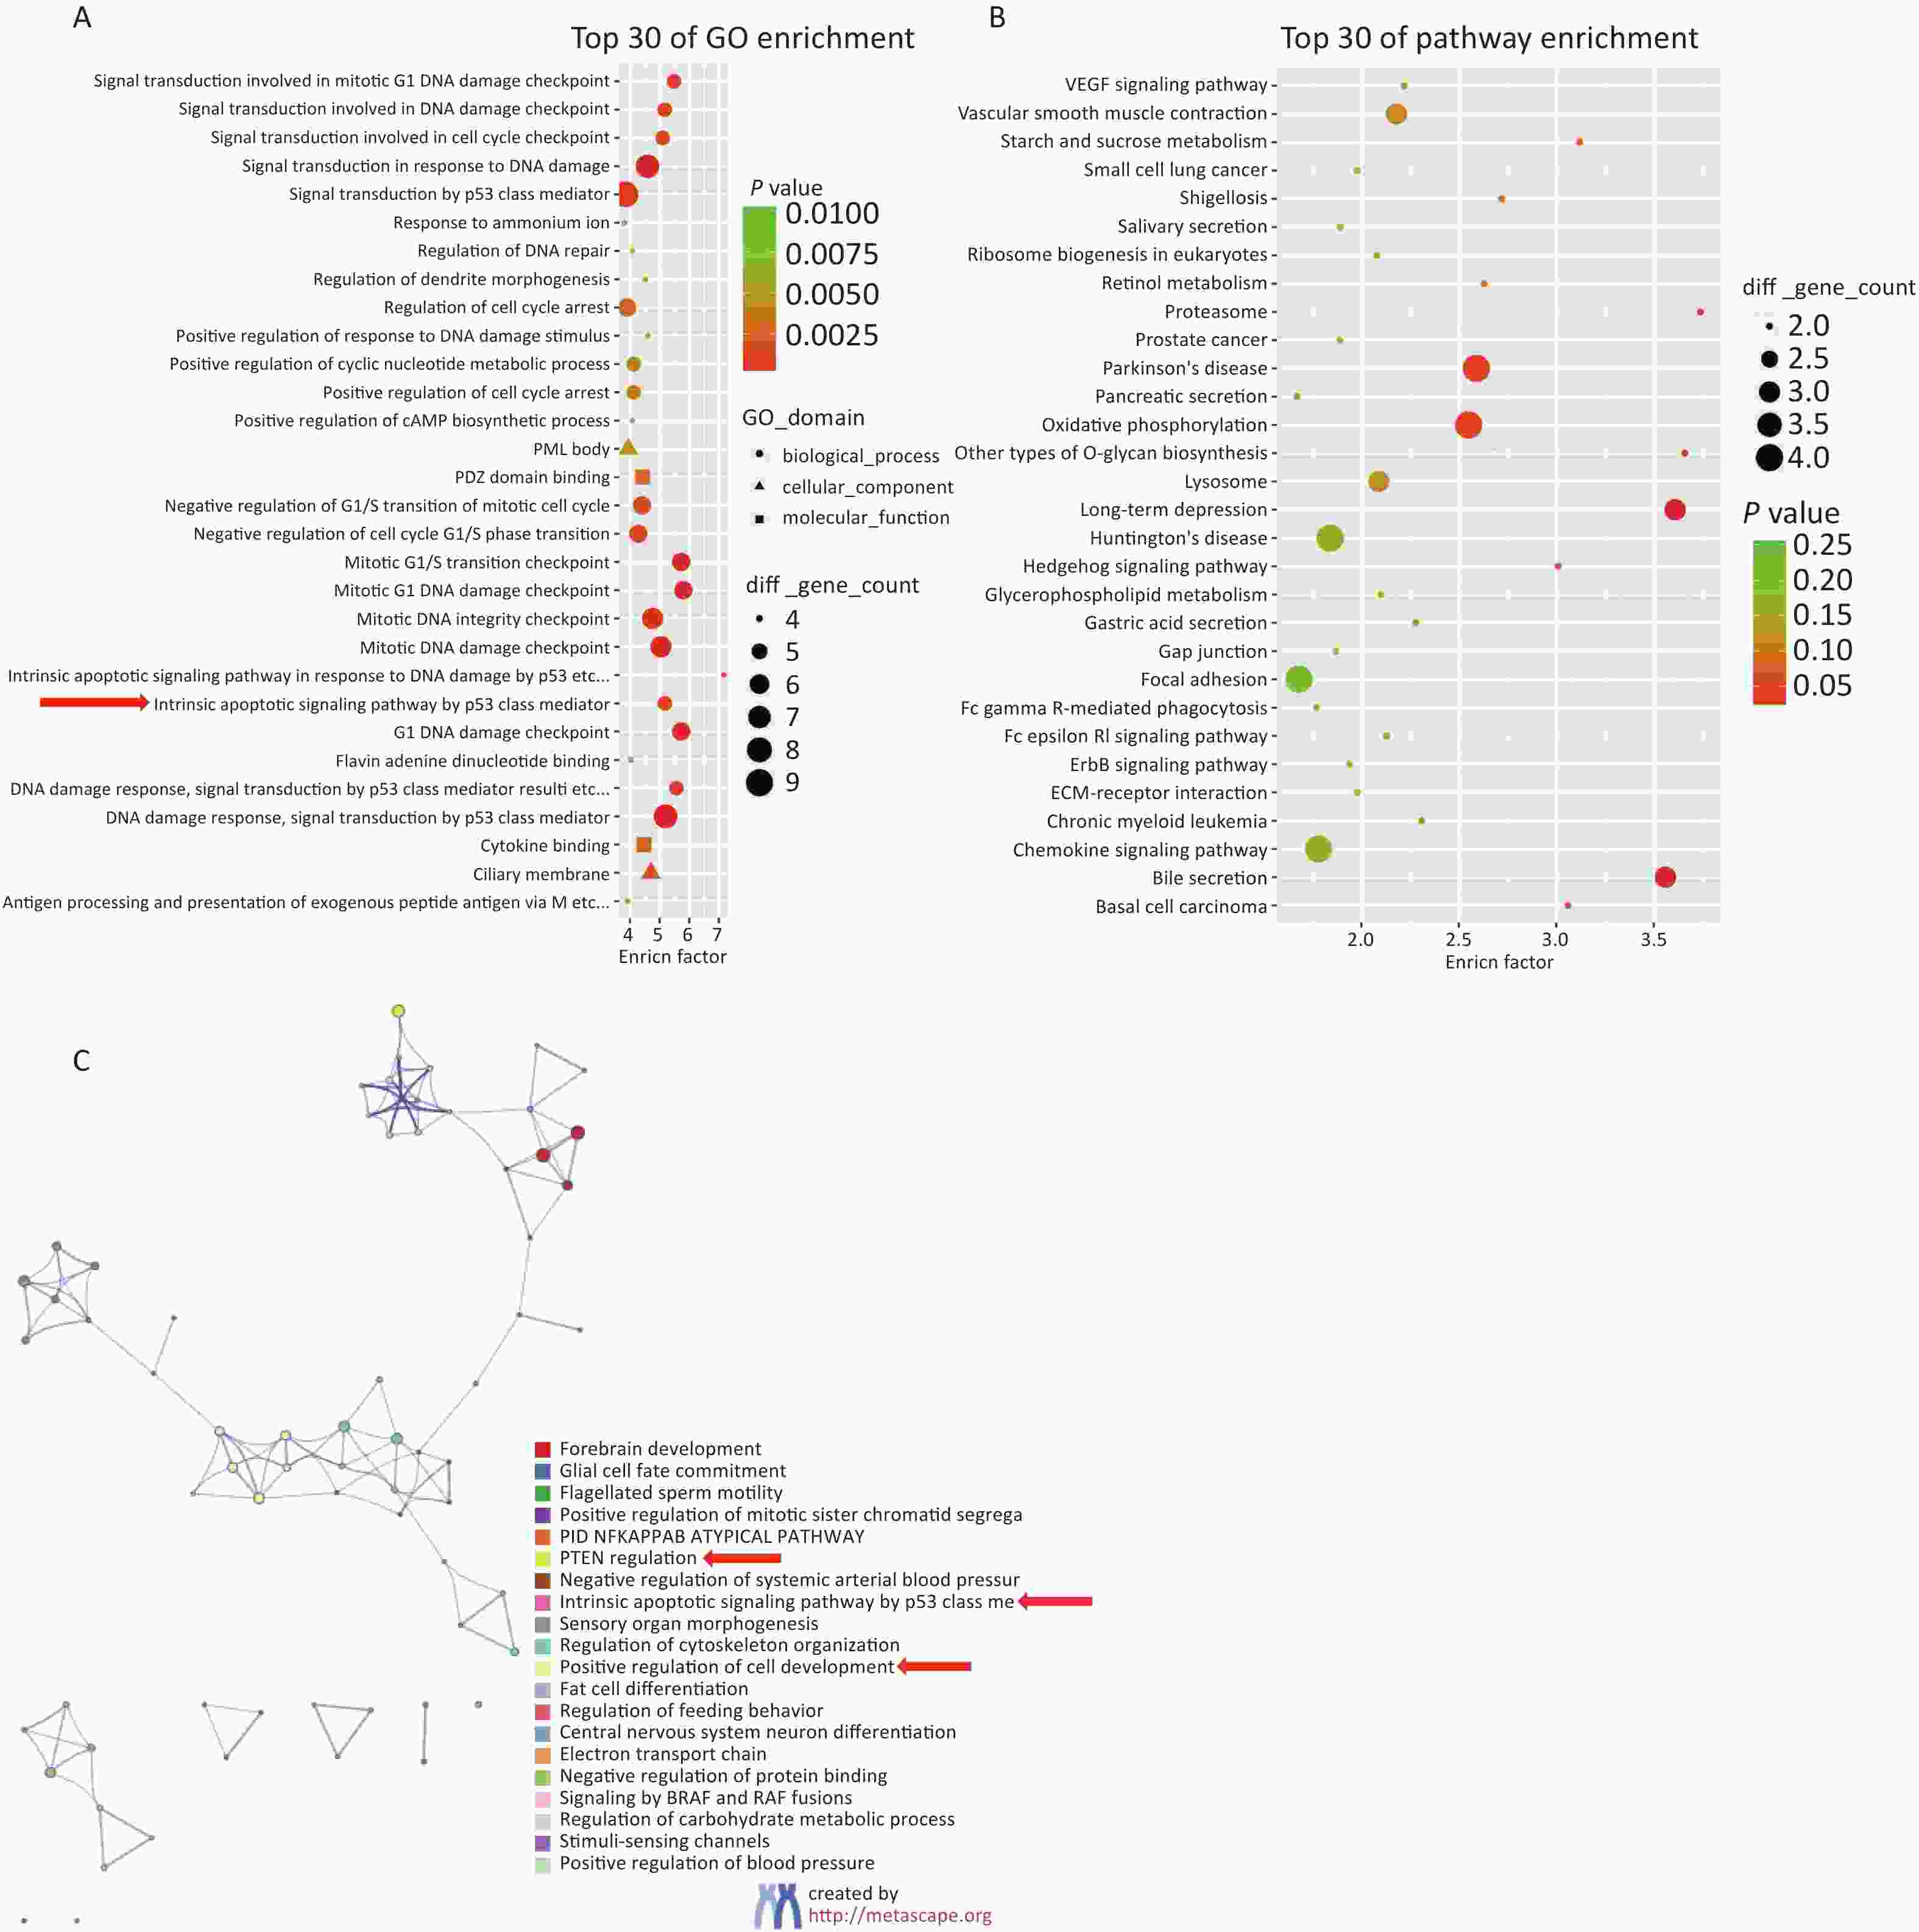
Figure 2. Results of bioinformatics enrichment analysis gene expression was upregulated with a fold change ≥ 2, or gene expression was downregulated with a fold change ≤ 0.5 in high-concentration Hg exposure group). (A) Enrichment analysis of Gene Ontology (GO) biological regulation pathway. (B) Enrichment analysis of Kyoto encyclopedia of Genes and Genomes (KEGG) biological regulation pathway. (C) Network diagram of cluster analysis of enriched items.
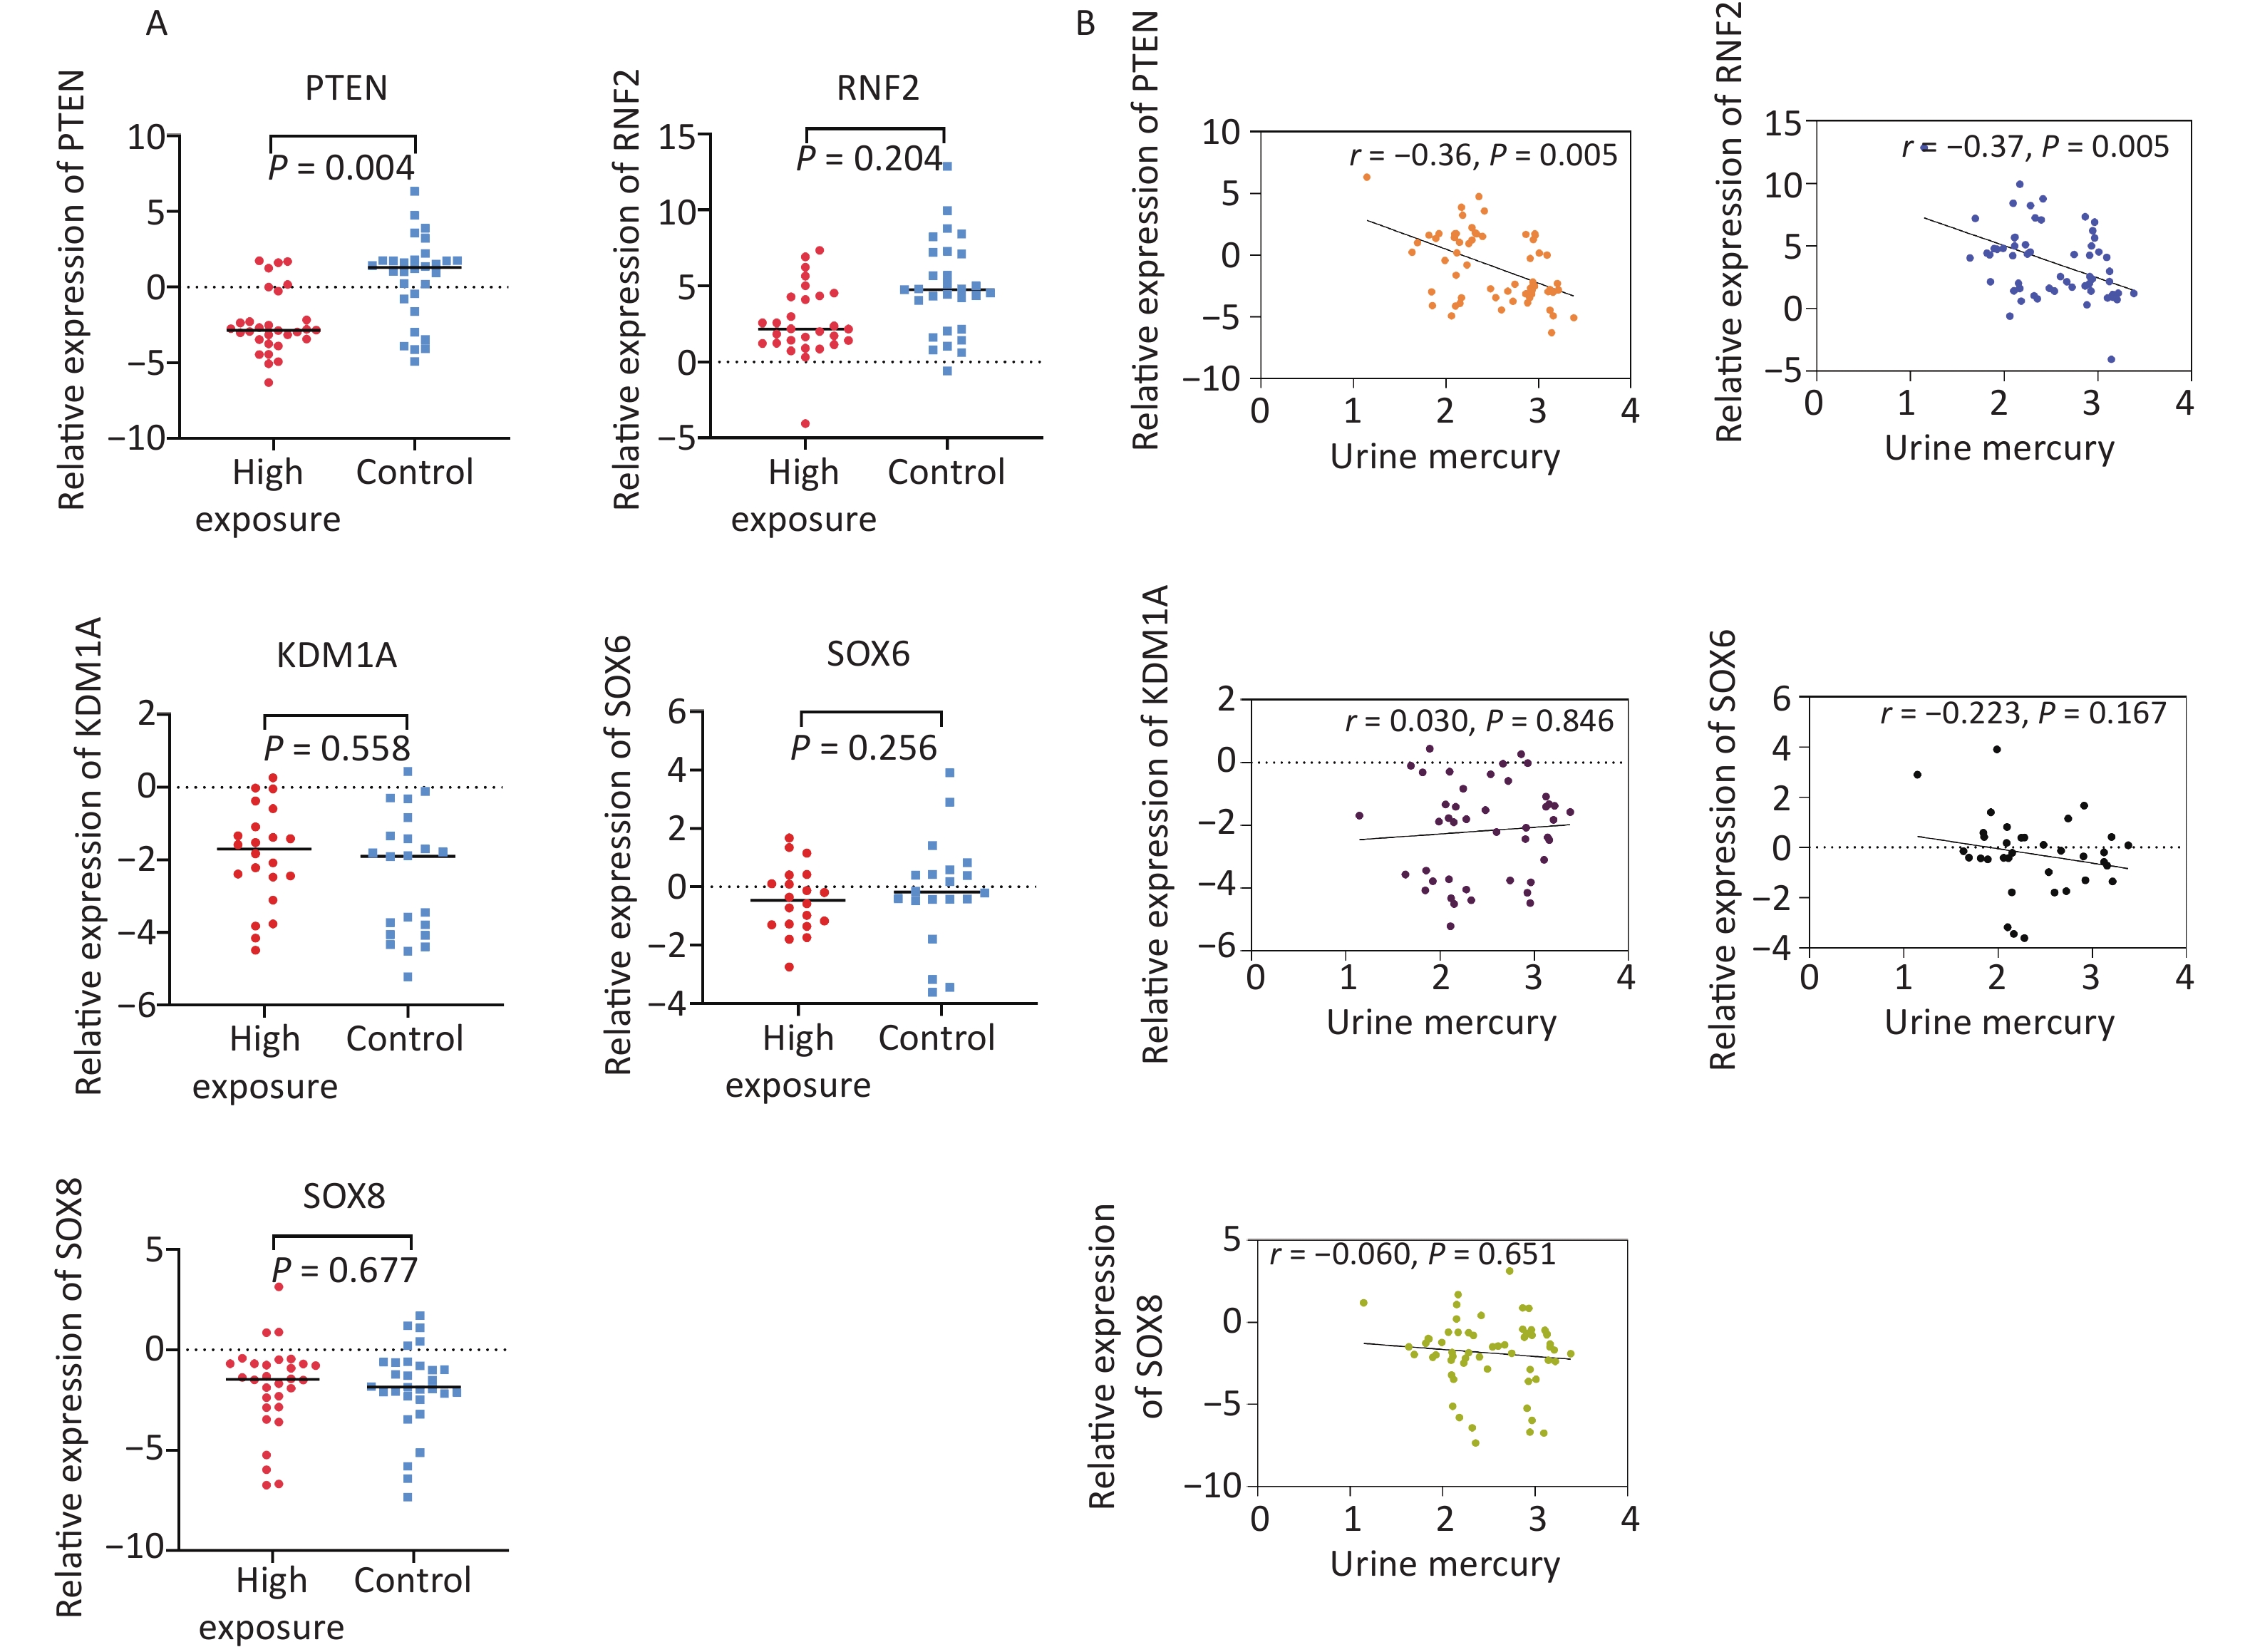
Building on these results, the following candidate genes were selected for further population expansion and verification: 1. PTEN and ring finger protein 2 (RNF2) are involved in the PTEN and PIP3/AKT pathways; 2. SOX6 is associated with the WNT and PTEN pathways; 3. Lysine demethylase 1A (KDM1A) is linked to the PTEN pathway and P53 mediated intrinsic apoptosis signaling pathways; 4. SOX8 plays a role in the regulation of cell development and differentiation. These five genes were selected for population-based validation and verification (Supplementary Table S1, available in www.besjournal.com).
Input ID Gene ID Tax ID Homologene gene ID Homologene gene tax ID Gene symbol Description RNF2 6045 H. sapiens 6045 H. sapiens RNF2 ring finger protein 2 SOX6 55553 H. sapiens 55553 H. sapiens SOX6 SRY-box 6 KDM1A 23028 H. sapiens 23028 H. sapiens KDM1A lysine demethylase 1A SOX8 30812 H. sapiens 30812 H. sapiens SOX8 SRY-box 8 Note. RNF2, ring finger protein 2; SOX6, SRY-box transcription factor 6; KDM1A, Lysine demethylase 1A; SOX8, SRY-box transcription factor 8. Table S1. Related information of differentially expressed genes
-
The five candidate genes were verified in an expanded population study. There were no significant differences in sex, age, working years, alcohol consumption, and smoking between the two groups (P > 0.05). However, the mean urinary Hg levels were 988.50 μg/g creatinine (Cr) in the high-Hg-exposure group and 135.63 μg/g Cr in the control group. The urinary Hg level in the exposure group was 7.29 times that in the control group, and this difference was statistically significant (P < 0.001; Table 4).
Variables High concentration mercury exposure group (n = 30) Control group (n = 30) P Gender (female%) 86.7 86.7 − Age (years) 40.63 ± 7.65 40.40 ± 7.58 0.893 Working-age (years) 11.73 ± 9.09 11.67 ± 8.70 0.881 Drinking (yes/no) 2/28 2/28 − Smoking (yes/no) 2/28 2/28 − Urine mercury (μg/g Cr) 988.50 (817.49–1159.51) 135.63 (112.62–148.65) < 0.001 Note. The age and working years in the table are expressed as mean ± SE, and the urine mercury value is expressed as the median (upper and lower quartile). The difference was statistically significant (P < 0.05). Table 4. Demographic data of subjects in the extended validation phase
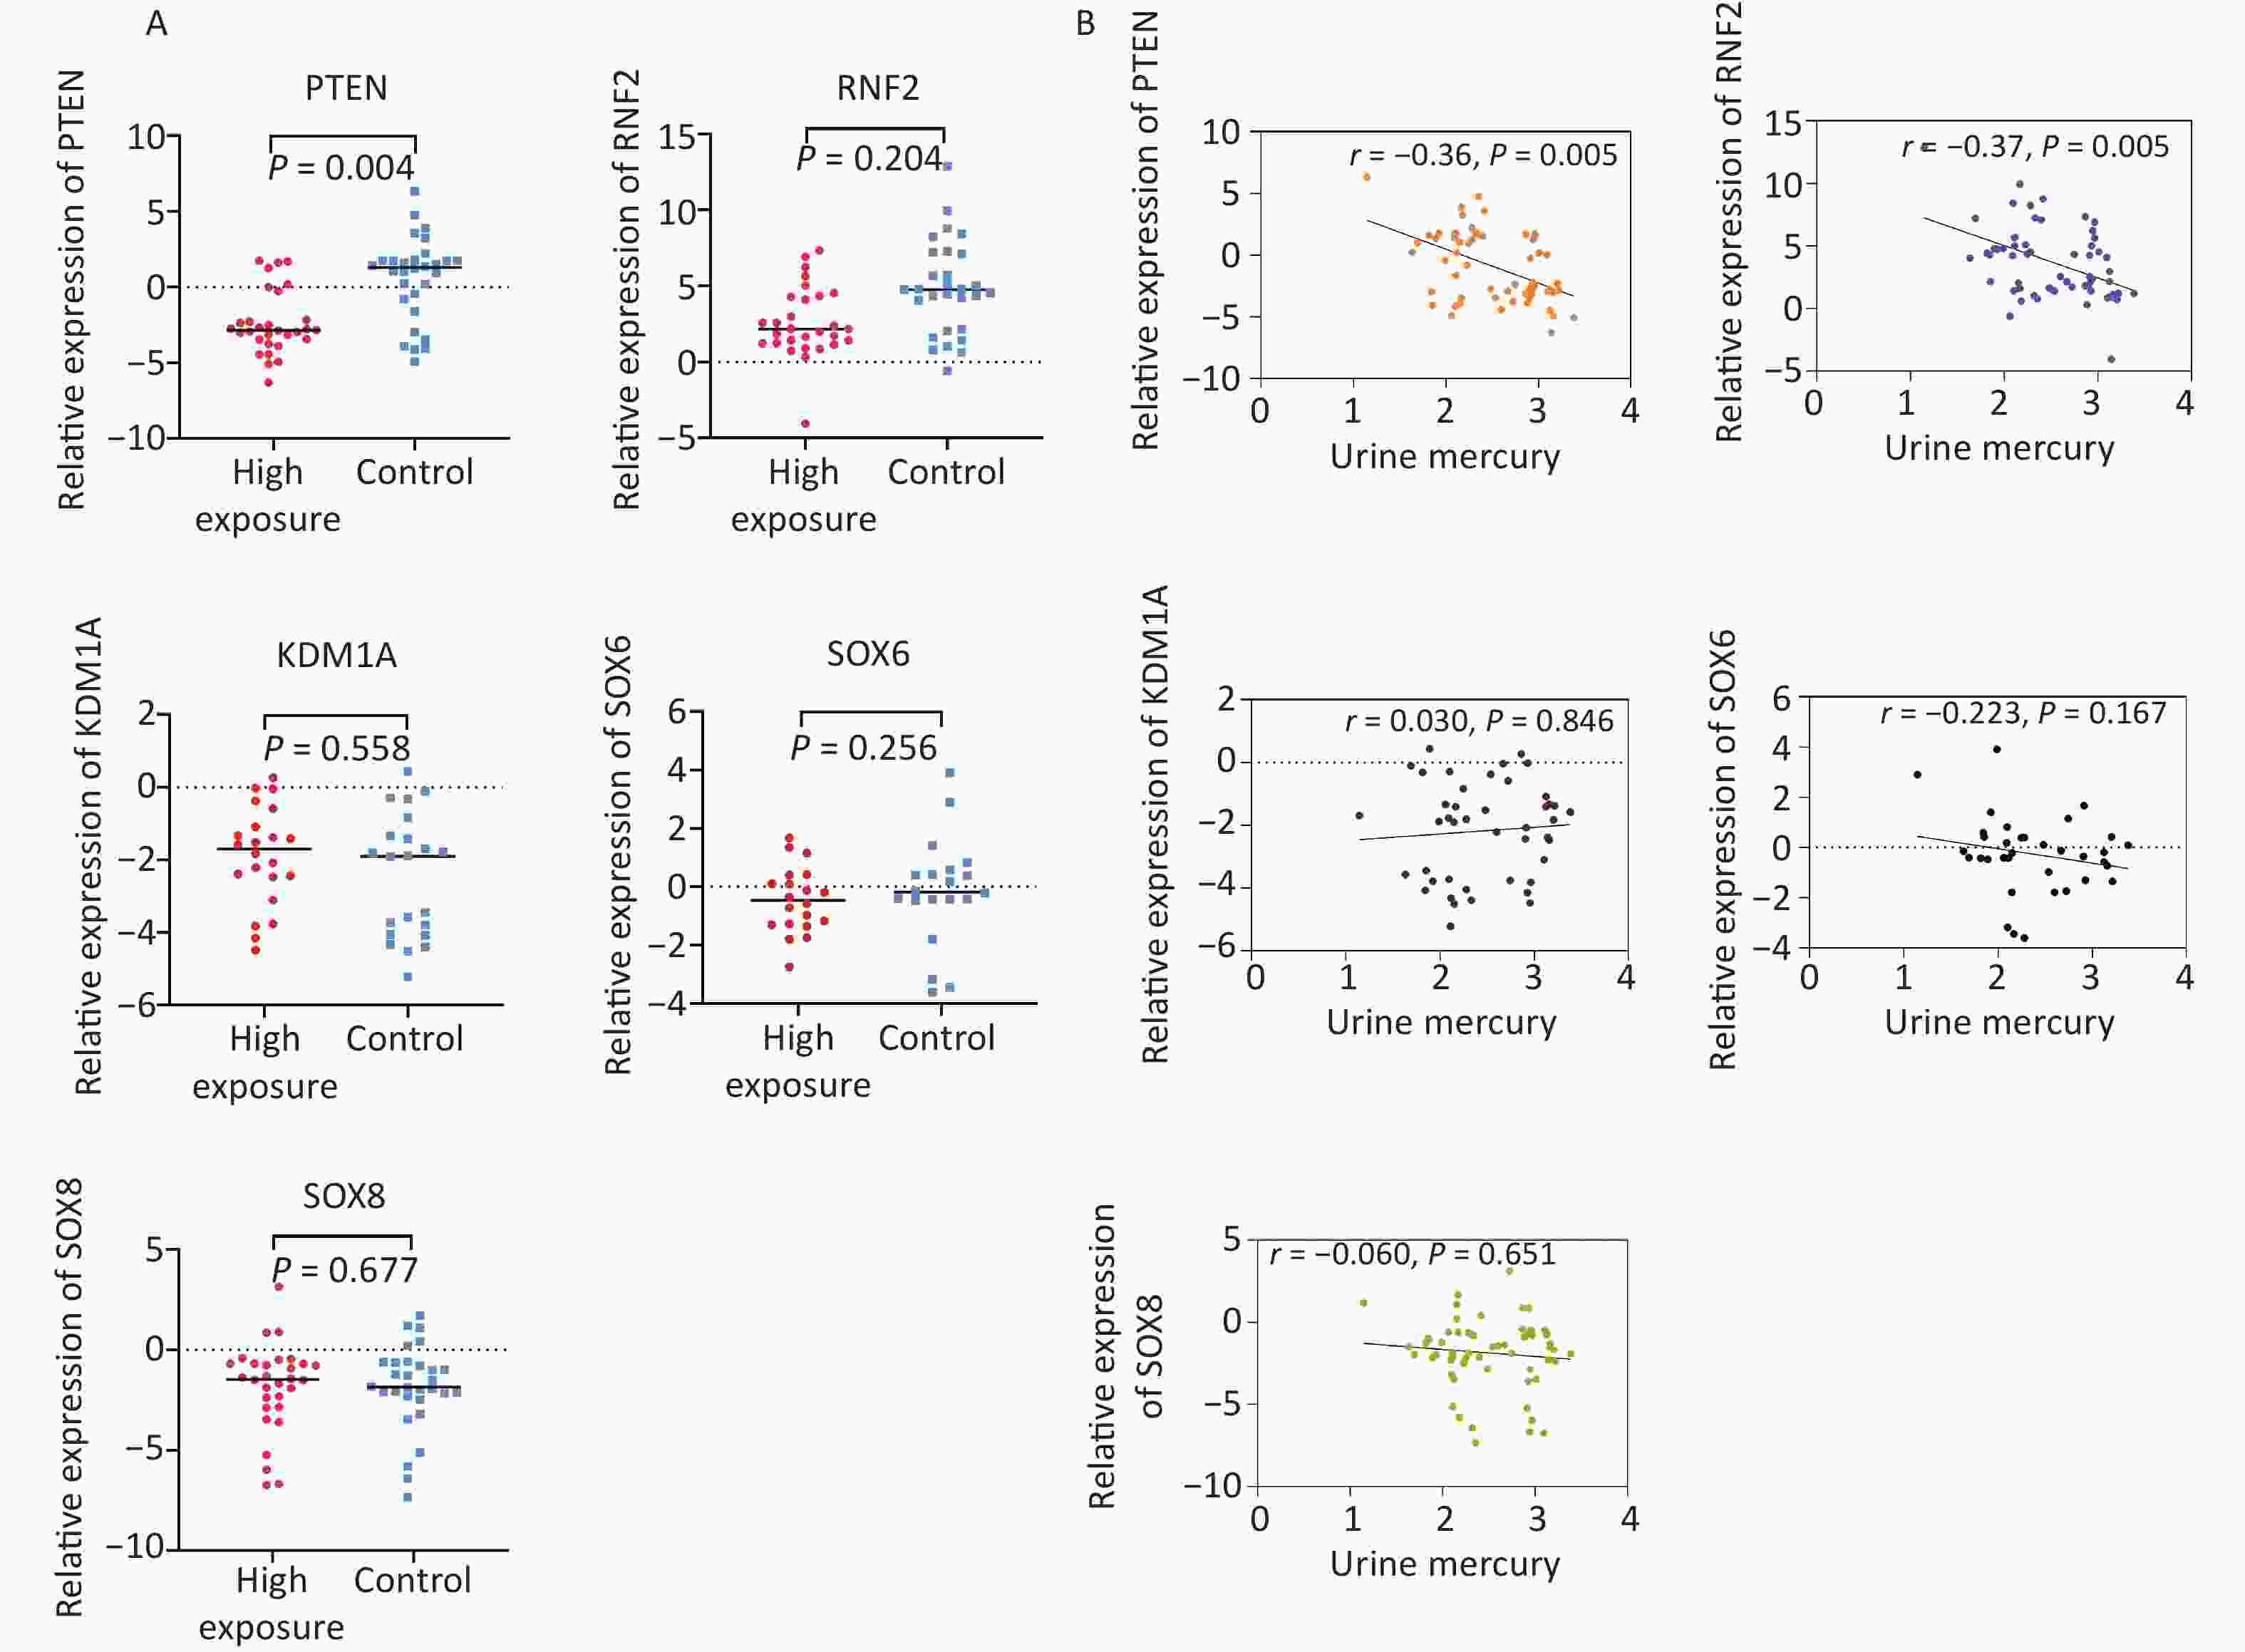
Figure 3A shows the qRT-PCR results for candidate genes in the expanded validation experiment. In comparison to the control group, the expression of PTEN was downregulated in the high-concentration Hg exposure group, with an expression level 0.22 times that of the control group. This difference was statistically significant (P < 0.05). Correlation analysis revealed a negative correlation between the relative expression of PTEN (r = –0.36, P = 0.005) and RNF2 (r = –0.37, P = 0.005) and urine Hg levels, as shown in Figure 3B.
-
The survival rate of 293T cells was observed at concentrations of 0, 5, 10, 20, 30, 40, 50, and 100 μmol/L HgCl2, as shown in Figure 4. Subsequent experiments were performed using drug concentrations that resulted in approximately 80% cell survival, which were determined to be 0, 10, and 25 μmol/L.
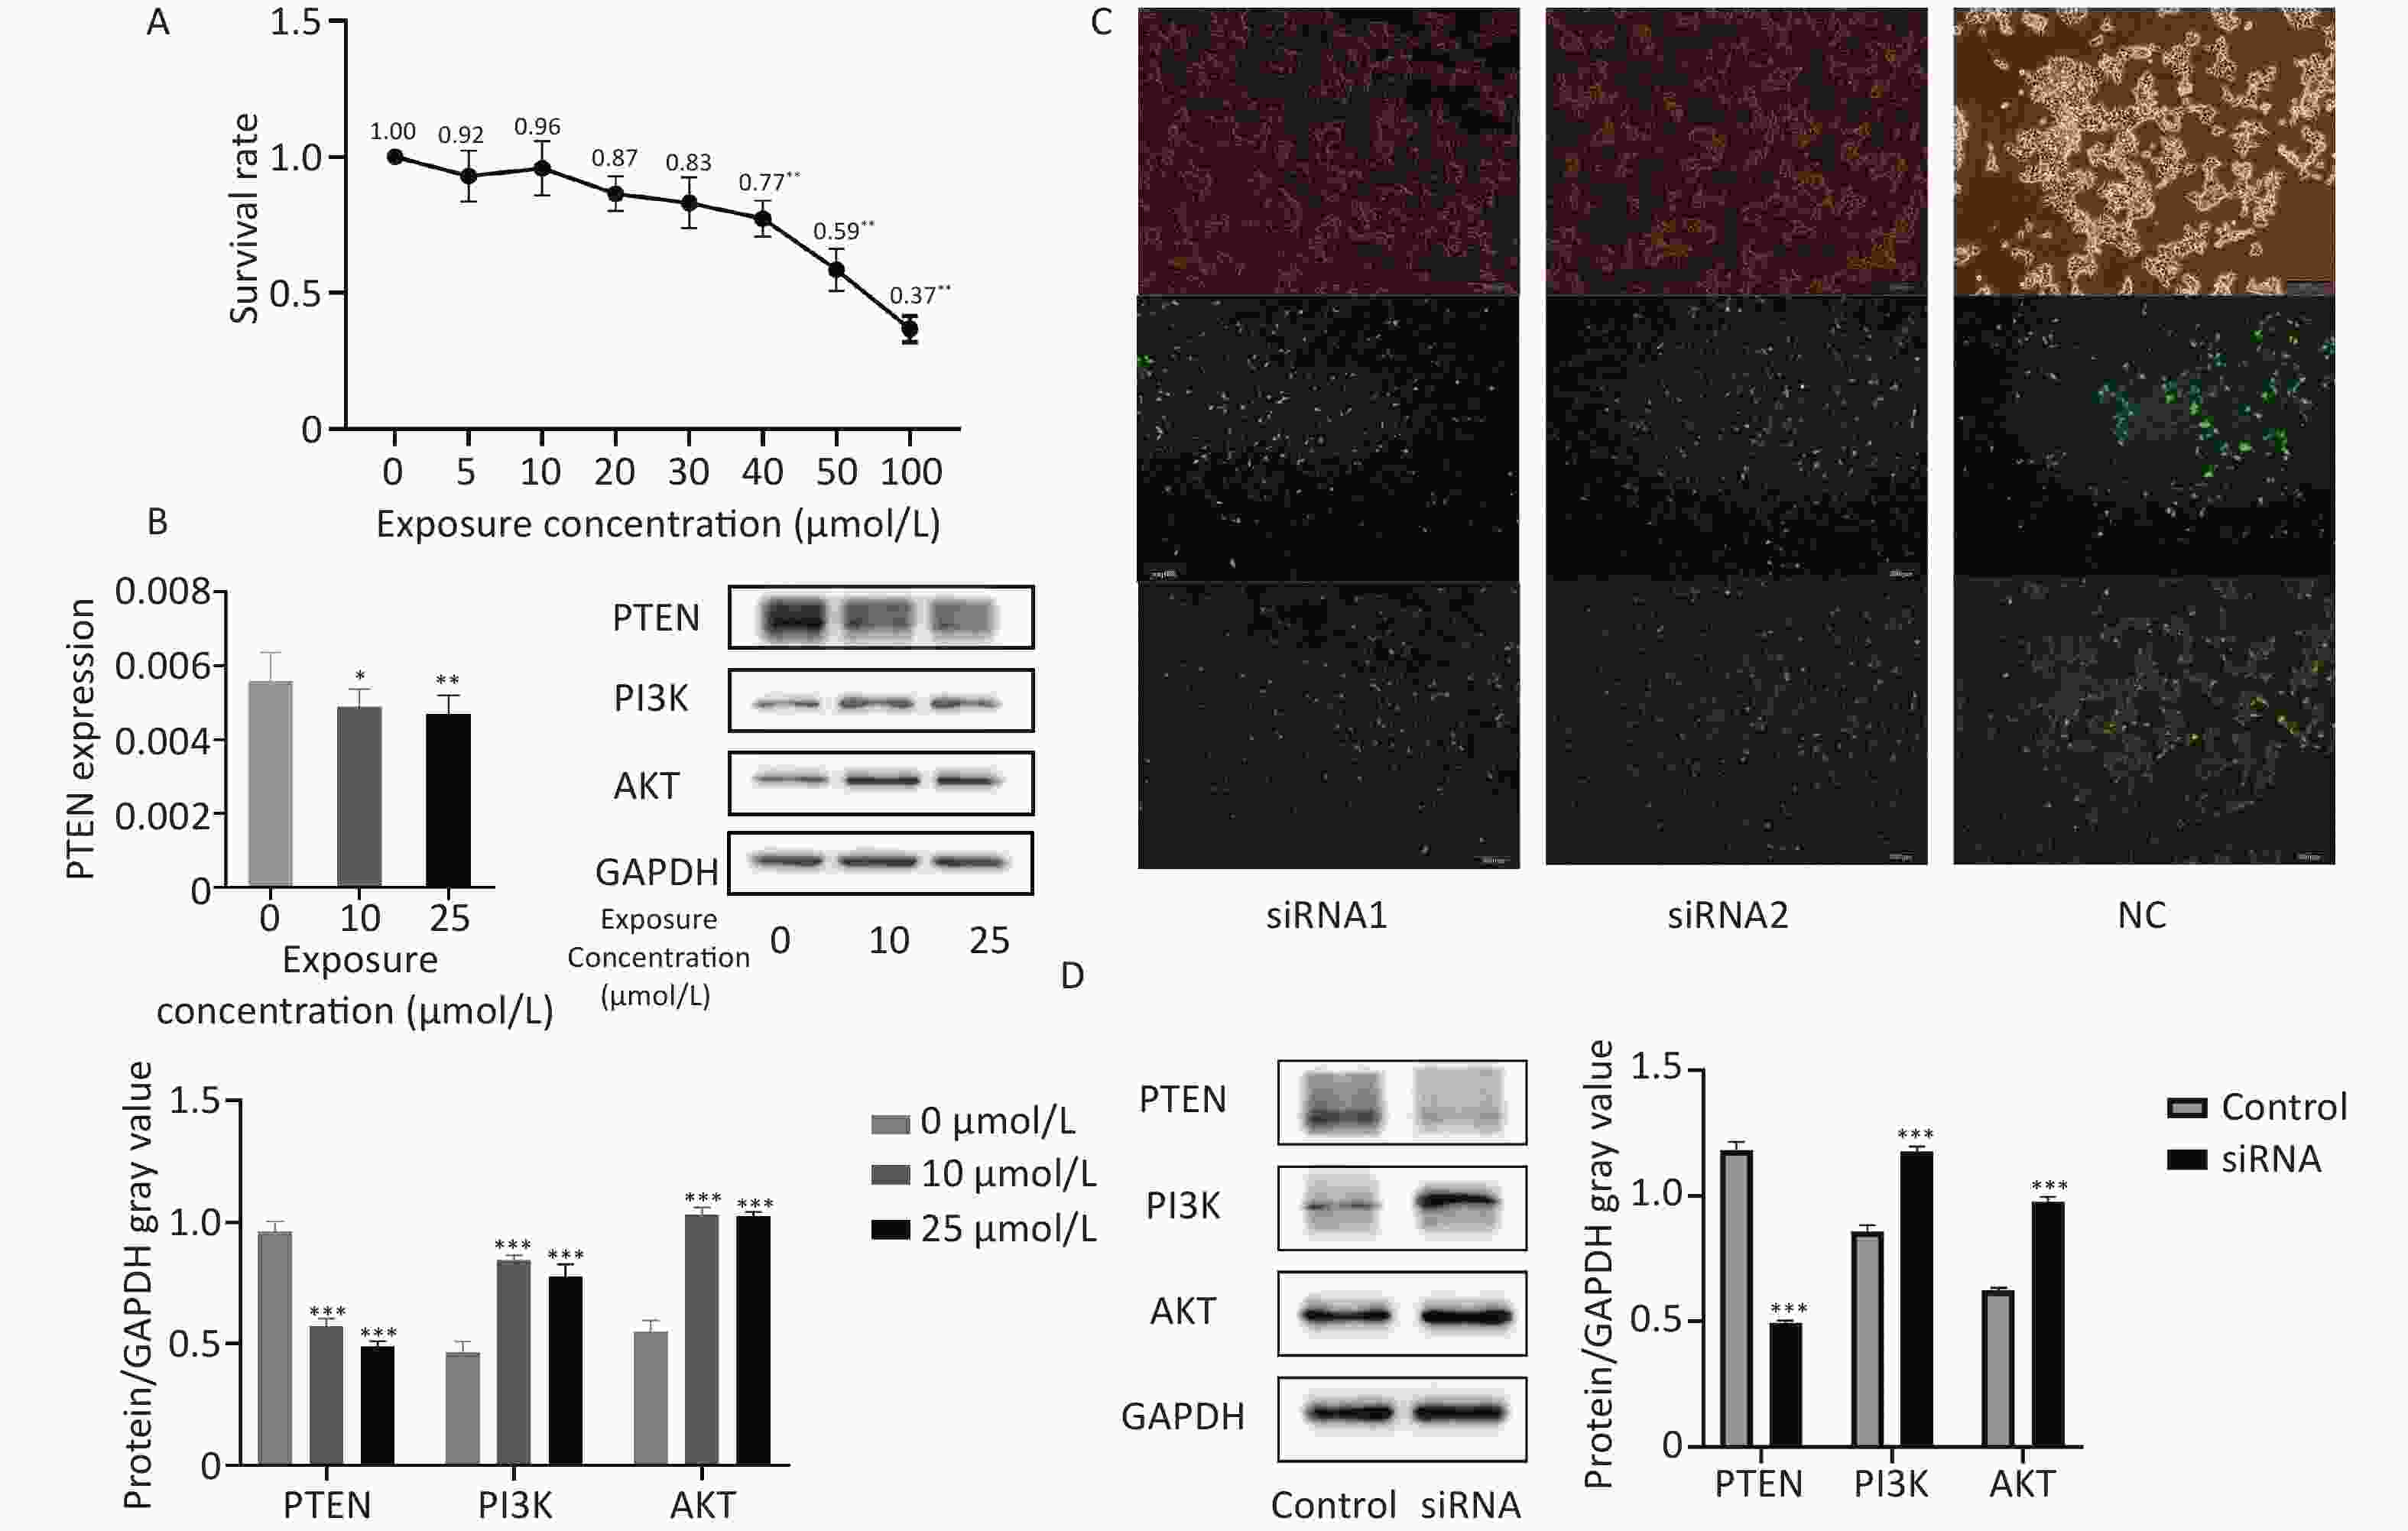
Figure 4. In vitro Hg exposure test results. (A) CCK-8 kit was used to determine the survival rate of 293T cells exposed to different concentrations of Hg. (B) Expression levels of PTEN gene and the PTEN, PI3K, AKT proteins in 293T cells exposed to Hg. (C) Transfection of fluorescent modified siRNA into 293T cells. (D) Expression of PTEN, PI3K and AKT in 293T cells after PTEN gene silencing. *, P < 0.05; **, P < 0.01; ***, P < 0.001.
Compared to the control group, exposure to HgCl2 (25 μmol/L and 10 μmol/L) led to a significant decrease in the expression of PTEN protein and a significant increase in the expression of PI3K and AKT proteins in 293T cells (P < 0.001).
Figure 4C shows the transfection efficiency of the cells, with transfection rates of 88.82, 76.19, and 80.76% for the siRNA1, siRNA2, and NC groups, respectively. After transfection, the expression level of PTEN significantly decreased, whereas the expression levels of PI3K and AKT significantly increased (P < 0.001).
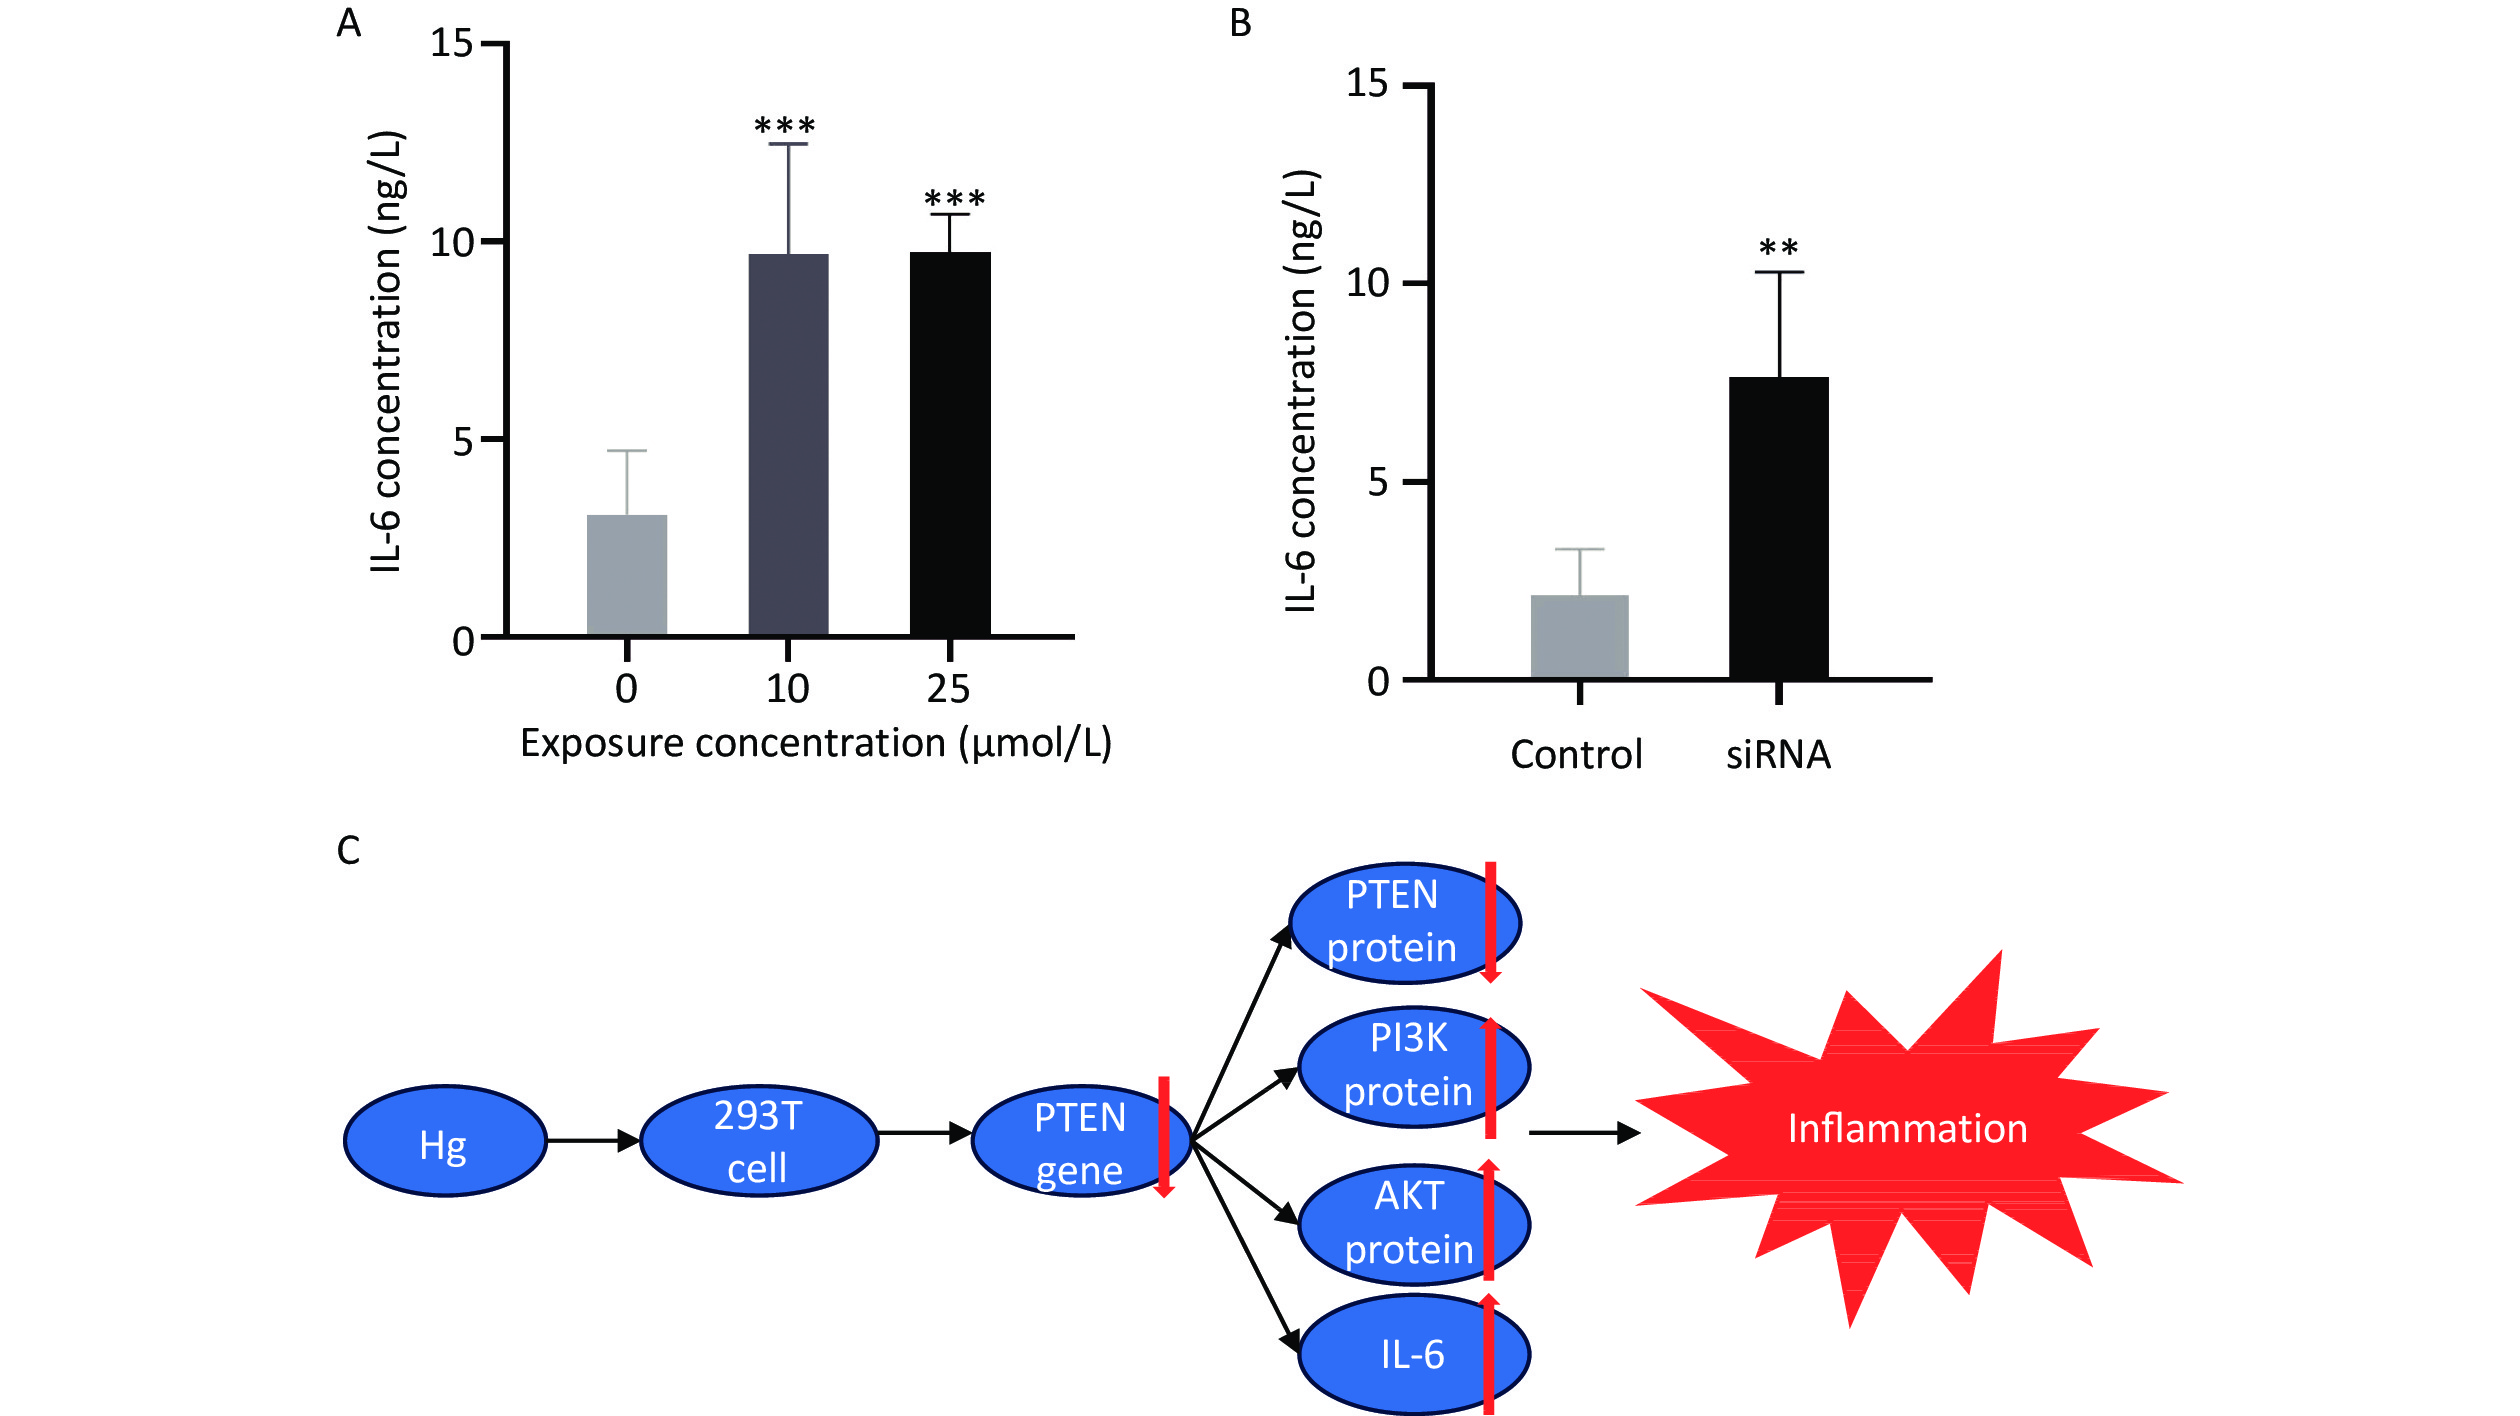
In comparison to the control group, exposure to 25 and 10 μmol/L HgCl2 significantly increased the expression of IL-6 by 3.16 and 3.14 times that of the control group, respectively. After transfection, the expression level of IL-6 increased significantly to 3.56 times that of the control group (P < 0.001; Figure 5).
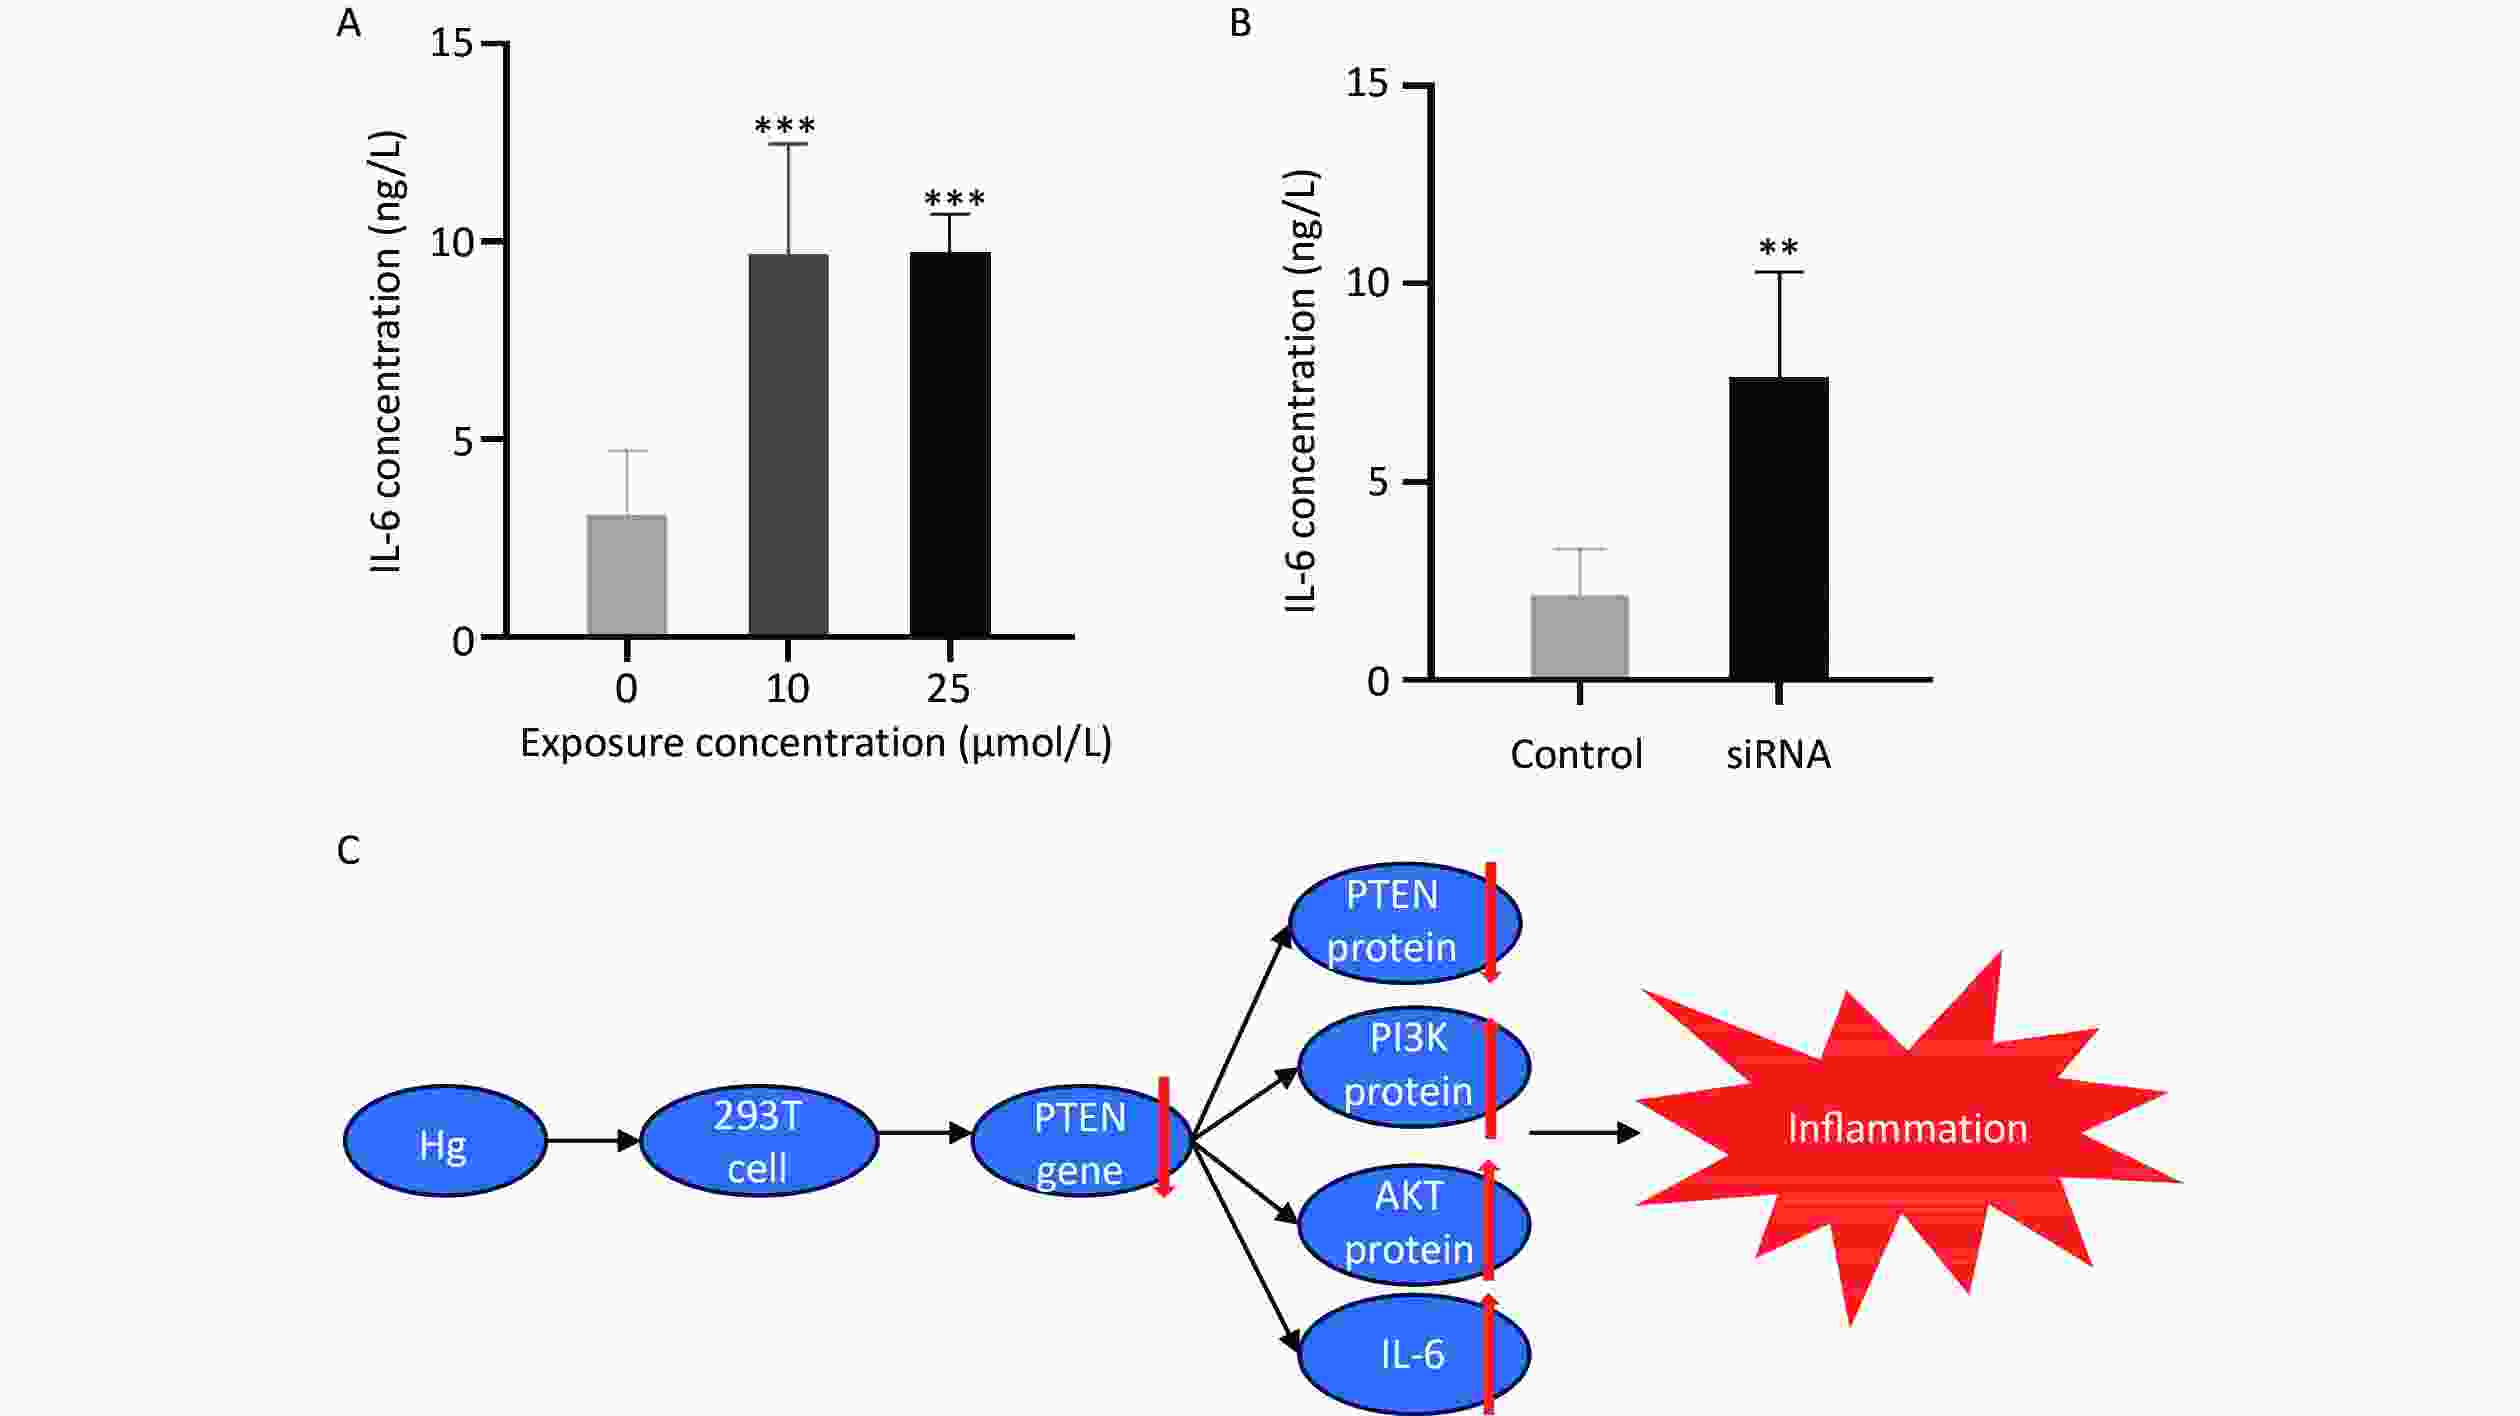
Figure 5. The expression levels of IL-6 and schematic diagram of the biological mechanism. (A) Expression of IL-6 in 293T cells cultured with Hg. (B) Expression levels of IL-6 in 293T cell culture medium after PTEN gene silencing. (C) Schematic diagram of biological mechanism. **, P < 0.01; ***, P < 0.001.
-
This study is the first to use gene expression chip technology and population expansion experiments to identify and validate the differential gene PTEN associated with Hg exposure in an occupational population. Furthermore, we investigated the functional mechanism of PTEN by establishing a cellular model of Hg exposure with reduced PTEN expression.
In this population study, 269 DEGs were selected using gene expression chip experiments. Bioinformatics enrichment analysis of these differentially expressed genes revealed their involvement in various checkpoints related to mitosis, including transition, damage, and integrity checkpoints. These biological functions primarily regulate cell growth and survival signaling pathways. Additionally, these DEGs were associated with the regulation of several signaling pathways, such as the VEGF and chemokine signaling pathways. The VEGF signaling pathway is known for its role in angiogenesis regulation[33], and IL-6 is one of the chemokines.
Subsequently, we established cell models of Hg exposure and low PTEN expression, based on findings from population studies, to delve into the functional mechanism of PTEN. Mercury is a nephrotoxic metal that tends to accumulate in the kidneys, potentially leading to reduced glomerular filtration rates and pathological changes[34-36]. Human embryonic kidney cells HEK-293T were chosen for this experiment because of their ease of cultivation and high transfection efficiency. The results obtained from Hg-exposed cells indicated a decrease in both PTEN gene and protein expression in 293T cells treated with HgCl2, which is consistent with findings from previous human studies. Moreover, compared with the control group, the protein expression levels of AKT, PI3K, and IL-6 were significantly elevated in Hg-exposed 293T cells. Following PTEN knockdown in 293T cells transfected with siRNA, the expression levels of AKT, PI3K, and IL-6 increased. These observations suggest that Hg exposure induces inflammatory damage via the PTEN/PI3K/AKT pathways.
PTEN was originally identified as a tumor suppressor gene with multifaceted functions. It can trigger apoptosis, suppress the cell cycle, deter the invasion of tumor cells, and inhibit the formation of new blood vessels in tumors through its lipid and protein phosphatase activities. In addition to its role in cancer, PTEN has been also implicated in other diseases. Altered expression or activity of PTEN has been linked to conditions such as obesity, insulin resistance, diabetes, hepatitis B and C viral infections, and alcoholism[37-42]. PTEN serves as a negative regulator of AKT signaling pathway. Elevated PTEN expression can lead to a reduced in AKT phosphorylation[43]. Furthermore, reduced PTEN expression has been documented in various kidney conditions, including ischemic kidney injury, aristolochic acid nephropathy, and unilateral ureteral occlusion[44,45]. Research has demonstrated that PTEN can mitigate apoptosis by modulating the PI3K/Akt/HIF1-α and PI3K/AKT/mTOR signaling pathways. These actions contribute to the establishment of a renoprotective mechanism[46]. Studies have indicated that a deficiency in PTEN results in phosphatidylinositol-3,4,5-triphosphate (PIP3) accumulation, which activates AKT[47]. Furthermore, PTEN negatively regulates Class I PI3K signaling by dephosphorylating phosphoric acid at the d3 site of the PIP3 inositol ring. Consequently, a deficiency in PTEN leads to increased PI3K expression[48-50]. The PI3K/AKT signaling pathway plays a crucial role in regulating apoptosis.
IL-6 is a multifunctional pleiotropic cytokine that plays a crucial role in the host defense[51]. Zuojin Pill has been shown to significantly increase PTEN expression while inhibiting the PI3K/AKT signaling pathway and IL-6 expression[52]. Zhou et al. discovered that inhibiting PTEN expression enhanced the inflammatory response in the kidneys of IR mice, leading to an increased expression of IL-6 and other inflammatory factors, ultimately accelerating kidney fibrosis[53]. Liu et al. found that inhibiting PTEN, a target of miR-301a, increased the expression of IL-6[54]. These findings are consistent with those of our study, suggesting a relationship between PTEN and the expression of inflammatory factors.
In summary, this study revealed that Hg exposure downregulates the expression of PTEN, which in turn increases the expression of AKT and PI3K. Disruption of protective mechanisms of the kidney’s leads to kidney injury. These findings enhance our understanding of biological mechanisms underlying Hg-induced nephrotoxicity.
-
The results of the cell model were consistent with those observed in humans, indicating that Hg exposure downregulated the PTEN gene, activate the PI3K/AKT regulatory pathway, increased the expression of inflammatory factors, and led to kidney inflammation. This discovery enhances our understanding of the mechanisms underlying kidney damage caused by Hg exposure and suggests that PTEN has the potential to serve as a biomarker for Hg exposure.
-
This study was approved by the Ethics Committee of the Jiangsu Provincial Center for Disease Control and Prevention.
-
All authors contributed to the conception and design of the study. MEI Peng, YIN Hao Yang, and DING Xue Xue: data curation and writing-original draft preparation; DING En Min: writing-reviewing and editing; WANG Huan and WANG Jian Feng: visualization and investigation. Han Lei and ZHANG Heng Dong: conceptualization and methodology; ZHU Bao Li: supervision.
HTML
Determination of Hg Vapor Concentration in Workplace Air
Research Design, Study Subjects, and Sample Collection
Serum RNA Extraction
Microarray Screening and Bioinformatics Analysis of Gene Expression Profiles
qRT-PCR Analysis
Cell Culture, Exposure, and Transfection
Cell Culture
CCK-8 (Cell Counting Kit-8) Analysis
Cell Exposure
Cell Transfection
Protein Extraction
Western Blot Analysis
Enzyme-linked Immunosorbent Assay (ELISA)
Statistical Analysis
Determination of Hg Vapor Concentration in the Workplace
Demographic Characteristics of Participants in the Initial Screening Stage
The Results and Analysis of Gene Expression Profile Chip
Analysis of Validation Results of Population Expansion
Hg-exposure-induced Apoptosis and Inflammation of 293T Cells in vitro
&These authors contributed equally to this work.
 23204+Supplementary Materials.pdf
|

|






 Quick Links
 DownLoad:
