-
According to the 2021 Global Nutrition Report, 2.2 billion adults are overweight or obese (40.8% of women and 40.4% of men). Child overweight is also on the rise, as is the prevalence of adult obesity (12.3% among men and 16.2% among women, compared with 9.2% and 13.2% in 2010). Overweight and obesity increased in every region, with up to 3% in Asia[1]. Recently, as it has been recognized that the risk of obesity is high, there has been a growing interest in obesity treatment and weight control, and various medicines and potential natural products for obesity treatment are being developed[2]. However, most current obesity drug treatments often result in adverse patient reactions; therefore, natural products or functional supplements from edible resources have become attractive options for weight loss. We previously reported that Lactobacillus plantarum dy-1 fermented barley extracts can inhibit fat accumulation by reducing lipid metabolites and increasing lipid metabolism intermediates to achieve anti-obesity effects[3,4].
Rats and mice are primarily used to evaluate the nutritional characteristics of bioactive substances. However, because of the relatively low content of active protein components, it is difficult to meet the requirements of animal experiments; therefore, a new model should be selected for research. Caenorhabditis elegans is a eukaryotic, multi-organ, short-lived animal that can be used in many research fields using genetic modifications for rapid, large-scale, high-throughput screening to discover drugs and bioactive compounds[5,6]. Metabolic pathways related to fat synthesis and degradation in nematodes are similar to those in animals and humans. These have become popular in vivo models for understanding the regulatory basis of lipid biosynthesis and deposition[6].
Studies have shown that many natural plant products can reduce lipid accumulation and cause weight loss and lipid reduction in C. elegans. For example, 4,4-dimethylsterol, which is found mainly in plant resins, fruits, and vegetables, can significantly reduce lipid deposition by targeting the NHR-49/SCD pathway in C. elegans, decreasing the ratio of C18:1n-9 to C18:0, thereby inhibiting lipid deposition[7]. Volvariella volvacea polysaccharide reduced the lipid accumulation of C. elegans and its mechanism of reducing the lipid deposition mainly via aak-2/nhr-49-mediated fatty acid synthesis pathway and acs-2-mediated fatty acid oxidation pathway[8]. In addition, some studies have found that phenolic compounds in cranberries can reduce lipid accumulation in C. elegans by downregulating the expression of sbp-1, cebp, and hosl-1 and upregulating the expression of nhr-49[9]. Moreover, Peng et al. found that hesperidin in citrus fruits reduced fat accumulation by affecting the expression of stearic coenzyme A desaturase, fat-6, fat-7, mdt-15, acs-2, and kat-1[10]. Our previous studies have shown that uncharacterized proteins in barley extracts fermented by L. plantarum dy-1 can significantly reduce lipid deposition, and with an increase in uncharacterized protein concentration, lipid deposition decreases in C. elegans[11]. However, the specific lipid-lowering mechanism of the target active proteins in fermented barley extracts requires further study.
The single-component glycoprotein LFBEP-C1 with the strongest lipid-lowering activity was obtained using the purification methods of ammonium sulfate-graded precipitation, dialysis desalting, Q Beads 6FF strong anion exchange chromatography and Superdex 75 increase 10/300 gel filtration chromatography combined with oleic acid-induced HepG2 cells. Based on the above, to further explore the lipid-lowering mechanism of L. plantarum dy-1 fermented barley active protein LFBEP-C1, a high-fat model of C. elegans was established. Growth and development, exercise behavior, lipid accumulation, and lipid metabolism-related pathways of C. elegans were analyzed.
-
Wild-type C. elegans N2 and Escherichia coli OP50 (E. coli OP50) used in this study were donated by Professor Dayong Wang Laboratory of Southeast University. All mutated C. elegans used in the experiment were donated by Keehong Kim's laboratory at Purdue University. All chemicals and solvents used in the experiments were of analytical grade and were purchased from Sinopharm Chemical Reagent Co., Ltd. (Shanghai, China).
-
The fermented barley extract (LFBE) was dissolved in buffer A (20 mmol/L Tris-HCl, pH 8.0, 40 mg/mL) and centrifuged to obtain the supernatant. First, anhydrous ammonium sulfate (10%, 20%, and 80% saturation) was used to precipitate the uncharacterized proteins, which were dialyzed to remove excess ammonium sulfate. Then, the uncharacterized protein with the strongest anti-obesity activity was further purified using ion exchange chromatography on a 50-mL Q Beads 6FF column, which had been pre-equilibrated with buffer A. Following removal of unbound proteins in the flow-through, the column was washed with 100 mL of buffer A, and bound material was subsequently eluted from the column using a NaCl gradient of 0.0–1.0 mol/L in buffers B–F (buffer A + 0.1 mol/L NaCl, buffer A + 0.2 mol/L NaCl, buffer A + 0.3 mol/L NaCl, buffer A + 0.5 mol/L NaCl, and buffer A + 1 mol/L NaCl) sequentially. The fractions were analyzed using 12% sodium dodecyl-sulfate-polyacrylamide gel electrophoresis. Finally, the protein sample with the strongest anti-obesity activity was further purified using gel filtration chromatography on a pre-equilibrated Superdex 75 increase 10/300 size-exclusion column using a 500-μL sample loop at a flow rate of 0.5 mL/min on an ÄKTA purifier (GE Healthcare), and the protein elution profile was monitored by measuring absorbance at 280 nm. The homogeneity of the concentrated protein sample was determined using 12% sodium dodecyl-sulfate-polyacrylamide gel electrophoresis stained with Coomassie Brilliant Blue. Purified and concentrated protein was dialyzed overnight against the dialysis buffer (20 mmol/L Tris-HCl, pH 8.0) and stored at −20 °C. The protein concentration for all proteins was determined with a Bio-Rad protein assay kit using bovine serum albumin as the standard, and the protein yield was subsequently estimated. The lipid-lowering activity of each purified protein component was determined using an oleic acid-induced HepG2 high-fat model to determine the protein component with the best lipid-lowering potential (LFBEP-C1).
-
E. coli OP50 was cultured using a previously described standard method[12]. Briefly, 1 mL of stock E. coli solution was added to Luria Broth medium (1 g peptone, 0.5 g sodium chloride, and yeast extract were dissolved in distilled water and fixed to 50 mL). The solution was mixed well and autoclaved, and the medium was incubated at 37 °C for 48 h. C. elegans were grown on Nematode Growth Medium (NGM) agar plates (approximately 35 mm in diameter) with E. coli OP50, transferred to a new dish every other day, and stored in a low-temperature incubator (Revco Tech., Nashville, TN, USA) at 20 °C or 15 °C throughout the experiments.
-
C. elegans were randomly divided into three groups: The control group was fed E. coli OP50 only. The model groups were fed E. coli OP50 and 50 mmol/L glucose solutions (to determine the best glucose concentration). The experimental groups were fed supplementary barley action protein LFBEP-C1 (10, 20, or 40 μg/mL) with E. coli OP50 and 50 mmol/L glucose solution. In general, C. elegans larvae at the L1 stage were transferred to normal NGM or NGM containing glucose and LFBEP-C1 samples for 48 h.
-
Thirty C. elegans treated with LFBEP-C1 for 48 h were randomly selected and added to M9 buffer (3 g potassium dihydrogen phosphate, 6 g disodium hydrogen phosphate, 5 g sodium chloride, and 1 mL of 1 mol/L magnesium sulfate solution were fixed to 500 mL with distilled water). Then, an appropriate amount of 0.5 mol/L sodium azide was added. After the C. elegans were stiff, they were photographed under a microscope, and their body length and width were measured using Image J software.
The C. elegans life span was determined using the liquid culture method. When the L1 stage larvae were synchronized to L4, they were transferred to a Transwell culture plate containing S liquid medium (5.9 g sodium chloride and 50 mL of 1 mol/L KH2PO4 solution were fixed to 500 mL with distilled water. The solution was adjusted to pH 6.0, and 1 mL of 5 mg/mL cholesterol solution was added after sterilization and cooling) and samples for further culturing. There were three parallels in each group, and 50 μg/mL fluorodeoxyuridine was added to prevent the oviposition of C. elegans. The number of surviving C. elegans was recorded every two days, and the number of C. elegans in each group was at least 100. The standard for C. elegans death is body stiffness or a lack of response to external stimuli.
-
The determination of C. elegans movement has been described by Deng et al. and Rawsthorne et al.[13,14]. The head-swing frequency is the number of times that the head of the nematode swings from one side to the other and then returns to its original position within 1 min. The criterion for judging the body-bending frequency is to assume that the direction along which the nematode swallows is the y-axis, and a change in the x-axis direction is regarded as body bending in the process of body advancement of the nematode; the number of body bends within 1 min was calculated. In this test, a platinum wire needle was used to collect the nematodes from each group into an NGM culture dish without E. coli OP50 coating. After the nematodes recovered and stabilized, the head-swinging and body-bending frequencies of the nematodes were observed and recorded under a body microscope.
-
After 48 h of treatment, C. elegans were collected in a 1.5-mL Eppendorf tube and washed thrice with M9 buffer. After cleaning, new M9 buffer was added. The C. elegans body was broken using ultrasound and centrifuged. The supernatant was transferred to a new centrifuge tube, and TG content was determined according to the TG kit instructions (Nanjing Jiancheng Bioengineering Institute, Nanjing, China).
-
The collected C. elegans to be analyzed were washed, and an appropriate amount of 60% isopropanol was added and kept for 30 min at room temperature. The supernatants were discarded. After three rounds of cleaning with the M9 buffer, an appropriate amount of oil red O staining solution was added. After dark dyeing for 2–6 h at room temperature, a small amount of liquid was left after several cleanings with M9 buffer, and an appropriate amount of 0.01% Triton X-100 was added. C. elegans were observed under a microscope, photographed, and analyzed using Image J software.
-
The related genes and their primers are shown in Table 1; the internal reference gene was act-1. Specific procedures were performed according to the manufacturer’s instructions.
Gene Forward primer sequence (5′ to 3′) Reverse primer sequence (5′ to 3′) act-1 TCGGTATGGGACAGAAGGAC CATCCCAGTTGGTGACGATA fat-5 CGCTCATATGGGATGGTTGT CAGGGCGAAGCAGAAGATT fat-6 GCCCAGAGACGCAATATCTC CAGCAAAGAGAGCCACGTTA fat-7 CAACAGCGCTGCTCACTATT CACCAACGGCTACAACTGTG daf-16 CCAGACGGAAGGCTTAAACT ATTCGCATGAAACGAGAATG mdt-15 TAAATCAGCGGCAGTGCCTT CCGGAGTGTTTCCTGCTGTC daf-2 TGGATCTCCATCGCGAAACG TTTTGGGGGTTTCAGACAAGT Table 1. The list of primer sequences
The collected C. elegans were washed at least three times with distilled water to ensure no E. coli remained. After cleaning and ultrasonic fragmentation, the samples were transferred to an Eppendorf tube without the RNAse. The RNA was extracted according to the TAKARA manufacturer’s instructions. Furthermore, the RNA concentration of C. elegans in each group was determined to ensure high RNA extraction purity. The experiments were conducted on an ultraclean workbench.
The reactions were conducted using a 7900 HT Fast Real-Time PCR System (Life Technologies). Reverse transcription was done at 48 °C for 30 min, and AmpliTaq gold® activation (denaturation) was done at 95 °C for 10 min. Amplification of the DNA involved 40 cycles of 15 s at 95 °C and 1 min at 60 °C. Data were analyzed using Sequence Detector Software (Life Technologies). The relative quantification of gene expression (2−ΔΔCt) was calculated.
-
All experiments were performed at least thrice. Data are expressed as mean standard deviation and mean standard error. One-way ANOVA and Tukey’s multiple tests were used to determine the statistical differences between the treatment groups. Statistical significance was set at P < 0.05 and P < 0.01.
-
As shown in Table 1, compared with the normal group, the body length and width of C. elegans in the model group decreased, indicating that the high-glucose diet had an adverse effect on the body length and width of C. elegans, which could limit their growth and development. However, LFBEP-C1 improved the adverse effects of a high-glucose diet on the growth and development of C. elegans and returned body length and width to normal levels.
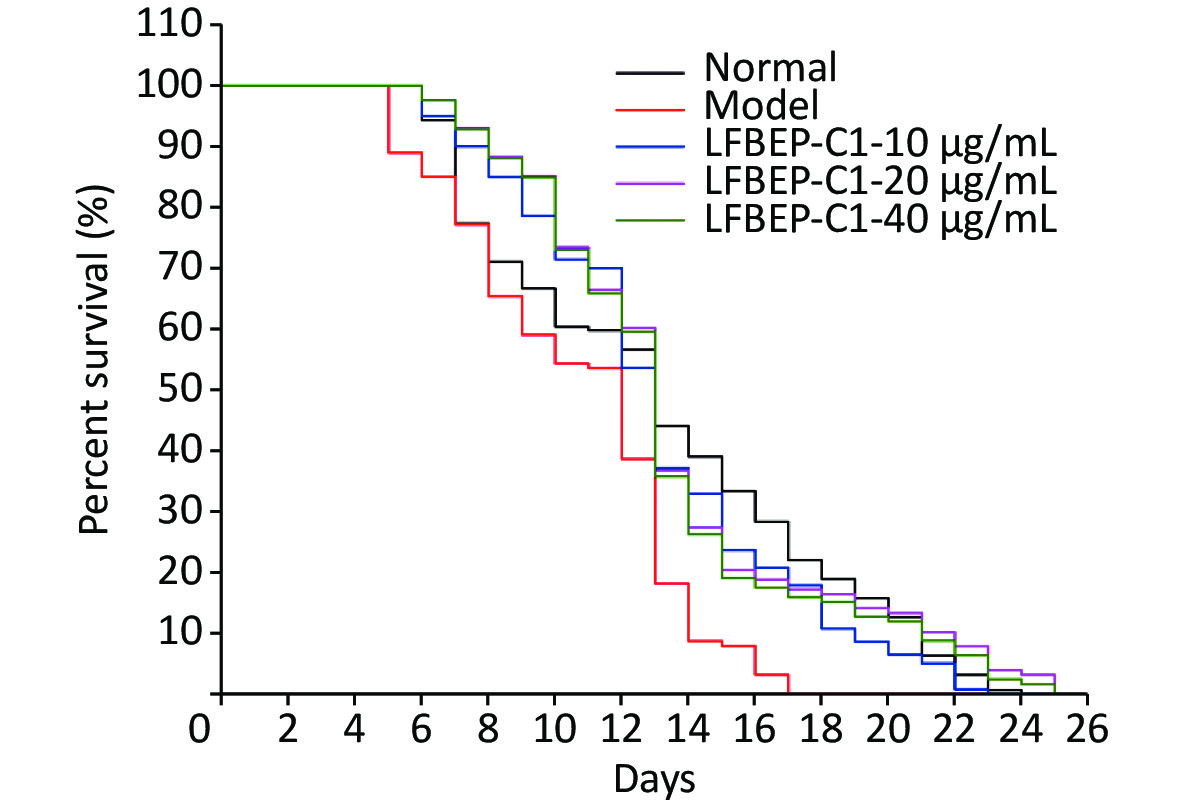
As shown in Table 2, the high-sugar diet reduced the average lifespan of C. elegans by 19.1%, whereas with the addition of LFBEP-C1, the average lifespan also returned to normal levels. Compared with the normal group, the survival curve of C. elegans in the model group was significantly shifted to the left, indicating that a high-glucose diet had an adverse effect on the life of C. elegans (Figure 1). Compared with the model group, the life curve of C. elegans in the LFBE-C1 group was significantly shifted to the right. Particularly, 20 μg/mL LFBEP-C1 was the most effective, and its average life reached 13.55 days. These results indicate that LFBEP-C1 can not only eliminate the negative effects of a high-glucose diet on the life span of nematodes but also prolong their lifespan to a certain extent.
Groups Length (μm) Width (μm) Normal groups 632.49 ± 4.09**** 40.16 ± 0.39**** Model groups 578.65 ± 3.23 35.18 ± 0.46 10 μg/mL LFBEP-C1 groups 586.75 ± 2.82 35.26 ± 0.42 20 μg/mL LFBEP-C1 groups 622.97 ± 1.92**** 38.61 ± 0.32**** 40 μg/mL LFBEP-C1 groups 606.32 ± 2.23**** 37.66 ± 0.22**** Note. All data are expressed as mean ± standard error; each group is significantly different from the model group, and the significance levels are expressed as *P < 0.05, **P < 0.01, ***P < 0.001, and ****P < 0.0001. Table 2. Effects of LFBEP-C1 on the individual development of C. elegans
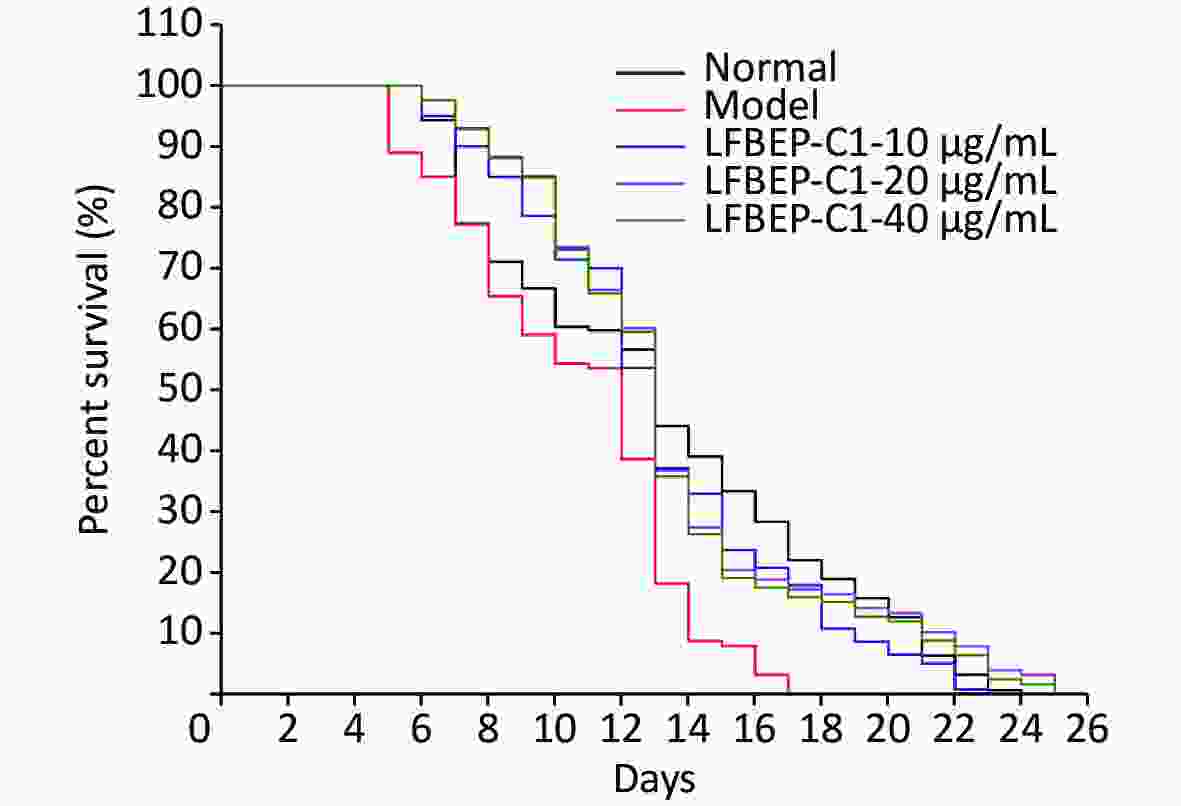
Figure 1. Survival curves of C. elegans treated with LFBEP-C1. The model group represents the high-glucose group.
Groups Numbers Average lifespan (days) maximum lifespan (days) Normal groups 159 13.10 ± 0.41** 24 Model groups 127 10.60 ± 0.30 17 10 μg/mL LFBEP-C1 groups 140 13.07 ± 0.35*** 23 20 μg/mL LFBEP-C1 groups 128 13.55 ± 0.41*** 26 40 μg/mL LFBEP-C1 groups 126 13.35 ± 0.39*** 25 Note. All data are expressed as mean ± standard error; each group is significantly different from the model group, and the significance levels are expressed as *P < 0.05, **P < 0.01, ***P < 0.001, and ****P < 0.0001. Table 3. Effects of LFBEP-C1 on lifespan of C. elegans
-
As shown in Figure 2, the head-swing and body-bending frequencies of C. elegans in the model group were significantly lower than those in the normal group, indicating that a high-glucose diet can affect the exercise capacity of C. elegans, resulting in a decrease in exercise frequency. For the head-swing frequency of C. elegans, the effect was relatively obvious when the concentration of LFBEP-C1 was 20 μg/mL (Figure 2A). Compared with the model group, the head-swing frequency increased by 33.88%.

Figure 2. Effects of LFBEP-C1 on head-swing (A) and body-bending (B) frequencies of C. elegans. All data are expressed as mean ± standard error; each group is significantly different from the model group, and the significance levels are expressed as *P < 0.05, **P < 0.01, ***P < 0.001, and ****P < 0.0001. The model group represents the high-glucose group.
In addition, Figure 2B shows the effect of LFBEP-C1 on the body-bending frequency of C. elegans. When the LFBEP-C1 concentration was 20 μg/mL, the body-bending frequency of C. elegans increased by 27.09% compared with the model group. These results show that different concentrations of LFBEP-C1 resulted in different degrees of improvement in the movement ability of C. elegans.
-
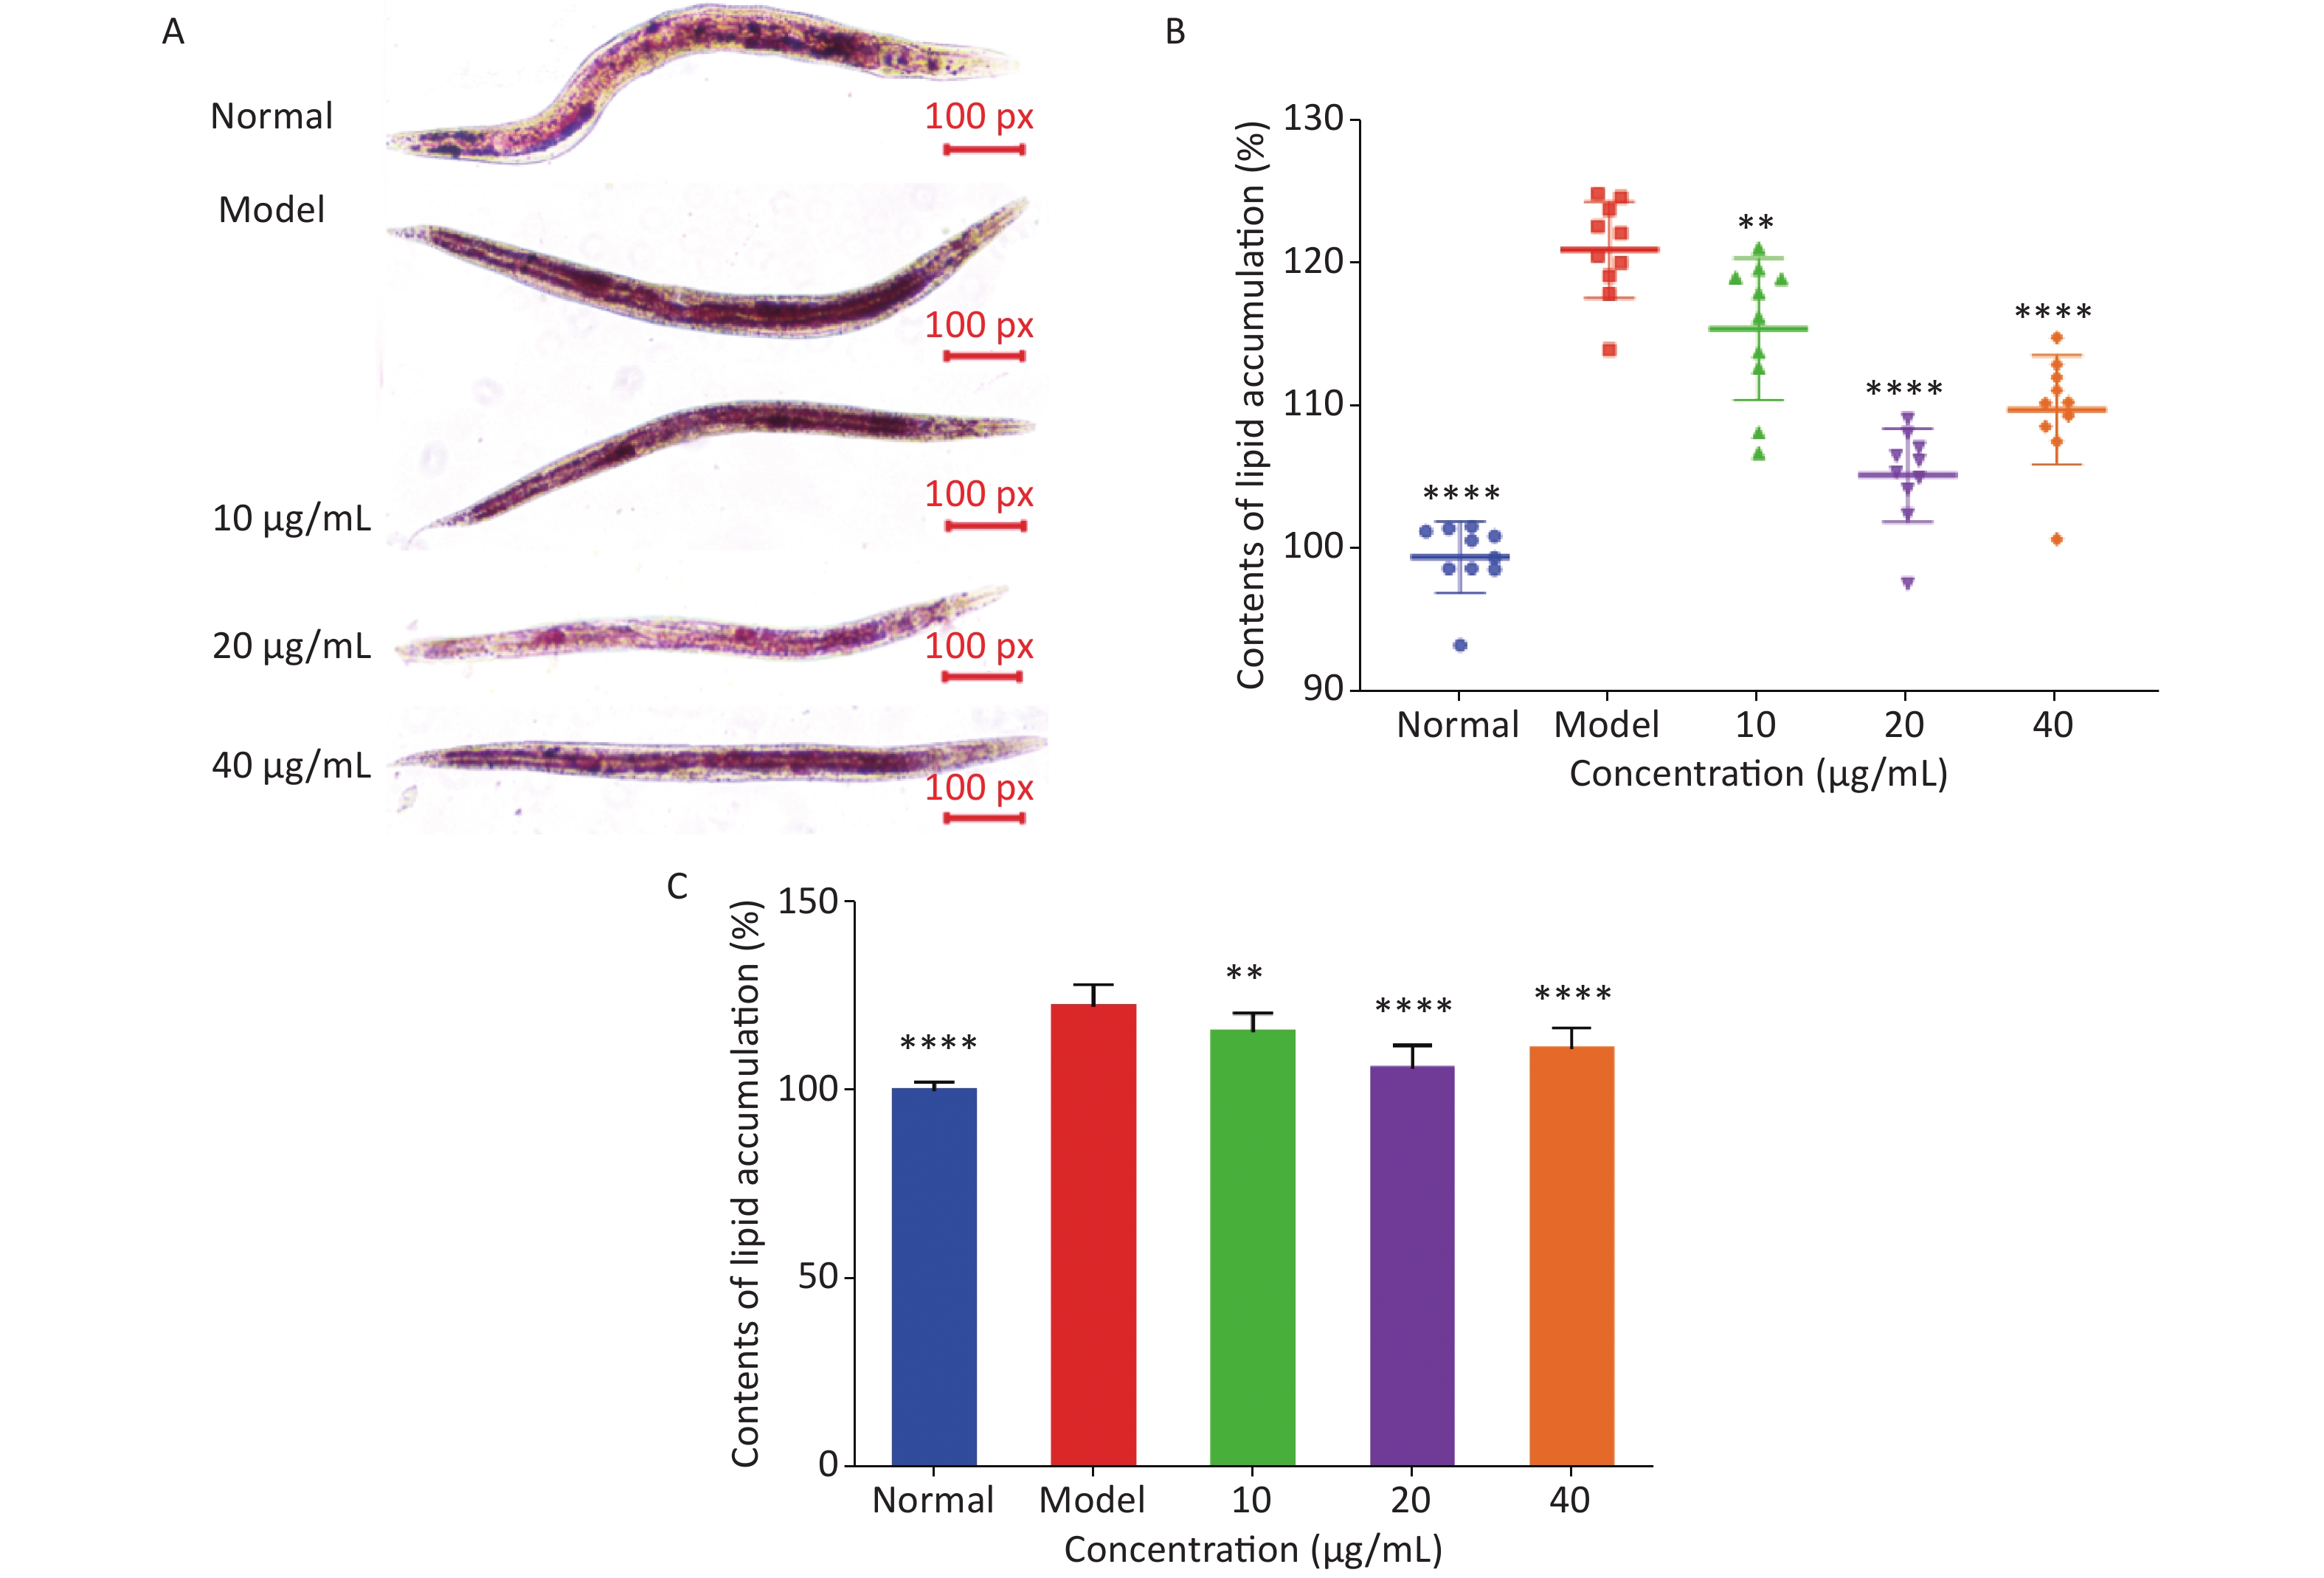
Oil red O staining and triglyceride content were used to determine the degree of lipid deposition in C. elegans. As shown in Figure 3A, oil red O stained the fat in C. elegans red, and ImageJ software was used to quantitatively analyze lipid deposition (Figure 3B). The effect of LFBEP-C1 on the triglyceride content in C. elegans is shown in Figure 3C. Compared with the normal group, the model group showed significant lipid accumulation, and the triglyceride levels in the model group were significantly increased, indicating that a high-glucose diet could lead to increased lipid accumulation in C. elegans. In the present study, a high-fat model of C. elegans was successfully established. When C. elegans fed a high-glucose diet were treated with different concentrations of LFBEP-C1, the lipid accumulation level decreased to varying degrees. When the concentration was 20 μg/mL, the color of the red region of C. elegans became lighter, and the coverage area decreased significantly. Similarly, triglyceride content in the LFBEP-C1 group was significantly lower than that in the model group.
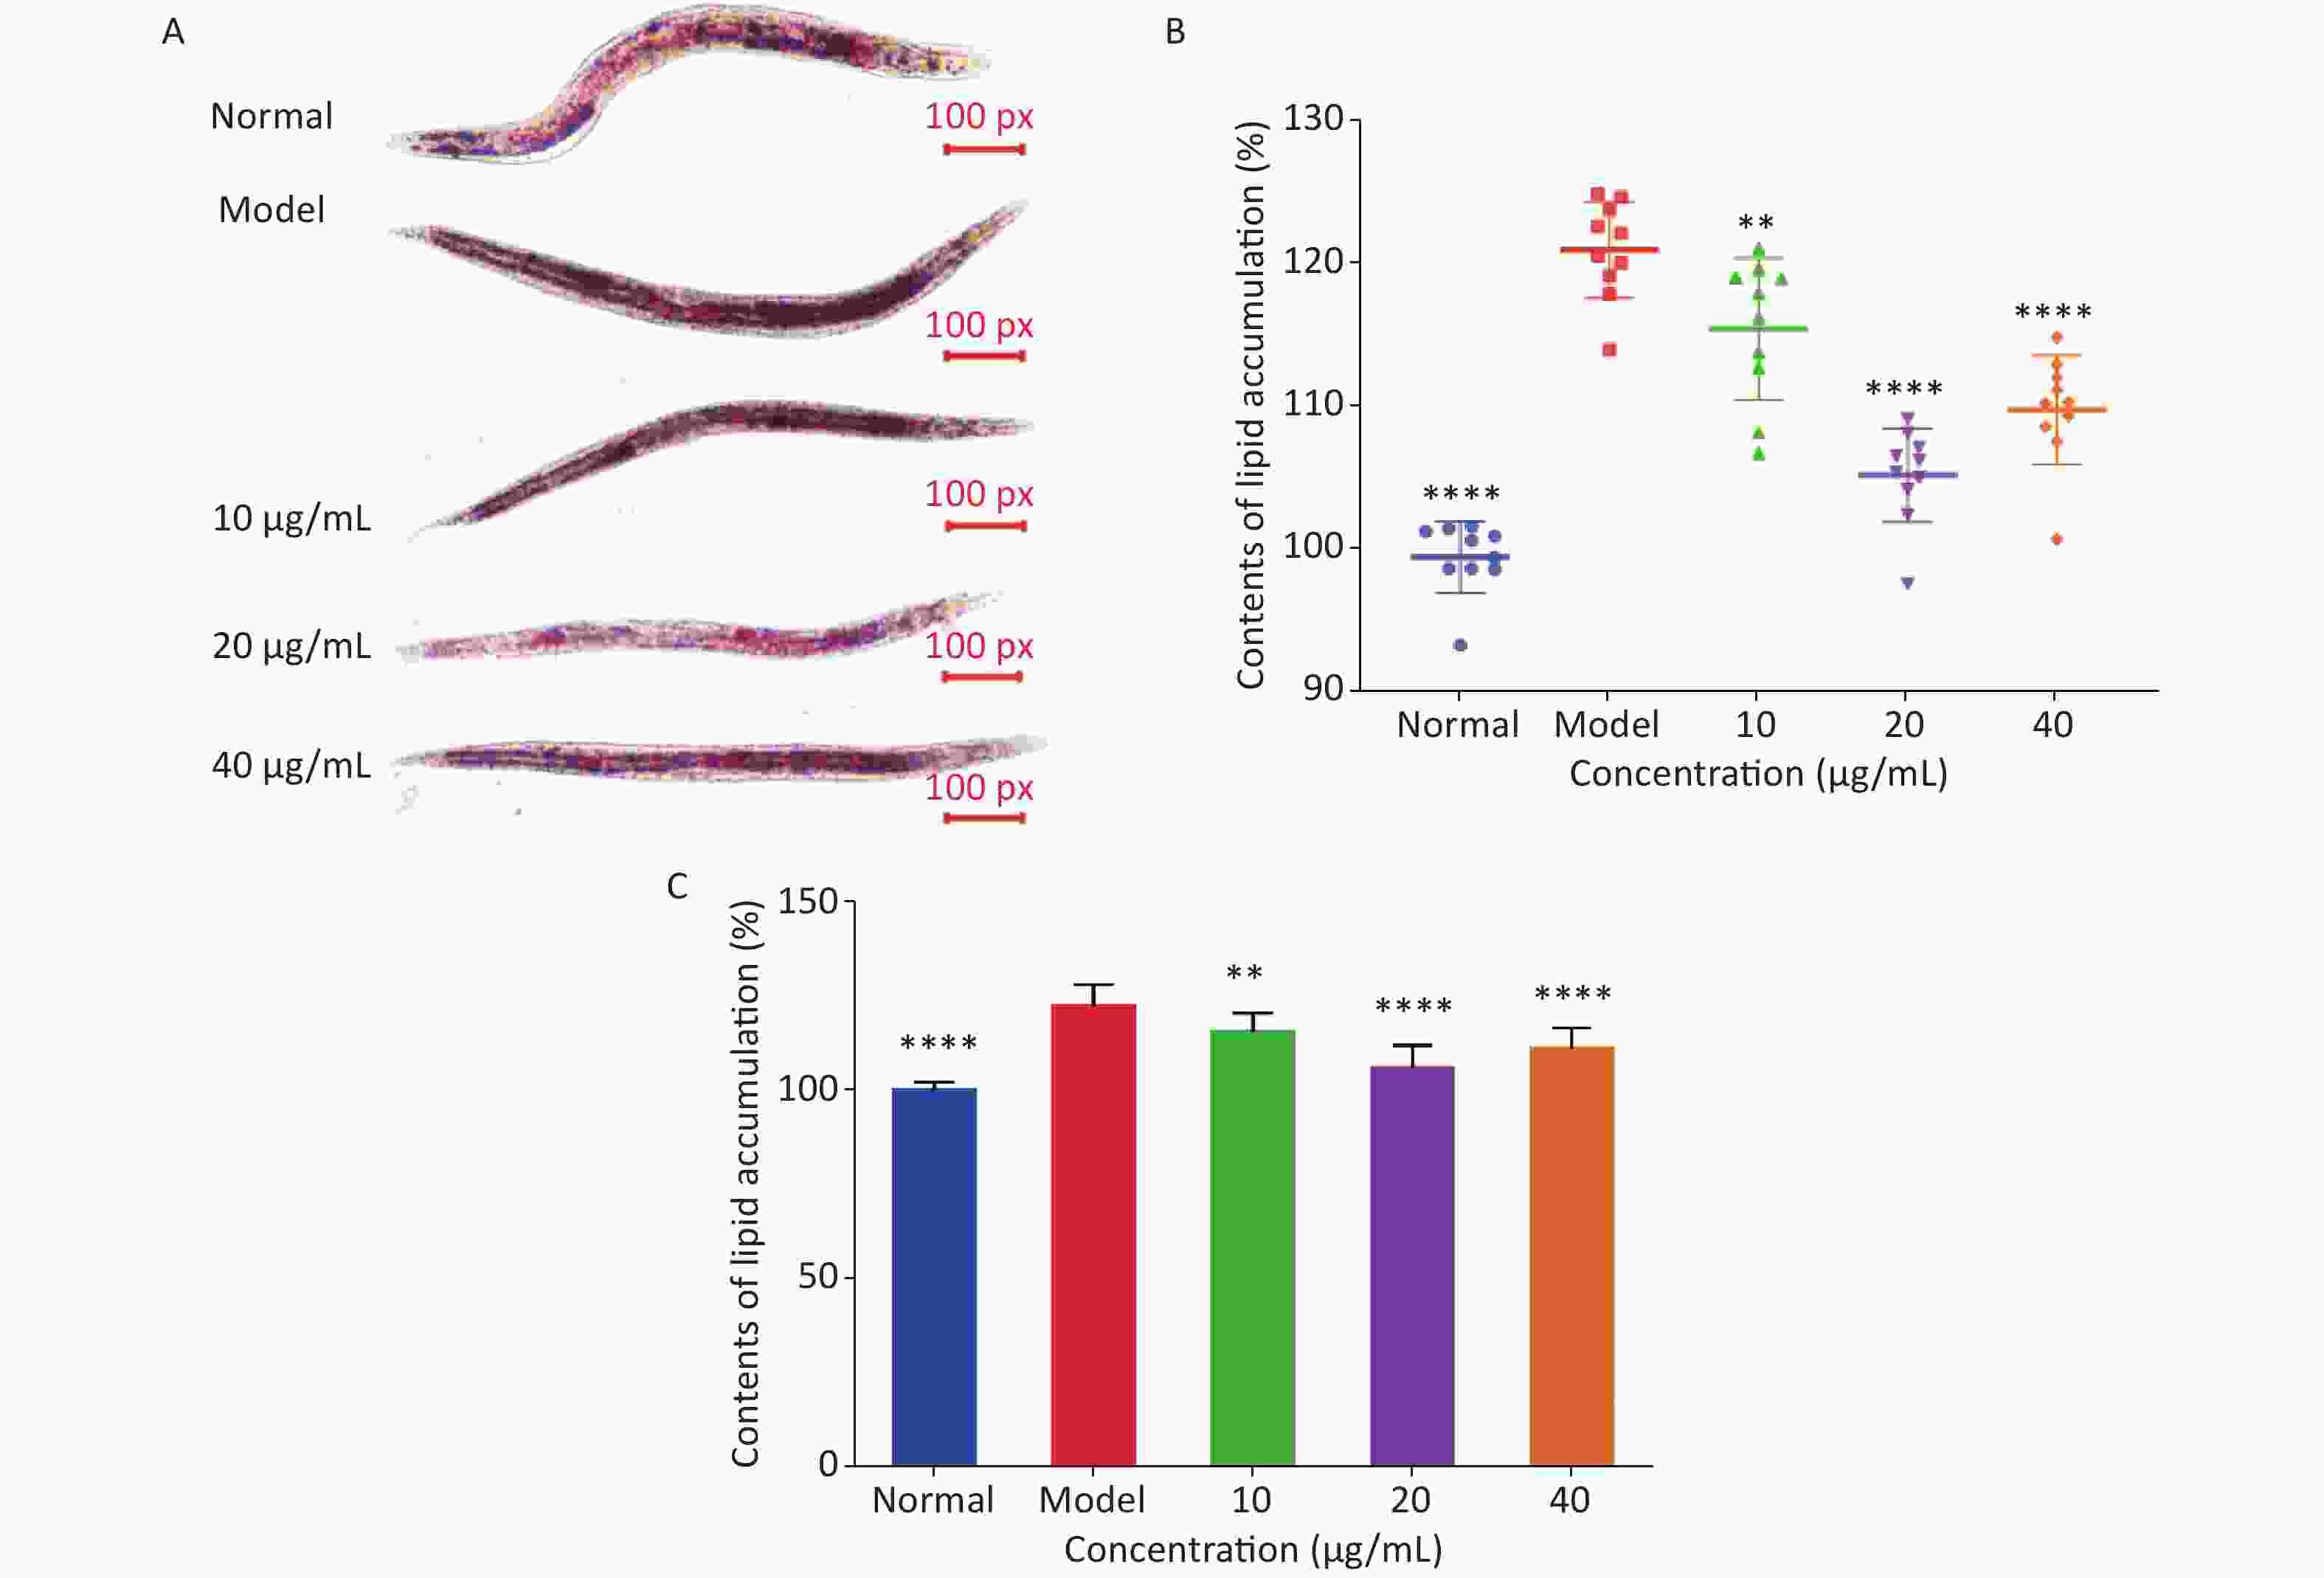
Figure 3. Effects of LFBEP-C1 on lipid accumulation of C. elegans. (A) Oil red O staining of C. elegans; (B) lipid accumulation in C. elegans; (C) TG content of C. elegans. All data are expressed as mean ± standard error; each group is significantly different from the model group, and the significance levels are expressed as *P < 0.05, **P < 0.01, ***P < 0.001, and ****P < 0.0001. The model group represents the high-glucose group.
In general, LFBEP-C1 could alleviate the adverse effects of a high-glucose diet on the individual development, lifespan, and exercise behavior of C. elegans and significantly reduce lipid deposition.
-
To study the mechanism by which LFBEP-C1 regulates lipid metabolism, the effect of LFBEP-C1 on the expression of related genes involved in inhibiting lipid deposition was explored using a high-fat diet model of C. elegans.
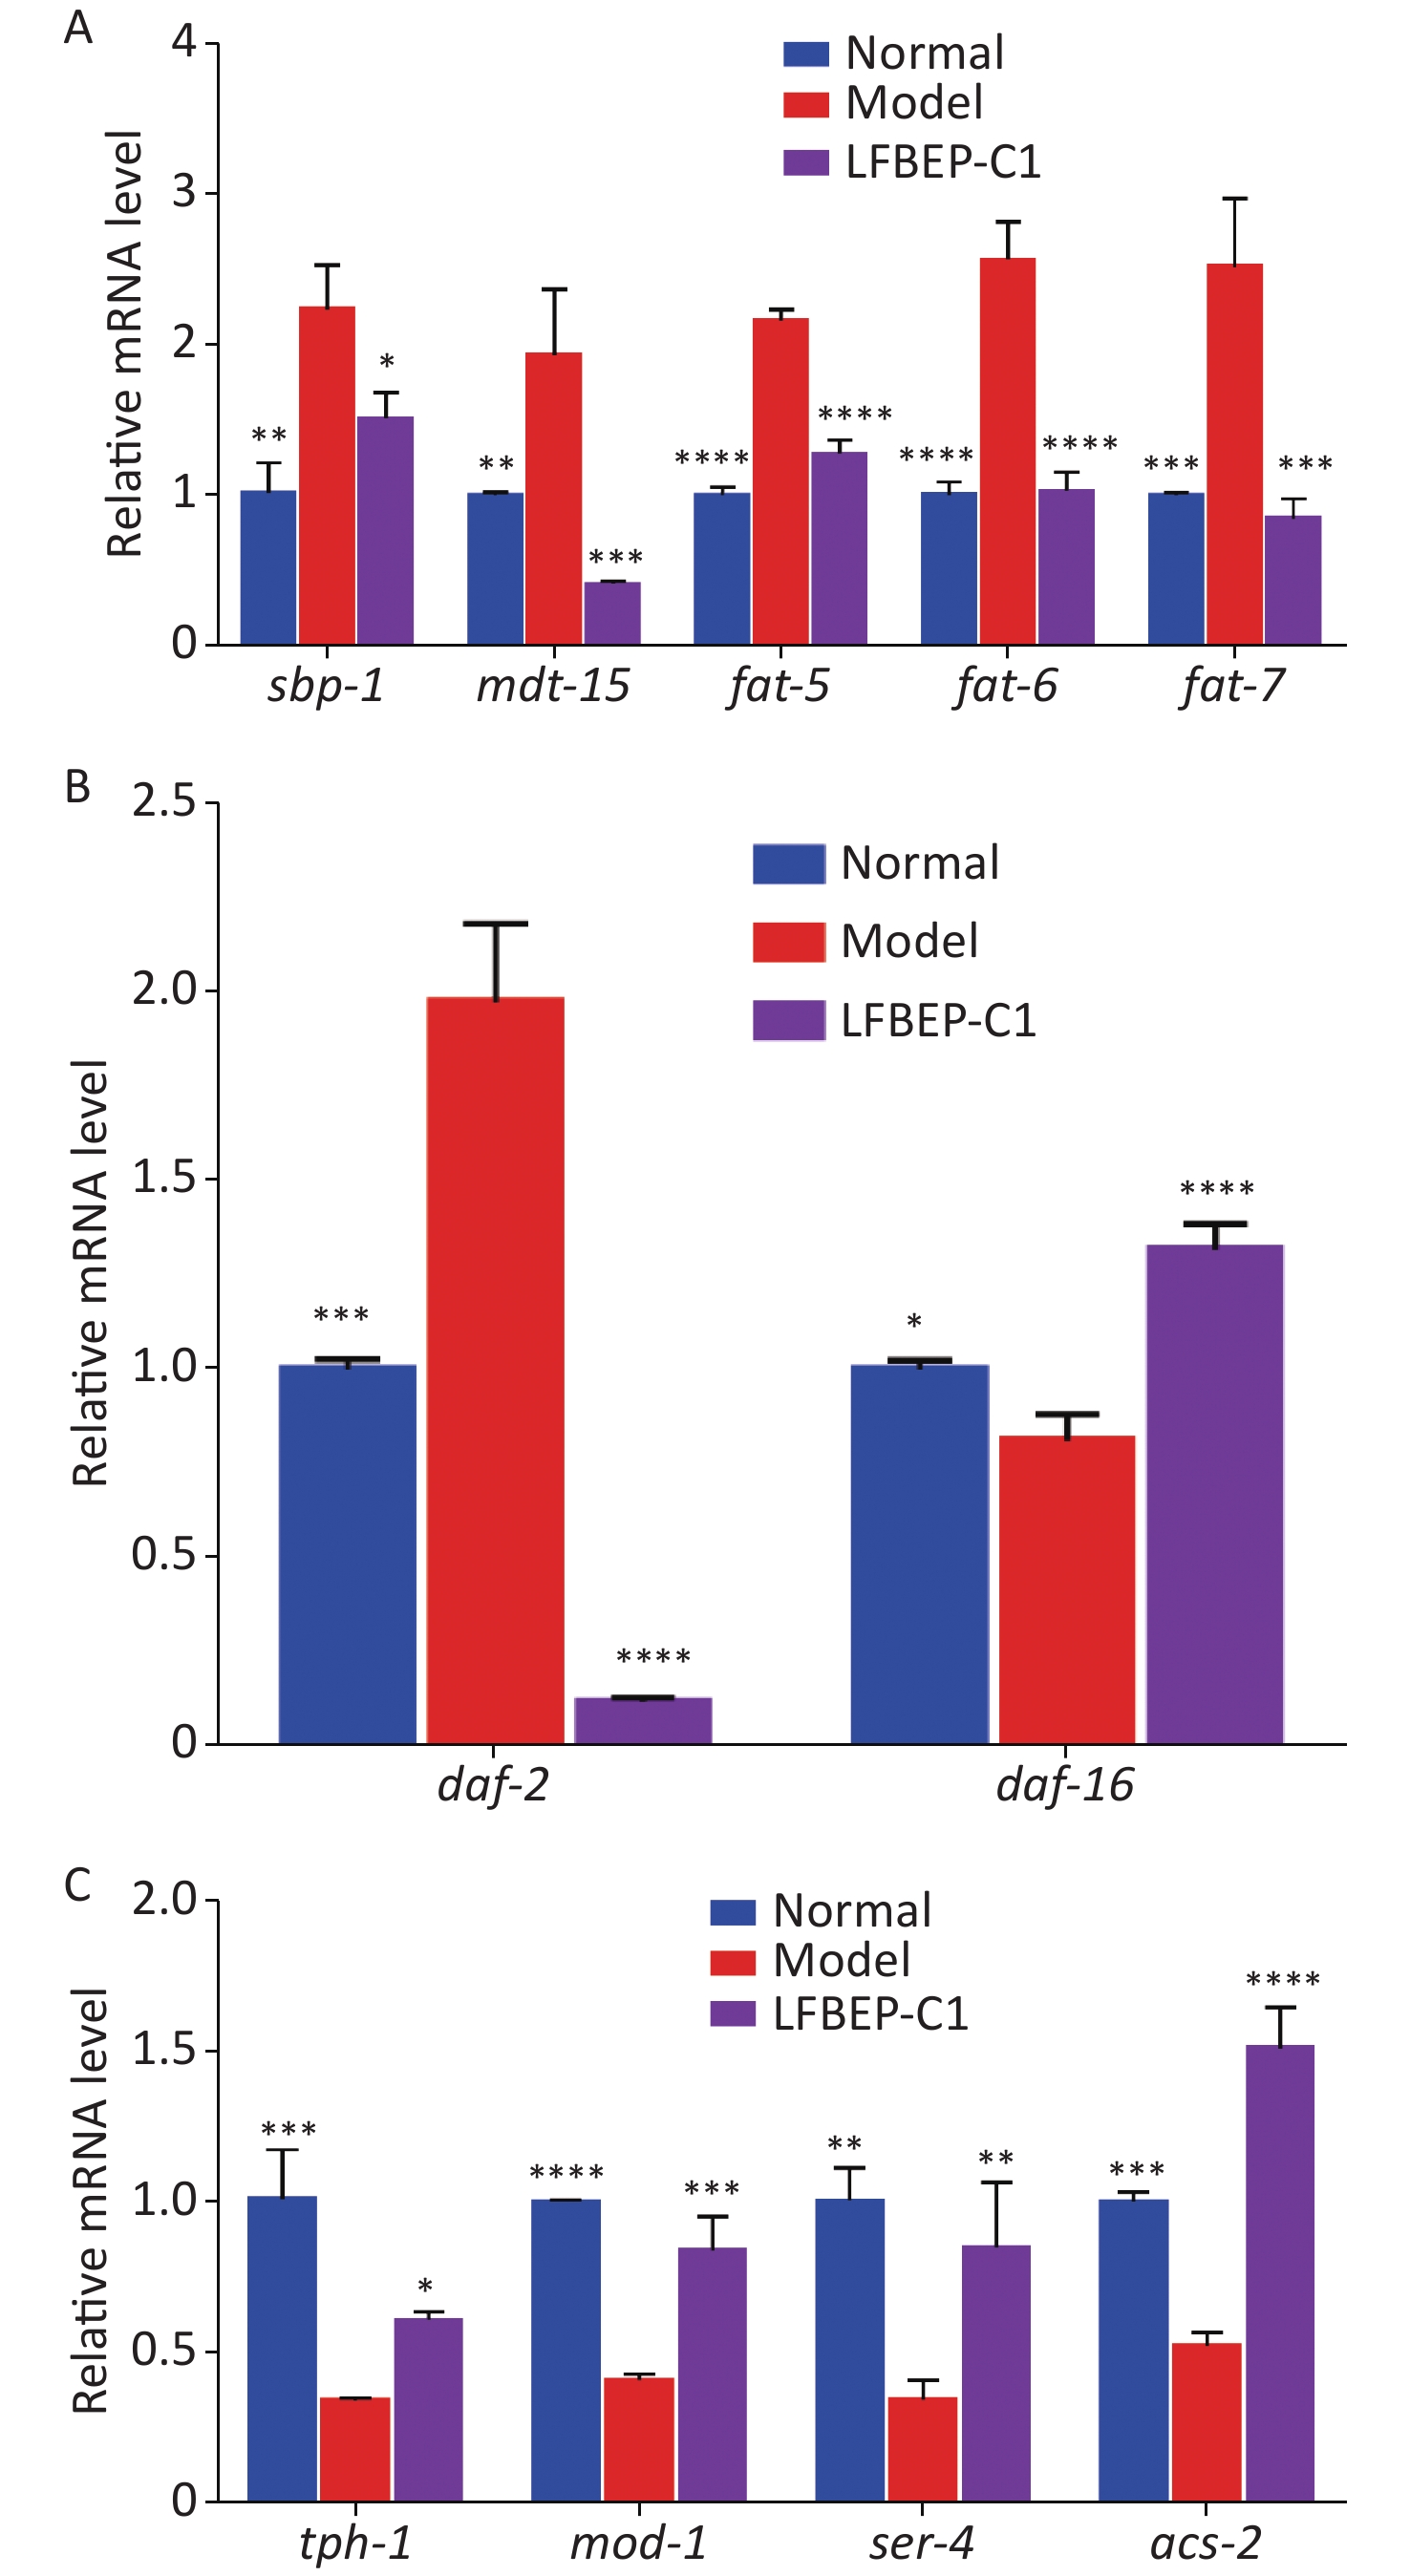
Effect of LFBEP-C1 on the sterol regulatory element-binding protein (SREBP) signaling pathway of C. elegans Figure 4A shows that the expression of sbp-1 and mdt-15 in the model group was promoted by the intake of more glucose, and the combination of the two resulted in increased lipid accumulation in C. elegans. The expression levels of sbp-1 and mdt-15 significantly decreased after LFBEP-C1 intake, and the expression trends of the three downstream genes of sbp-1, fat-5, fat-6, and fat-7, in C. elegans were consistent with those of sbp-1 and mdt-15. Compared with the model group, the expression levels of these three genes were significantly decreased, indicating that LFBEP-C1 can significantly downregulate the expression levels of fat-5, fat-6, and fat-7 mRNA, thereby affecting the expression levels of mdt-15 and sbp-1 mRNA in C. elegans. Thus, fatty acid synthesis was inhibited in C. elegans. SREBP is an important signaling pathway that regulates lipid metabolism in C. elegans.
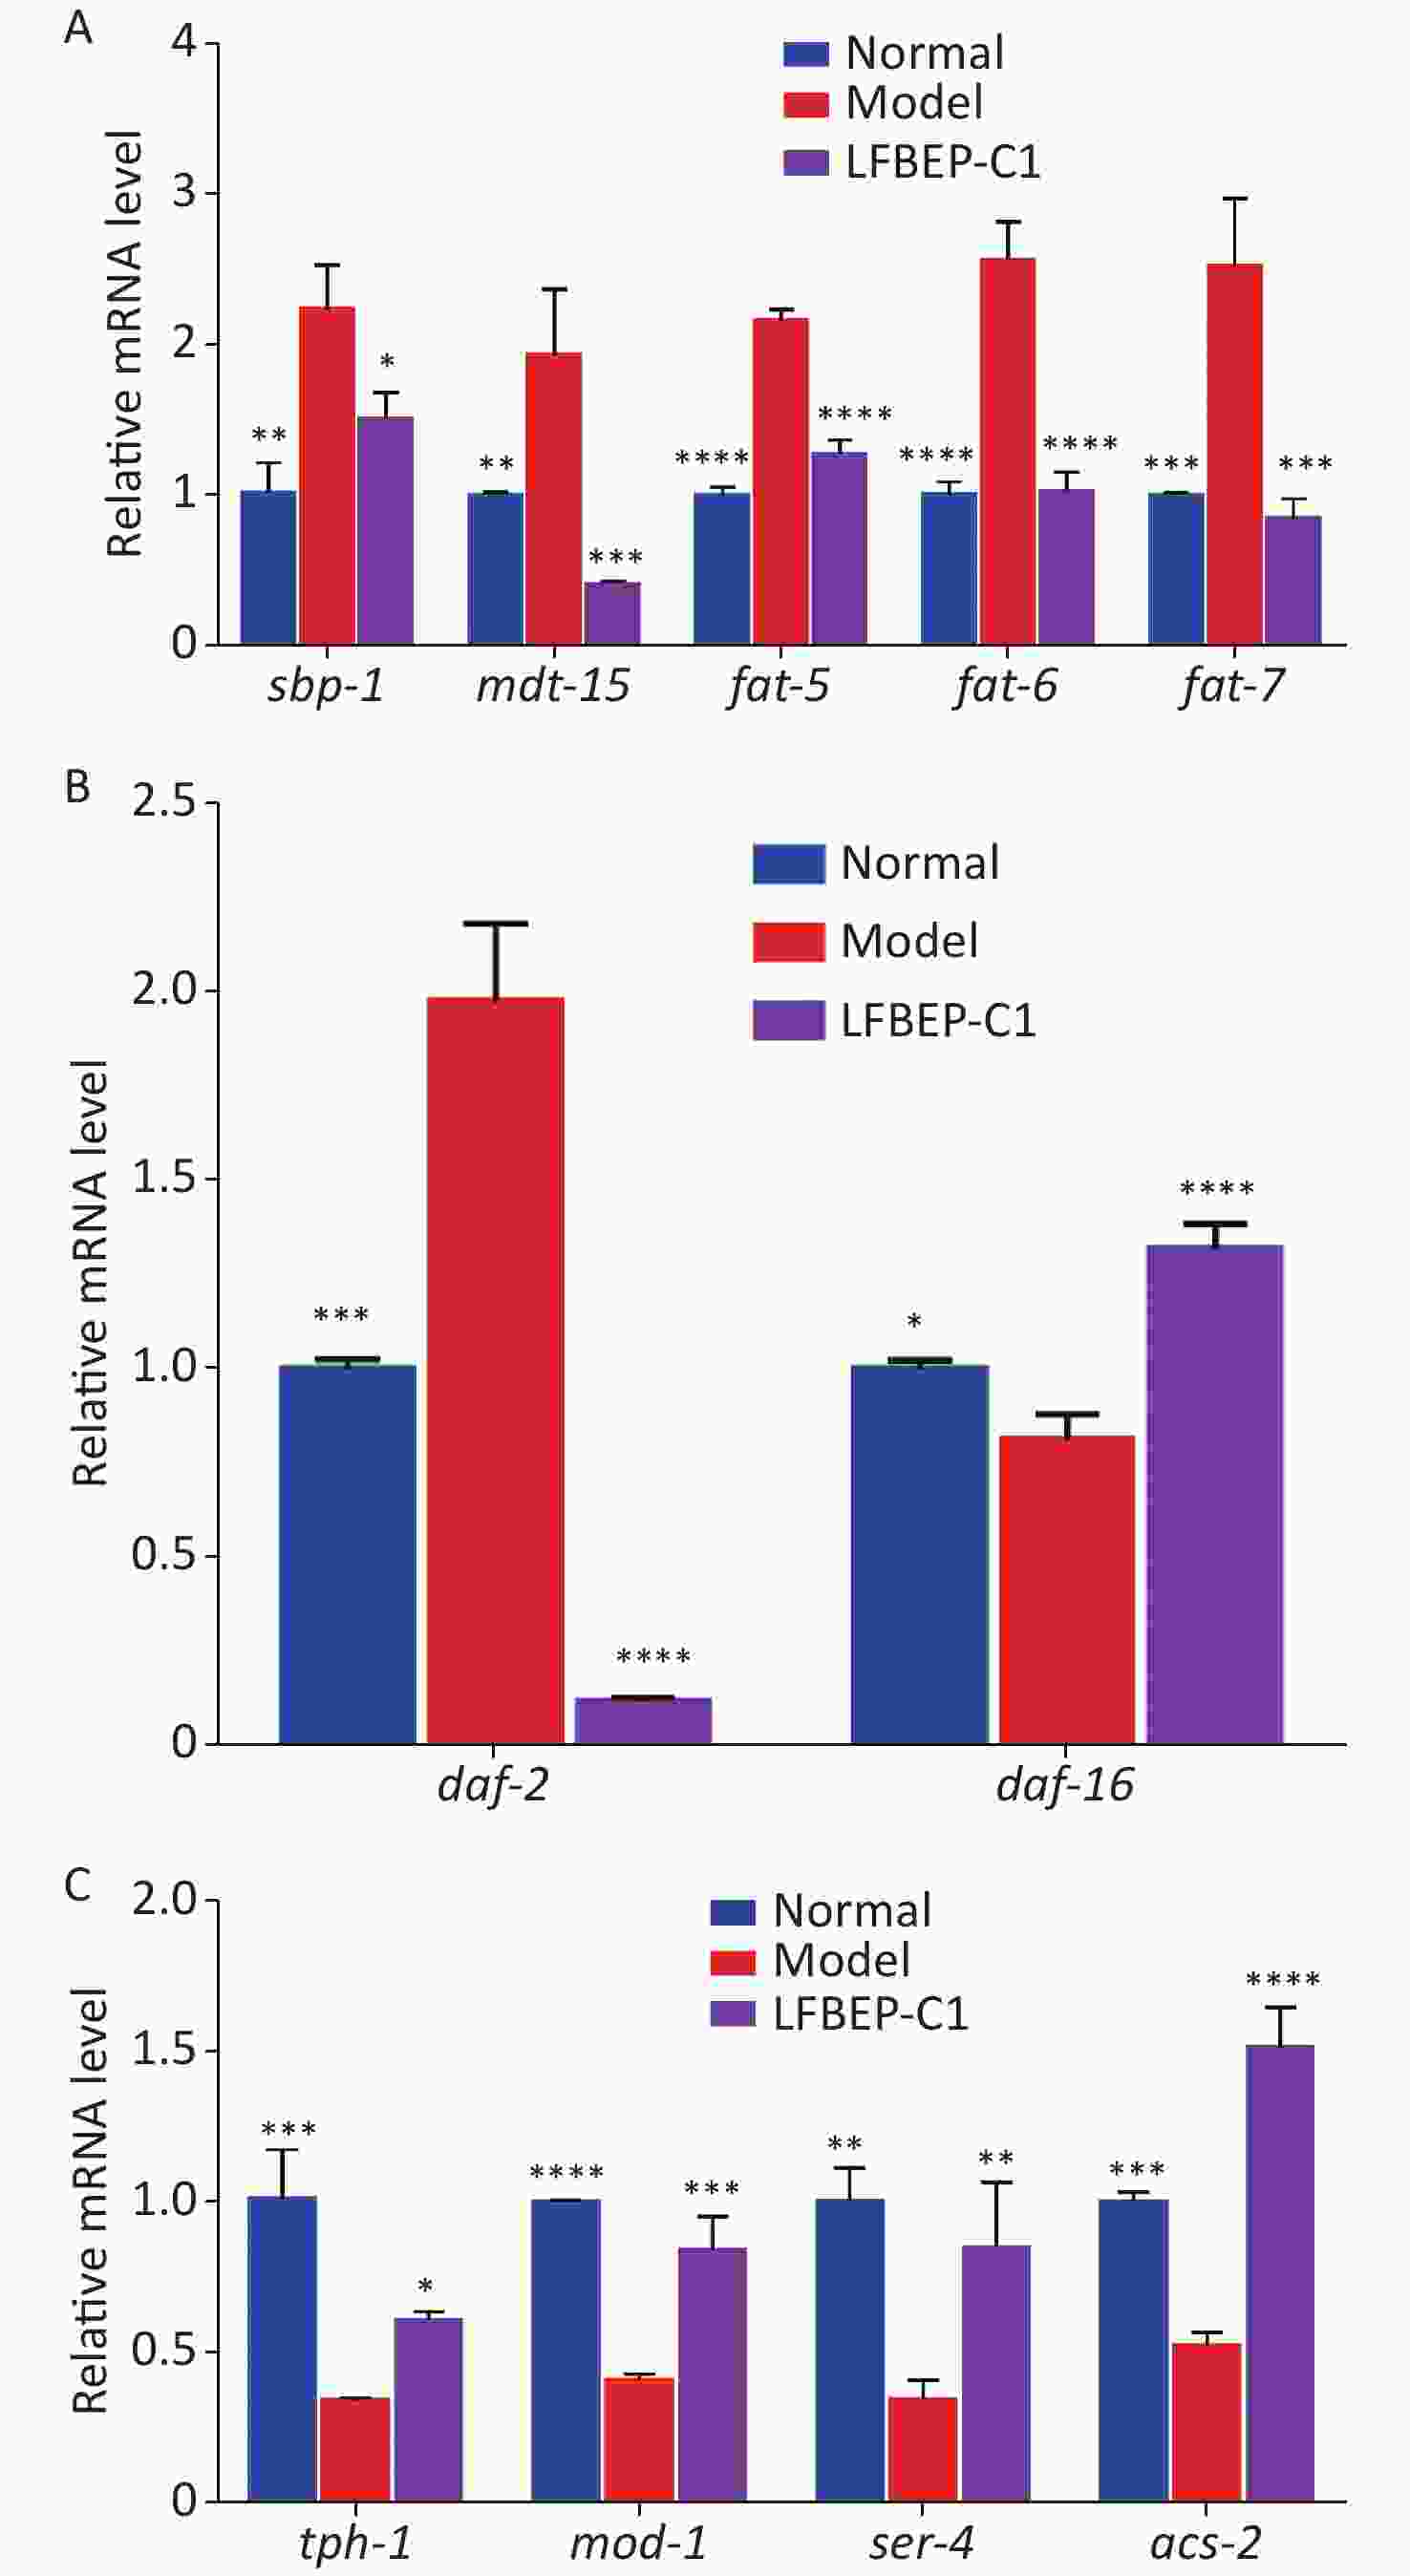
Figure 4. Effect of LFBEP-C1 on the expression of genes related to lipid metabolism in C. elegans. (A) Effects of LFBEP-C1 on the SREBP signaling pathway in C. elegans; (B) Effects of LFBEP-C1 on the gene expression of the insulin signaling pathway in C. elegans; (C) Effects of LFBEP-C1 on the gene expression of the 5-HT signaling pathway in C. elegans. All data are expressed as mean ± standard error; each group is significantly different from the model group, and the significance levels are expressed as *P < 0.05, **P < 0.01, ***P < 0.001, and ****P < 0.0001. The model group represents the high-glucose group.
Effect of LFBEP-C1 on the insulin signaling pathway in C. elegans as shown in Figure 4B, a high-glucose diet increased the expression of daf-2 and decreased the expression of daf-16. However, the LFBEP-C1 treatment group showed the opposite trend. However, combined with the results showing that LFBEP-C1 prolonged the life of C. elegans, LFBEP-C1 regulated lipid metabolism and lifespan by downregulating the expression level of daf-2 mRNA and upregulating daf-16 expression levels in C. elegans fed a high-glucose diet.
Effect of LFBEP-C1 on 5-hydroxytryptamine (5-HT)-mediated neural signaling pathway in C. elegans as shown in Figure 4C, a high-glucose diet inhibited the expression level of tph-1 mRNA in C. elegans; that is, it inhibited the expression of tryptophan hydroxylase, resulting in increased lipid accumulation in C. elegans. LFBEP-C1 significantly increased the expression level of tph-1 and promoted the synthesis of 5-HT in C. elegans. LFBEP-C1 also significantly increased the expression of 5-HT receptor-related genes mod-1 and ser-4, thereby activating the 5-HT receptor and accelerating its transport in C. elegans. Moreover, compared with the model group, the expression of acs-2 in the LFBEP-C1 group was significantly increased, accelerating the β-oxidation process and promoting the decomposition of fatty acids in C. elegans, thereby reducing lipid deposition. Therefore, LFBEP-C1 can promote the synthesis and transport of 5-HT and β-oxidation and reduce lipid accumulation.
In conclusion, LFBEP-C1 effectively reduced lipid accumulation in C. elegans by mediating the SREBP, insulin, and 5-HT signaling pathways.
-
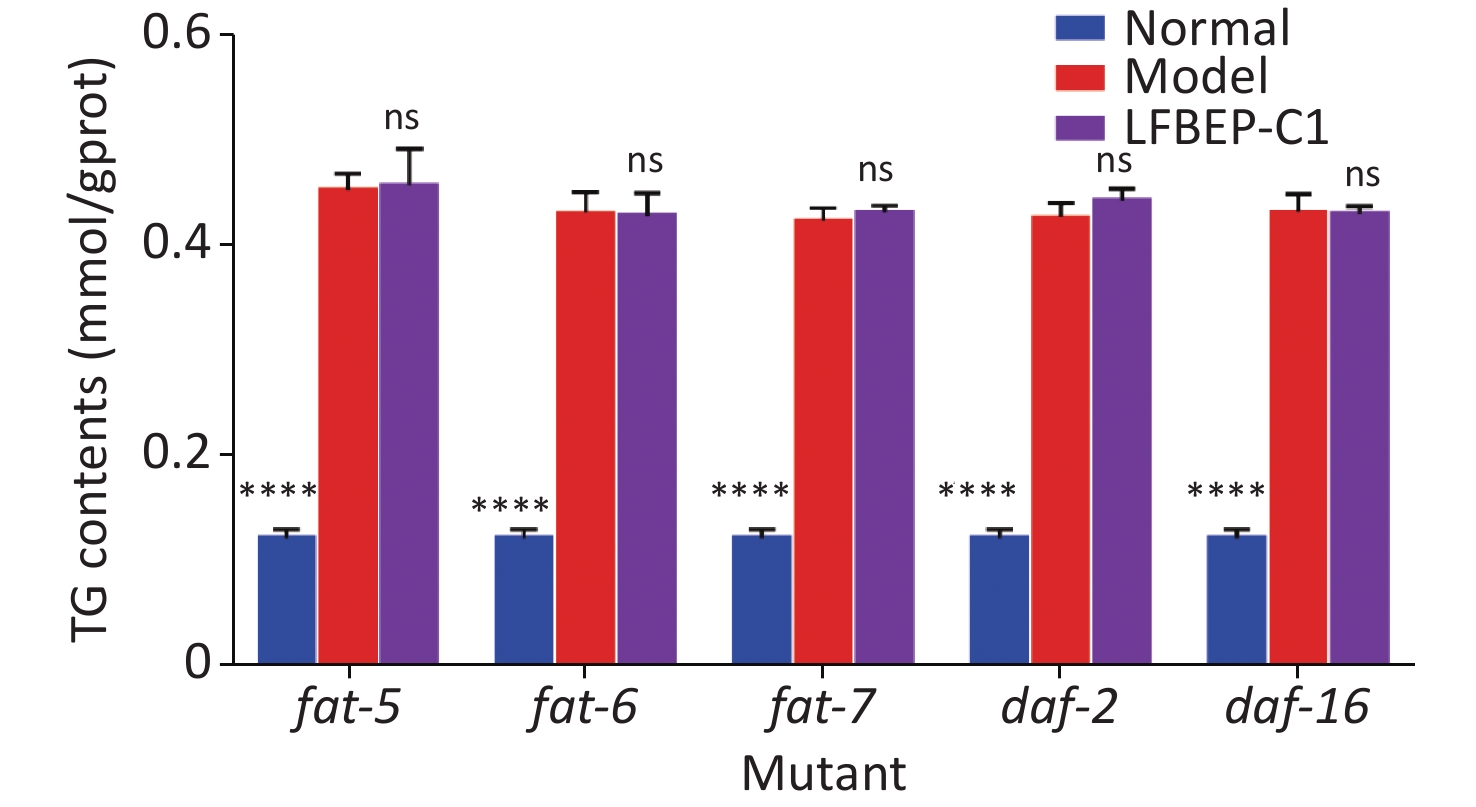
In a previous study, the mechanism by which LFBEP-C1 regulates lipid metabolism in C. elegans was preliminarily revealed using RT-qPCR. Therefore, to further clarify the dependence of the active protein LFBEP-C1 on the lipid metabolism pathway, fat-5, fat-6, fat-7, daf-2, and daf-16 gene-deficient C. elegans were used, as shown in Figure 5. When fat-5, fat-6, fat-7, daf-2, and daf-16 genes were deleted, LFBEP-C1 had no significant inhibitory effect on triglyceride content in C. elegans compared with the model group, indicating that LFBEP-C1 plays a key role in regulating the expression of fat-5, fat-6, fat-7, daf-2, and daf-16 in the lipid metabolism of C. elegans.
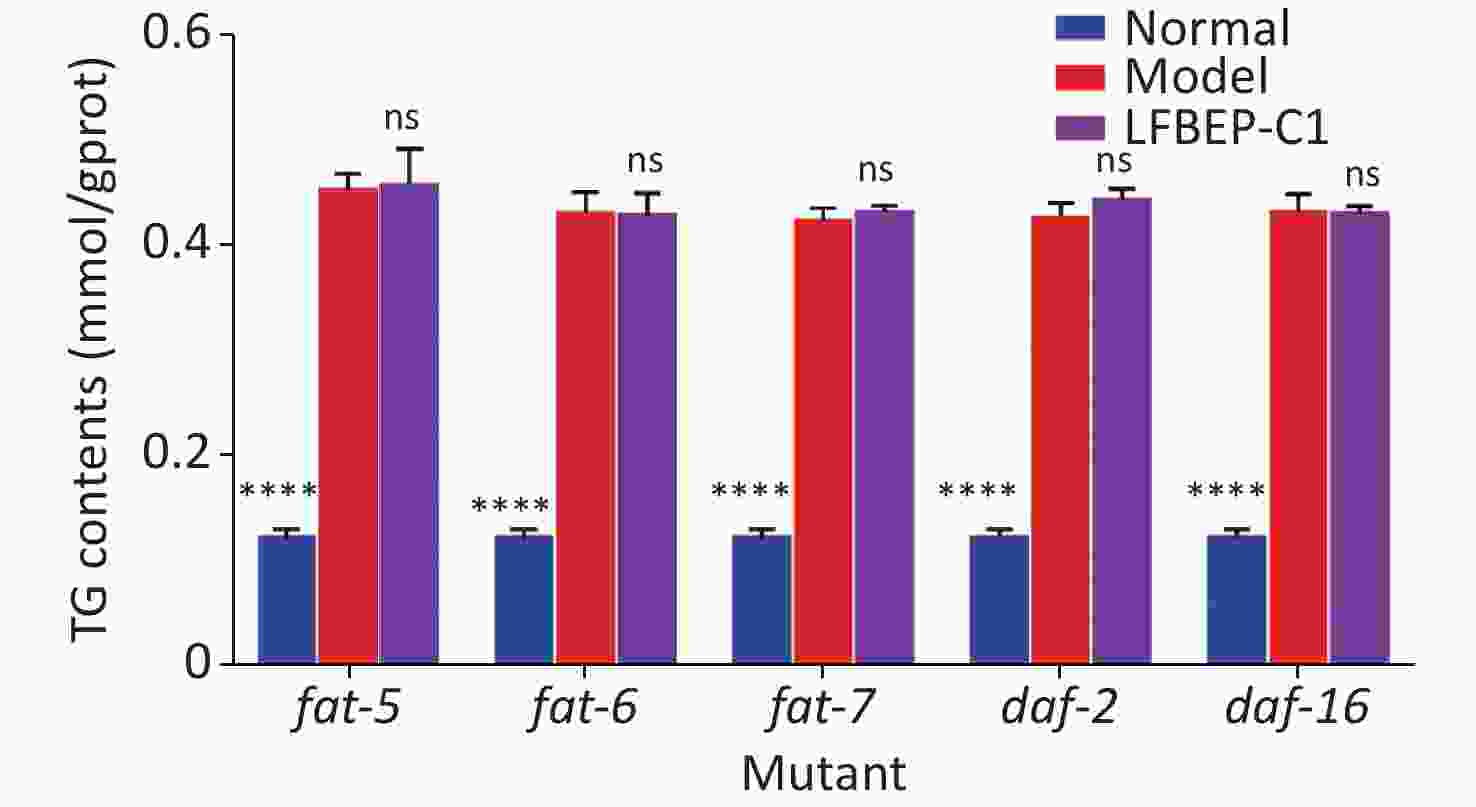
Figure 5. Effect of LFBEP-C1 on the triglyceride amount in deficient C. elegans. All data are expressed as mean ± standard error; each group is significantly different from the model group, and the significance levels are expressed as *P < 0.05, **P < 0.01, ***P < 0.001, and ****P < 0.0001. The model group represents the high-glucose group. ns, no significant difference.
-
Although barley is recognized as a healthy food, its toxicity to nematodes must be tested. To verify whether the extracted active protein (LFBEP-C1) was toxic to C. elegans, the effects of different concentrations of LFBEP-C1 on the growth, development, and longevity of C. elegans were studied. Many studies have shown that some active ingredients can enhance the stress resistance of nematodes without affecting their normal lifespan. Vayndorf et al. showed that the mean and maximum lifespans of nematodes were significantly extended after treatment with whole apple extract[15]. Therefore, the above experimental results show that a high-glucose diet has adverse effects on the growth, development, and lifespan of nematodes, which may be because a high-glucose diet promotes lipid accumulation in nematodes, whereas LFBEP-C1 can improve the effects of a high-glucose diet on the growth, development, and lifespan of nematodes.
The movement behavior of C. elegans is mainly reflected in the head-swing and body-bending frequencies. The higher the movement frequency of C. elegans, the higher the energy consumption and the lower the degree of lipid accumulation. A high-glucose diet decreases the movement behavior of C. elegans and increases lipid accumulation, which slows down metabolism in the body, ultimately causing metabolic diseases and leading to a shorter lifespan. The movement behavior of C. elegans is related to energy consumption, and their movement frequency is positively correlated with energy consumption[9]. Lipid deposition in C. elegans decreases with increasing energy consumption. Studies have shown that Eucommia ulmoides and Cassia extracts can have a beneficial effect on the movement behavior of C. elegans, and these two extracts have a lipid-lowering effect[16]. Xiao et al. found that β-glucan in barley extract fermented by L. plantarum can also increase the energy consumption of C. elegans by increasing the movement frequency, resulting in a decrease in lipid accumulation, which is similar to the results of this study[17].
It is well known that all the strength of exercise capacity affects energy consumption and that high energy consumption promotes fat decomposition, resulting in reduced lipid accumulation. C. elegans fed a high-glucose diet increase their body triglyceride levels, resulting in increased lipid accumulation, whereas the exercise capacity of high-fat C. elegans decreases, resulting in metabolic diseases and affecting their lifespan[9]. In a previous study, the amino acid sequence of LFBEP-C1 was subjected to a BLAST homology analysis. It was found that LFBEP-C1 belonged to serine protease inhibitors (Supplementary Information). Previous studies have shown that serine protease inhibitors inhibit lipid accumulation in C. elegans. Li et al. studied the effect of a recombinant buckwheat trypsin inhibitor (a serine protease inhibitor) on lipid accumulation in C. elegans[18]. The recombinant buckwheat trypsin inhibitor was used. The lipid accumulation and triglyceride content in C. elegans were reduced by 38.6% and 38.57%, respectively, indicating that recombinant buckwheat protease inhibitor had a certain inhibitory effect on lipid accumulation in C. elegans under a high-glucose diet, which is similar to the results of this study.
The above results showed that a high-glucose diet had adverse effects on the growth, development, longevity, and exercise capacity of C. elegans and increased lipid accumulation. LFBEP-C1 effectively reduced the damage caused by a high-glucose diet to C. elegans. Therefore, the active protein LFBEP-C1 could effectively interfere with lipid metabolism in C. elegans. However, the specific mechanism requires further study.
In mammals, the transcription factor SREBP plays an important role in regulating the biosynthesis of fatty acids, triglycerides, and cholesterol, and sbp-1 is a homologous gene of SREBP in C. elegans, which plays an important role in regulating fatty acid and cholesterol metabolism[3,19]. MDT-15 is a medium for fatty acid metabolism that can be used as an activator of sbp-1 and sbp-1 to regulate lipid metabolism in C. elegans. In addition, fat-5, fat-6, and fat-7 are important target genes in the downstream pathway of sbp-1, which may be involved in the regulation of desaturases[20]. fat-5 is involved in coding palmitoyl coenzyme A desaturase, whereas fat-6 and fat-7 encode stearoyl coenzyme A desaturase. Therefore, the expression of sbp-1, mdt-15, fat-5, fat-6, and fat-7 was determined to determine the effect of LFBEP-C1 on the SREBP signaling pathway in C. elegans. LFBEP-C1 regulates lipid metabolism by mediating the expression of genes related to the SREBP signaling pathway in C. elegans. Many studies have shown that naturally active substances can inhibit fat synthesis in C. elegans by inhibiting the mRNA expression of related genes in this pathway, thereby achieving a lipid-lowering effect. Bai et al. found that mushroom polysaccharides inhibit fat synthesis in C. elegans by downregulating mdt-15, sbp-1, fat-5, and fat-6 mRNA expression levels[8]. In addition, Li et al. found that a recombinant buckwheat trypsin inhibitor (a serine protease inhibitor) can reduce fatty acid synthesis and lipid accumulation by regulating the expression of sbp-1 in C. elegans[18].
In C. elegans, daf-2 and daf-16 are key genes involved in the insulin signaling pathway and thus regulate lipid metabolism and longevity[21]. Among these, daf-2, a homolog of the insulin growth factor receptor in mammals, is the only receptor involved in the insulin signaling pathway in C. elegans. It can inhibit the expression of daf-16 in C. elegans by activating the homologous gene ace-1 of phosphatidylinositol 3-kinase in C. elegans[22]. LFBEP-C1 regulates lipid metabolism in nematodes by mediating the expression of genes related to the insulin signaling pathway. Studies have found that oats can reduce lipid accumulation by mediating the expression of daf-2 and daf-16 mRNA in nematodes, prolonging the lifespan of nematodes and improving lipid metabolism disorders caused by a high-glucose diet. Similar results have been reported for oats[23]. They also found that prowashonupana barley dietary fiber improved lipid metabolism by regulating the insulin signaling pathways in the C. elegans model[24].
5-HT plays a key role in regulating energy balance and fat metabolism. In mammals, evidence shows that the 5-HT receptor is an important intermediary for central 5-HT to inhibit feeding; therefore, it can increase the level of central 5-HT or activate the 5-HT receptor to regulate lipid metabolism in animals[25,26]. In wild-type C. elegans, 5-HT is synthesized by tryptophan hydroxylase (TPH), and tph-1 is the key gene for tryptophan carboxylase synthesis, which can promote the expression of tryptophan carboxylase and increase the level of 5-HT. Genes encoding 5-HT receptors include mod-1, mod-5, and ser-1[27]. In addition, studies have shown that 5-HT promotes the expression of acs-2, an important gene encoding mitochondrial acyl coenzyme A synthase, and related genes involved in mitochondrial beta-oxidation to regulate fatty acid metabolism in C. elegans[28]. In conclusion, LFBEP-C1 effectively reduced lipid accumulation in C. elegans by mediating the SREBP, insulin, and 5-HT signaling pathways.
Barley Protein LFBEP-C1 from Lactiplantibacillus plantarum dy-1 Fermented Barley Extracts by Inhibiting Lipid Accumulation in a Caenorhabditis elegans Model
doi: 10.3967/bes2024.042
- Received Date: 2023-05-16
- Accepted Date: 2023-08-23
-
Key words:
- LFBEP-C1 /
- Fermentation /
- Protein /
- Caenorhabditis elegans /
- Lipid accumulation /
- Signaling pathway
Abstract:
| Citation: | ZHANG Jia Yan, LIU Meng Ting, LIU Yu Hao, DENG Huan, BAI Juan, XIE Jian Hua, XIAO Xiang. Barley Protein LFBEP-C1 from Lactiplantibacillus plantarum dy-1 Fermented Barley Extracts by Inhibiting Lipid Accumulation in a Caenorhabditis elegans Model[J]. Biomedical and Environmental Sciences, 2024, 37(4): 377-386. doi: 10.3967/bes2024.042 |




 Quick Links
 DownLoad:

