


-
Dengue fever (DF), identified by the World Health Organization as one of the top 10 disease threats in 2019, has been confirmed as a critical concern due to current outbreaks globally. The mainland of China has witnessed significant DF outbreaks since 1978, with a staggering 655,324 reported cases and 610 fatalities from 1978 to 2008[1]. Notably, Yunnan Province reported its first local transmission in 2008, with twelve indigenous cases in five border regions, marking a pivotal moment in the disease's history in the area[2]. Subsequently, Yunnan has experienced an upsurge in local DF outbreaks, showing an increasing trend since 2010, both in frequency and geographical spread.
The global burden of dengue intensified from 1990 to 2019, coming with three decades of urbanization, climate warming, and heightened human mobility[3]. Dengue epidemics typically follow a seasonal pattern, peaking during and after the rainy season, driven by factors like mosquito populations, temperature, precipitation, and humidity[4-6]. During the hot and rainy seasons in southern China, continuous moderate precipitation begins in April and is accompanied by suitable warm conditions, which may determine the baseline number of mosquitoes. However, the high temperature and heavy rainfall throughout the summer since June may inhibit the vital movement of mosquitoes. Dengue cases peak in September and October when temperature and precipitation are suitable for mosquito reproduction. These elements influence mosquito breeding and feeding patterns, ultimately impacting DF transmission.
The advancement in geographic information technology has spurred the development of sophisticated spatial statistical methods. The adoption of Geographic Information Systems (GIS) and spatial statistics has been extensive[7]. The Geographically Weighted Regression (GWR) model, a key tool in spatial analysis, was initially limited by its exclusive focus on spatial data characteristics[8], overlooking the temporal dimension[9]. To bridge this gap, Prof. Bo Huang proposed the Geographically and Temporally Weighted Regression (GTWR) model, enhancing the original GWR framework to encompass both spatial and temporal data considerations[10]. In Malaysia, this model has been used to study the influencing factors of dengue fever epidemics. This model can better evaluate the spatio-temporal distribution and characteristics of the data and effectively solve the spatio-temporal non-stationarity of the regression model.
This study leverages the GTWR model, implemented using ArcGIS software, to examine the impact of meteorological factors and imported cases on DF epidemics, specifically focusing on the spatial-temporal heterogeneity in border regions. This study can provide favorable evidence for the development of dengue fever prevention and control policies in the border areas of Yunnan Province, and can provide a basis for fair, reasonable, and efficient allocation of health resources for dengue fever prevention and control in Yunnan Province.
-
The focal area of this study is the Yunnan border counties in China, comprising 25 counties. These counties serve as the spatial units for this research, with a temporal scope covering a period of seven years. Yunnan Province, positioned in China's southwestern frontier, spans longitudes 97°31′ E to 106°11′ E and latitudes 21°8′ N to 29°15′ N. It shares extensive borders totaling 4,060 kilometers with Myanmar, Laos, and Vietnam, presenting a unique geographical and geopolitical landscape.
The climatic conditions in Yunnan are predominantly of the subtropical plateau monsoon type, which is characterized by complex three-dimensional climate patterns. Under the Köppen climate classification, much of the province lies within the subtropical highland (Köppen Cwb) or humid subtropical zone (Cwa), with mild to warm winters, and tempered summers, except in the almost tropical south, where temperatures regularly exceed 30 °C in the warmer half of the year. From south to north, Yunnan's climate zones can be divided into the following: northern tropics (Jinghong, Yuanjiang, Hekou, Mengding, Yuanmou, and Lujiangba, etc.), southern subtropics (Mengzi, Jianshui, Kailuan, Funing, Jindong, Nangjian, Luxi, Huaping, and Dongchuan, etc.), central subtropics (Maidu, Fengqing, Shidian, Yuxi, Yilang, Mile, Guangnan, Qiu Bei, Bingchuan, and Fugong as well as Yanting, Suijiang, and Yongshan, etc.), and northern subtropics (Kunming Dali, Chuxiong, Baoshan, etc.), South Temperate Zone (Lijiang, northern Dali, northern Qujing and Zhaotong, etc.), Middle Temperate Zone (Northeastern Yunnan and Northwestern Yunnan in the area of about 2,500–3,000 m above sea level), and Alpine Mountainous Zone (Deqin, Zhongdian, Weixi, etc.), totaling 7 climate types. The province experiences clearly defined dry and wet seasons, with temperature changes profoundly influenced by altitude[11]. The climatic zones in Yunnan border areas vary significantly: the northwest experiences a cold climate with prolonged winters, while the southeast enjoys a constant spring-like temperate climate. The southwest and southern borders, extending into the tropics, feature low-heat valley climates.
-
Data of confirmed dengue fever cases and population data from 2013 to 2019 were extracted from the China Disease Control and Prevention Information System (CDCIS). This dataset covered the border counties and districts of Yunnan Province, with each county designated as a spatial unit and the data organized on an annual basis.
Meteorological data were obtained from the Resource and Environment Science and Data Center (RESDC). The collected data encompassed temperature, precipitation, relative humidity, barometric pressure, hours of sunshine, and wind speed at 2 meters above the ground, all collated on an annual scale to match the dengue fever case data. The variables and their specific details are systematically listed in Table 1.
Variables Explanation $ \widehat{y} $ Indigenous dengue fever incidence (/100,000) X1 Average annual temperature (°C) X2 Average annual precipitation (mm) X3 Average annual relative humidity (%) X4 Average annual wind speed (m/s) X5 Imported case (no. of cases) Table 1. List of variables
-
Both Ordinary Least Square (OLS) regression and GTWR were used to investigate the relationship between dengue incidence and climatological factors. Additionally, to address potential multicollinearity issues, the Variance Inflation Factor (VIF) was calculated for each variable.
OLS regression examines the effects of independent factors on a dependent variable across the entire study area. A limitation of OLS is its inability to account for local variations in the influencing factors, which can be critical in geographical studies. GTWR, by contrast, incorporates both spatial and temporal influences, thereby facilitating a more comprehensive analysis of the spatio-temporal heterogeneity of the factors[12].
The GTWR model integrates spatial and temporal weighting functions in its parameter estimation, defined as follows:
$$ {Y}_{it}={\beta }_{0}\left({u}_{i},{v}_{i}{,t}_{i}\right)+{\sum }_{k=1}^{p}{\beta }_{k}\left({u}_{i},{v}_{i}{,t}_{i}\right){X}_{ik}+{\epsilon }_{i} $$ (1) where \((u_i, v_i, t_i)\) represents the geographical location (longitude and latitude) and observation time for county \(i\), \(X_{ik}\) denotes the influencing factors, and \(\epsilon_i\) is the error term at location \(i\)[13].
$$ {d}_{ij}=\sqrt{\lambda \left[\left({u}_{i}-{u}_{j}\right)+\left({v}_{i}-{v}_{j}\right)\right]+{\mu \left({t}_{i}-{t}_{j}\right)}^{2}} $$ (2) $ \lambda $ and $ \mu $ are scale factors used to measure location and time difference. Distance in equation (2) as a basis in weighting data to estimate GTWR model parameters. The closer the distance between the expected points each county, the greater the weight of the data during the estimation. In this study, data weighting is done by using the adaptive Gaussian kernel function[14].
$$ {w}_{ij}=\text{exp} \left(-{\left({d}_{ij}/ h\right)}^{2}\right) $$ (3) Where, $ h $ is the constant bandwidth performed by the Incremental Spatial Autocorrelation (ISA) method. The Adaptive Gaussian kernel function is used in forming a weighted matrix.
$$ W\left({u}_{i},{v}_{i}{,t}_{i}\right)=diag\left(W\left({u}_{1},{v}_{1}{,t}_{1}\right),\cdots,W\left({u}_{n},{v}_{n}{,t}_{n}\right)\right) $$ (4) Each observed data has one weighted matrix $ W\left({u}_{i},{v}_{i}{,t}_{i}\right) $ in estimating the parameters. Using the algebraic matrix approach and the Weighted least square (WLS) method, the parameter estimation can be written
$$ \widehat{\beta }\left({u}_{i},{v}_{i}{,t}_{i}\right)={\left({X}^{T}W\left({u}_{i},{v}_{i}{,t}_{i}\right)X\right)}^{-1}{X}^{T}W\left({u}_{i},{v}_{i}{,t}_{i}\right) $$ (5) The GTWR model's significance is evaluated against a null hypothesis that tests the function \(\beta_k(u_i, v_i)\) for each coordinate \((u_i, v_i)\) of the research location. Rejection of the null hypothesis indicates the suitability of the GTWR model for the data.
The effectiveness and complexity of the OLS and GTWR models are compared using the coefficient of determination (\(R^2\)) and Akaike’s Information Criterion corrected (AICc)[15]. These metrics assess the models’ fitting effectiveness and allow for a comparison of their respective efficacies.
-
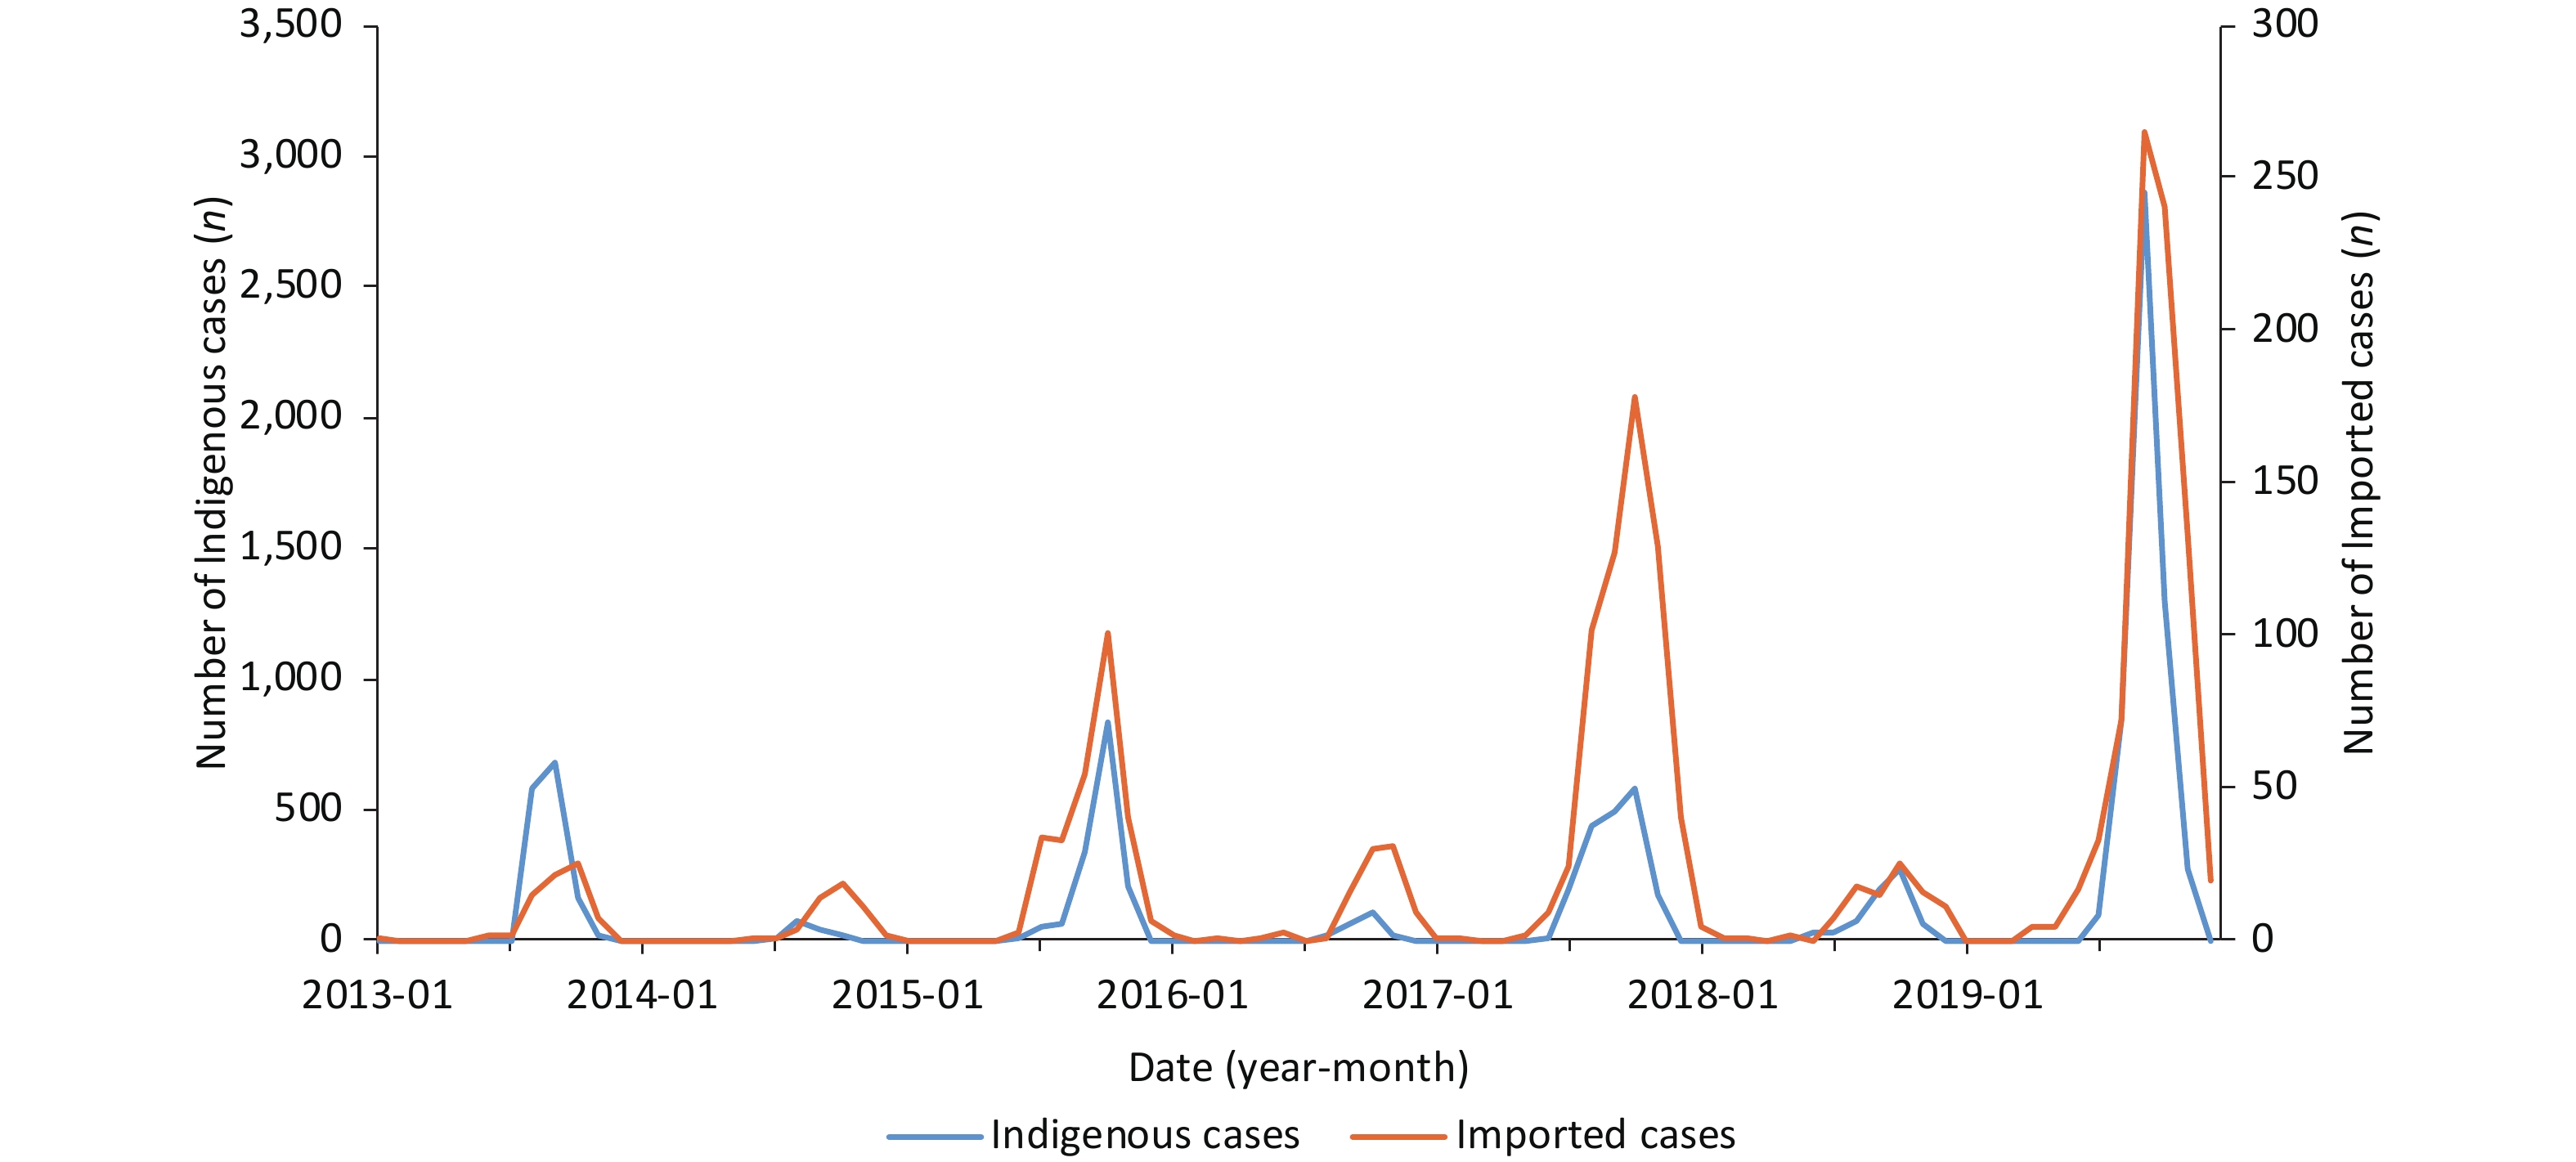
As shown in Figure 1, from 2013 to 2019, a total of 13,264 dengue cases were reported in the Yunnan border counties, including 11,266 indigenous and 1,998 imported cases. The data exhibited a distinct seasonal pattern, with a surge in cases from July to November, peaking in September and October. Notably, imported cases predominantly occurred in the first half of the year, followed by a later onset of indigenous cases.

Figure 1. Yunnan border counties dengue fever monthly cases from January 2013 to December 2019.
Among the twenty-five counties bordering Myanmar, Laos, and Vietnam, a striking 93.34% (12,381 cases) of dengue fever cases were reported in the seventeen counties adjoining Myanmar, predominantly as indigenous cases (84.80%). Mengla and Jiangcheng, primarily bordering Laos, accounted for 5.74% (762 cases) of the cases, mostly indigenous (85.70%). The counties bordering Vietnam reported 0.88% (117 cases) of the total, with a majority being imported cases (97.44%). Jinghong, Ruili, and Gengma were the most affected counties, with 7,652, 3,010, and 801 cases respectively, representing 57.69%, 22.69%, and 6.04% of the total cases. Detailed distribution is provided in Table 2.
County Types of dengue fever case Total Indigenous cases Imported cases Border with Myanmar 10,499 1,882 12,381 Jinghong 7,571 81 7,652 Ruili 2,373 637 3,010 Gengma 502 299 801 Mangshi 18 33 51 Menglian 15 22 37 Longchuan 13 69 82 Yingjiang 7 154 161 Zhenkang 0 311 311 Menghai 0 210 210 Tengchong 0 45 45 Longling 0 11 11 Cangyuan 0 7 7 Lancang 0 2 2 Ximeng 0 1 1 Fugong 0 0 0 Lushui 0 0 0 Gongshan 0 0 0 Border with Laos and Myanmar 650 108 758 Mengla 650 108 758 Border with Laos and Vietnam 3 1 4 Jiangcheng 3 1 4 Border with Vietnam 114 7 121 Hekou 114 3 117 Jinping 0 2 2 Lvchun 0 1 1 Funing 0 1 1 Malipo 0 0 0 Maguan 0 0 0 Total 11,266 1,998 13,264 Table 2. Distribution of dengue cases in different categories
The study observed notable annual variations in dengue fever (DF) cases in Yunnan border areas. Significant outbreaks occurred in 2013, 2015, 2017, and 2019, with 2019 witnessing the highest incidence, recording 5,371 cases. These fluctuations highlight the dynamic nature of DF transmission over the years. The risk factors contributing to these variations are summarized in Table 3. The border areas of Yunnan Province exhibited an average annual mean temperature of 19.18 °C, average annual mean precipitation of 3.85 mm, relative humidity of 77.32%, and wind speed of 1.42 m/s for the years 2013 to 2019. The prevailing hot and humid conditions in the region are conducive to mosquito breeding.
Variables x Min 1st Q M 3rd Q Max Average annual temperature (°C) 19.18 13.08 18.81 19.59 20.04 21.62 Average annual precipitation (mm) 3.85 2.31 3.38 3.83 4.31 5.63 Average annual relative humidity (%) 77.32 66.26 74.52 77.49 79.78 86.27 Average annual wind speed (m/s) 1.42 1.07 1.23 1.37 1.60 2.10 Imported case (no. of cases) 11.42 0 0 0 3 259 Note. x, mean; Min, minimum; 1st Q, first quartile; M, median; 3rd Q, third quartile; Max, maximum. Table 3. Statistical description of potential risk factors of dengue fever
-
The regression modeling of data sets using OLS yields a value of P < 0.001, which is this value of P is greater than the significance level of 0.01. The result indicates that the model contains autocorrelation. The OLS regression model can be written as
$$ \widehat{y}= -137.34 + 7.82X_{1} - 12.47X_{2} + 1.57X_{3} - 25.95X_{4} + 0.60X_{5} $$ As detailed in Table 4, the P-values for the regression coefficients were greater than 0.05 for all variables, except for temperature (P = 0.03) and the number of imported cases (P < 0.01). This suggests that both temperature and imported cases significantly impact the incidence of indigenous dengue fever in the Yunnan border area. The analysis revealed positive correlations with the average annual temperature and the number of imported cases. Specifically, a 1 °C increase in average annual temperature is associated with a 7.82/100,000 increase in indigenous dengue fever incidence, and each additional imported case is linked to a 0.60/100,000 increase in incidence. The VIF values for all variables were below 10, indicating no significant issues with covariance among the predictors.
Variables β sx t P VIF Intercept −137.34 118.79 −1.48 0.14 Average annual temperature (°C), X1 7.82 3.51 2.23 0.03* 1.22 Average annual precipitation (mm), X2 −12.47 9.38 −1.33 0.17 1.49 Average annual relative humidity (%), X3 1.57 1.81 0.87 0.39 1.75 Average annual wind speed (m/s), X4 −25.95 23.28 −1.11 0.27 1.28 Imported case (no. of cases), X5 0.60 0.16 3.76 < 0.01* 1.09 AICc: 1990.14 R2: 0.15 RSS: 819367.91 Note. β, standardized regression coefficient; sx, standard error; *Fisher’s exact test; VIF, variance inflation factor; AICc, Akaike’s information criterion corrected; R2, R square; RSS, residual square summary. Table 4. Analysis results of OLS regression model
-
The GTWR model identified an optimal bandwidth (h) of 0.48717. In terms of model fit, the GTWR model demonstrated an \(R^2\) value of 0.20, indicating a better fit than the OLS model. Furthermore, the GTWR model yielded a lower Akaike’s Information Criterion corrected (AICc) value of 1987.98, compared to that of the OLS model, suggesting improved model efficiency.
Analysis of the GTWR results revealed that average annual temperature, relative humidity, and the number of imported cases positively influenced the incidence of indigenous dengue fever. Conversely, average annual precipitation and wind speed were negatively correlated with indigenous dengue incidence, as detailed in Table 5. These findings align with the results obtained from the OLS analysis.
Variables x min 1st Q M 3rd Q max Average annual temperature (°C), X1 9.71 3.64 7.11 10.55 12.61 15.21 Average annual precipitation (mm), X2 −14.57 −19.88 −16.96 −15.68 −12.88 −6.05 Average annual relative humidity (%), X3 1.92 0.20 0.84 2.00 3.06 3.60 Average annual wind speed (m/s), X4 −21.22 −29.79 −22.81 −20.27 −19.09 −16.30 Imported case (no. of cases), X5 0.59 0.54 0.57 0.58 0.61 0.68 Note. x, mean; Min, minimum; 1st Q, first quartile; M, median; 3rd Q, third quartile; Max, maximum; GTWR, geographically and Ttemporally weighted regression. Table 5. Fitting coefficients of risk factors included in GTWR model
-
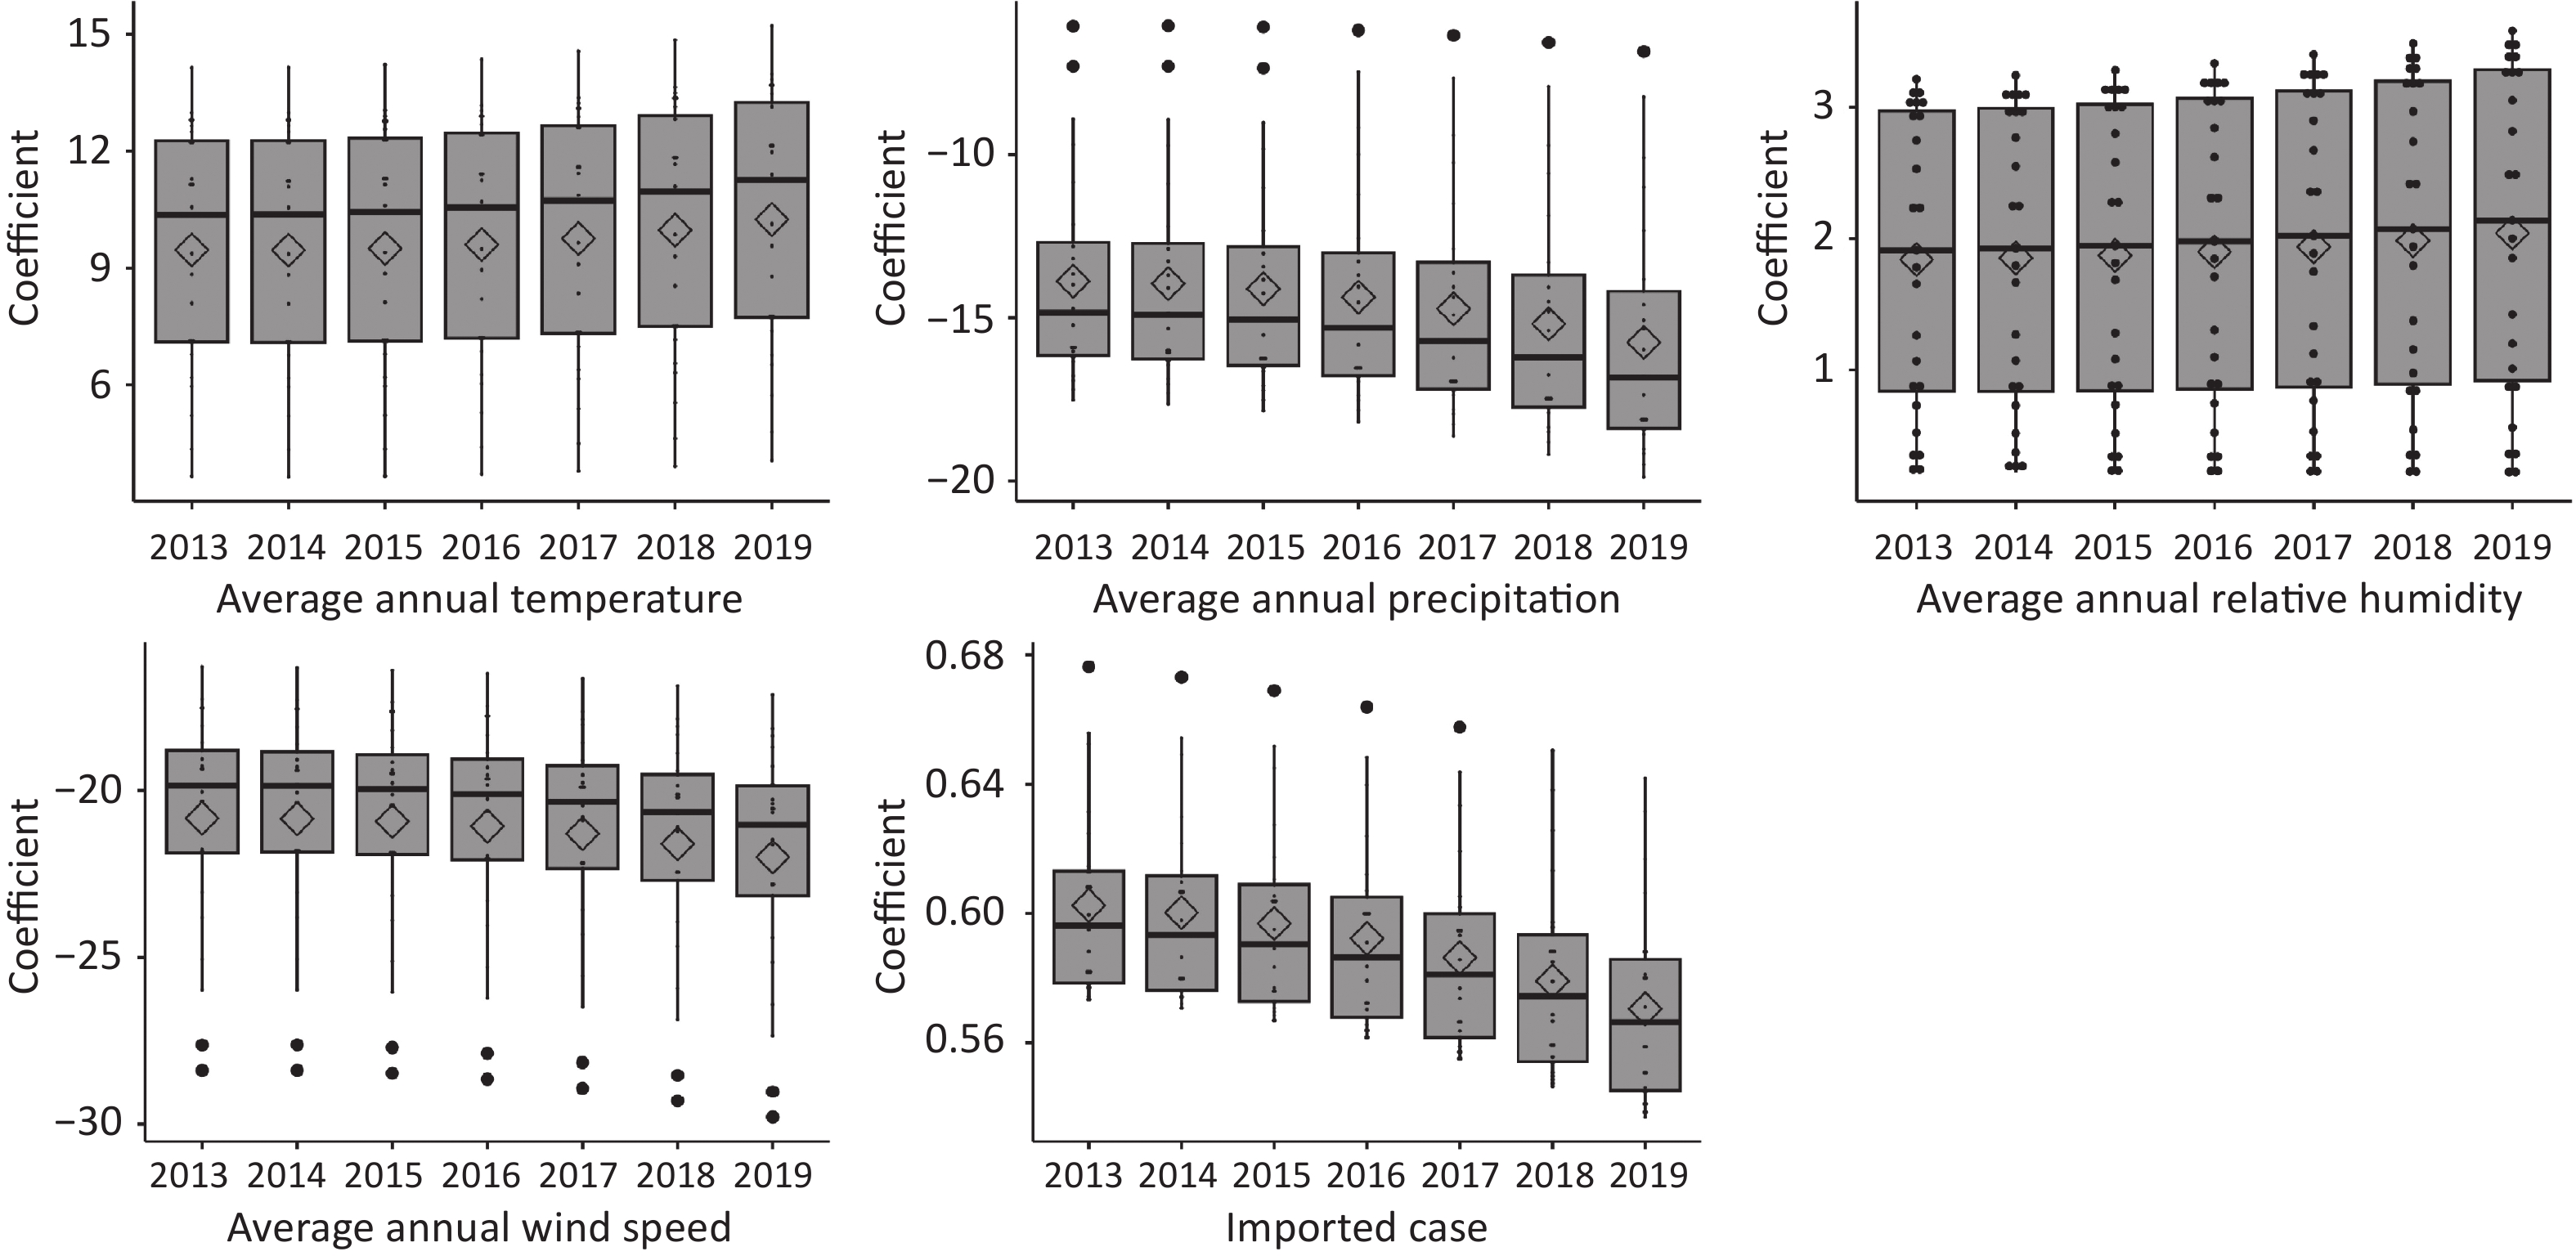
The GTWR model’s fitted coefficients reveal insightful temporal dynamics in the influence of various variables on local dengue incidence. These temporal distributions for each variable have been graphically represented in Figure 2. The analysis highlights a distinct time-trend change in the effects of each variable.

Figure 2. Time distribution of fitted coefficients for each variable.
While the direction of the variables’ effects on the incidence of indigenous dengue fever remained consistent over time, notable trends were observed in the intensity of their effects. Both temperature and relative humidity exhibited an increasing trend in their intensity of effect over the years. In contrast, precipitation, wind speed, and the influence of imported cases showed a general decreasing trend year over year.
-
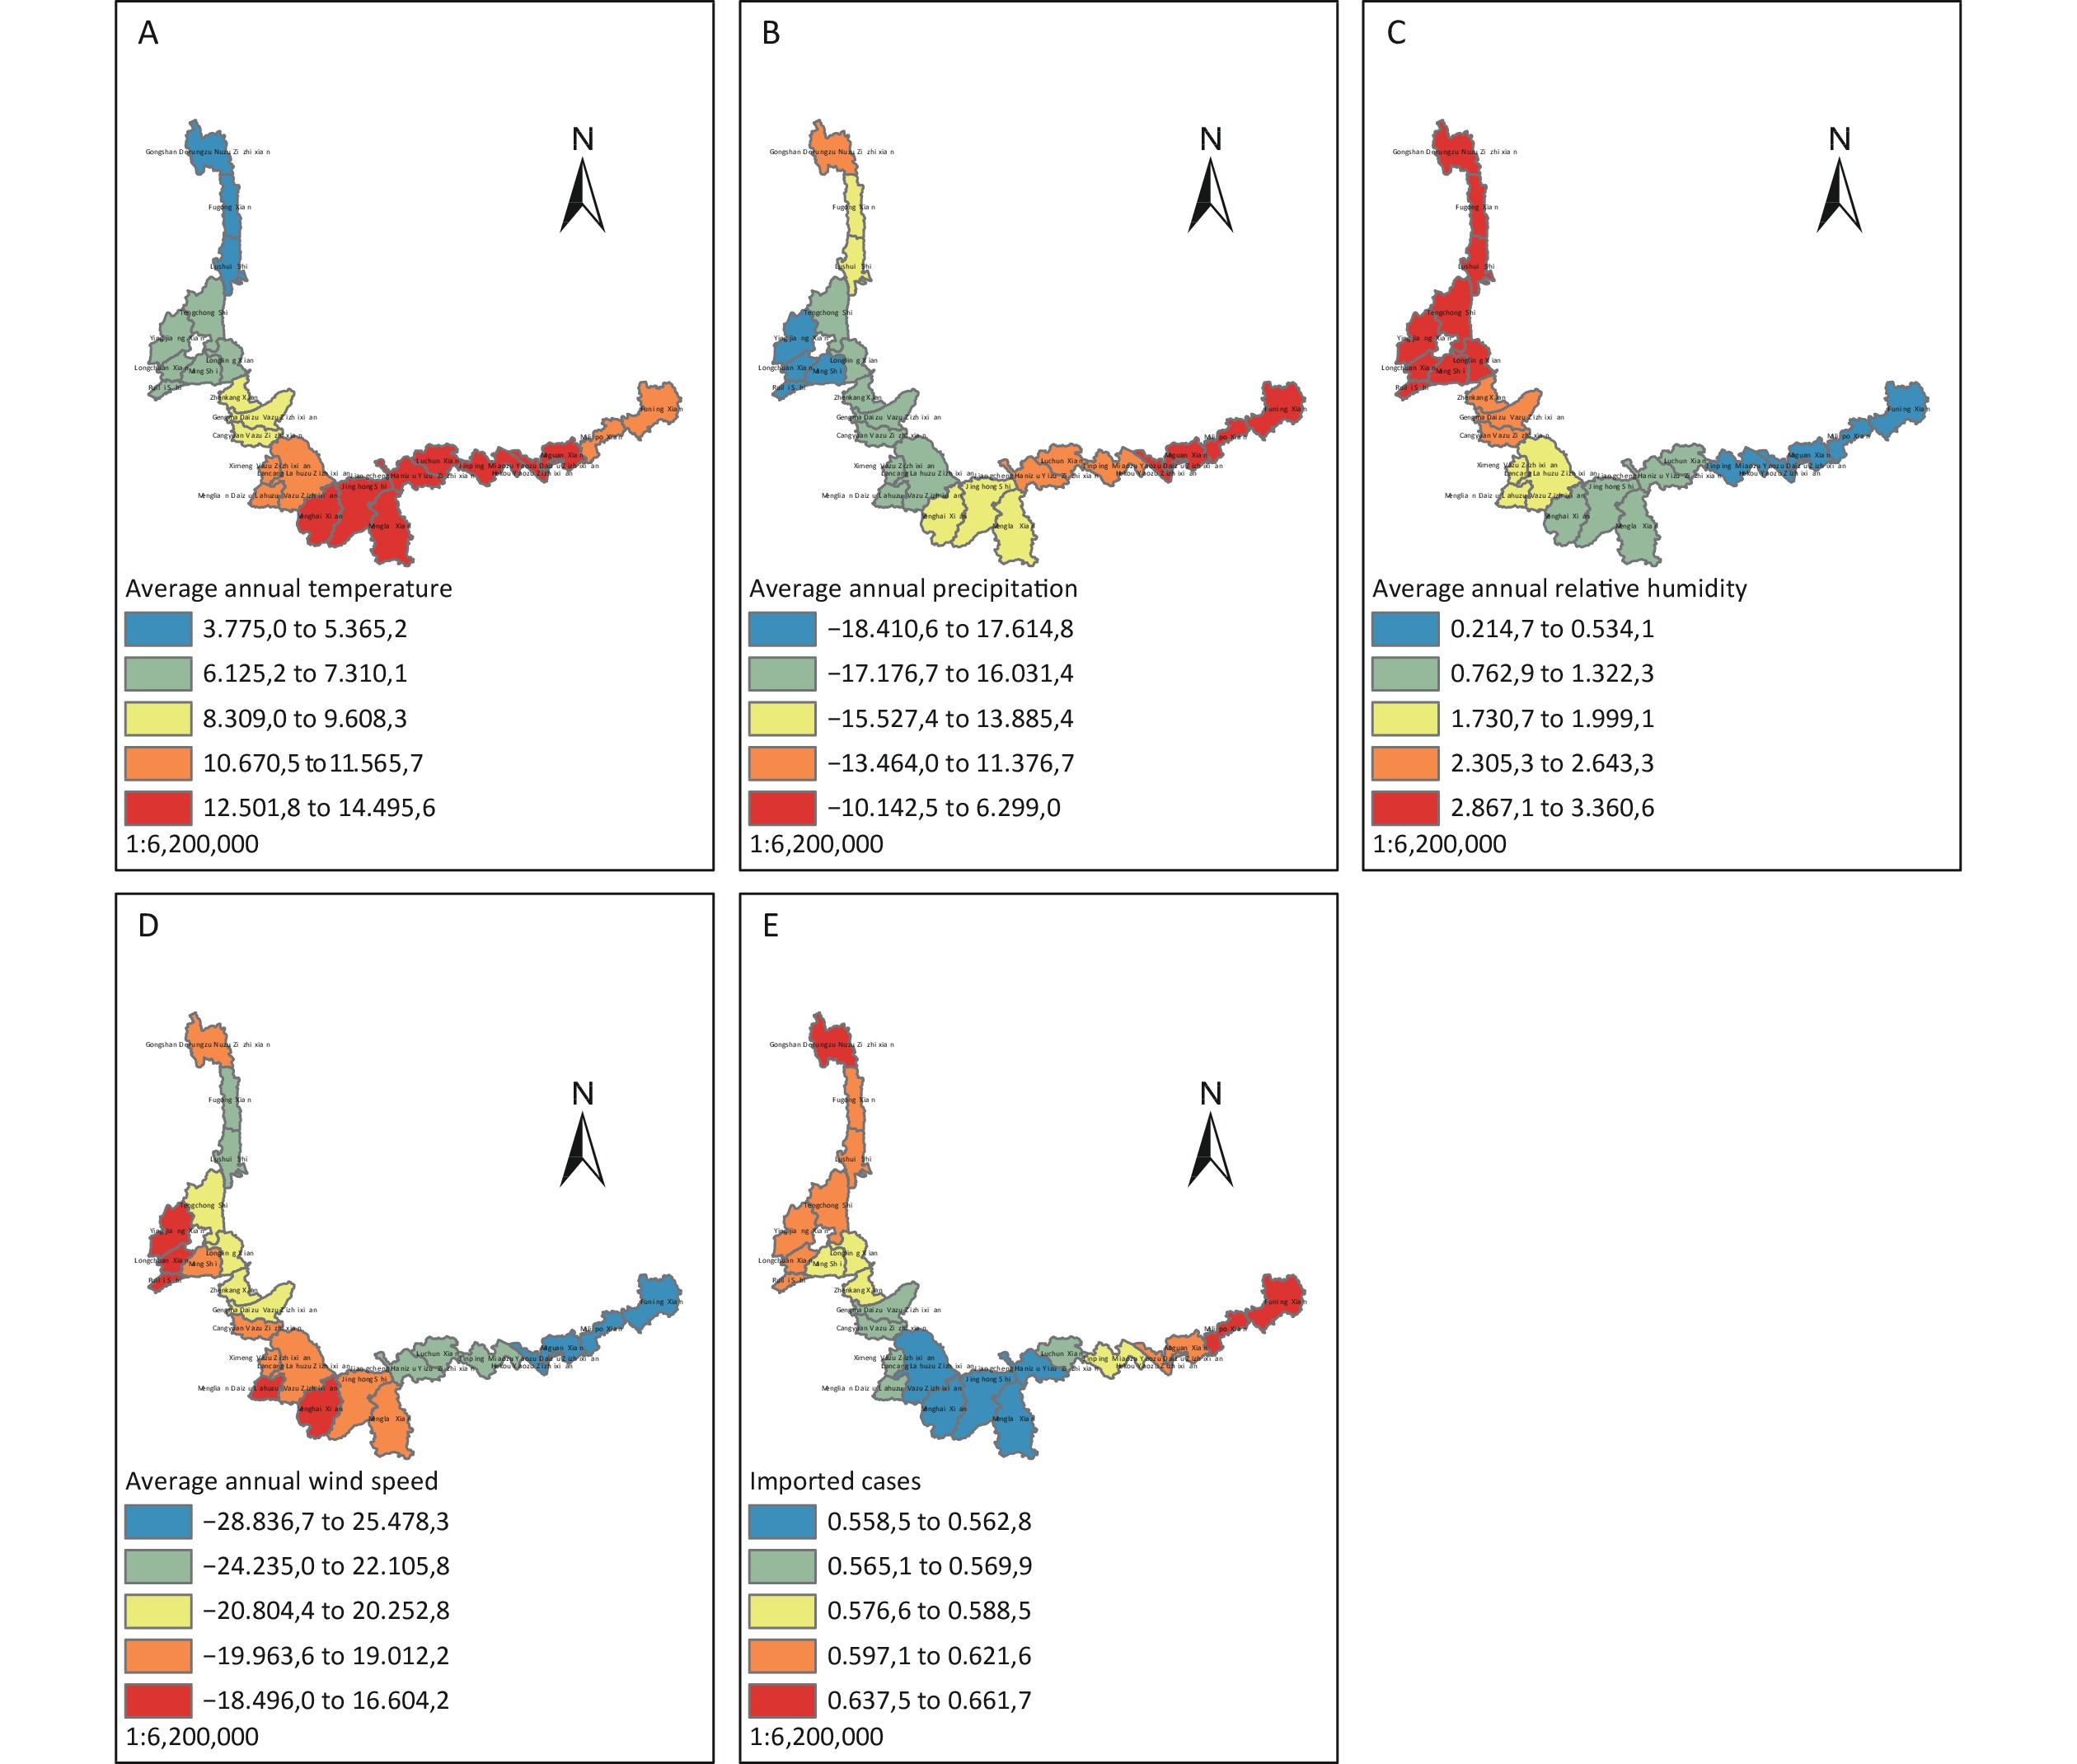
The GTWR model’s significant advantage lies in its ability to capture the spatial and temporal variability of independent variables' effects on the dependent variable. As shown in Figure 3, the spatial distribution of fitted coefficients in the GTWR model highlighted distinct spatial patterns: the influence of average annual temperature was notably higher in Yunnan southern subtropical border counties, like Jinghong and Mengla, and lower in the northwestern regions. Average annual precipitation had a minimal impact on eastern border counties, while the effect of average annual relative humidity decreased from west to east along the border. The impact of wind speed was observed to be higher at the extremities and lower in the central regions, particularly affecting counties such as Ruili and Menglian. Interestingly, the distribution of the effect of imported cases showed high influence at both ends of the border and a lower impact in the middle. These findings underscore the spatial variability of climatic factors and imported cases in influencing dengue incidence, highlighting the need for region-specific approaches in dengue prevention and control.
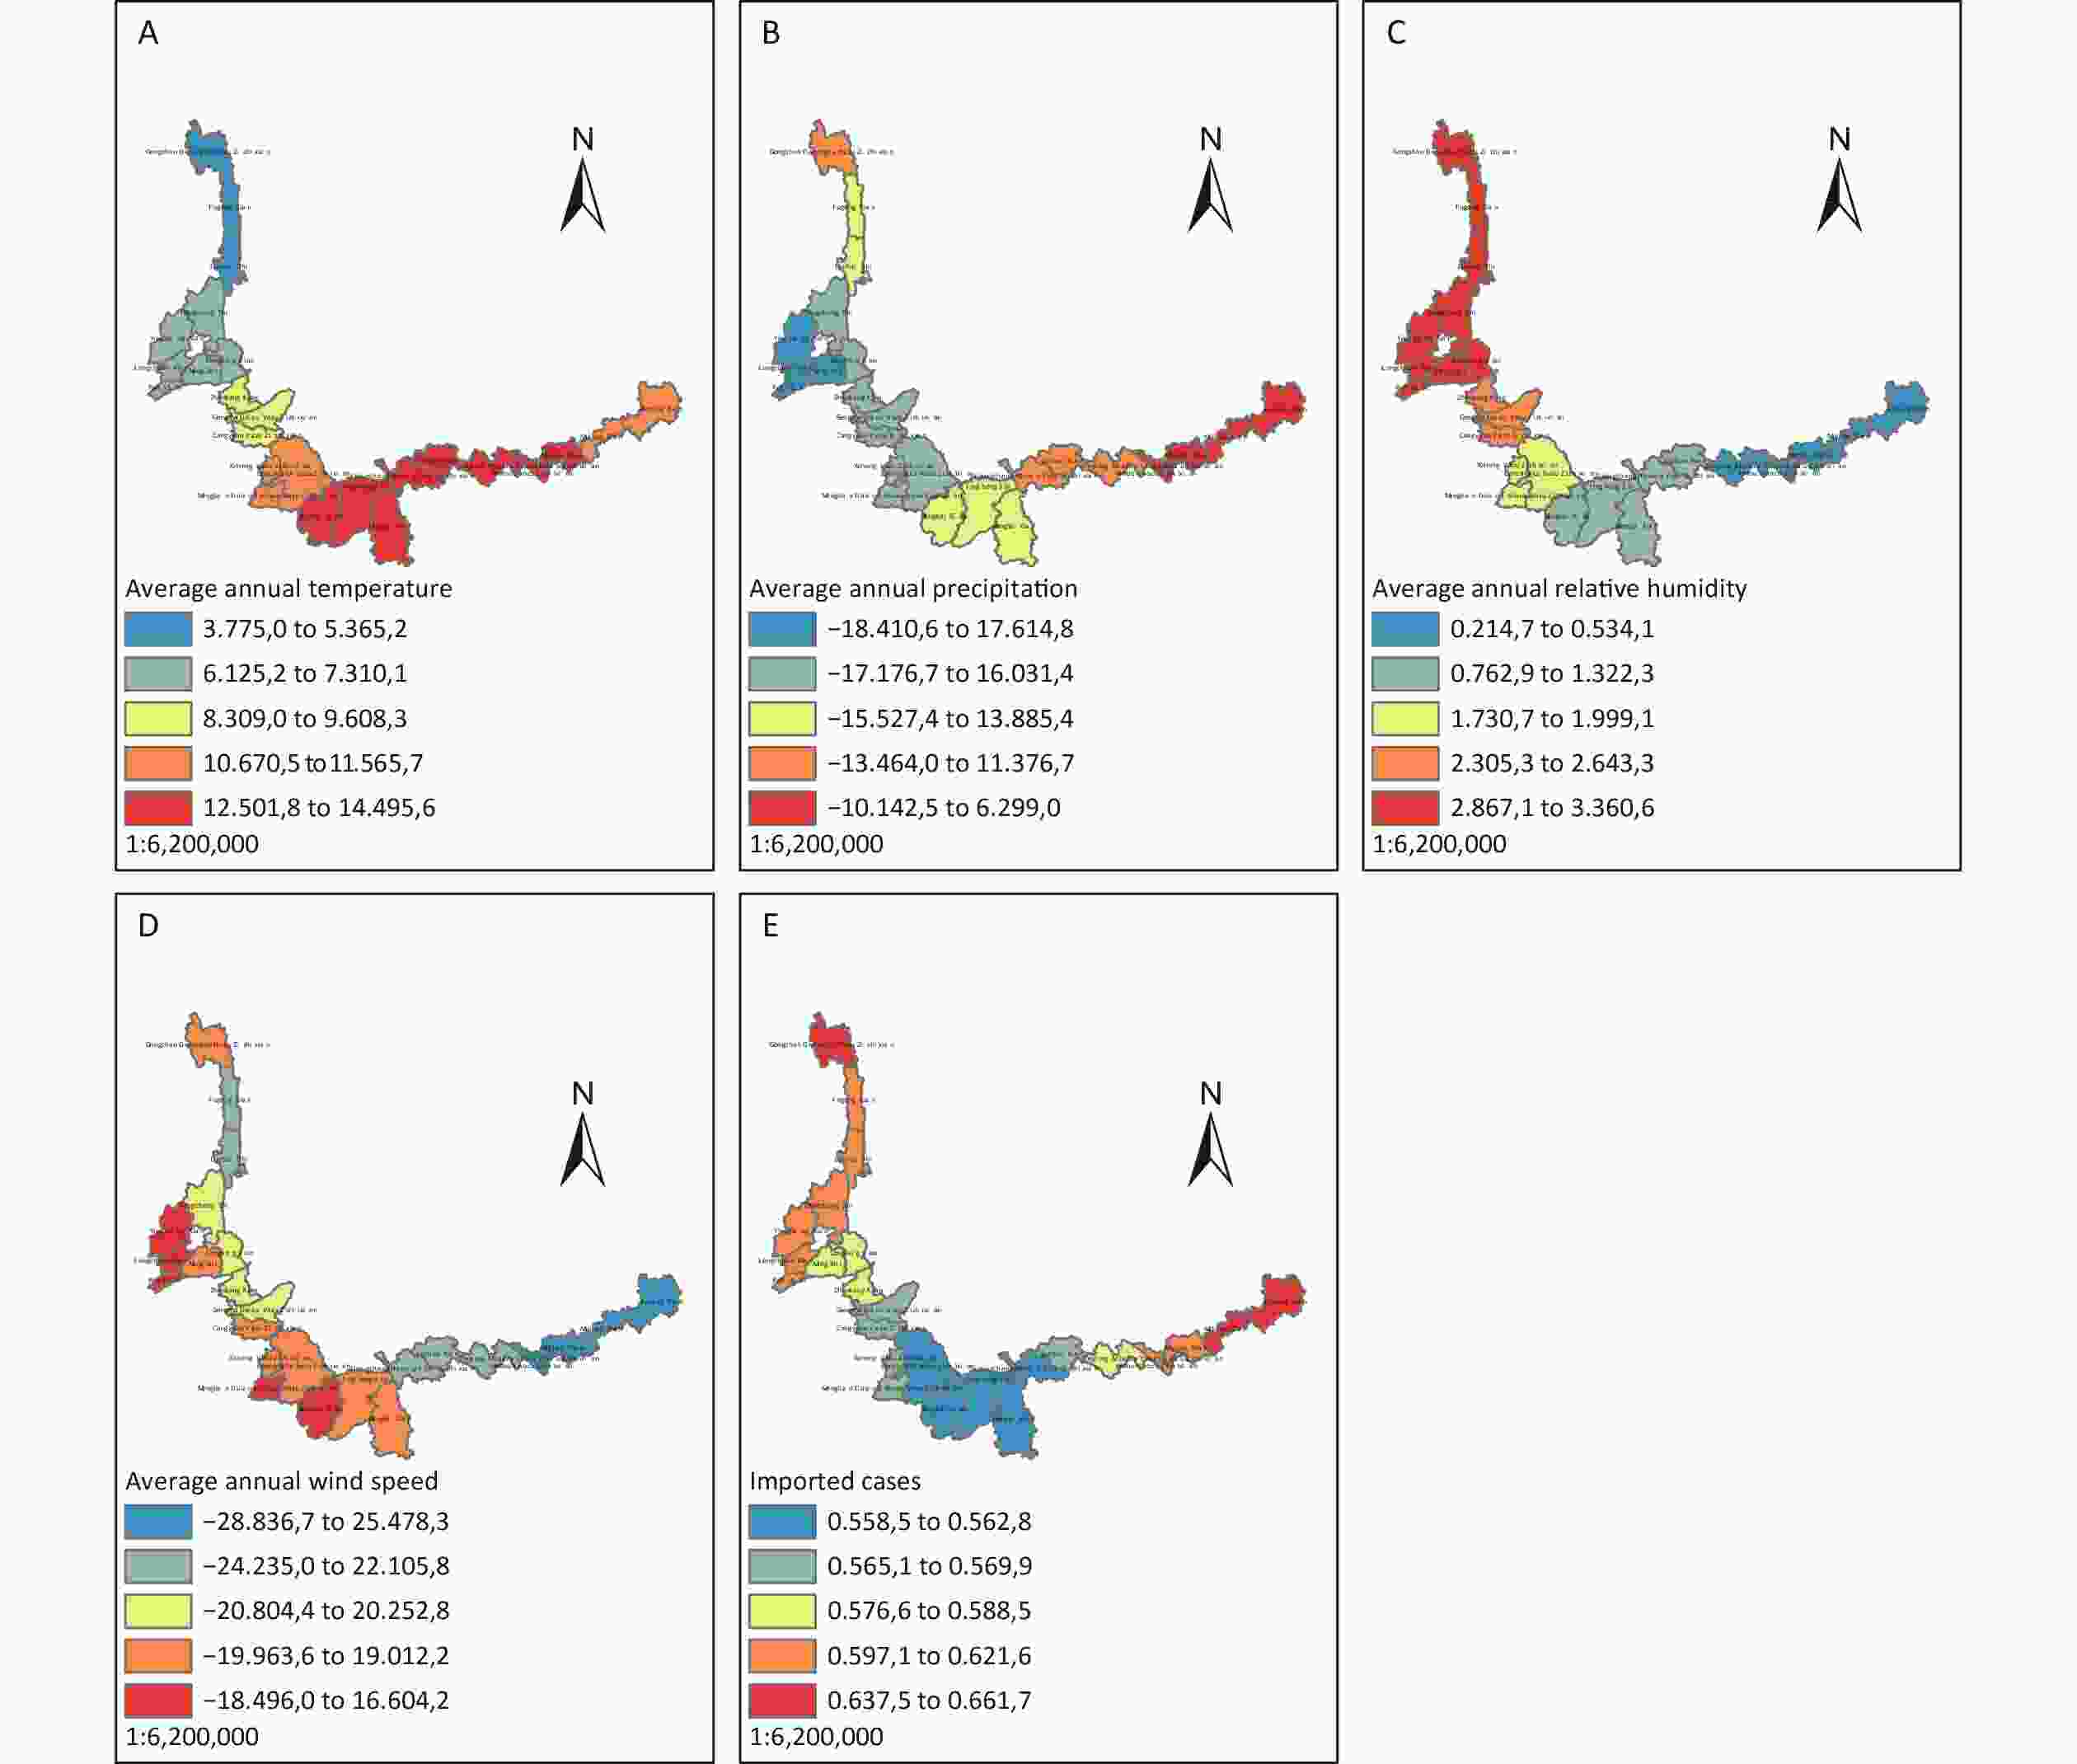
Figure 3. Spatial distribution of fitted coefficients for each variable.
-
The application of the GTWR model in this study has effectively addressed the issue of spatial and temporal non-stationarity of risk factors in Yunnan border areas. GTWR provided a nuanced understanding of the varying influences on indigenous dengue fever incidence over time and across different regions. The model’s ability to reflect the dynamic regression coefficients of influencing factors in both spatial and temporal dimensions clearly surpassed the capabilities of OLS regression[16]. The GTWR analysis shows that the main influencing factors of dengue fever incidence are different in each district and county in the border area of Yunnan Province. The development of dengue fever prevention and control policy needs to be adapted to local conditions, which provides a more accurate basis for optimizing dengue fever prevention and control policy. It has important public health significance.
The finding of this study disclosed that the dengue incidence in Yunnan boder is connected to the climatological factors and Imported cases[17]. Yunnan border is a subtropical highland climate area, the higher the risk of climate change, the higher the risk of dengue incidence spread. Being located at the border, imported cases play a crucial role in the spread of dengue fever locally. This was because of the area that experience in subtropical climate was the favourable region for the reproduction of mosquito[18]. The geographic dispersion, reproduction and feeding pattern of mosquitos are all affected by ambient temperature, humidity, rainfall, and wind speed[19]. And, the seasonal pattern that happened in Yunnan border gave good support for the growth of mosquito reproduction. In the border areas of Yunnan, there are numerous border crossings, close movement of people and poor sanitary conditions. These greatly increase the risk of importation of dengue cases. Close human mobility may increase the frequency of human-mosquito contact and the potential for the virus to spread with infected people, leading to the spread of dengue fever.
The regression coefficients for meteorological factors did not vary much from year to year. Study showed that dengue transmission occured within the current year and rarely over a multi-year period. This may be related to the habits of Aedes mosquitoes, the vector of dengue fever. Aedes mosquitoes have high breeding activity in the summer and fall of each year, and lurk in the winter when temperatures are cooler[20], so dengue transmission across the year was virtually non-existent. The differences in regression coefficients of meteorological factors on annual scales were not significant, and the characteristics of seasonal spread of dengue fever can be further considered to analyze the influence of meteorological factors on dengue fever on seasonal scales. The impact of imported cases was decreasing again year by year, which was very alarming. Some studies have shown that dengue virus has been detected in Aedes mosquitoes in the border areas of Yunnan Province[21-22]. Dengue fever has a tendency to become localized in border areas, and imported cases remain an important factor causing dengue fever epidemics.
This study found that the role of influencing factors varied with spatial location. The higher the temperature and relative humidity, the higher the local dengue incidence[23]. The spatial and temporal distribution of regression coefficients showed that in Jinghong and its neighboring counties temperature had the greatest effect on dengue fever prevalence, and in Ruili average annual precipitation and relative humidity had the greatest effect on dengue fever. Jinghong and Ruili have a subtropical climate with hot and humid climate, which was conducive to the breeding of the vector Aedes mosquitoes. Compared with counties in highland and temperate climates, temperature and humidity are more conducive to dengue fever epidemics. Important effects of temperature are a reduction in the extrinsic incubation period of mosquitoes, an increase in the frequency of bites and an increase in the average lifespan of mosquitoes[24]. Precipitation and wind speed played an inhibitory role in local dengue epidemics, which is inconsistent with the results of other studies. Numerous studies have shown that precipitation is conducive to increased incidence of dengue fever[25-26]. Stagnant water favors mosquito breeding. However, it has also been shown that excessive precipitation has an impact on the flushing of mosquito eggs and larvae, which in turn affected the incidence of dengue fever[27]. The vector Aedes mosquitoes bred in large numbers in wastewater, facilitating the spread of dengue fever. Wind tends to suppress mosquito flight and thus could have affected their oviposition. Some studies have shown that mosquito flight with the threshold velocities for flight inhibition in the order of 1–4 m/s[28],the average annual wind speed in the border area is at 1.42 m/s. The impact of imported cases was greater in counties with highland and temperate climates, where dengue fever was largely non-endemic, making it all the more important to guard against imported cases in these counties.
There were some limitations to this study. Every year, few counties involved in outbreak of indigenous dengue fever in border areas of Yunnan Province, and were mainly distributed in and around Jinghong, Ruili and Gengma. And in most counties indigenous dengue cases were almost non-existent. This resulted in a low coefficient of determination and poor model interpretation of the GTWR model, but it was still informative, especially in terms of influencing the spatial and temporal variations in the regression coefficients of the factors.
-
The study conclusively demonstrates that the incidence of indigenous dengue fever in the border areas of Yunnan Province is significantly influenced by a combination of environmental and external factors. Specifically, temperature, relative humidity, precipitation, wind speed, and imported cases have been identified as key determinants, with their impact varying both temporally and spatially.
These findings have critical implications for the development of targeted strategies for the prevention and control of dengue fever. Effective epidemic management must consider the distinct climatic characteristics and the role of imported cases unique to each county in the region. This tailored approach is essential to mitigate the risk and spread of dengue fever effectively.
Funds:
This work is supported by National Science and Technology Infrastructure Platform National Population and Health Science Data Sharing Service Platform Public Health Science Data Center [NCMI-ZB01N-201905].
AUTHOR CONTRIBUTIONS
ZHU Xiao Xiang conceived the study, analyzed data, and wrote the original draft. WANG Song Wang and LI Yan Fei provided technical guidance. ZHANG Ye Wu improved the language. ZHAO Xiao Tao provided professional advice. SU Xue Mei supervised the study and reviewed the manuscript. All authors read and approved the final manuscript.
 Quick Links
 DownLoad: