


-
Nonalcoholic fatty liver disease (NAFLD) is a rapidly growing health problem affecting approximately one-quarter of the world's population[1]. It encompasses a range of clinical phenotypes, from hepatic steatosis to liver cirrhosis and even hepatocellular carcinoma[2]. NAFLD has been linked to not only liver-related health issues and death but also a range of other health problems, including cardiovascular and chronic kidney diseases[3].
NAFLD is a complex multifactorial disease involving genetic, metabolic, and environmental factors[4-6]. Over the past three decades, more than 400 candidate gene association studies have been published on the associations between common variants and NAFLD risk, and some common variants, including PNPLA3 rs738409, TM6SF2 rs58542926, and GCKR rs780094, have been studied frequently[7-10]. An increasing number of genome-wide association studies (GWASs) and whole-exome sequencing (WES) have been conducted in recent years. GWASs provide a broader and unbiased approach for the discovery of genes involved in complex genetic traits, whereas WES studies can directly capture relevant variations not interrogated by common genotyping platform designs, including rare variants[11]. Despite hundreds of genetic association studies published to date, results regarding the specific variant remain inconsistent, hindering our understanding of the genetic architecture of NAFLD. This may be attributed to small sample sizes in most studies, ethnic differences, and other factors. Meta-analysis is a powerful tool for increasing statistical strength and precision in detecting gene-disease associations[12]. However, previous meta-analyses on NAFLD susceptibility have mainly focused on one genetic variant or genetic variants within one gene, and few meta-analyses have encompassed all relevant types of studies, including candidate gene association studies, GWASs, and WES studies. In addition, previous meta-analyses have not evaluated the epidemiological credibility of these associations[13-15].
This study aimed to comprehensively summarize all genetic association studies of NAFLD, including candidate gene association, genome-wide association, and whole exome sequencing studies. This study will also conduct meta-analyses for genetic variants with sufficient available data, categorize related genes according to their genetic functions, and evaluate the epidemiological credibility of these associations using the Venice criteria proposed by the Human Genome Epidemiology Network (HuGENet)[16]. This study represents a comprehensive synthesis of genetic variants and functions associated with NAFLD, and will facilitate the interpretation of findings in the quest for genuine genetic susceptibility factors.
-
A comprehensive literature search was conducted in the Web of Science, PubMed, and Embase electronic databases to identify studies that analyzed genetic variants associated with NAFLD. The systematic search was first conducted on January 5, 2021, and updated on September 30, 2022. The detailed search terms are presented in Appendix A.
Studies included in this systematic review must satisfy the following criteria: (i) the study design must be a case-control, cohort, or cross-sectional association study in human subjects; (ii) the study must focus on the associations between genetic variants and NAFLD risk; (iii) NAFLD cases must have been diagnosed by clinicians, and meet the diagnostic criteria of NAFLD defined by the presence of steatosis in > 5% hepatocytes without secondary causes such as significant alcohol consumption, chronic viral hepatitis, long-term use of steatogenic medications, or monogenic hereditary disorders (including lecithin-cholesterol acyltransferase deficiency, cholesterol ester storage disease, Wolman's disease, etc); (iv) absence of hepatic steatosis in the control group; (v) if data or data subsets were published in more than one publication, the article with largest sample size was included; and (vi) article published in English. All records obtained through the database search were collected using EndNote software. After removing duplicates, the titles and abstracts were screened to exclude irrelevant studies, and the full texts of the remaining records were reviewed for eligibility. The reference lists of publications were also reviewed. Two reviewers (Yamei Li and Xiang Xiao) independently selected the studies.
-
The following information was extracted independently by two reviewers from eligible studies: first author, year of publication, country of origin, ethnicity of the study population, diagnostic criteria for NAFLD, sample size, source of controls, genotype methods, significant association (Yes/No), confounding factors adjusted in multivariate analysis models, and allele and genotype frequencies in cases and controls. Specifically, ethnicity was classified as Asian, Caucasian, Hispanic, African, or mixed, based on the ethnicity of at least 80% of the study population. The most recent gene names and variant accession numbers were used according to the National Center for Biotechnology Information (NCBI) database[17].
Two reviewers independently assessed the quality of the included studies using the Newcastle-Ottawa Scale (NOS)[18]. The NOS criteria evaluated the methodological quality of studies using a “star” rating system, with scores ranging from 0 star (worst) to 9 stars (best). Disagreements in data extraction and quality assessment were discussed among all the investigators and resolved by consensus.
-
The locations, coding proteins, and functional annotation information of the genes identified in previous studies were obtained by searching the human gene database (https://www.genecards.org/). Genes were divided into eight categories based on their main related functions, including lipid synthesis and metabolism, insulin resistance and glucose metabolism, adipokines/adipokine receptors, energy metabolism and obesity, oxidative stress and antioxidants, inflammatory and immune responses, and liver fibrosis.
A meta-analysis was performed for genetic variants with data available from at least five independent studies. Genotype distributions in the control subjects were tested for Hardy-Weinberg equilibrium using the chi-square (χ2) test. Studies that did not conform to Hardy-Weinberg equilibrium were excluded from the meta-analysis. The odds ratios (ORs) and 95% confidence intervals (CIs) were calculated using five genetic models: allele contrast model (mutant [M] allele versus wild [W] allele), heterozygous model (WM versus WW), homozygous model (MM versus WW), recessive model (MM versus WW + WM), and dominant model (WM + MM versus WW)[19]. Random-effects models (Der Simonian-Laird method) were used in all meta-analyses[20]. Cochrane's Q test and I2 index were used to assess heterogeneity across eligible studies[21,22]. Meta-analyses, stratified by ethnicity, were conducted for variants with at least two data sources in each subgroup. Funnel plots and Egger’s linear regression tests were used to assess potential publication bias in the included studies[23]. All tests were two-sided, and P value < 0.05 was considered statistically significant. Sensitivity analyses were conducted to evaluate the influence of each study on the overall estimates. Meta-analyses were performed using the STATA version 12.0 software (Stata Corporation, College Station, TX, USA).
-
The Venice criteria were applied to evaluate the epidemiological credibility of the significant associations identified in the meta-analysis[16]. Credibility was defined as strong (A), moderate (B), or weak (C) in three categories: the amount of evidence, replication of the association, and protection from bias. The amount of evidence was graded by the sum of the test alleles or genotypes among the cases and controls in the meta-analysis: A grade of A for > 1,000, B for 100–1,000, and C for < 100. Replication of the association was graded using the heterogeneity statistic: A for I2 < 25%, B for I2 between 25 and 50%, and C for I2 > 50%[22]. Protection from bias was graded as A, if there was no observable bias and bias was unlikely to explain the presence of the association, B, if bias was present, and C, if bias was evident or likely to explain the presence of the association. We also considered the magnitude of association in the assessment of protection from bias, and a score of C was assigned to an association when the summary OR deviated less than 1.15-fold from the null unless the association had been replicated prospectively by several studies with no evidence of publication bias. Next, the cumulative epidemiological evidence for significant associations was considered strong if all three grades were A, moderate if all three grades were A or B, and weak if any grade was C.
-
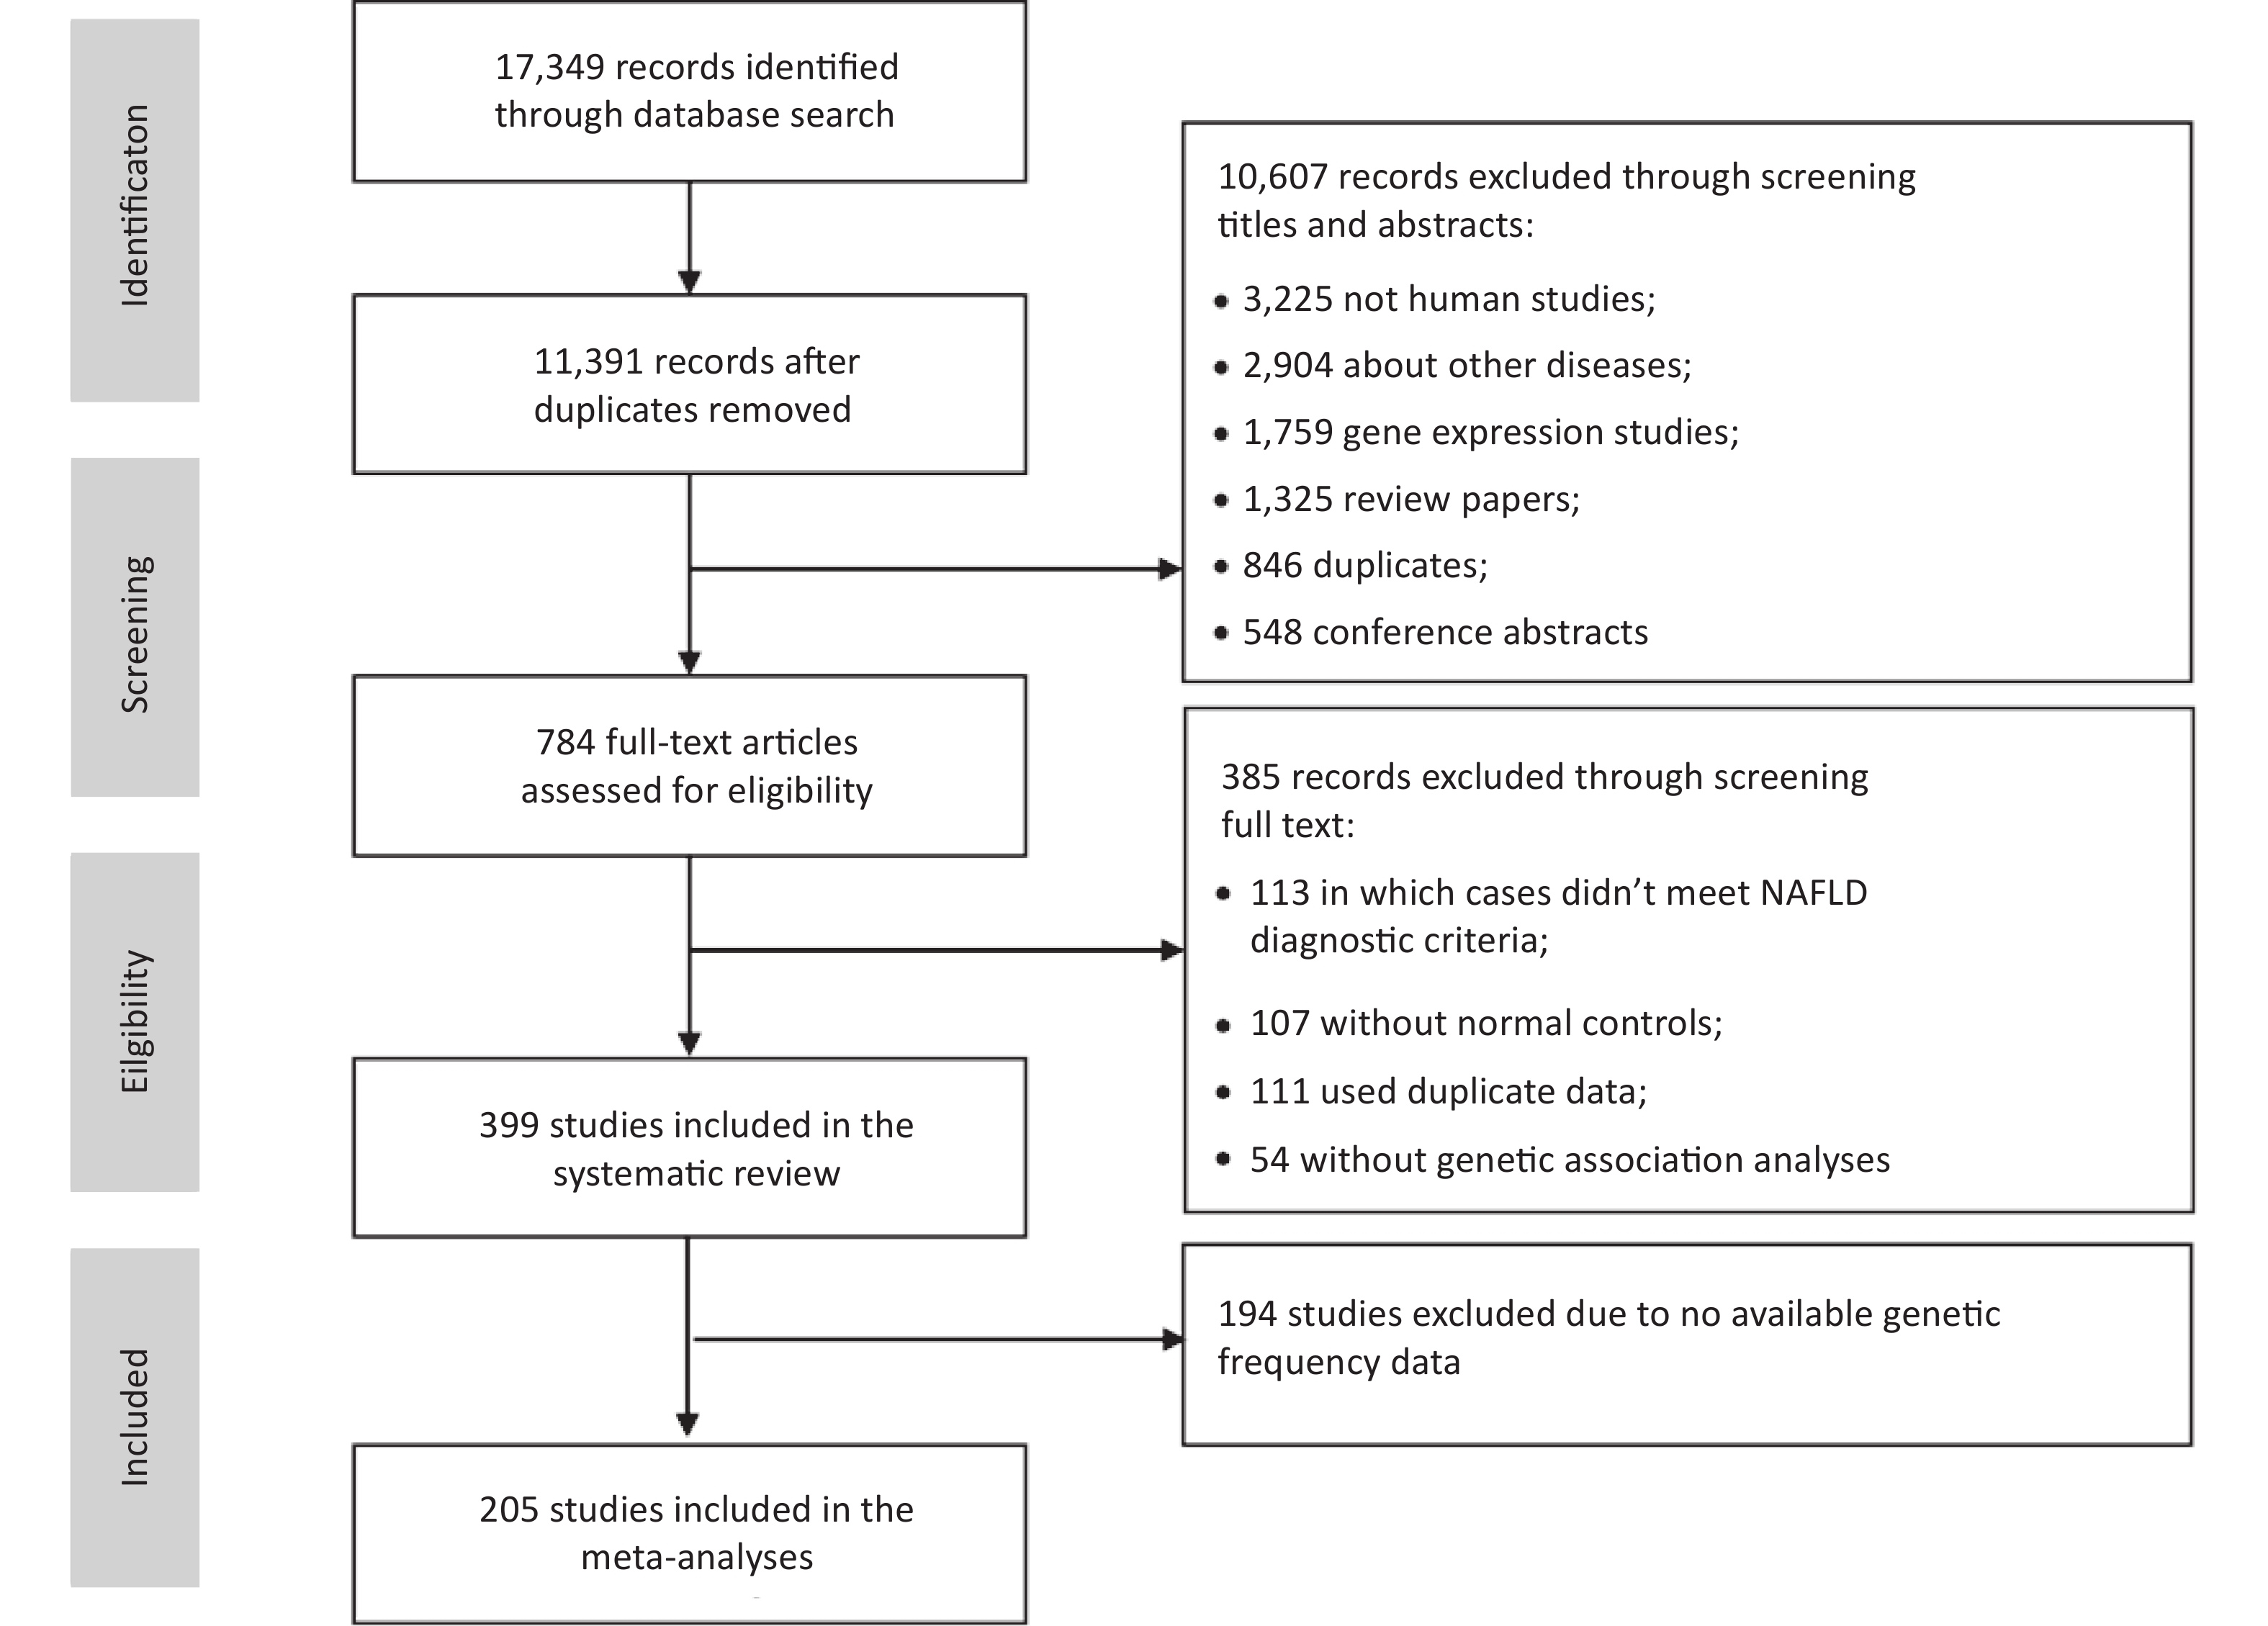
We identified 17,349 articles based on the literature searches, 11,391 non-duplicated articles were included in the title and abstract screening. Articles were excluded for non-human subjects (n = 3,225), irrelevant themes (n = 2,904), gene expression studies (n = 1,759), review articles (n = 1,325), duplicates (n = 846), or conference abstracts (n = 548), and the remaining 784 articles were included in the full-text review (Figure 1). In total, 399 eligible studies were identified, including 16 GWASs, 2 WES studies, and 381 candidate gene association studies. Of these, 205 studies with sufficient data were included in the meta-analysis of 25 variants of 17 genes.
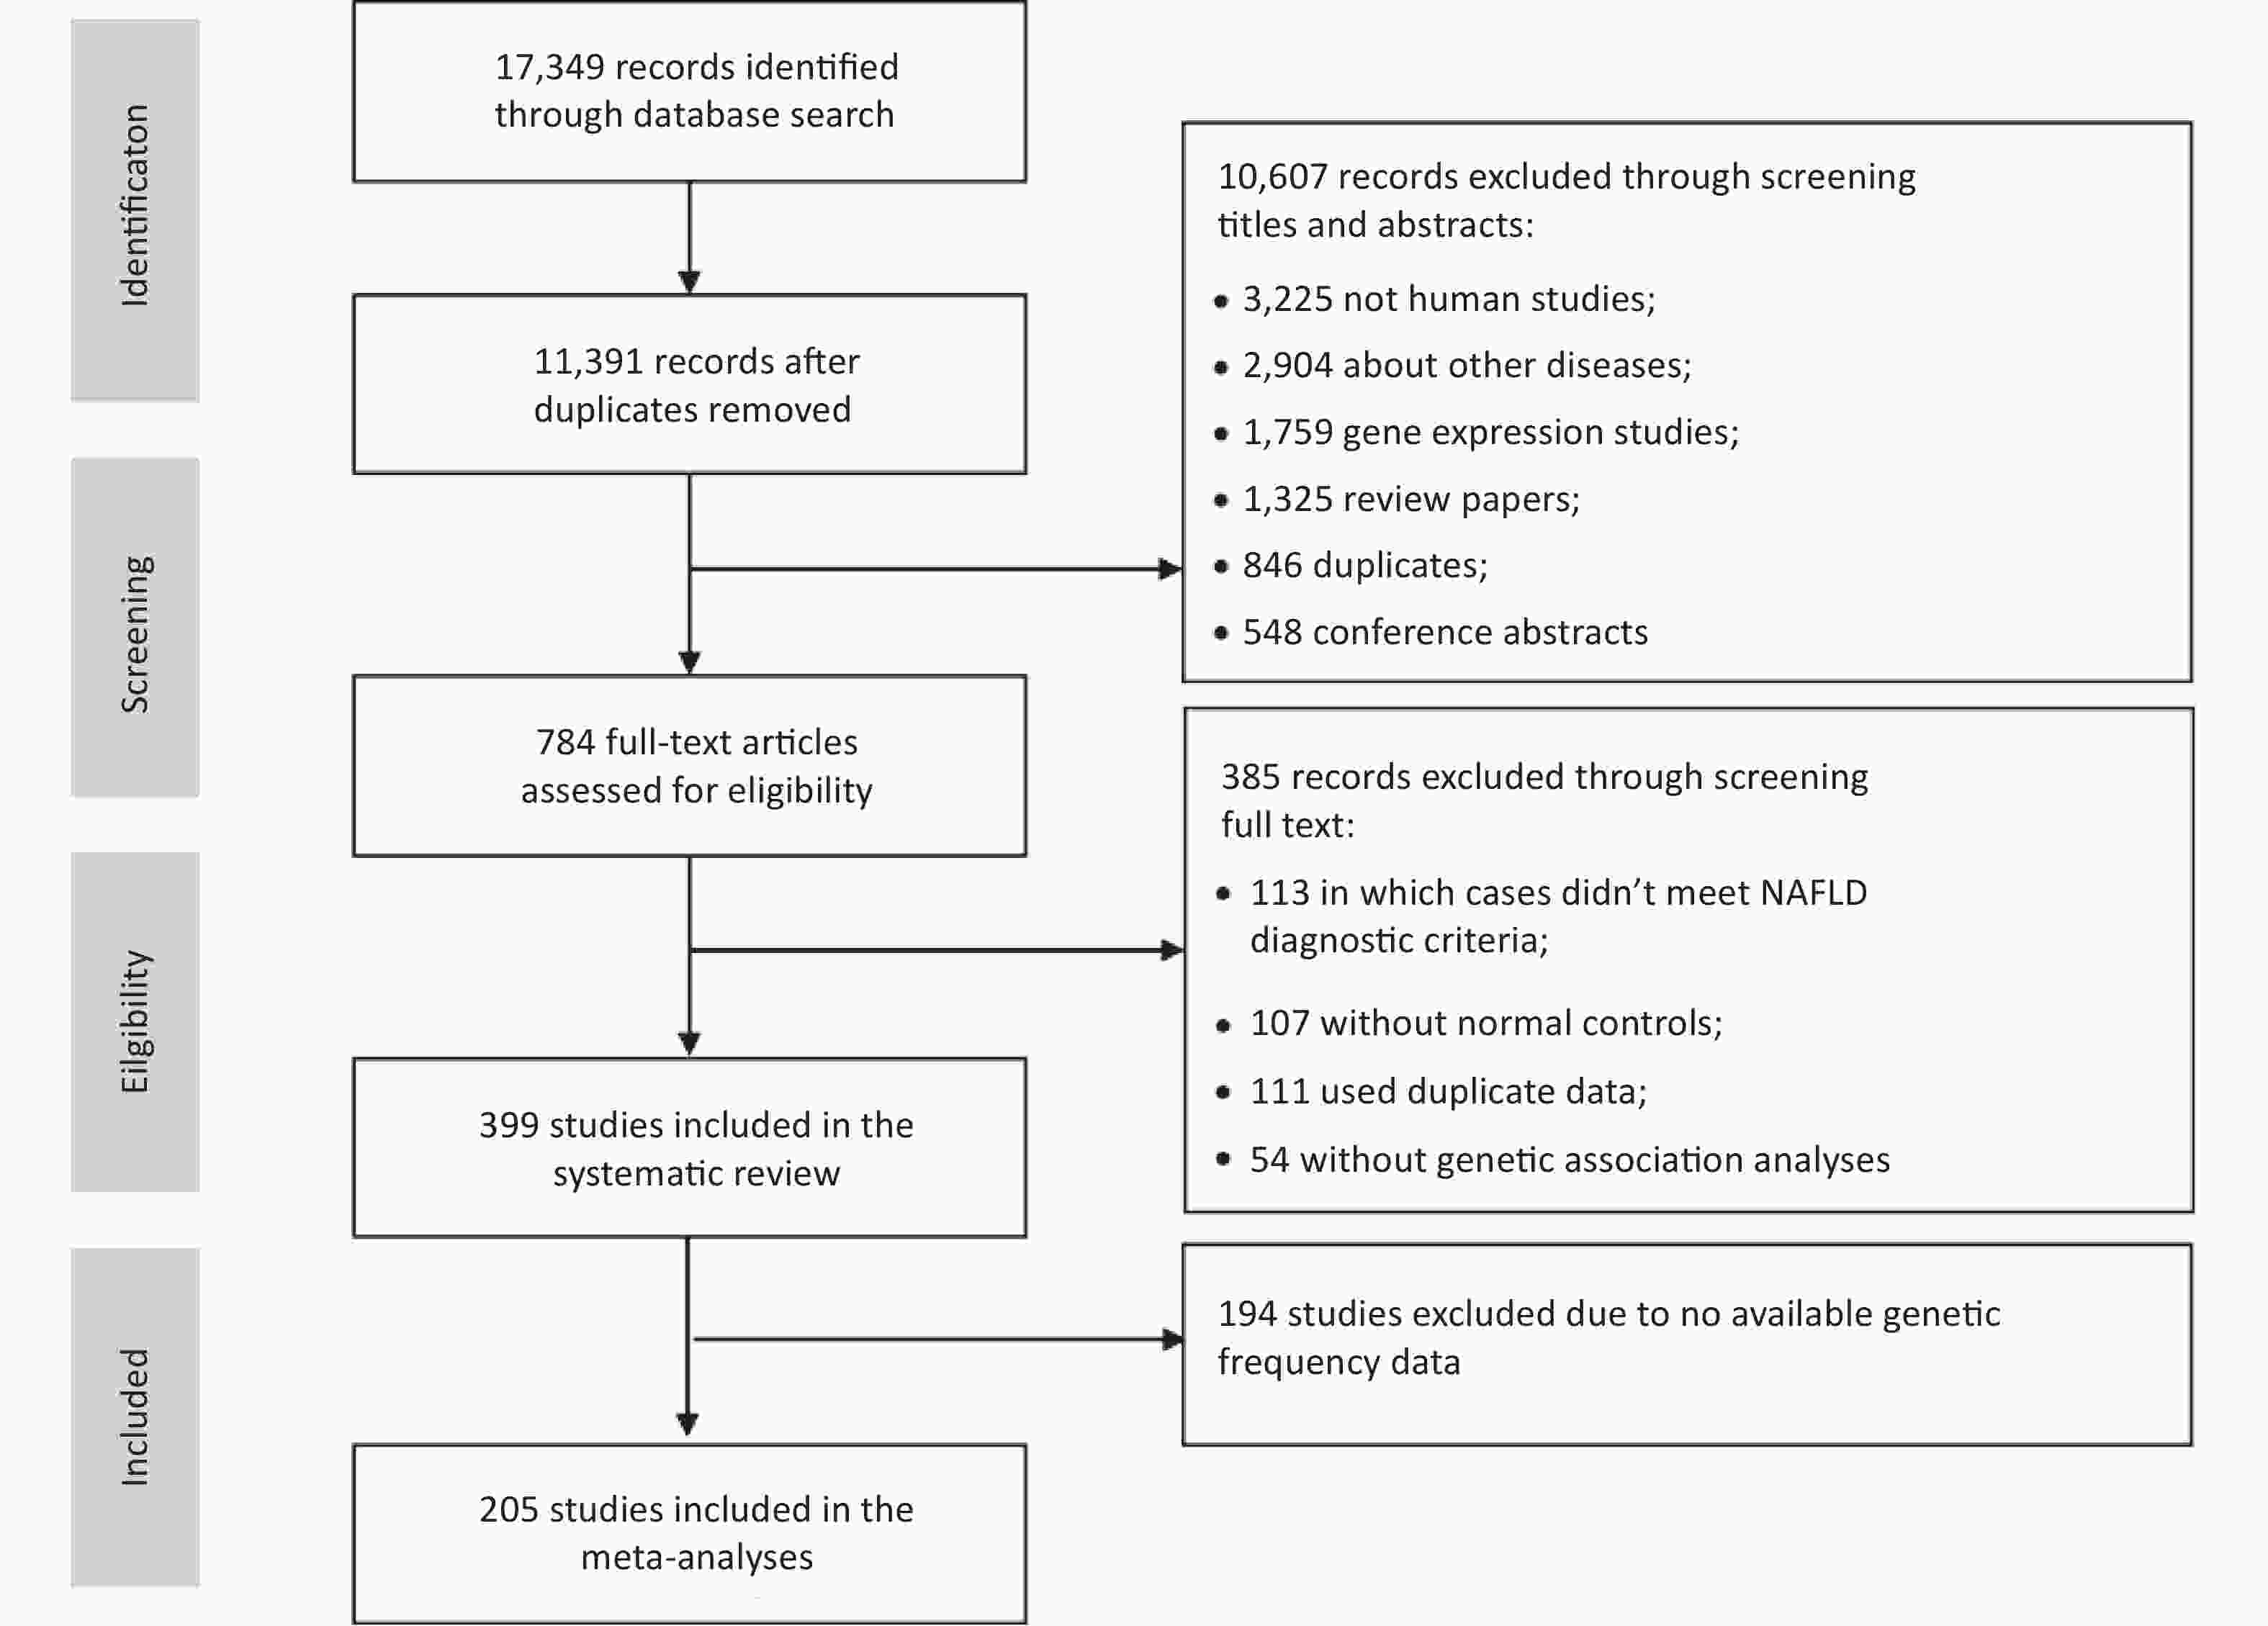
Figure 1. The flowchart for study selection.
Among the 16 GWASs, eight were conducted in the United States, four in Japan, two in South Korea, one in Australia, and one in Italy. Thirteen GWASs were conducted in adults, 2 studies were conducted in children, and 1 each in adults and children. The mean sample size was 5,710 ± 7,595 (ranged 234–27,374). At the same time, subsequent validation studies were performed followed by five GWAS studies. The basic characteristics of the GWASs are shown in Supplementary Table S1 (available in www.besjournal.com).
The characteristics of the 381 candidate gene association studies are presented in Supplementary Table S2 (available in www.besjournal.com). These studies analyzed 465 genetic variants in 173 candidate genes. The first candidate gene association study for NAFLD was published in 1998 and the number of such studies has gradually increased in recent decades. Most studies were conducted in China (n = 194), followed by Italy (n = 37), Japan (n = 21), Turkey (n = 18), Iran (n = 17), India (n = 16), the United States (n = 13), Egypt (n = 8), and other countries (n = 57). The ethnic distribution was dominated by Asian (n = 251) and Caucasian (n = 102) populations. The vast majority of the studies included adults (n = 349), and the remaining 32 studies were conducted in children or a mixed population. The mean NOS score was 6.36 ± 1.11, suggesting that the overall research quality was acceptable.
-
In total, 72 variants were found to be significantly associated with NAFLD risk in the GWASs (Supplementary Table S1). Specifically, 52 variants were identified in adults, 15 variants were reported in children, and 6 variants were reported in both adults and children. Notably, PNPLA3 rs738409 has been reported not only in adults, but also in mixed adults and children. In addition, two WES studies have shown that three variants of two genes (PNPLA3 and PMPT) are associated with NAFLD susceptibility in adults.
-
Among the 465 genetic variants, common variants (416 variants in 157 genes) (MAF ≥ 5%) included synonymous single nucleotide polymorphisms (SNPs; n = 20), non-coding transcript SNPs (n = 8), intronic SNPs (n = 208), SNPs in 5´ or 3´ untranslated regions (UTRs; n = 28), missense variants (n = 66), upstream variants (n = 46), downstream variants (n = 4) and others (n = 36). Rare variants (49 variants in 34 genes) (MAF < 5%) included synonymous variants (n = 1), non-coding transcript variants (n = 2), intronic variants (n = 17), variants in 5´ or 3´ UTRs (n = 6), missense variants (n = 21), and two upstream variants (Supplementary Table S3, available in www.besjournal.com). Based on the main function of each gene, the 173 genes were divided into eight categories: lipid synthesis and metabolism (n = 49), insulin resistance and glucose metabolism (n = 10), adipokines/adipokine receptors (n = 6), energy metabolism and obesity (n = 6), oxidative stress and antioxidants (n = 22), inflammatory and immune response (n = 32), liver fibrosis (n = 11) and others (n = 37), as shown in Supplementary Table S4 (available in www.besjournal.com).
-
As shown in Table 1, 25 variants of the 17 genes were included in the meta-analysis. The information extracted for each variant used in the meta-analysis is presented in Supplementary Table S5 (available in www.besjournal.com). These meta-analyses included a mean of 14 studies (range: 6–75) and 3281 participants (range: 1,784–42,903). 11 variants in 10 genes showed statistically significant associations with NAFLD (P < 0.05), including four genes related to lipid synthesis and metabolism (MBOAT7, PEMT, PNPLA3, TM6SF2), 1 gene related to insulin resistance and glucose metabolism (GCKR), 2 genes related to adipokines/adipokine receptors (ADIPOQ, LEPR), 2 genes related to oxidative stress and antioxidants (HFE, MTHFR), and 1 gene related to inflammatory and immune response (TNF). Moreover, all 11 variants in 10 genes showed positive associations with NAFLD, and the highest risk factor for NAFLD was PNPLA3 rs738409 (OR: 1.841, 95% CI: 1.691–2.004). The cumulative epidemiological evidence of a significant association was graded as strong for two variants in two genes (HFE, TNF), moderate for four variants in three genes (TM6SF2, GCKR, and ADIPOQ), and weak for five variants in five genes (MBOAT7, PEMT, PNPLA3, LEPR, and MTHFR), based on the Venice criteria.
Gene and function Variant Alleles MAF Number assessed Allelic contrasts Heterogeneity Venice criteria gradec Cumulative evidence of associationd Studies Cases Controls OR (95% CI)a P value P valueb I2 Lipid synthesis and metabolism related genes APOC3 rs2854116 T vs. C 0.55 (T) 11 3,792 4,601 0.99 (0.89−1.10) 0.826 0.004 63 ACC + rs2854117 C vs. T 0.67 (C) 9 3,538 3,819 1.02 (0.95−1.10) 0.577 0.370 8 AAC + LYPLAL1* rs12137855 T vs. C 0.20 (T) 13 4,369 5,292 0.98 (0.89−1.09) 0.753 0.326 12 AAC + MBOAT7 rs641738 C vs. T 0.57 (C) 12 4,351 10,830 1.07 (1.00−1.14) 0.048 0.528 0 AAC + MTTP rs1800591 T vs. G 0.15 (T) 11 1,483 1,490 0.89 (0.59−1.36) 0.592 < 0.001 88 ACC + PEMT rs7946 T vs. C 0.70 (T) 10 1,090 1,390 1.51 (1.11−2.06) 0.008 < 0.001 73 ACA + PNPLA3 rs738409 G vs. C 0.26 (G) 75 18,193 24,710 1.84 (1.69−2.00) < 0.001 < 0.001 85 ACA + PPARG rs1801282 G vs. C 0.11 (G) 9 2.108 2.740 0.88 (0.70−1.10) 0.260 0.084 43 ABC + PPARGC1A* rs8192678 T vs. C 0.33 (T) 6 726 1,058 1.05 (0.78−1.41) 0.735 0.011 66 ACC + TM6SF2 rs58542926 T vs. C 0.07 (T) 24 5,499 12,677 1.69 (1.47−1.93) < 0.001 0.068 33 ABA ++ Insulin resistance and glucose metabolism related genes GCKR rs780094 T vs. C 0.40 (T) 23 6,401 9,983 1.18 (1.12−1.26) < 0.001 0.030 39 ABA ++ rs1260326 T vs. C 0.40 (T) 9 1,655 2,527 1.48 (1.67−1.87) 0.001 < 0.001 46 ABA ++ PPP1R3B* rs4240624 G vs. A 0.11 (G) 7 2,362 3,292 0.88 (0.68−1.14) 0.339 0.367 8 AAC + Adipokines/adipokine receptors related genes ADIPOQ rs1501299 T vs. G 0.27 (T) 13 2,261 2,190 0.97 (0.74−1.29) 0.849 < 0.001 88 ACC + rs266729 G vs. C 0.23 (G) 8 1,875 1,466 1.61 (1.36−1.91) < 0.001 0.142 40 ABA ++ rs2241766 G vs. T 0.10 (G) 13 2,187 2,072 1.09 (0.92−1.28) 0.335 0.012 54 ACC + LEPR rs1137100 G vs. A 0.27 (G) 7 1,382 1,304 1.02 (0.83−1.26) 0.863 0.131 39 ABC + rs1137101 G vs. A 0.46 (A) 6 1,591 1,535 1.82 (1.41−2.54) < 0.001 0.019 63 ACA + Oxidative stress and antioxidants related genes HFE rs1800562 A vs. G 0.05 (A) 15 2,261 5,508 1.83 (0.99−3.40) 0.056 < 0.001 63 ACA + rs1799945 G vs. C 0.14 (G) 14 1,993 2,475 1.24 (1.04−1.48) 0.019 0.192 24 AAA +++ MTHFR rs1801131 C vs. A 0.30 (C) 7 2,122 1,157 1.24 (0.93−1.65) 0.141 < 0.001 76 ACA + rs1801133 T vs. C 0.34 (T) 9 2,303 1,399 1.30 (1.06−1.59) 0.012 0.006 63 ACA + Inflammatory and immune response related genes TNF rs3615525 A vs. G 0.05 (A) 14 2,055 1,594 1.82 (1.42−2.34) < 0.001 0.219 23 AAA +++ rs1800629 A vs. G 0.15 (A) 13 2,176 1,789 1.29 (0.99−1.69) 0.064 0.115 34 ABA ++ Other functional genes NCAN* rs2228603 T vs. C 0.07 (T) 11 4,251 6,105 0.97 (0.86−1.08) 0.544 0.712 0 AAC + Note. OR: odds ratio; CI: confidence interval; G: guanine; A, adenine; C: cytosine; T: thymine; MAF: minor-allele frequency. *Genes and loci that have not been meta-analyzed in published literature; aSummary ORs are based on random-effects allelic contrasts comparing minor and major alleles (based on frequencies in the control samples); bBased on the Q statistic across crude ORs calculated for each study; cDegree of ‘epidemiological credibility’ based on the interim Venice guidelines (A, strong; B, modest; C, weak); dCumulative epidemiological evidence as graded by Venice criteria as strong (+++), moderate (++), or weak (+) for association with NAFLD risk. Table 1. Results of random effects meta-analyses using allelic contrasts for polymorphisms
Of the 25 variants in meta-analyses, seven variants had little or no inter-study heterogeneity (I2 < 25%), 7 variants showed moderate heterogeneity (25% ≤ I2 ≤ 50%), and 11 variants showed high inter-study heterogeneity (I2 > 50%). The results of the dominant, recessive, heterozygous, and homozygous genetic models are shown in Supplementary Table S6 (available in www.besjournal.com). The allele contrast model identified more significant associations than the other models did.
All meta-analyses included a population of mixed ethnicities, except for LEPR rs1137100 and LEPR rs1137101, for which data were available only among Asian adults. Stratified meta-analyses according to ethnicity were conducted for the five variants of the four genes (Table 2). We found that PNPLA3 rs738409 was associated with NAFLD in all ethnicities, but showed the highest OR value (OR: 2.45, 95% CI: 2.04–2.95) in Caucasians and the lowest OR value (OR: 1.66, 95% CI: 1.51–1.83) in Asians. The three variants showed significant associations in only one ethnic population in the stratified analysis. Despite significant associations with NAFLD in the total population, significant associations were observed for GCKR rs780094 in Asians, GCKR rs1260326 in Caucasians, and MTHFR rs1801133 in Asians.
Gene and function Variant Alleles Subgroup Number assessed Allelic contrasts Heterogeneity Venice criteria gradec Cumulative evidence of associationd Studies Cases Controls OR (95% CI)a P value P valueb I2 Lipid synthesis and metabolism related genes MBOAT7 rs641738 C vs. T Total 12 4,351 10,830 1.07 (1.00−1.14) 0.048 0.528 0 AAC + Caucasians 7 2,464 2,166 1.07 (0.98−1.16) 0.144 0.448 0 AAC + Asians 5 1,887 8,664 1.07 (0.97−1.19) 0.188 0.374 6 AAC + PNPLA3 rs738409 G vs. C Total 75 18,193 24,710 1.84 (1.69−2.00) < 0.001 < 0.001 85 ACA + Caucasians 21 4,144 3,327 2.45 (2.04−2.95) < 0.001 < 0.001 77 ACA + Asians 45 12,792 20,320 1.66 (1.51−1.83) < 0.001 < 0.001 86 ACA + Others 4 742 299 1.89 (1.52−2.37) < 0.001 0.961 0 AAA +++ Insulin resistance and glucose metabolism related genes GCKR rs780094 T vs. C Total 23 6,401 9,983 1.18 (1.12−1.26) < 0.001 0.030 39 ABA ++ Asians 21 5,603 9,456 1.17 (1.10−1.26) < 0.001 0.040 38 ABA ++ Caucasians 2 798 527 1.34 (0.91−1.98) 0.142 0.065 71 ABC + rs1260326 T vs. C Total 9 1,655 2,527 1.48 (1.67−1.87) 0.001 < 0.001 46 ABA +++ Asians 4 1,023 992 1.61 (0.99−2.62) 0.057 < 0.001 93 ACA + Caucasians 3 393 552 1.42 (1.17−1.71) < 0.001 0.776 0 BAA ++ Others 2 239 983 1.33 (0.74−2.36) 0.338 0.038 77 ACA + Oxidative stress and antioxidants related genes MTHFR rs1801133 T vs. C Total 9 2,303 1,399 1.30 (1.06−1.59) 0.012 0.006 63 ACA + Caucasians 4 1,663 714 1.20 (0.85−1.68) 0.296 0.013 72 ACA + Asians 3 471 506 1.51 (1.07−2.12) 0.019 0.077 61 BCA + Hispanics 2 169 179 1.28 (0.63−2.58) 0.499 0.058 72 BCA + Note. OR: odds ratio; G: guanine; C: cytosine; T: thymine. aSummary ORs are based on random-effects allelic contrasts comparing minor and major alleles (based on frequencies in the control samples); bBased on the Q statistic across crude ORs calculated for each study; cDegree of ‘epidemiological credibility’ based on the interim Venice guidelines (A, strong; B, modest; C, weak); dCumulative epidemiological evidence as graded by Venice criteria as strong (+++), moderate (++), or weak (+) for association with NAFLD risk. Table 2. Results of random effects meta-analyses of alleles using allelic contrasts for polymorphisms stratified by ethnicity
-
By 30 September, 2022, a total of 75 meta-analyses on NAFLD genetic associations were published involving 21 variants of 13 genes. The results of meta-analyses that were published most recently or included the largest number of studies were extracted for each variant (Table 3). Compared with previously published meta-analyses, meta-analyses for four variants in four genes were conducted for the first time in this study, and all four variants showed no association with NAFLD risk (LYPLAL1 rs12137855, PPARGC1A rs8192678, PPP1R3B rs4240624, NCAN rs2228603). Among the variants that have been meta-analyzed in the past, consistent results were observed for 15 variants in 11 genes, where 10 variants in 9 genes were associated with increased risk of NAFLD (TNF rs3615525, ADIPOQ rs266729, GCKR rs780094, GCKR rs1260326, PNPLA3 rs738409, MTHFR rs1801133, TM6SF2 rs58542926, PEMT rs7946, LEPR rs1137101, HFE rs1799945) and 5 variants in 4 genes (TNF rs1800629, PPARG rs1801282, APOC3 rs2854116, APOC3 rs2854117, LEPR rs1137100) showed no associations with NAFLD. Five variants in four genes (ADIPOQ rs1501299, ADIPOQ rs2241766, MTTP rs1800591, MTHFR rs1801131, HFE rs1800562) showed significant associations in previous meta-analyses but showed insignificant associations in this study. In contrast, MBOAT7 rs641738 was not associated with NAFLD in previous meta-analyses but was significantly associated with NAFLD in this study.
Gene Study Polymorphism Prior meta sample size: cases; controls (number of samples) Model Published meta
OR (95% CI)Published Het. Meta Our new meta sample size: cases; controls (number of samples) Model New meta
OR (95% CI)Het. Meta TNF Wang et al. 2011 rs3615525 771; 787 (7) GA/AA vs. GG 2.06 (1.58−2.69)a 0.160 2,055; 1,594 (14) A vs. G 1.82 (1.42−2.34) 0.219 rs1800629 837; 990 (8) GA/AA vs. GG 1.08 (0.82−1.42)a 0.860 2,176; 1,789 (13) A vs. G 1.29 (0.99−1.69) 0.115 PPARG Zhang et al. 2015 rs1801282 1,697; 2,427 (8) GC/GG vs. CC 0.93 (0.63−1.38) < 0.001 2,108; 2,740 (9) G vs. C 0.88 (0.70−1.10) 0.084 ADIPOQ Wang et al. 2014 rs266729 876; 989 (7) GG/GC vs. CC 1.52 (1.10−2.09)a 0.280 1,875; 1,466 (8) G vs. C 1.61 (1.36−1.91) 0.142 Wang et al. 2016 rs1501299 1,117; 1,555 (10) G vs. T 1.27 (1.10−1.48)a 0.533 2,261; 2,190 (13) T vs. G 0.97 (0.74−1.29) < 0.001 rs2241766 1,117; 1,555 (10) T vs. G 1.33 (1.12−1.58)a 0.151 2,187; 2,072 (13) G vs. T 1.09 (0.92−1.28) 0.012 APOC3 Li et al. 2017 rs2854116 2,111; 1,866 (9) C vs. T 1.39 (0.96−2.02)a 0.001 3,792; 4,601 (11) T vs. C 0.99 (0.89−1.10) 0.004 rs2854117 2,111; 1,866 (9) T vs. C 1.05 (0.92−1.19)a 0.840 3,538; 3,819 (9) C vs. T 1.02 (0.95−1.10) 0.370 GCKR Li et al. 2021 rs780094 5,115; 11,812 (20) T vs. C 1.20 (1.11−1.29) 0.020 6,401; 9,983 (23) T vs. C 1.17 (1.10−1.24) < 0.001 rs1260326 2,238; 8,995 (9) T vs. C 1.32 (1.22−1.42) 0.560 1,655; 2,527 (9) T vs. C 1.27 (1.14−1.42) < 0.001 MTHFR Sun et al. 2016 rs1801131 364; 611 (5) C vs. A 1.53 (1.13−2.07) 0.001 2,122; 1,157 (7) C vs. A 1.24 (0.93−1.65) < 0.001 rs1801133 737; 1,160 (8) TT vs. TC/CC 1.42 (1.07−1.88) 0.160 2,303; 1,399 (9) T vs. C 1.30 (1.06−1.59) 0.006 MBOAT7 Xia et al. 2019 rs641738 2,560; 8,738 (5) C vs. T 0.99 (0.93−1.05)a - 4,351; 10,830 (12) C vs. T 1.07 (1.00−1.14) 0.528 TM6SF2 Chen et al. 2019 rs58542926 3,075; 3,000 (13) Unknown 0.55 (0.48−0.63) - 5,499; 12,677 (24) T vs. C 1.69 (1.47−1.93) 0.068 PEMT Tan et al. 2016 rs7946 792; 2,722 (6) TT/TC vs. CC 1.62 (1.10−0.39) - 1,090; 1,390 (10) T vs. C 1.51 (1.11−2.06) < 0.001 LEPR Pan et al. 2018 rs1137100 1,111; 1,132 (6) A vs. G 1.01 (0.87−1.18) 0.110 1,382; 1,304 (7) G vs. A 1.02 (0.83−1.26) 0.131 rs1137101 1,298; 1,348 (5) A vs. G 0.57 (0.50−0.65) 0.140 1,591; 1,535 (6) G vs. A 1.82 (1.41−2.54) 0.019 HFE Ye et al. 2016 rs1800562 1,846; 7,037 (11) A vs. G 1.95 (1.16−3.28) < 0.001 2,261; 5,508 (15) A vs. G 1.83 (0.99−3.40) < 0.001 rs1799945 3,945; 12,332 (16) G vs. C 1.21 (1.07−1.38)a 0.338 1,993; 2,475 (14) G vs. C 1.24 (1.04−1.48) 0.192 Note. aFixed effects model was used in prior meta-analysis-: P-value is not reported. Table 3. Previously published meta-analyses results compared to meta-analyses in this study
-
This study comprehensively reviewed the genetic association with NAFLD susceptibility by analyzing 381 candidate gene studies, 16 GWASs, and two WESs. 72 and 465 variants of over 100 genes related to multiple functional pathways were identified in the GWASs and candidate gene studies, respectively. We conducted meta-analyses of 25 variants and found significant associations with NAFLD risk for 11 variants, including six variants that showed moderate to strong cumulative epidemiological evidence for a true association. Additionally, meta-analyses provided convincing evidence of no association between NAFLD risk and 14 variants in 11 genes.
Our study identified 4 SNPs in 4 genes related to lipid synthesis and metabolism that were significantly associated with NAFLD risk. An association with TM6SF2 rs58542926 has been identified in several GWASs and a meta-analysis by Chen et al. (2019)[24]. The SNP TM6SF2 rs58542926 leads to a reduction in the expression and activity of TM6SF2, which normally promotes triglyceride secretion from hepatocytes[10,25]. The PNPLA3 rs738409 SNP causes a missense coding of methionine instead of isoleucine, leading to reduced lipidation of Apolipoprotein B100 and promotion of hepatic fat accumulation[26,27], and has been reported as a genetic risk factor for NAFLD in a large number of studies, including several GWASs[7-9] and previous meta-analyses[28,29]. MBOAT7 rs641738 was found to have borderline significance in this study, whereas a previous meta-analysis by Xia et al. (2019)[30] reported insignificant associations. The SNP rs641738 is believed to affect the acyl chain composition and remodeling of phospholipids in membranes[31]. The PEMT rs7946 variant leads to an amino acid substitution and reduced PEMT activity, causing the accumulation of triacylglycerols in the liver[32]. A significant association between PEMT rs7946 polymorphism and NAFLD has only been reported in Asians in a meta-analysis conducted by Tan et al. (2016)[33], and this association was confirmed in a mixed population in this study, although only weak cumulative epidemiological evidence was found.
Among insulin resistance and glucose metabolism-related genes, this study found moderate evidence of an association between two GCKR variants (rs780094 and rs1260326) and NAFLD risk, supported by previous GWASs and meta-analyses[34,35]. GCKR encodes a protein that regulates glucokinase activity[36], and the polymorphism rs1260326 leads to increased glucokinase activity and promotes hepatic glucose metabolism and lipid synthesis[37]. The intronic SNP rs780094 has been linked to fasting serum triacylglycerol, insulin, and type 2 diabetes risk[38] and is in strong linkage disequilibrium with rs1260326, resulting in reduced regulation of glucokinase activity by GCKR[39]. In addition, an epigenetic study suggested that rs780094 functions as a transcriptional enhancer of GCKR expression[40].
Two genes related to adipokines or adipokine receptors were identified in this study (ADIPOQ, LEPR), and moderate evidence was observed for ADIPOQ rs266729. Adiponectin, the protein product of the ADIPOQ gene, is an anti-inflammatory adipokine that functions as an insulin sensitizer and regulates energy homeostasis and glucose and lipid metabolism[41]. A GWAS found that the ADIPOQ gene was the major contributor to plasma adiponectin, accounting for 6.7% of its variation[42]. The rs266729 SNP in the ADIPOQ promoter region regulates adiponectin levels and promoter activity[43].
We also identified two genes related to oxidative stress and antioxidants (HFE, MTHFR) that were associated with NAFLD. HFE regulates cellular iron uptake[44] and the rs11799945 polymorphism is significantly linked to NAFLD with strong cumulative epidemiological evidence, which is consistent with a previous meta-analysis[14]. Additionally, HFE rs1800562 was only observed among Caucasians and was not detected in studies on Asian populations. Consistent with this, the online dbSNP database showed that the percentages of mutated A alleles reported in Caucasians and Asians were 0.059 and 0.0003, respectively. MTHFR rs1801133 showed a significant association with NAFLD; however, a meta-analysis of nine studies showed moderate heterogeneity. Consistent results for MTHFR rs1801133 polymorphism were reported in a meta-analysis by Sun et al. (2016)[45], although they also identified a significant association with MTHFR rs1801131, which was not significant in this study. Rs1801133 is a common missense variant (C677T) that results in a less active MTHFR enzyme[46,47] and is associated with a higher concentration of homocysteine, which may induce oxidative stress and endoplasmic reticulum stress[48].
We found that TNF rs361525 had strong cumulative evidence of an association with NAFLD, whereas TNF rs1800629 showed no significant association, consistent with a previous meta-analysis by Wang et al. (2012)[49]. TNF gene encodes tumor necrosis factor alpha (TNFα), a pro-inflammatory cytokine involved in the development of NAFLD[50]. However, the role of TNF rs361525 remains elusive, and mixed findings were reported regarding rs361525 and the level of TNFα in blood[51,52]. Further studies are required to elucidate the potential mechanisms for TNF polymorphisms in the development of NAFLD.
This study compared the results to those of previous meta-analyses and found consistency in 14 variants in 10 genes, and inconsistency in six variants in five genes. These differences may be attributed to the updated number of included studies and differences in the inclusion and exclusion criteria. For example, some previous studies contained data that did not conform to the Hardy-Weinberg equilibrium or included samples with other chronic liver diseases. In addition, the inconsistent results may also be a result of different selections of genetic models. In this meta-analysis, we used the results based on allele contrast models for comparison with previous studies.
To the best of our knowledge, this is the first study to comprehensively review studies analyzing genetic susceptibility in NAFLD and to extract data from GWASs, WES studies, and candidate gene studies. Potential susceptibility genes were categorized into eight categories based on their genetic functions, which may have facilitated the interpretation of the findings. Our study has certain limitations. First, although a thorough literature search was conducted using several strategies, it is likely that some publications were overlooked. Second, studies not published in English and publications without resolvable genotype counts were not included, which may have resulted in a publication bias. However, these studies probably represent a small percentage of all publications that investigated NAFLD-associated variants, and we did not detect significant publication bias in most meta-analyses. Third, the meta-analyses were conducted only for variants with a minimum of five data sources. Fourth, the use of genotype counts and crude estimates of effects precludes more sophisticated analyses, including adjusted estimates of association and gene-gene and gene-environment interactions, for which raw genotype data are required. Fifth, although we conducted a stratified analysis by ethnicity, we were unable to examine the potential sources of heterogeneity, which were limited by the number of studies available. Sixth, there was heterogeneity between the studies on the diagnostic methods used to define NAFLD. Finally, most of the positive variants in this study did not reach very high levels of statistical significance, and those with modest P values should be considered cautiously. Issues such as multiple testing, linkage disequilibrium among associated variants, and undetected publications or other reporting biases may mask the observed association.
In conclusion, this systematic review and meta-analysis provides a comprehensive summary of the genetic susceptibility to NAFLD. Recent GWASs and WES studies have identified 72 variants associated with the risk of NAFLD. Meta-analyses identified 11 genetic variants with strong or moderate evidence of association, and further study of these variants is required. We also identified 14 variants in 11 genes that showed no evidence of association with NAFLD risk. These findings provide valuable information for future studies to assess genetic factors associated with the risk of NAFLD. Supplemental Materials were in www.besjournal.com.
HTML
Literature Searches and Study Eligibility
Data Extraction and Study Quality Assessment
Statistical Analysis
Assessment of Cumulative Evidence
Literature Searches and Study Characteristics
Summary of GWASs and WES Study
Summary of Candidate Gene Association Studies
Meta-Analysis of Associations between Genetic Variations and NAFLD
Comparison between Previously Published Meta-Analysis Results and this Meta-Analysis
&These authors contributed equally to this work.
 23334+Supplementary Materials.pdf
|

|

 Quick Links
 DownLoad: