


-
Currently, an increasing number of people travel to high altitudes. The incidence of acute mountain sickness (AMS) ranges between 25% and 94% depending on ascent rates, altitudes reached, and susceptibilities[1]. AMS typically occurs in unacclimatized individuals after rapidly ascending to altitudes above 2,500 m. It is characterized by headache, fatigue, gastrointestinal symptoms, and dizziness, as defined by the Lake Louise Score (LLS) (2018)[2]. To date, studies on AMS prevention and treatment comprise the bulk of AMS research, whereas those on AMS prediction comprise a minority. Appropriate, reliable, and timely prediction would help avoid unnecessary risks. Previous studies on predicting AMS occurrence have applied and evaluated several parameters, methods, and hypotheses, such as the “tight fit” hypothesis[3,4], baseline anxiety score[5], EEG-detected regional right temporal cerebral dysfunction[6], arterial oxygen saturation and breathing frequency (accuracy, 78%–80%)[7], heart rate, pulse pressure, and arterial elastance measured using ambulatory blood pressure device[8], machine learning model trained on physiological and environmental parameters (accuracy, 0.886–0.998)[9], serum levels of matrix metalloproteinase-9 and substance-P (area under the curve [AUC], 0.709)[10], serum uric acid levels (AUC, 0.817) and platelet distribution width (AUC, 0.844)[11], differential gene expression (AUC, 0.833–0.989)[12], circulating microRNAs (AUC, 0.986) and salivary microRNA (AUC, 0.811)[13,14], plasma concentrations of biomarkers (AUC, 0.704–0.908)[15], and so on.
Notably, previous studies have predominantly used cardiovascular and respiratory indicators and gene expression levels for predicting AMS. While some studies on AMS occurrence have used cerebral blood flow (CBF) values, thus far, no study has attempted to predict AMS using sea-level CBF.
High-altitude headache (HAH) is the most common symptom among patients with AMS. A previous study demonstrating the association between HAH and hemodynamics indicated that HAH occurrence is influenced by CBF values and not systemic hemodynamics[16]. Bian et al. investigated the potential significance of CBF in AMS, emphasizing that AMS was associated with alterations in cerebral hemodynamics in the posterior circulation, particularly an increase in cerebral blood velocity[17]. In addition, our previous study that compared CBF values measured using three-dimensional pseudo-continuous arterial spin labeling (3D-pCASL) found differences in CBF variations at high altitudes between participants with AMS and those without[18]. All these studies suggest a potential correlation between AMS and cerebral hemodynamics. Therefore, we hypothesized that baseline sea-level CBF measurements may demonstrate predictive value for AMS.
Three-dimensional pCASL can be used to quantitatively measure CBF values without the need for contrast media injection. It has been widely applied in the diagnosis and prognostication of central nervous system diseases, including headaches and vasculopathy[19,20]. In this study, we investigated the predictive value of sea-level CBF values for AMS based on CBF analysis at sea level using the 3D-pCASL in healthy volunteers.
-
This study was approved by the Medical Ethics Committee of our hospital (S2015-014-02) and conformed to the Declaration of Helsinki standards. Written informed consent was obtained from all participants.
-
Forty-eight potential travelers were recruited as participants. The inclusion criteria were as follows: healthy volunteers aged between 18 and 40 years (28.83 ± 4.85 years); no history of head trauma, mental or psychological illness, cerebrovascular disease, headaches, sleep disorders, diabetes, hypertension, etc.; no alcohol or drug dependency; right-handedness; sea-level resident who have not traveled to altitudes above 1,500 m within the past 12 months; and no intracranial or carotid artery stenosis on magnetic resonance (MR) angiography. The exclusion criteria include MR scanner-associated claustrophobia, artifacts in the scan caused by the presence of metal foreign bodies, and head motion. The participants avoided consuming therapeutic and preventive drugs, alcohol, and caffeine-containing foods or drinks during the trial period.
-
Participants underwent cerebral magnetic resonance imaging (MRI) and 3D-pCASL at sea level. Images were obtained using a 3.0T MR scanner (Discovery MR 750, GE Healthcare, Milwaukee, WI, USA) with an 8-channel head coil (in vivo) at sea level (50 m). The participants were instructed to lie in the scanner for 5 min before initiating the procedure. All participants underwent 3D-pCASL with the following parameters: 512 sampling points on eight spirals, repetition time (TR) = 4,844 ms, echo time (TE) = 10.5 ms, post-labeling delay (PLD) time = 2025 ms, bandwidth= ± 62.5 kHz, slice thickness = 4 mm, number of slices = 36, field of view (FOV) = 24 cm, number of excitations (NEX) = 3, acquisition time = 4 min 41 s.
-
MR data of the participants were acquired at sea level 36 h before traveling to high altitude. Data on physiological variables including age, height, weight, systolic blood pressure, diastolic blood pressure, heart rate, and blood oxygen saturation were recorded.
The participants were transported to a high altitude of 3,650 m by air. The LLS was recorded 8 h after arrival at a high altitude. The LLS comprises four parts: headache, gastrointestinal symptoms, fatigue, and dizziness. The severity of each symptom is rated on a scale of 0–3 (none = 0, mild = 1, moderate = 2, and severe = 3)[2]. AMS was defined as a total score of at least three points, with a headache score of at least one point. Based on AMS scores, the participants were divided into AMS and non-AMS groups.
-
Original images transferred to the workstation were processed for CBF mapping using Functool 3D-ASL. The arterial territories as ROI were sketched by a blinded observer (blinded to the symptoms) with 7-year experience in neuroradiology using ITK-SNAP software in terms of the definition in a previous study[21,22]. The ROI measurement consisted of cortical CBF values in the anterior cerebral artery (ACA), middle cerebral artery (MCA), posterior cerebral artery (PCA), and posterior inferior cerebellar artery (PICA) territories. The CBF value of each ROI was auto-extracted using the software. Laterality index (LI) of the CBF was calculated in different arterial territories using the Equation[23]: LI = (LCBF - RCBF)/(LCBF + RCBF). In this study, the LI was calculated by multiplying by 1,000. Three months later, the ROI sketching procedures were repeated by the same observer and performed by another blinded observer with 2-year experience in neuroradiology.
-
Statistical analyses were performed using the SPSS (version 26.0), MedCalc, and GraphPad Prism software (version 10.1.2). Normality tests were performed for all continuous quantitative variables. All variables were normally distributed except the LI of CBF in the MCA in men and the LI of CBF in the PICA in women. T-tests and nonparametric tests were used to assess differences in CBF or LI scores in CBF between the two groups. Spearman’s correlation analysis was also performed. Univariate logistic regression analysis was used to select the AMS predictors. The predictive ability was assessed using a receiver operating characteristic (ROC) curve. P significance was set at P < 0.05. Intraclass correlation coefficient (ICC) analysis was used to evaluate interobserver and intraobserver agreement levels for sketching the ROI of different arterial territories.
-
Forty-eight volunteers (23 males and 25 females; age range, 19–39 years) were enrolled in this study. The age (31.36 ± 4.59 years vs. 28.36 ± 4.05 years, P = 0.096) and the incidence (47.83% vs. 56.00%, P = 0.773) of AMS showed no significant difference between men and women. Detailed information is presented in Table 1. The Spearman correlation coefficient between HAH severity and LLS was 0.662 (P < 0.01) in men and 0.626 (P < 0.01) in women.
Parameters Men (n = 23) Women (n = 25) Non-AMS AMS P Non-AMS AMS P Number (%) 12 (52.17) 11 (47.83) 11 (44.00) 14 (56.00) Age (year) 29.17 ± 4.80 31.36 ± 4.59 0.276 26.55 ± 5.45 28.36 ± 4.05 0.350 SaO2 (%) 97.17 ± 0.58 97.36 ± 0.67 0.459 97.82 ± 0.98 97.79 ± 0.43 0.912 Height (cm) 176.42 ± 4.87 173.18 ± 5.17 0.137 162.73 ± 4.50 162.21 ± 4.89 0.790 Weight (kg) 73.17 ± 10.47 74.23 ± 9.03 0.798 60.45 ± 14.07 55.71 ± 6.62 0.275 BMI (kg/m2) 23.53 ± 3.41 24.74 ± 2.70 0.361 22.95 ± 6.16 21.15 ± 2.07 0.315 Systolic blood pressure (mmHg) 117.67 ± 10.16 120.36 ± 13.05 0.584 107.09 ± 12.31 107.07 ± 7.57 0.996 Diastolic blood pressure (mmHg) 80.67 ± 6.89 78.91 ± 8.60 0.593 71.27 ± 7.81 72.79 ± 7.15 0.619 Heart rate (beats/min) 75.08 ± 6.67 77.73 ± 8.14 0.402 75.27 ± 10.68 70.36 ± 8.32 0.208 Mean CBF (mL/100 g/min) 69.67 ± 9.40 79.47 ± 8.73 0.017* 82.89 ± 17.43 80.68 ± 9.95 0.692 Note. Data are mean ± SD. AMS, acute mountain sickness; BMI, body mass index; SaO2, blood oxygen saturation; CBF, cerebral blood flow. *Statistical significance was attributed as P < 0.05. Table 1. Demographics and physiological indicators in men and women
-
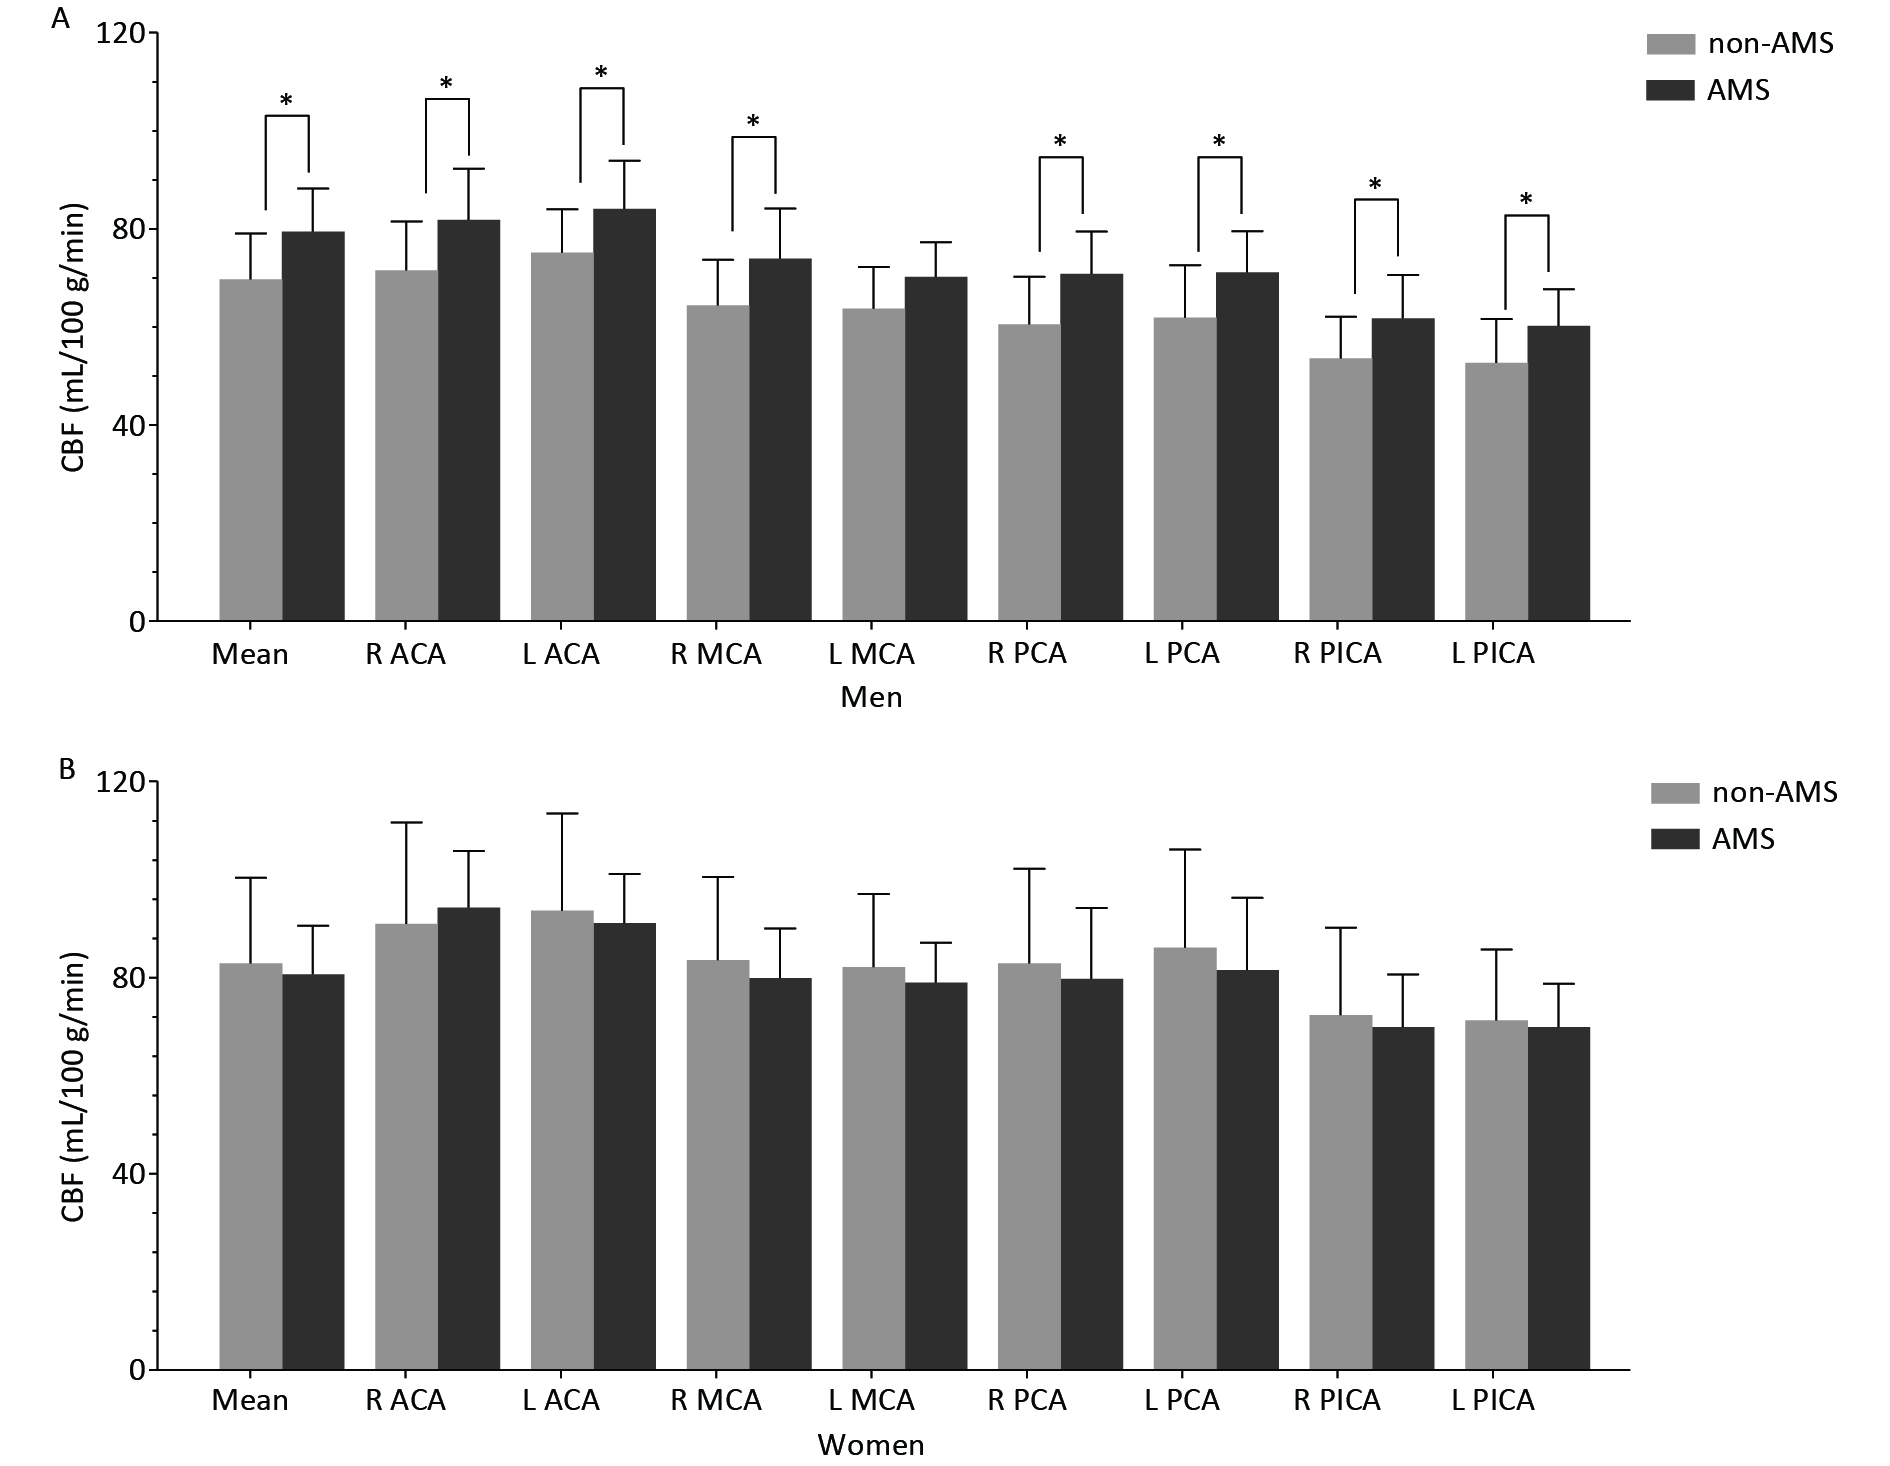
The mean cortical CBF in women (81.65 ± 2.69 mL/100 g/min) was higher than that in men (74.35 ± 2.12 mL/100 g/min) (P < 0.05).
The CBF features of the male and female groups are shown in Figure 1.
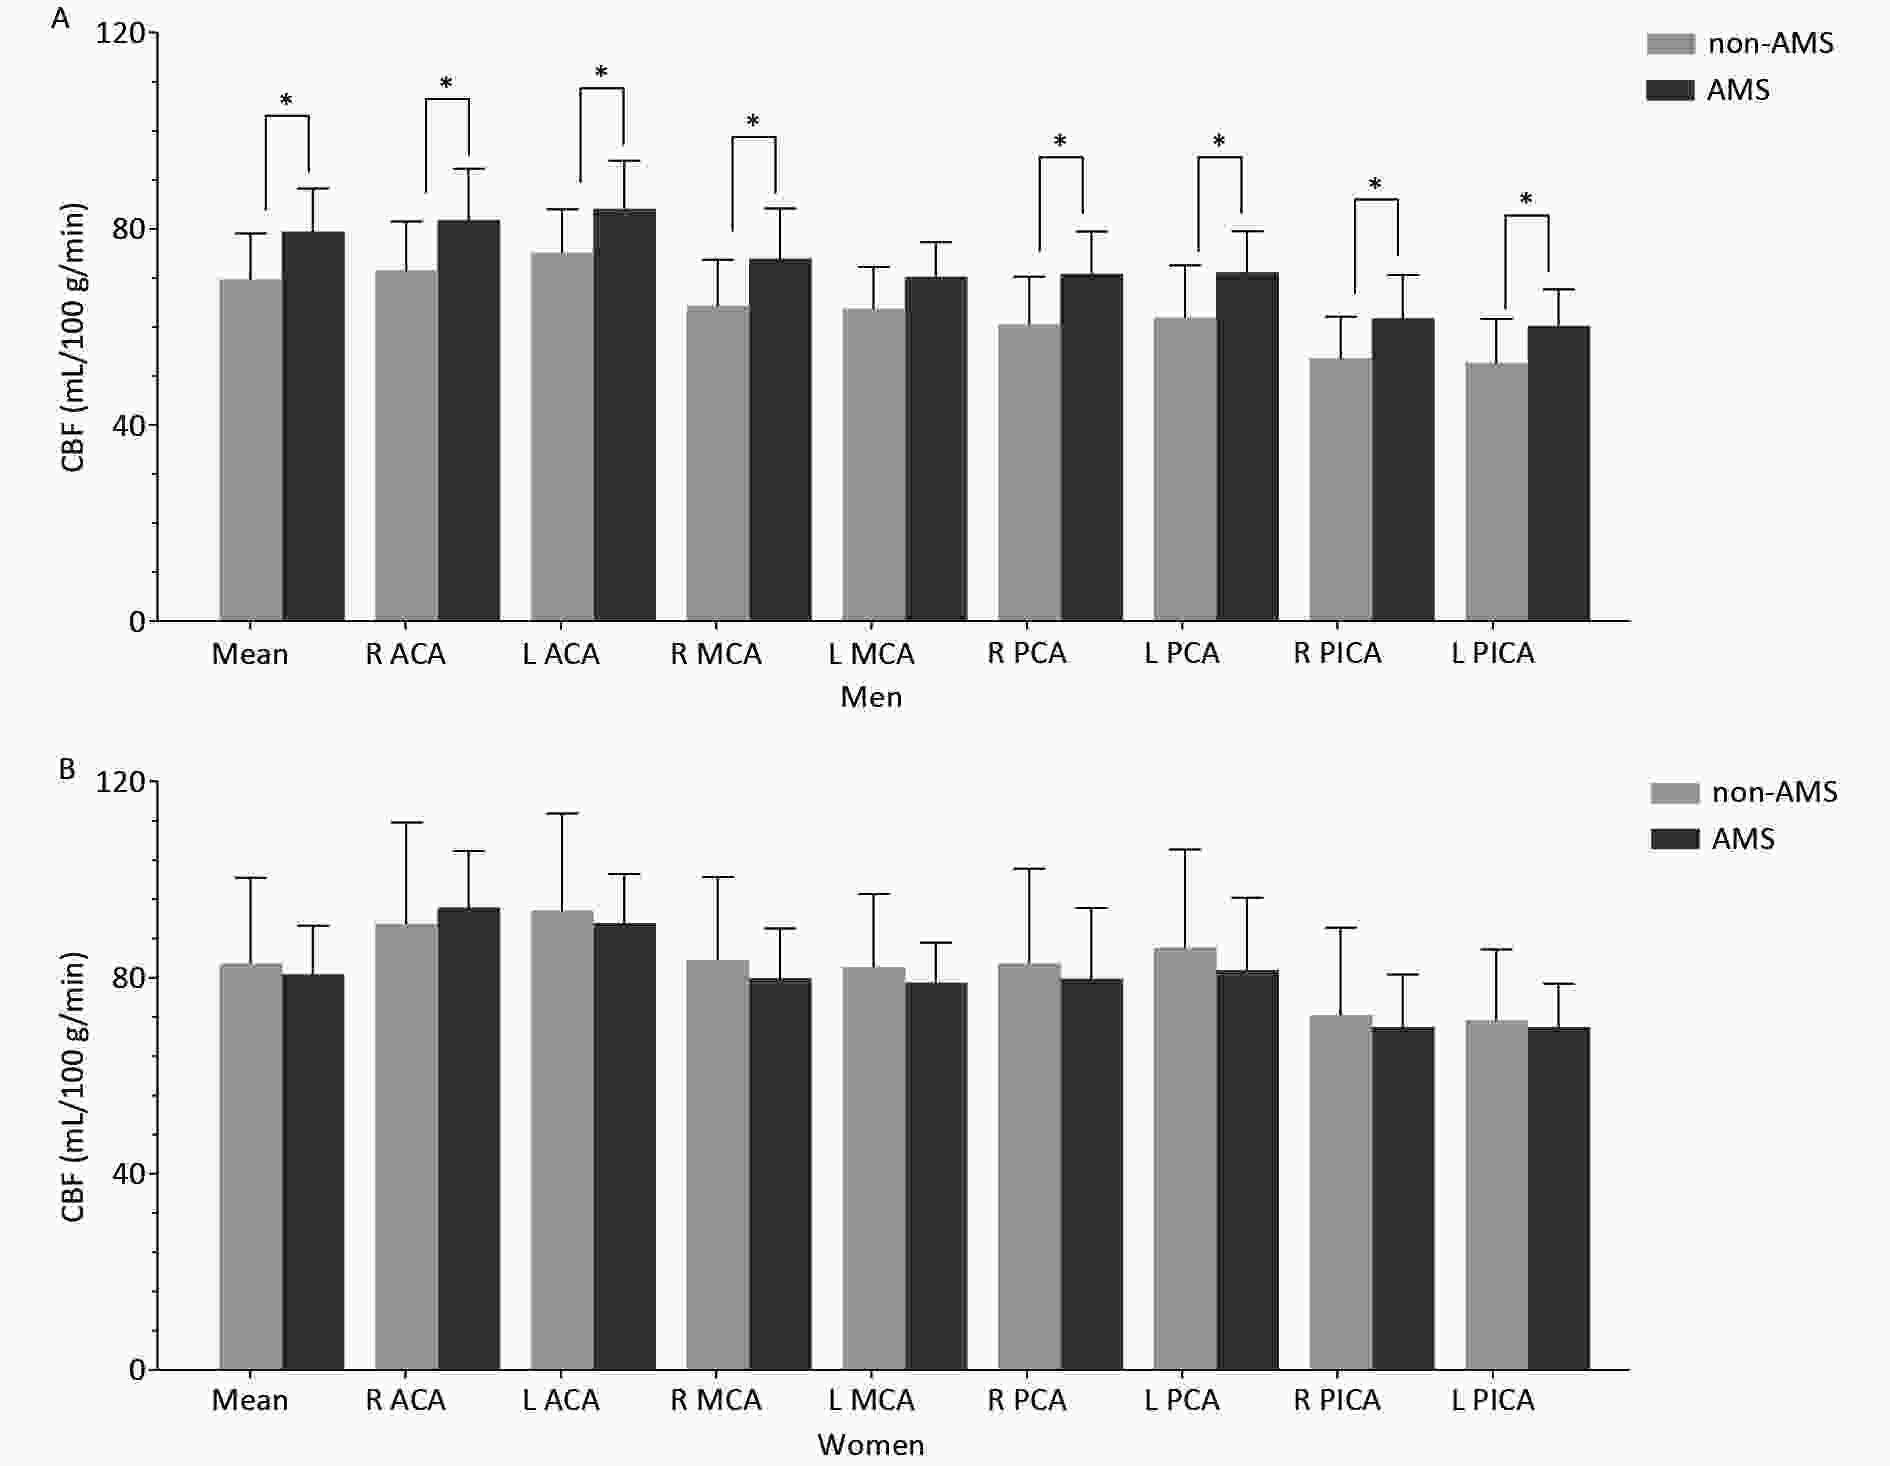
Figure 1. Cortical CBF values in different arterial territories between non-AMS and AMS in men (A) and in women (B).
In men, the mean cortical CBF was significantly higher in the AMS group than in the non-AMS group (Table 1), and regional CBF was significantly higher in the AMS group in most arterial territories (Table 2).
Variables Men (n = 23) Women (n = 25) Non-AMS AMS P Non-AMS AMS P R ACA 71.55 ± 9.95 81.80 ± 10.47 0.025* 90.98 ± 20.71 94.25 ± 11.55 0.620 L ACA 75.15 ± 8.85 84.05 ± 9.86 0.033* 93.69 ± 19.78 91.12 ± 9.98 0.676 R MCA 64.39 ± 9.28 73.92 ± 10.24 0.029* 83.56 ± 16.94 79.87 ± 10.20 0.506 L MCA 63.75 ± 8.45 70.25 ± 7.02 0.059 82.16 ± 14.91 79.01 ± 8.12 0.506 R PCA 60.58 ± 9.68 70.86 ± 8.58 0.014* 82.91 ± 19.29 79.76 ± 14.46 0.645 L PCA 61.89 ± 10.69 71.13 ± 8.42 0.033* 86.16 ± 19.95 81.55 ± 14.70 0.512 R PICA 53.65 ± 8.45 61.76 ± 8.84 0.035* 72.40 ± 17.82 69.93 ± 10.73 0.672 L PICA 52.73 ± 8.91 60.21 ± 7.47 0.042* 71.29 ± 14.50 69.91 ± 8.81 0.772 LI ACA 25.52 ± 37.44 13.88 ± 31.56 0.431 15.45 ± 32.47 −16.14 ± 27.10 0.014* LI MCA −15.09
(−20.54, 13.44)−25.64
(−64.00, 13.51)0.288 −6.84 ± 31.23 −4.07 ± 24.62 0.807 LI PCA 7.30 ± 26.29 1.85 ± 27.26 0.630 17.01 ± 24.71 9.10 ± 26.41 0.449 LI PICA −9.71 ± 34.95 −11.53 ± 30.09 0.895 1.31
(22.08, −23.37)−3.10
(−20.27, 12.29)0.936 Note. Data are mean ± SD, and median (interquartile range); Unit of CBF: mL/100g/min; R, right; L, left; CBF, cerebral blood flow; ACA, anterior cerebral artery; MCA, middle cerebral artery; PCA, posterior cerebral artery; PICA, posterior inferior cerebellar artery; LI, laterality index; AMS, acute mountain sickness. *Statistical significance was attributed as P < 0.05. Table 2. CBF Features in the Non-AMS and AMS groups
In women, no significant mean cortical CBF difference was found between the AMS and non-AMS groups, but the LI of CBF in the ACA was significantly different between the AMS and non-AMS groups (Table 2).
-
All variables with statistically significant differences (P < 0.05) in the t-tests and nonparametric tests were selected for univariate logistic regression analysis (Table 3).
Gender Variables OR P 95% CI Men R ACA 1.127 0.051 1.000−1.270 L ACA 1.129 0.059 0.996−1.281 R MCA 1.108 0.045* 1.002−1.224 R PCA 1.135 0.031* 1.012−1.272 L PCA 1.115 0.056 0.997−1.247 R PICA 1.129 0.057 0.996−1.279 L PICA 1.132 0.066 0.992−1.291 Women LI ACA 0.965 0.027* 0.935−0.996 Note. R, right; L, left; CI, confidence interval; OR, odds ratio; ACA, anterior cerebral artery; MCA, middle cerebral artery; PCA, posterior cerebral artery; PICA, posterior inferior cerebellar artery; LI, laterality index. *Statistical significance was attributed as P < 0.05. Table 3. Univariate logistic regression analysis in men and women
-
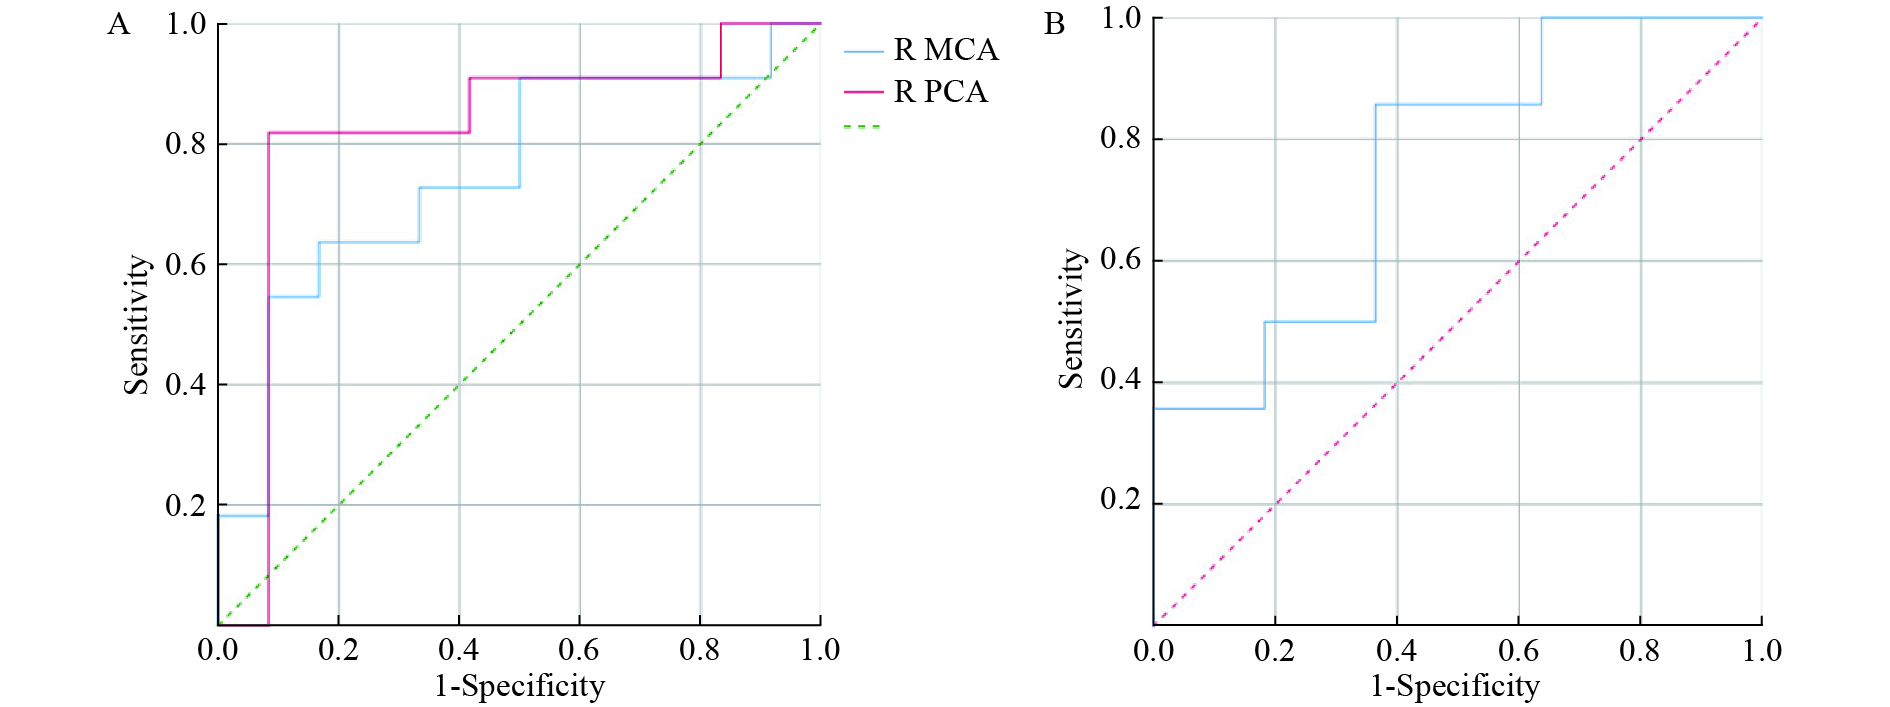
After predictor selection by univariate logistic regression analysis, the predictive ability of the variables (if P < 0.05, univariate logistic regression analysis) was evaluated, and the variable with the largest area under the ROC curve (AUC) was considered the best predictor for AMS (Table 4 and Figure 2). In men, the CBF of the right PCA best predicted AMS (AUC = 0.818, accuracy = 86.96%). In women, the performance of LI in the ACA was good for AMS prediction, with an AUC of 0.753 and an accuracy of 76.00%.
Gender Variables AUC (95% CI) Se (%) Sp (%) PPV (%) NPV (%) YI Cutoff Accuracy (%) Men R MCA 0.750 (0.542−0.958) 63.64 83.33 77.78 71.43 0.470 > 71.106 73.91 R PCA 0.818 (0.619−1.000) 81.82 91.67 90.00 84.62 0.735 > 66.468 86.96 Women LI ACA 0.753 (0.558−0.948) 85.71 63.64 75.00 77.78 0.494 ≤ 6.751 76.00 Note. Unit of CBF in Cutoff: mL/100 g/min; AUC: area under the curve; CI: confidence interval; PPV: positive predictive value; NPV: negative predictive value; YI: Youden index; R: right; ACA: anterior cerebral artery; MCA: middle cerebral artery; PCA: posterior cerebral artery; LI: laterality index; AMS: acute mountain sickness. Table 4. Predictive vapacity sssessment in AMS in men and women
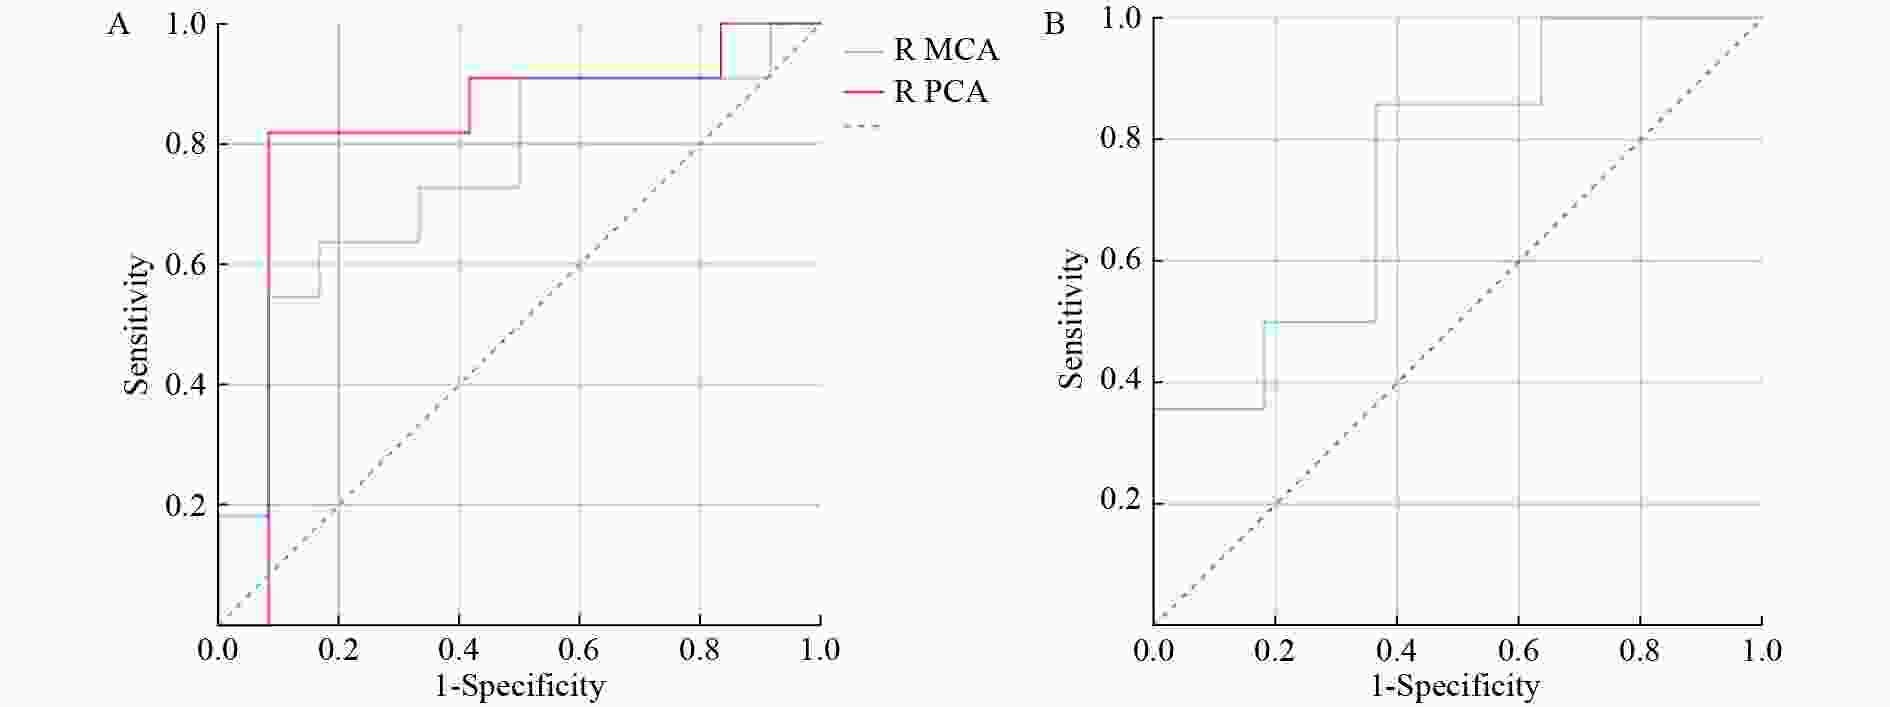
Figure 2. ROC curves of cortical CBF in the right MCA (AUC = 0.750) and right PCA (AUC = 0.818) for predicting AMS in men (A) and LI of cortical CBF in the ACA (AUC = 0.753) for predicting AMS in women (B).
-
The intra- and inter-observer agreements for ROI sketching of the different arterial territories were excellent (ICCs: 0.939–0.990 and 0.951–0.985, respectively).
-
The present study observed significantly elevated sea-level CBF values in most arterial territories among men in the AMS group. Moreover, the LI of the ACA could predict AMS in women. Hormones are important factors affecting CBF between sexes, as studies have shown that estrogen has a neuroprotective effect by stabilizing energy metabolism in the vascular endothelium[24,25]. It protects against reperfusion injury and ameliorate CBF during ischemia[26]. It can also relieve vasospasms and help reduce fluctuations in hemodynamics[27]. Since CBF in women is relatively stable and is not easily affected by changes in the external environment, this may explain why CBF does not work for AMS prediction in women, and that may be the reason for the different prediction indices in men and women.
Compared with previous studies, the advantages of our approach are as follows: an MRI-based ASL scan is non-invasive without any intravenous injection of contrast media, and MRI has been clinically applied for many years and is widely accessible in major cities in China. Furthermore, our experiment was designed based on the following aspects: 1. Ascent rate: Rapid ascent by air instead of by car, train, or even on foot[5,6,10,11,14,15] was conducted in our study to avoid gradual acclimatization to hypoxia and to ensure the evaluation of AMS by LLS. 2. Subjects: Potential tourists with inclusion and exclusion criteria were selected as volunteers instead of professional mountaineers or random subjects without controlling for influencing factors[6,10,12,28]. 3. Real-world high altitude: The LLS was evaluated at 3650 m instead of in a simulation chamber with normobaric hypoxia[3,7,13]. 4. Data acquisition: To predict AMS in advance, our data were collected at sea level before exposure to hypoxia compared with those of previous studies[6,7,9,10].
To the best of our knowledge, only a few studies have demonstrated associations between sea-level CBF and AMS, and some of our findings are consistent with previous results indicating that the sea-level velocities of the left VA and right MCA in the HAH group were higher than non-HAH group[16]. Arterial velocities or diameters are usually regarded as indicators of cerebral blood flow[29-31]. In addition, Feddersen et al. measured the baseline CBF velocity of the MCA, and although they did not perform a statistical analysis, the data indicated that CBF velocities were indeed higher in the AMS group[6]; similar results at sea level were reported in good-performance climbers and bad-performance climbers[32].
Despite accumulating evidence regarding AMS and its related factors, its mechanisms of action remain elusive[33]. As well known, CBF is dynamically regulated by many factors, including changes in cerebral metabolic activity, sympathetic nerve activity and so on[34].
Considering the brain’s limited oxygen storage capacity, its already inordinate metabolism would undoubtedly be exacerbated during hypoxia[35], which indicates a high demand for oxygen in the brain to maintain normal work due to insufficient partial pressure of oxygen. Cerebral oxygen delivery depends on the combined effect of CBF and arterial oxygen content (CaO2), and a reduction in CaO2 causes a CBF increase[36]. Classically, the CBF is adjusted according to the metabolic demands of the brain[37]. Therefore, a higher sea-level CBF indicates a higher metabolic demand or relatively lower CaO2. Increased oxygen consumption during hypoxia stimulus[16] and insufficient oxygen necessitate compensatory adaptations in physiological functioning, including an initial quicker increase in CBF and a subsequent slower increase in hemoglobin mass and concentration[35]. Therefore, CBF surges compensate for the acute ascent to high altitudes. Based on the evidence above, we considered that individuals with higher sea-level CBF might desire more oxygen, thus increasing the CBF to provide sufficient oxygen and nutrients to the brain during hypoxia. That might cause the increase of cerebral blood volume and subsequent increase of intracranial pressure, leading to headache and AMS in terms of the “tight-fit” hypothesis[29-31]. Just as Cochand revealed that individuals with AMS might be inherently more vulnerable to higher intracranial pressure[38].
There is a traditional hypothesis that sparse sympathetic innervation in the posterior fossa may lead to an inclination toward high perfusion[39,40]. Sympathoexcitation during hypoxia[41,42] may lead to higher perfusion in those with higher sea-level CBF in the cerebellum, consequently higher intracranial pressure and susceptibility to headache and AMS at the plateau, as mentioned above.
Relationship between CBF increase and functional activation. It has been suggested that HAH might share similar mechanisms with migraines[16] in which headache is closely correlated with the functional interference of the occipital cortex and cerebellum[43]. Moreover, previous studies have demonstrated close correlations between brain regions and their corresponding functions, including the relationship between the cerebellum and pain perception regulation[44,45], anterior frontal and temporal cortex and pain processing[46,47], cingulate and pain stimulus[48,49], medial temporal gyrus and sensitivity to chronic hypoxia[50], frontal island and dyspnea and homeostasis maintenance at high altitude, frontal insular cortex and aerobic capacity[51-54]. As it has been suggested that the cerebral metabolism rate is coupled with cerebral blood flow[55], we considered that hyperperfusion in the above-mentioned regions might indicate hypermetabolism, and thus, higher sensitivity to pain perception and hypoxia.
Based on the aforementioned explanation, we assumed that AMS is associated with higher CBF values, which is in agreement with previous studies[16,30,56]. Our results showed great agreement with those of Jansen et al. in that cerebellar CBF in bad-performance climbers was consistently higher than that in good-performance climbers[32], and was also consistent with their conclusion that the CBF of people with AMS was higher than that of those without AMS[57].
In this study, CBF in the right PCA was the best predictor of AMS in men, with an AUC of 0.818. Our results showed that the posterior circulatory system plays a significant role in AMS prediction. This was consistent with Bian’s finding of a close correlation between the posterior circulation system and AMS score[17]. In addition, it was demonstrated that both higher baseline bilateral VA velocities in HAH and increased VA and BA velocities under hypoxia[16] implied strong associations between the posterior circulation system and HAH. In our study, a correlation was found between HAH and AMS, suggesting that our results are consistent with those of Bian. In addition, previous study has indicated that after arrival and short stay at high altitude, CBF was inclined to increase in the posterior arterial territories[58], and a “tight” posterior fossa was more vulnerable to headache syndrome[29,30], thus causing higher susceptibility of AMS.
Our results showed no differences in the cortical CBF between the groups of women. That may be due to the fact that women normally possess significantly higher CBF than men[59]. Unlike the results in men, the best predictor of AMS in women was related to the ACA instead of the posterior circulatory system in the present study. Although our study revealed different results from those of Bian et al., previous findings on frontal headache during hypoxia[60,61] and increased velocity of the ACA at high altitudes might indicate the role of the ACA and its asymmetry in AMS in women[16].
In this study, only the LI of CBF in the ACA showed good predictive ability for AMS, with an AUC of 0.753 in women. The asymmetry of the isonym artery may be of great importance in predicting AMS in women, probably caused by the amplified effects of the anatomical asymmetry of arteries during CBF regulation under hypoxia, as previously speculated[16]. Our results indicated that women may be more sensitive to the effects of arterial asymmetry, and the specific mechanism warrants further investigation.
Although this study is the first to predict AMS using ASL, it has some limitations. First, the sample size was relatively small. Future studies with larger sample sizes are needed, although this is logistically challenging. Second, only young participants were included. Third, only one PLD (2025 ms) was applied, and multi-PLD should be used in future studies to acquire more CBF data for analysis.
-
Sea-level cortical CBF acquired using 3D-pCASL can be used to predict AMS. A higher CBF in specific regions of the posterior circulatory system would result in a higher risk of AMS in men. The asymmetry of the isonym artery may play a role in predicting AMS in women.
-
This study was approved by the Medical Ethics Committee of our hospital (S2015-014-02) and conformed to the Declaration of Helsinki standards. Written informed consent was obtained from all participants.
HTML
Participants
Data Acquisition
Magnetic Resonance Scanning
Procedures
Data Processing
Statistical Analysis
Demographic Characteristics
The Relationship between CBF and AMS
Predictor Selection (Univariate Logistic Regression Analysis)
Prediction Ability Assessment (ROC Curve Analysis)
Intraobserver and Interobserver Agreement
COMPETING INTERESTS The authors declare no conflict of interest.
&These authors contributed equally to this work.

 Quick Links
 DownLoad: