


-
Chronic kidney disease (CKD) is a widespread condition that threatens human health[1]. An estimated 850 million people worldwide have CKD[2]. The fatality rate of CKD has been increasing annually, and it is predicted to be the fifth leading cause of death by 2040[3]. In China, the number of people with CKD has reached 130 million[2], while deaths caused by CKD ranked 12th[4] among different diseases in 2017. As the onset of CKD is insidious, the trend of developing CKD at a younger age has increased in recent years[5]. However, early detection of CKD can help control disease progression and improve treatment efficacy[6].
Dyslipidemia may affect the kidney in various ways, either directly by causing harmful renal lipid deposits or indirectly through vessel damage, systemic inflammation, oxidative stress, and other signaling mediators interacting with the kidney[7,8]. Since the introduction of the lipid nephrotoxicity hypothesis in 1982, more evidence supporting the hypothesis that dyslipidemia causes kidney disease has been accumulated[9]. Multiple experimental studies have shown that a hyperlipidemic diet can cause changes in kidney morphology and renal dysfunction[10]. Hypertriglyceridemia and hypercholesterolemia lead to podocyte damage, which results in secondary injury to the tubular interstitium and associated segmental sclerosis[11]. However, the relationship between dyslipidemia and CKD has is consistent in population studies[12-16].
Wen et al. conducted a cross-sectional study of 48,054 including adults in central China to investigate the relationship between lipids and the prevalence of CKD, and found that high-density lipoprotein cholesterol (HDL-C) and triglycerides (TG) had an effect on CKD, with an odds ratios (ORs) and 95% confidence interval (95% CI) of 0.86 (0.79, 0.93) and 1.17 (1.10, 1.23) for each standard deviation (SD) increase, respectively; however, no significant correlation was found between low-density lipoprotein cholesterol (LDL-C) or total cholesterol (TC) and CKD[12]. A Korean study investigating the longitudinal association between lipid profiles and CKD incidence in a healthy-looking cohort of 10,288 subjects followed for 7 years indicated that the hazard ratios (HRs) of TG, HDL-C and TG to HDL-C ratio (TG/HDL-C) and CKD risk were 1.29 (1.17, 1.41), 0.77 (0.68, 0.88), and 1.22 (1.12, 1.32) for each SD increase in lipid level, respectively. However, there were no longitudinal associations between CKD and TC, LDL-C, or LDL-C to HDL-C ratios (LDL-C/HDL-C)[17]. In a Japanese national longitudinal study with 287,326 participants followed up for 3 years, high levels of TG, LDL-C, TG/HDL-C, and low levels of HDL-C were independently associated with the development of CKD, with HRs of 1.09 (1.05, 1.13), 0.99 (0.95, 1.04), 1.14 (1.09, 1.18) and 1.12 (1.05, 1.18), respectively[14]. A study in East China showed that high TG, TC, and LDL levels were associated with CKD onset, whereas low TC and LDL levels were not, with HRs of 3.08 (1.11, 6.69), 3.84 (1.90, 7.76), and 1.40 (1.11, 2.48). This study also found that increased lipid levels accelerated the development of End Stage Renal Disease (ESRD)[18]. Based on these findings, the results of different studies vary and contradict each other. Therefore, the effects of lipid indicators on the risk of CKD need to be elucidated, while it remains unclear whether they vary significantly by study area, subjects, economic conditions, living habits and other factors. No similar results were found in populations in the less-developed areas of Western China. In addition, only a few studies have considered combined indicators. The value of composite indicators in predicting CKD is more meaningful than that of individual indicators[13,19,20], however these findings need to be confirmed.
In addition, some studies showed a positive linear correlation between CKD and TC, TG, LDL-C, TC to HDL-C ratio (TC/HDL-C), and TG/HDL-C, and a negative linear correlation between CKD and HDL-C[21-23], while others have shown a nonlinear relationship between CKD and HDL-C, LDL-C, and TG/HDL-C. However, further research is required to validate the exposure-response relationship between lipids and CKD, while there is no defined risk threshold between the two. However, specific lipid level thresholds can not only provide a reference for clinical prognosis assessment but also provide a basis for the screening of patients with CKD in the population.
Therefore, based on the Jinchang cohort in Northwest China, this study explored the relationship between lipid profiles (including single and combined indicators) and CKD, while the lipid profile thresholds that significantly affected the risk of CKD were analyzed using RDD.
-
Patients in the Jinchang cohort[24] were living in Jinchang City, Northwest China. This cohort was established in June 2011, and the baseline data of 48,001 participants were completed in December 2013, the follow-up data of 33,355 participants were completed in December 2015. In this study, 33,355 participants with completed records for both baseline and follow-up data were included as study subjects. First, 569 participants with CKD at baseline and 435 participants with incomplete baseline or follow-up data were excluded. Incomplete variables included blood lipid levels (n = 211), estimated glomerular filtration rate (eGFR) (n = 114), and covariate data (n = 110). Ultimately, 32,351 participants were included in this study. Supplementary Figure S1 (available in www.besjournal.com) shows a flowchart of the study.
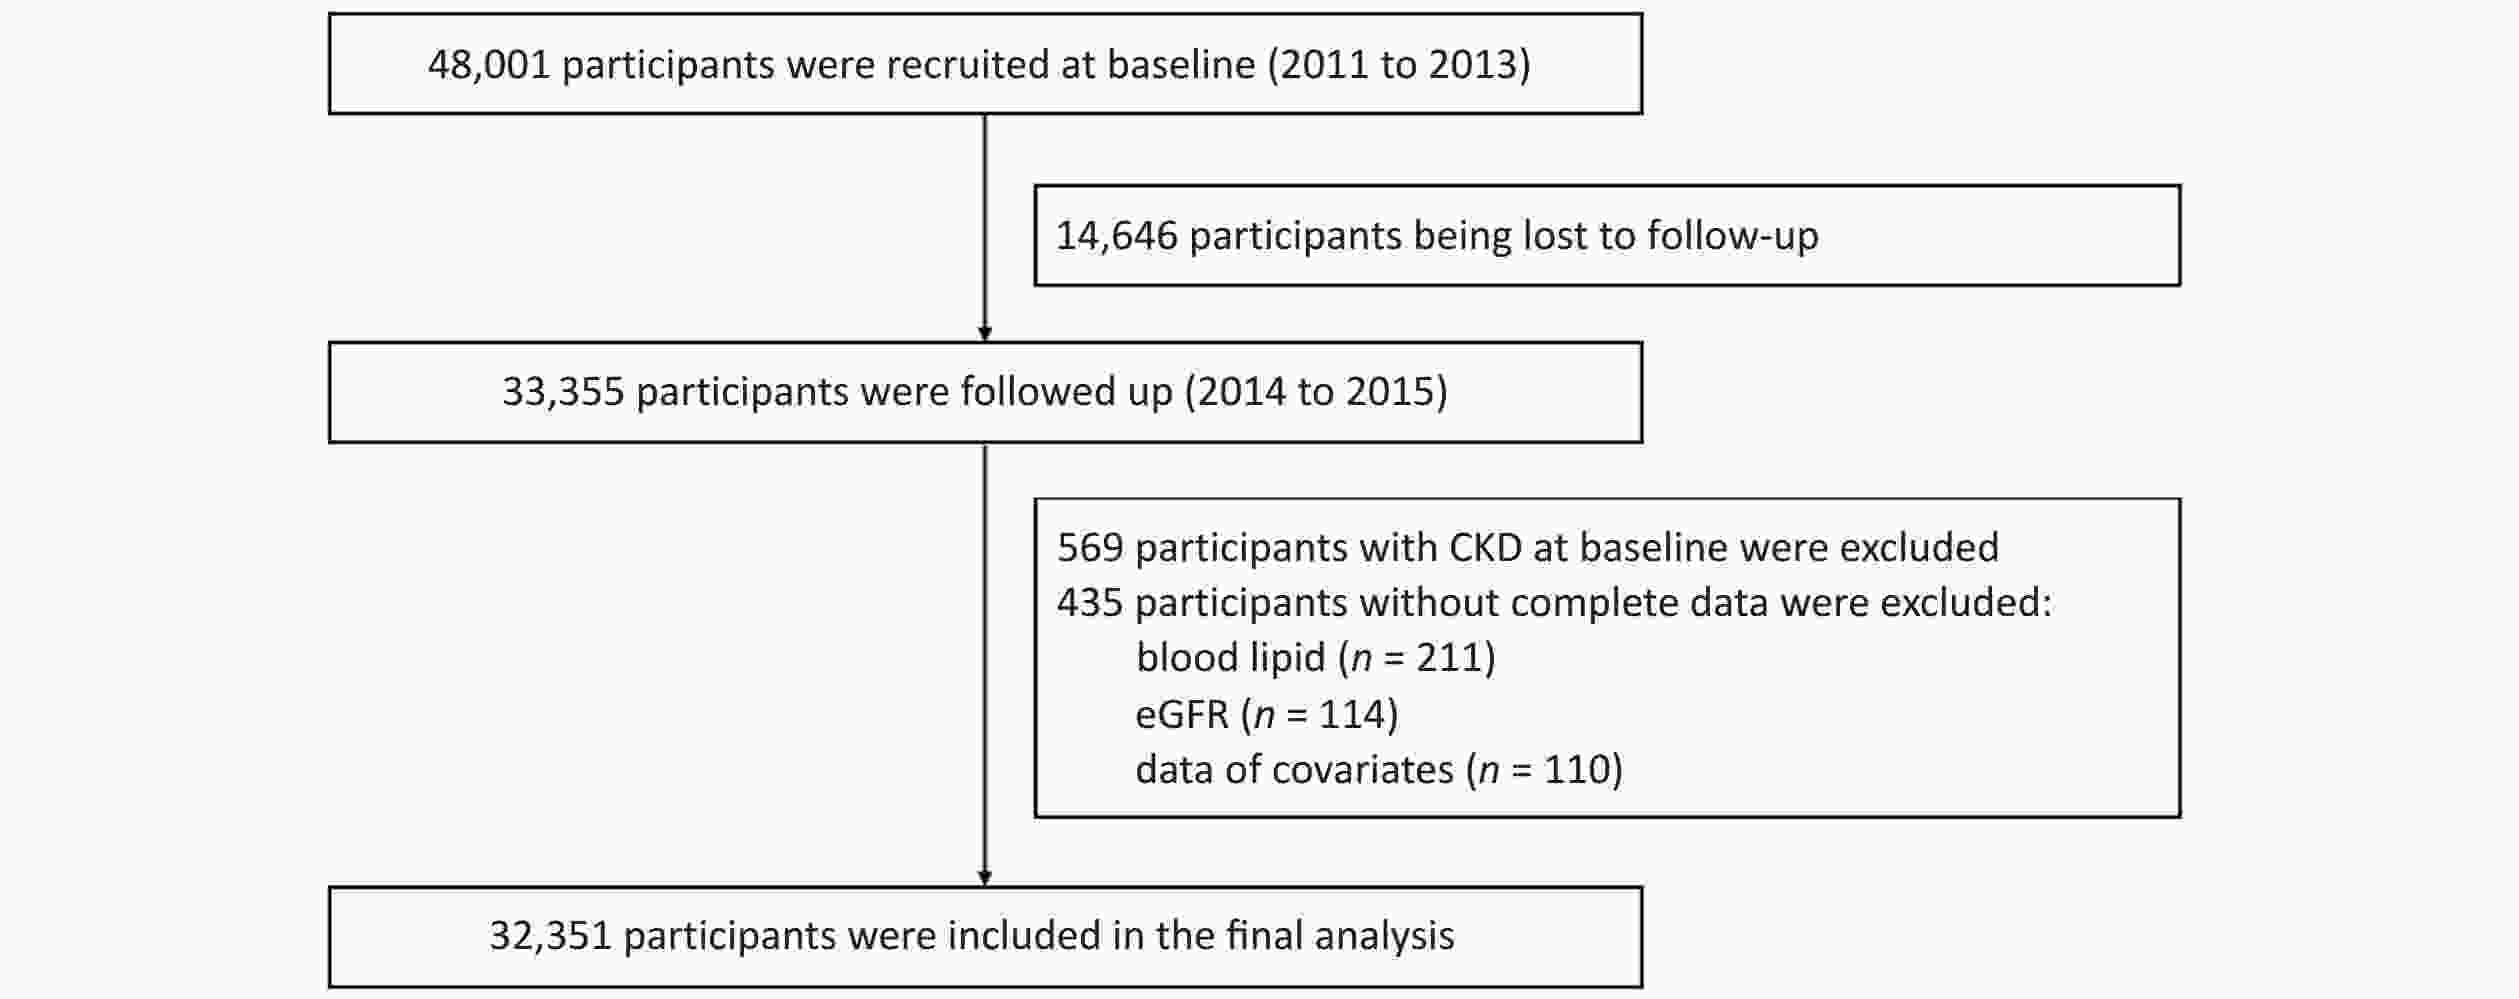
Figure S1. Flowchart of the study. CKD, chronic kidney disease; eGFR, estimated glomerular filtration rate.
All data, including face-to-face interviews, physical examinations, and clinical laboratory tests, were collected from the participants after obtaining informed consent. Data collected from interviews included age, sex, occupation, education level, income, high-salt diet, high-fat diet, smoking, alcohol consumption habits, exercise, comorbidities (hypertension, coronary heart disease (CHD), dyslipidemia, and diabetes), and family history of kidney disease. Physical examinations and clinical laboratory tests were performed at a tertiary hospital. Assessment included measurement of blood pressure (BP), height, and weight. BP was measured using an electronic sphygmomanometer (AMPall BP705; Seoul, Korea). Height and weight were measured using an automatic machine (SK-X80/TCS-160D-W/H; Shenzhen, Songka, China). Body mass index (BMI) was calculated as weight (kg) divided by height (m) squared. Clinical laboratory test were performed using automatic biochemical analyzers (Hitachi 7600-020, Kyoto, Japan), including blood lipids (TC, TG, HDL-C, and LDL-C), serum creatinine, fasting blood glucose, and albuminuria. The combined indicators (TC/HDL-C, TG/HDL-C, and LDL-C/HDL-C ratios) were calculated.
-
Patients smoking at least one cigarette per day for more than 6 months were considered smokers, while those drinking at least once a week for more than 6 months were considered drinkers. Regular exercise was defined as that of 30 min or more, for three times a week or more. High-salt and high-fat diets were defined as intakes exceeding the daily recommended intakes according to the Dietary Guidelines for Chinese Residents[25] (salt ≥ 6 g, oil ≥ 30 g). A family history of kidney disease was defined as having first-degree relatives (parents or siblings) with CKD. Presence of hypertension, diabetes, CHD, and dyslipidemia was mainly documented through self-reporting by the patients, while the diagnosis certificate and time of the second-level or higher hospital stay were provided. According to the Chinese Diagnostic Guidelines for Hypertension[26], Diabetes[27], and Dyslipidemia[28], the subjects with BP ≥ 140/90 mmHg measured during physical examination were identified as pateints with hypertension, those with blood glucose ≥ 7.0 mmol/L were identified as patients with diabetes, and those with TC ≥ 6.2 mmol/L or TG ≥ 2.3 mmol/L or HDL-C < 1.0 mmol/L were identified as patients with dyslipidemia. Albuminuria was classified into five levels (-, ±, 1+, 2+ and 3+), while the albuminuria and urinary albumin-creatinine ratio (ACR) were categorized, with - and ± representing levels equivalent to ACR < 30 mg/g, 1+ levels between 30–300 mg/g, and 2+ and 3+ levels of ACR > 300 mg/g[29].
In this study, the lipid profiles (TC, TG, HDL-C, LDL-C, TC/HDL-C, TG/HDL-C, and LDL-C/HDL-C) of the study subjects at baseline were used as exposure factors, while the outcome was the development of CKD. CKD was defined as eGFR < 60 mL/(min∙1.73 m²) and/or the presence of albuminuria (albuminuria ≥ 1+) according to the 2012 KDIGO guidelines[30]. The eGFR was calculated using the Chronic Kidney Disease Epidemiology Collaboration (CKD-EPI) creatinine equation[31].
-
Continuous data were expressed as either the mean ± SD or the median (interquartile range), depending on their distribution. Categorical data were expressed as numbers (%). Restricted cubic spline regression (RCS) was used to analyze the dose-response relationship between serum lipids and CKD. Nodes were set at the percentiles of independent variables (5%, 35%, 65%, and 95%) to adjust the confounder model and obtain the dose-response relationship curve and statistics. An overall trend of P < 0.05 indicated that there was a dose-response relationship between the two variables. If P for overall was < 0.05 and P for nonlinear was > 0.05, it indicated that there was a linear dose-response relationship between the two variables. If P for overall was < 0.05 and P for nonlinear was < 0.05, it indicated a nonlinear dose-response relationship between the two variables. If there was a nonlinear dose-response relationship (P for nonlinear < 0.05), the inflection point was found, and the risks on both sides of the inflection point were analyzed separately.
Three multivariate Cox proportional hazards models were used to estimate the association of risk of CKD with lipid profiles after adjusting for covariates. Through multiple linear regression analysis of the collinearity among lipid indexes, it was found that the tolerance and variance inflation factor between lipid indexes were less than 0.1 and greater than 20, indicating the collinearity problem among lipid indexes. To address this issue, the backward stepwise selection method was used in the multivariate Cox proportional hazard models. To analyze the influence of different variables on the association between lipid profiles and CKD as well as the stability of the results, three models were created successively by adjusting for different variables. Model 1 was adjusted for age, sex, occupation, education level, and income. Model 2 was additionally adjusted for smoking, drinking, exercise, high-salt diet, high-fat diet, and BMI, based on Model 1. Model 3 was additionally adjusted for comorbidities (hypertension, CHD, dyslipidemia, and diabetes), family history of kidney disease, and baseline eGFR based on Model 2. The lipid profiles were grouped by quartiles, and the critical value (or median), HRs and 95% CI were calculated for each group. The effects of blood lipids on CKD were evaluated using Kaplan-Meier curves (log-rank tests). The proportional hazards hypothesis test of the controlling variable was performed by combining the Schoenfeld residual chart and Schoenfeld residual correlation analysis with the rank of time.
In addition, the RDD was used to determine the cutoff value of the lipid profiles that was associated with increased risk of CKD to further clarify the causal relationship between these parameters. First, each lipid profile was used as the grouping variable and the hazard function of CKD was used as the outcome variable. Set The cutoff point with 0.1 as the interval was set, while plotting of the fitting regression curve was performed by using the second-degree polynomial function. During computation of RDD, triangular kernel function was set as the density function, and the parameter for optimal bandwidth was “mserd”. Secondly, the RDD results were examined for their validity and robustness. Validity tests were performed in two ways: 1) whether the covariates satisfied the smoothness assumption (pseudo-outcome), using covariates such as age, BMI, and eGFR as outcome variables and lipids as grouping variables to test whether the local average treatment effect (LATE) estimate was significant. These covariates did not satisfy the smoothness assumption if the estimator was significant; 2) whether the lipids values were continuous at the cutoff value (McCrary's test): testing whether the sample sizes of the grouping variables near the cutoff value were similar to demonstrate the randomness of the model. The robustness check was performed in three ways: 1) Two values were selected on both sides of the original cutoff value as a placebo cutoff value to test for effects at other cutoff points (pseudo-cutoff point); 2) After removing 5%, 10%, 20%, 30%, and 40% of the samples near the cutoff point, if the result was still significant, the result was considered robust (donut-hole approach); 3) The best 50%, 75%, 100%, 150%, and 200% bandwidths were selected to verify that the cutoff value was stable under different bandwidths. If most of the results remained significant, the regression model passed the bandwidth sensitivity test (bandwidth selection).
Finally, because sex and dyslipidemia may affect the relationship between lipid levels and CKD, a stratified analysis was conducted according to these parameters[32,33]. Based on the effect of lipid profiles on CKD, TC/HDL-C and LDL-C were selected for RDD analysis to represent linear and nonlinear relationships.
All analyses were performed using the R 4.0.2 (R Foundation for Statistical Computing, Vienna, Austria). All P‐values were two‐tailed, and the level of significance was set at α = 0.05.
-
In this study, 32,351 subjects were included; 60.74% were men, and the median age was 44 years (range, 30–54 years). The median blood lipid levels of all participants was 4.60 mmol/L (range 4.10–5.20 mmol/L), 1.50 mmol/L (range 1.10–2.30 mmol/L), 1.33 mmol/L (range 1.12–1.57 mmol/L), 3.02 mmol/L (range 2.56–3.51 mmol/L), 3.48 mmol/L (range 2.89–4.17 mmol/L), 1.16 mmol/L (range 0.72–1.91 mmol/L), 2.27 mmol/L (range 1.84–2.77 mmol/L) for TC, TG, HDL-C, LDL-C, TC/HDL-C, TG/HDL-C, and LDL-C/HDL-C, respectively. The proportion of participants who were consumming alcohol, following a high-salt diet, and high-fat diet was smaller than 30%. The prevalence of hypertension, CHD, diabetes, and dyslipidemia was 28.42%, 2.69%, 6.96%, and 36.53%, respectively. The prevalence rates of hypertension, CHD, diabetes, and dyslipidemia in the CKD population were 29.63%, 6.94%, 25.46%, and 51.39%, respectively. The prevalence of hypertension, CHD, diabetes, and dyslipidemia was significantly higher in the CKD than in the non-CKD population (Table 1).
Characteristics CKD (n = 648) NO-CKD (n = 31,703) Total (n = 32,351) Age (Years) 59 (45–70) 44 (38–54) 44 (39–54) Sex (Male) 484 (74.69) 19,167 (60.46) 19,651 (60.74) Occupation Managerial staff 86 (13.27) 4,121 (13.00) 4,207 (13.00) Worker staff 493 (76.08) 24,596 (77.58) 25,089 (77.55) Technical and logistics staff 69 (10.65) 2,986 (9.42) 3,055 (9.44) Education Junior middle school or below 389 (60.03) 11,777 (37.15) 12,166 (37.61) Senior middle school or equivalent 151 (23.30) 8,925 (28.15) 9,076 (28.05) College or above 108 (16.67) 11,001 (34.70) 11,109 (34.34) Income (≥ ¥2,000) 288 (44.44) 15,446 (48.72) 15,734 (48.64) Smoking (Yes) 248 (38.27) 11,629 (36.68) 11,877 (36.71) Alcohol consumption (Yes) 143 (22.07) 6,599 (20.82) 6,742 (20.84) Regular exercise 340 (52.47) 14,558 (45.92) 14,898 (46.05) High-salt diet 164 (25.31) 7,018 (22.14) 7,182 (22.20) High-fat diet 138 (21.30) 6,127 (19.33) 6,265 (19.37) BMI, kg/m2 24.88 (22.76–27.33) 23.34 (21.19–25.59) 23.38 (21.2–25.64) Hypertension (Yes) 192 (29.63) 4,227 (13.33) 9,193 (28.42) CHD (Yes) 45 (6.94) 825 (2.60) 870 (2.69) Diabetes (Yes) 165 (25.46) 2,086 (6.58) 2,251 (6.96) Dyslipidemia (Yes) 333 (51.39) 11,484 (36.22) 11,817 (36.53) Family history of kidney disease (Yes) 1 (0.15) 52 (0.16) 53 (0.16) eGFR- mL/min per 1.73 m² 90.40 (70.41–105.63) 105.46 (95.47–113.02) 105.28 (95.08–112.97) TC, mmol/L 4.80 (4.20–5.40) 4.6 (4.10–5.20) 4.60 (4.10–5.20) TG, mmol/L 1.90 (1.30–2.80) 1.50 (1.10–2.30) 1.50 (1.10–2.30) HDL-C, mmol/L 1.23 (1.04–1.47) 1.33 (1.12–1.57) 1.33 (1.12–1.57) LDL-C, mmol/L 3.15 (2.67–3.67) 3.01 (2.56–3.5) 3.02 (2.56–3.51) TC/HDL-C 3.89 (3.22–4.56) 3.47 (2.89–4.15) 3.48 (2.89–4.17) TG/HDL-C 1.50 (0.98–2.54) 1.15 (0.72–1.90) 1.16 (0.72–1.91) LDL-C/HDL-C 2.55 (2.08–3.1) 2.27 (1.83–2.76) 2.27 (1.84–2.77) Note. Values are expressed as number (percent) or median (interquartile range). BMI, body mass index; CKD, chronic kidney disease; CHD, coronary heart disease; TC, total cholesterol; TG, triglycerides; HDL-C, high-density lipoprotein cholesterol; LDL-C, low-density lipoprotein cholesterol; eGFR, estimated glomerular filtration rate. Table 1. Baseline characteristics
-
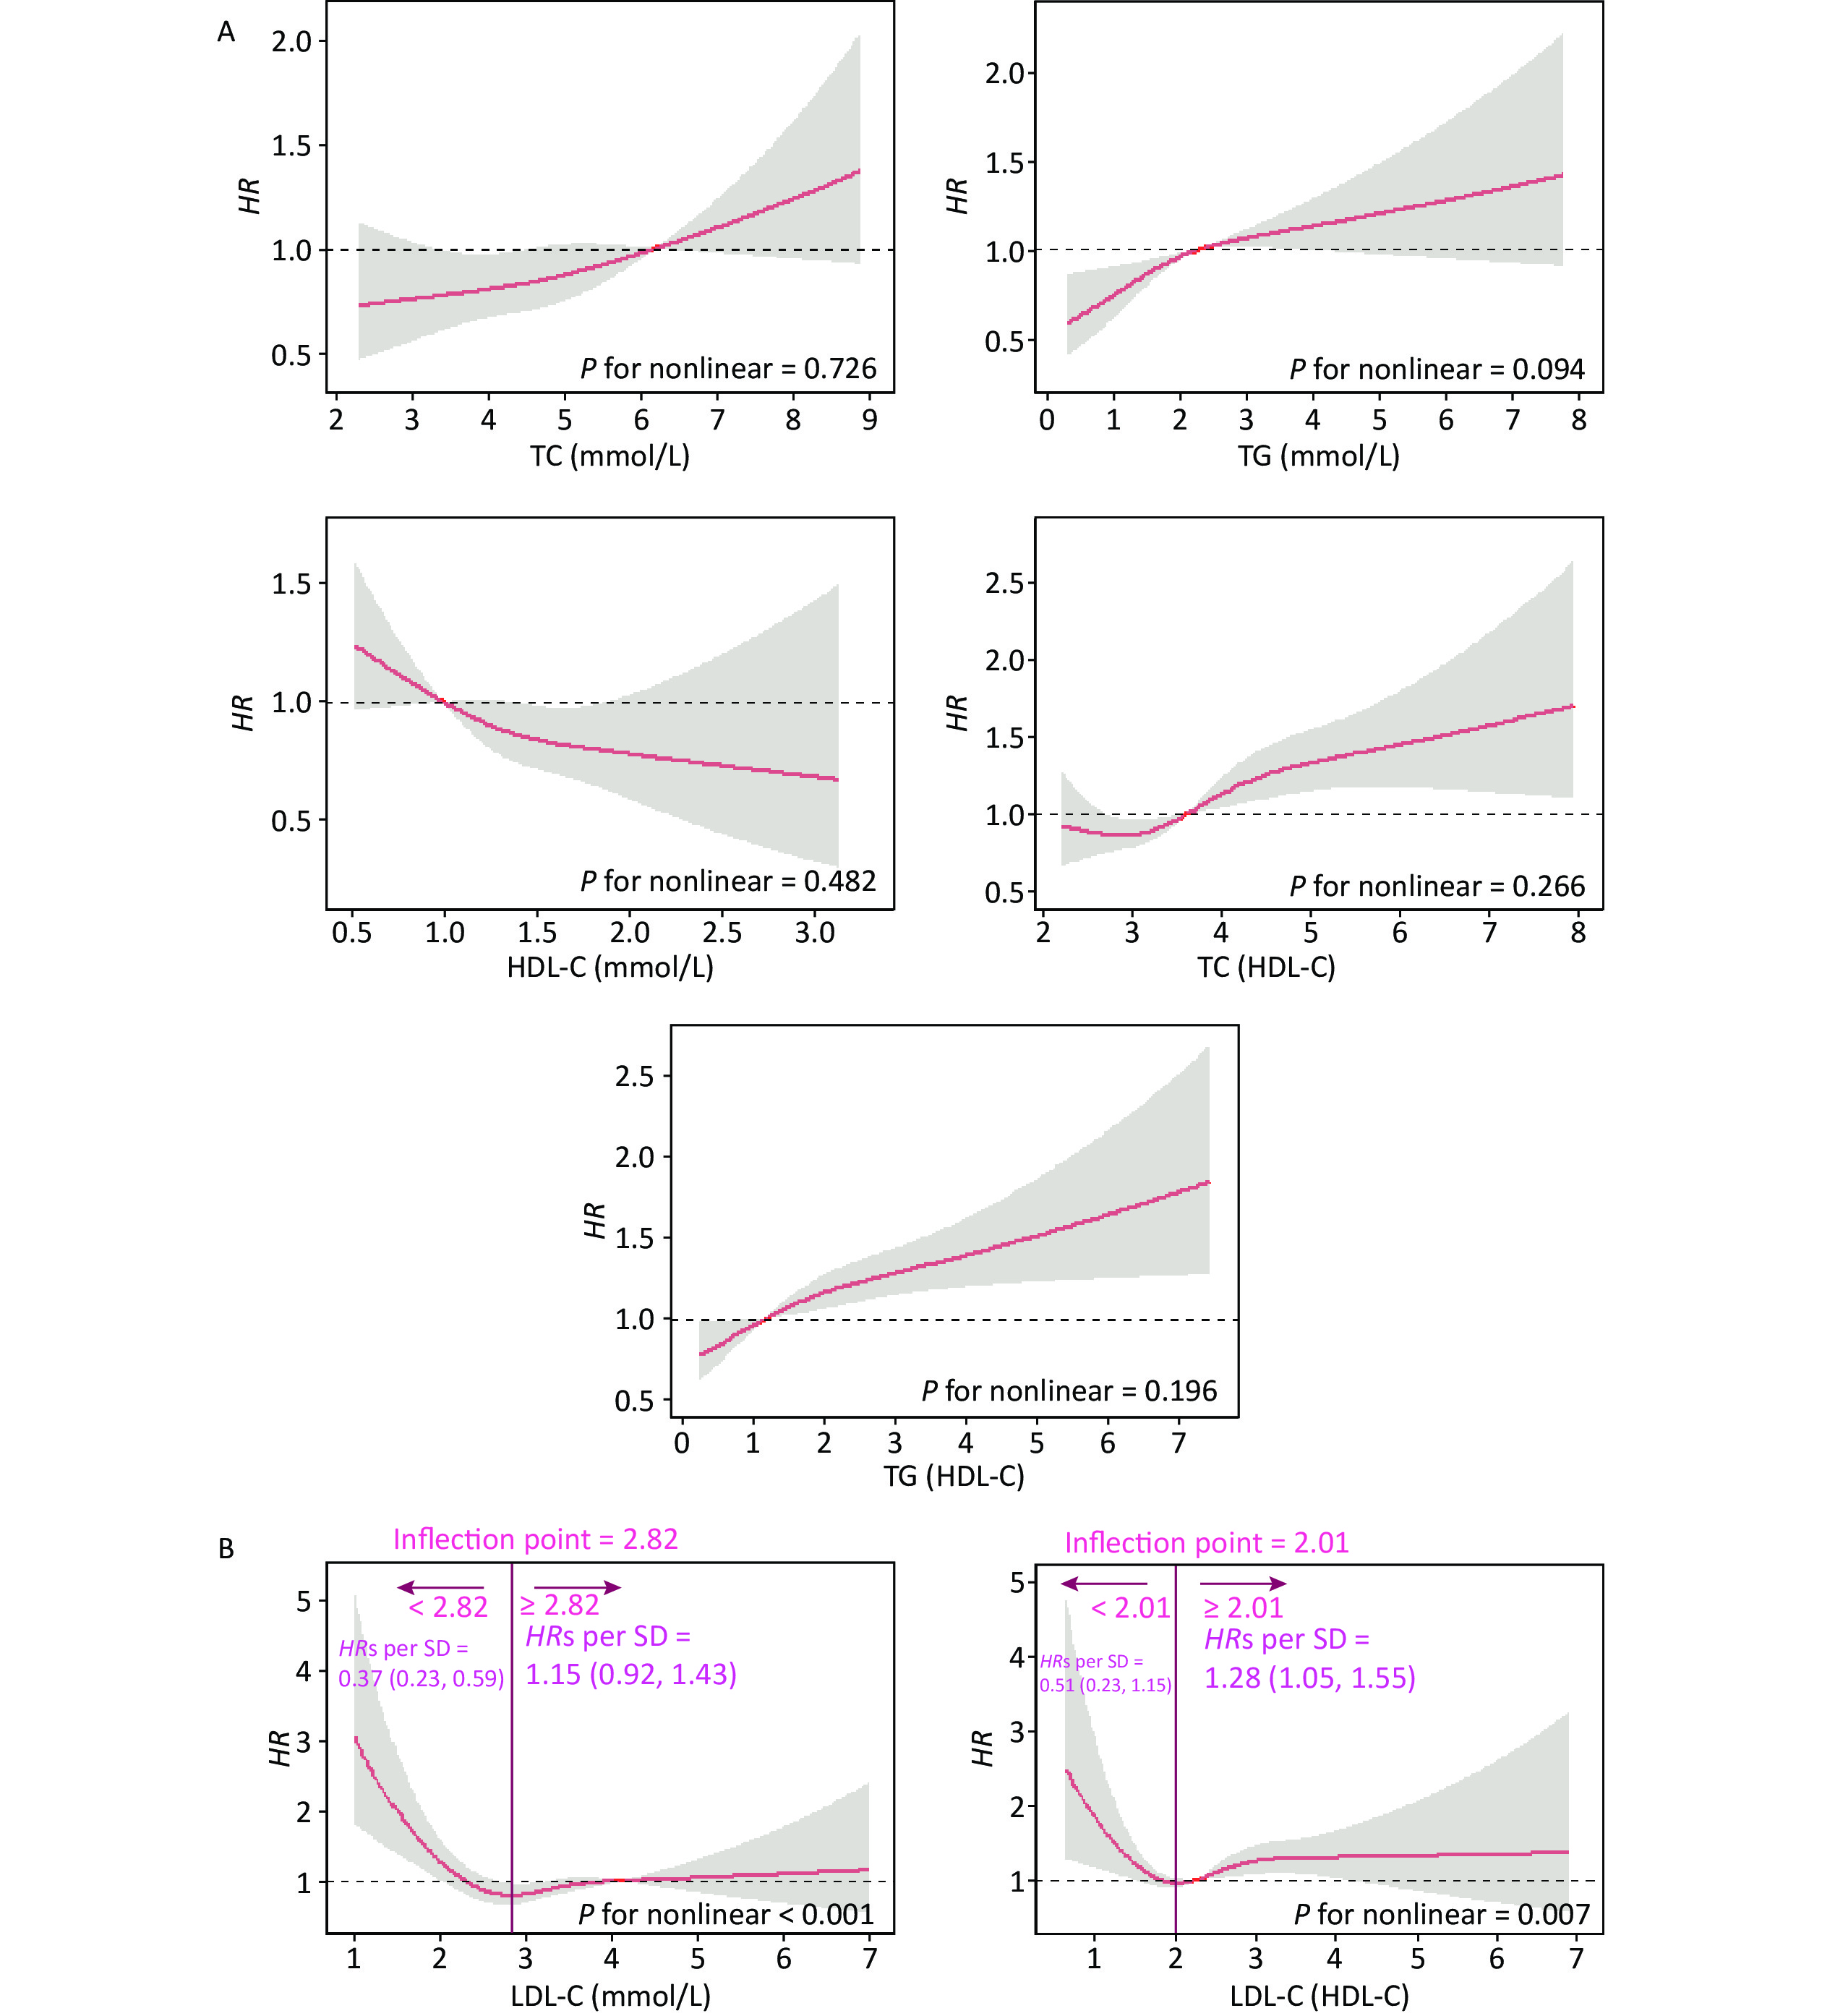
In this cohort study, the median follow-up time was 2.2 (0.5, 4.2) years, during which 2.00% (n = 648) of the participants developed CKD. Figure 1 shows the relationship between lipid profiles and risk of CKD by RCS analysis. After adjusting for confounders in Model 3, there was a positive linear dose-response relationship between TC, TG, TC/HDL-C, and TG/HDL-C levels and the risk of CKD (P for overall < 0.05, P for nonlinear > 0.05). There was a negative linear dose-response relationship between HDL-C levels and CKD risk (P for overall < 0.05, P for nonlinear > 0.05). There was a nonlinear dose-response relationship between LDL-C and LDL-C/HDL-C levels and the risk of CKD (P for overall < 0.05, P for nonlinear < 0.05). The inflection point of LDL-C was 2.82 mmol/L, the HRs left and right the inflection point were 0.37 (0.23, 0.59) and 1.15 (0.92, 1.43), respectively; the inflection point of LDL-C/HDL-C was 2.01 mmol/L, and the HRs left and right the inflection point were 0.51 (0.23, 1.43) and 1.28 (1.05, 1.55).
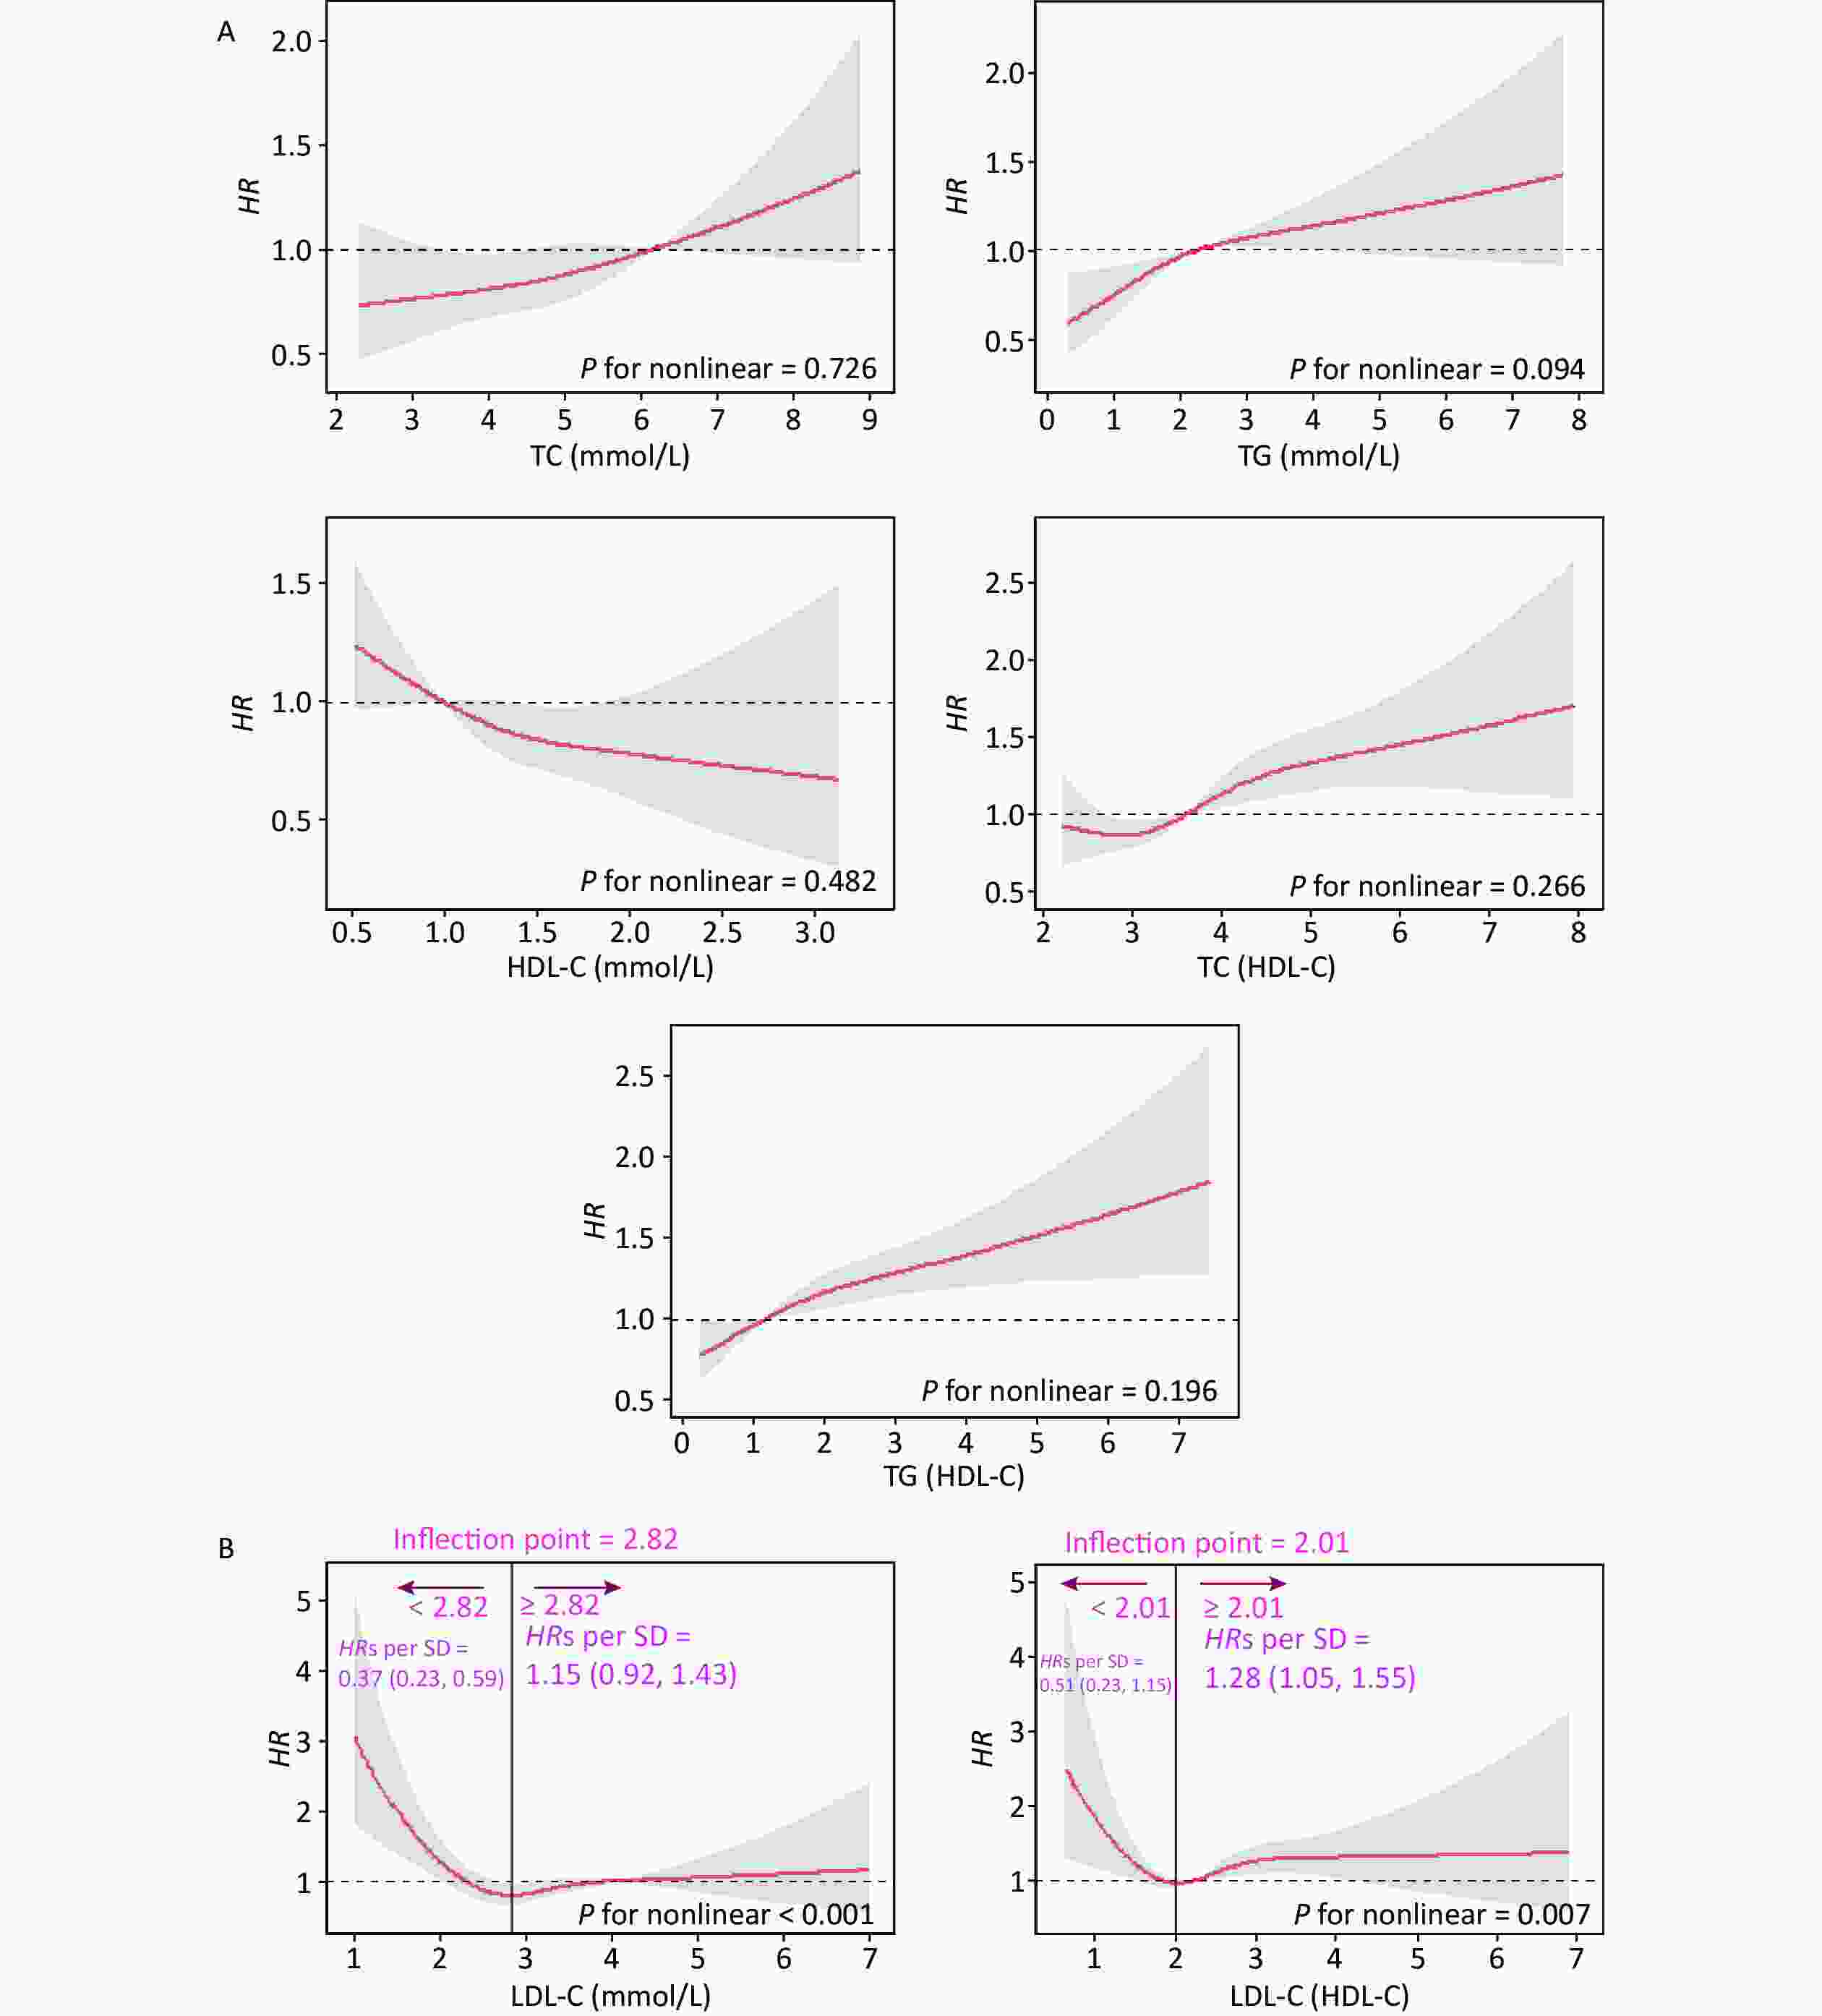
Figure 1. Dose-response relationship between lipid profiles and risk of CKD. (A) Lipid profiles are linearly correlated with CKD (TC, TG, HDL-C, TC/HDL-C, and TG/HDL-C). (B) Lipid profiles are nonlinearly associated with CKD (LDL-C, LDL-C/HDL-C). The solid line indicates the adjusted HR, and the shaded area represents 95% CI for HR. The x-axis represents the level of lipid profiles, and the y-axis the HRs for CKD where the reference value is the clinical cutoff or the 50th percentile of composite indicator (specifically, 6.20 mmol/L for TC, 2.30 mmol/L for TG, 1.00 mmol/L for HDL-C, 4.10 mmol/L for LDL-C, 3.48 for TC/HDL-C, 1.16 for TG/HDL-C, and 2.27 for LDL-C/HDL-C). Model was adjusted for age, sex, occupation, education level, income, smoking, alcohol consumption, exercise, high-salt diet, high-fat diet, BMI, hypertension, HRs, hazard ratios; SD, standard deviation; BMI, body mass index; CKD, chronic kidney disease; CHD, coronary heart disease; TC, total cholesterol; TG, triglycerides; HDL-C, high-density lipoprotein cholesterol; LDL-C, low-density lipoprotein cholesterol.
Table 2 shows the HRs and 95% CI for the associations between the five lipid indicators and CKD in the three models. In Model 3, the HRs for CKD per one SD increase in lipid levels were 1.11 (1.01, 1.22) for TC, 1.10 (1.05, 1.16) for TG, 0.75 (0.58, 0.98) for HDL-C, 1.16 (1.08, 1.24) for TC/HDL-C, and 1.09 (1.05, 1.14) for TG/HDL-C, respectively. Furthermore, Figure 2 shows the risk of CKD at different lipid levels in Model 3. The risk of CKD significantly increased in the highest quartiles (Q4) of TG, TC/HDL-C, and TG/HDL-C compared with the lower quartiles (Q1). In the quartile group, the P trends for TC, TG, TC/HDL-C, and TG/HDL-C were significant; however, reagarding HDL-C there was no particular trend. Compared to participants with normal lipid levels, the risk of CKD was significantly higher in those with abnormal TG levels, whereas participants with lipid levels below the median had a significantly increased risk of CKD compared to participants with lipid levels below the median.
Lipid profiles Model 1 Model 2 Model 3 HRs (95% CI) P HRs (95% CI) P HRs (95% CI) P TC 1.22 (1.11, 1.35) < 0.001 1.18 (1.07, 1.30) 0.001 1.11 (1.01, 1.22) 0.025 TG 1.19 (1.13, 1.24) < 0.001 1.15 (1.10, 1.21) < 0.001 1.10 (1.05, 1.16) < 0.001 HDL-C 0.58 (0.45, 0.75) < 0.001 0.71 (0.55, 0.93) 0.012 0.75 (0.58, 0.98) 0.035 TC/HDL-C 1.26 (1.19, 1.34) < 0.001 1.20 (1.13, 1.29) < 0.001 1.16 (1.08, 1.24) < 0.001 TG/HDL-C 1.15 (1.11, 1.20) < 0.001 1.12 (1.08, 1.17) < 0.001 1.09 (1.05, 1.14) < 0.001 Note. Values are expressed as median (interquartile range). Model 1 was adjusted for age, sex, occupation, education level, and income. Model 2 was additionally adjusted for smoking, alcohol consumption, exercise, high-salt diet, high-fat diet, and BMI, based on Model 1. Model 3 was additionally adjusted for comorbidities (hypertension, CHD, dyslipidemia, and diabetes), family history of kidney disease, and baseline eGFR based on Model 2. HRs, hazard ratios; CI, confidence interval; TC, total cholesterol; TG, triglycerides; HDL-C, high-density lipoprotein cholesterol; LDL-C, low-density lipoprotein cholesterol. Table 2. Hazard ratios and 95% confidence interval for CKD per one standard deviation increase in lipid profiles
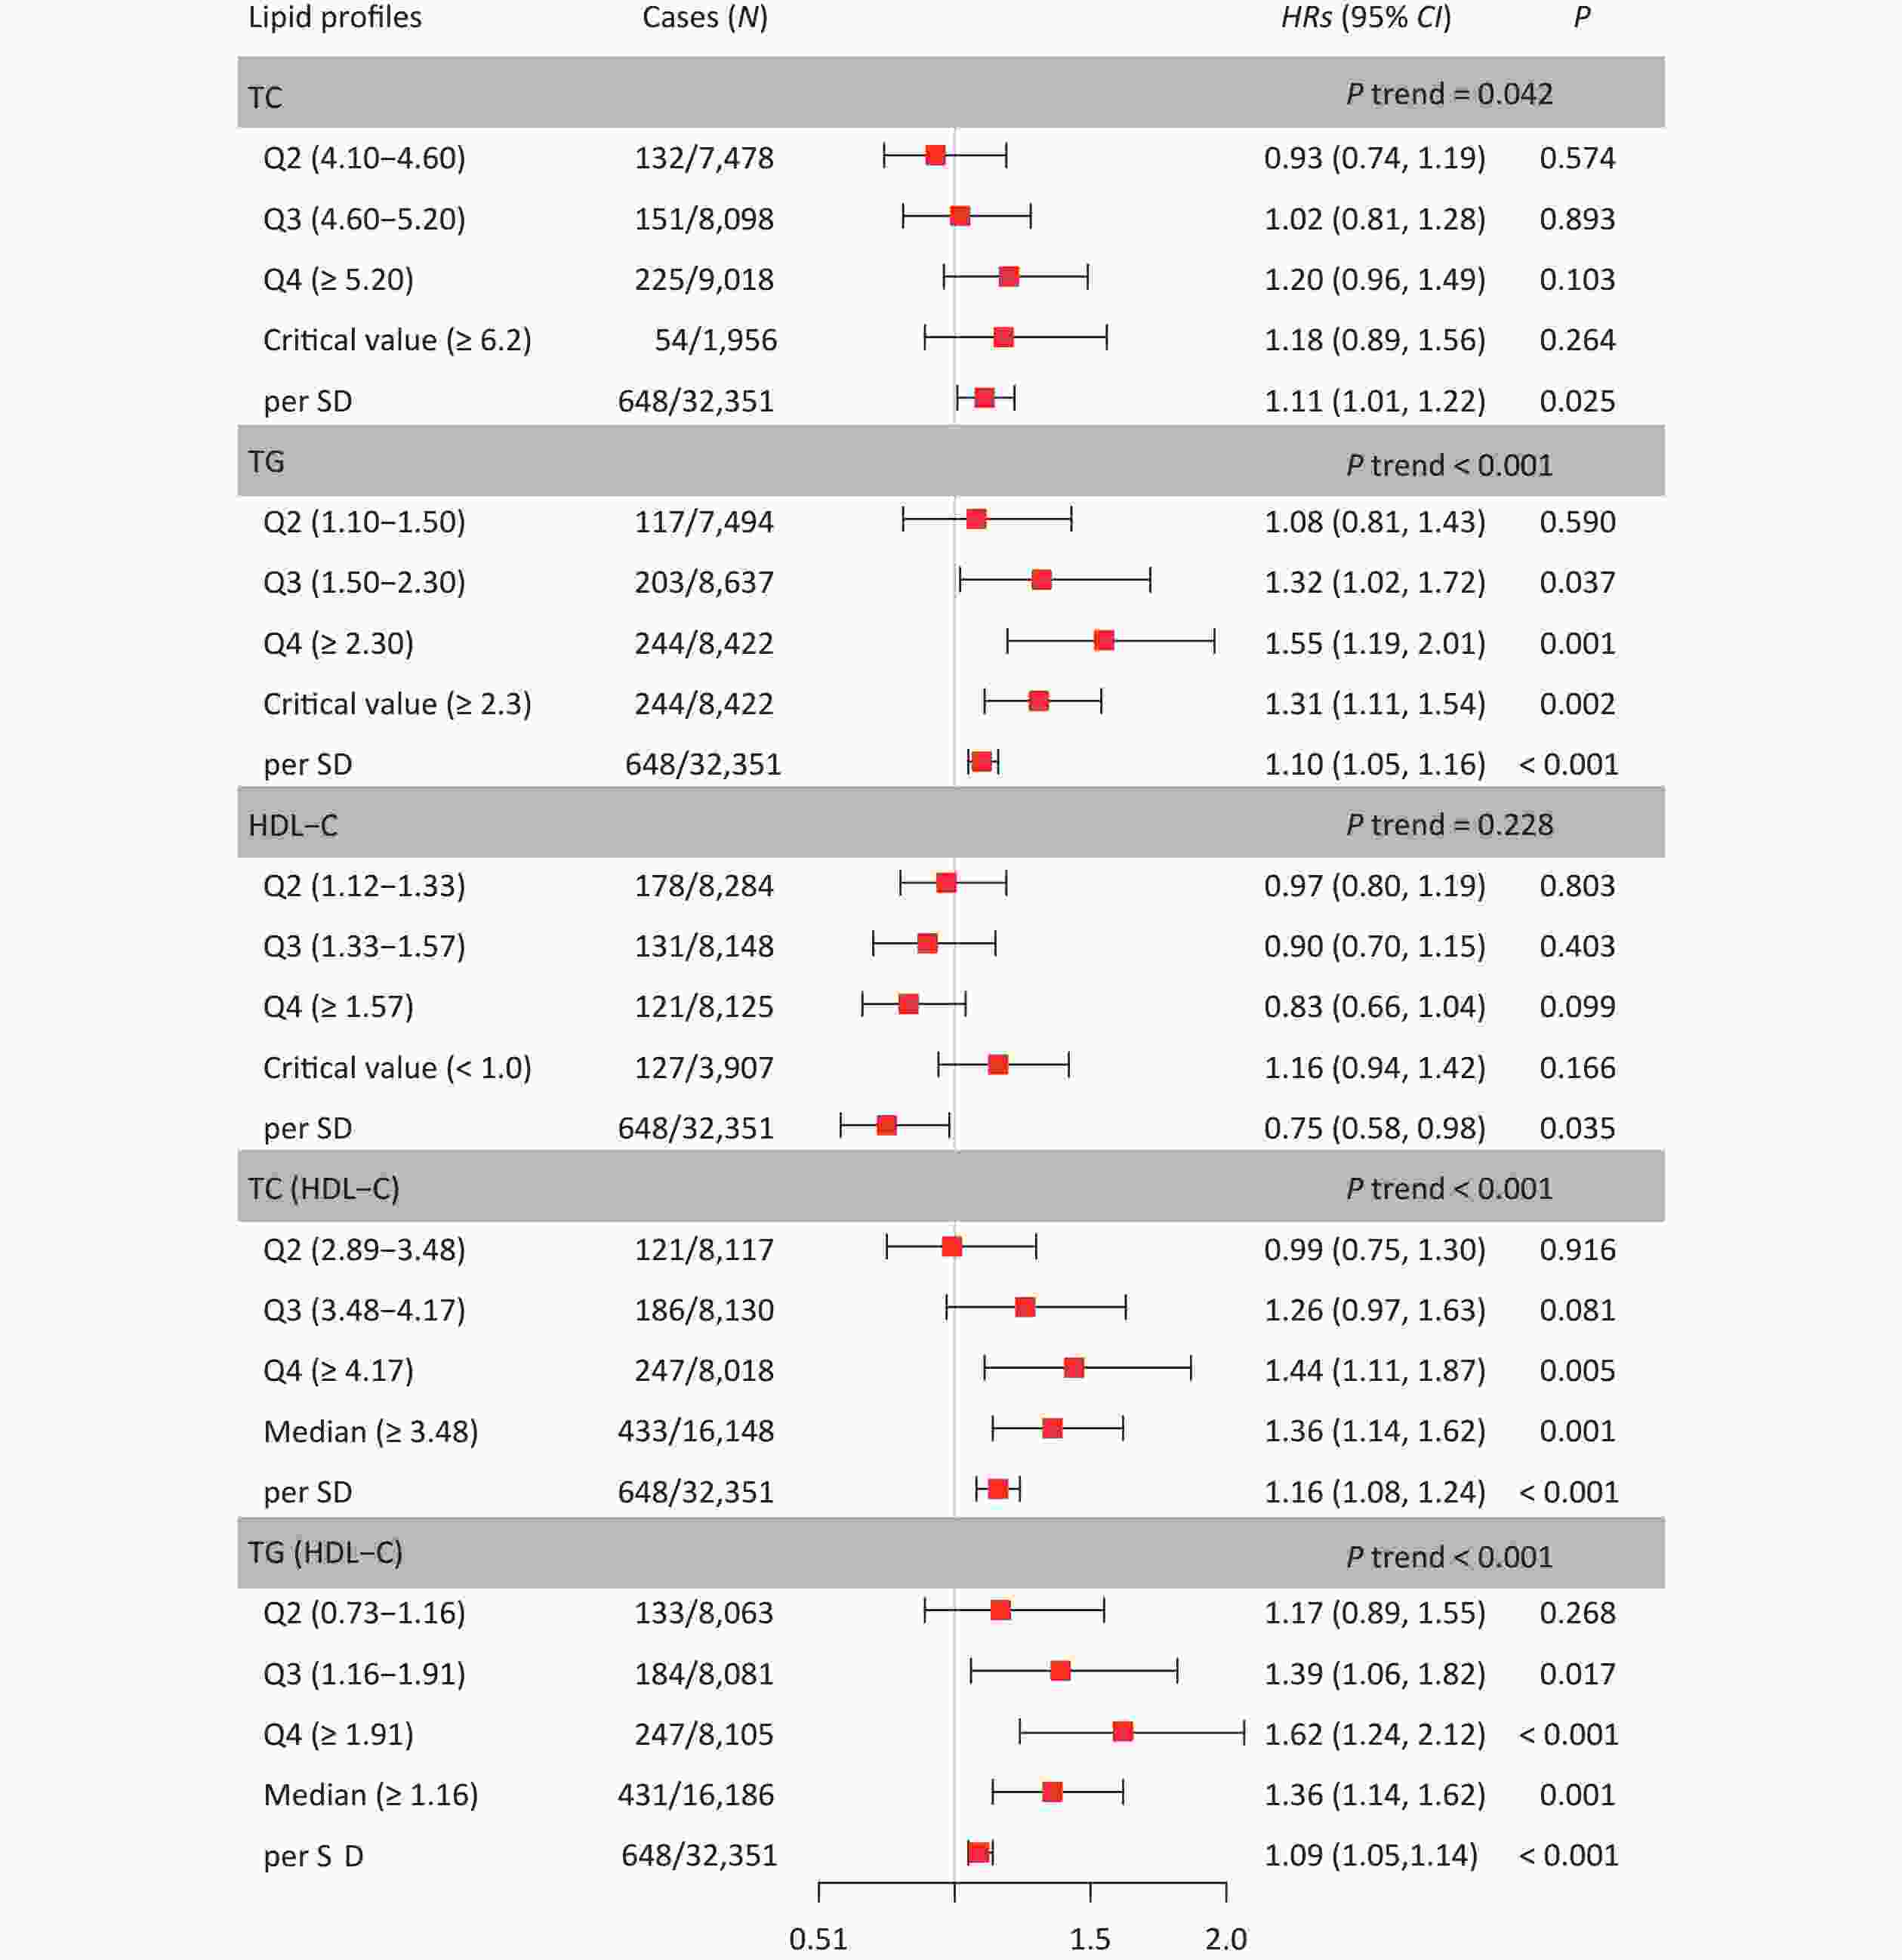
Figure 2. Hazard ratios and 95% confidence interval for lipid profiles grouped by level. In the Q2, Q3, and Q4, Q1 was used as the reference. In the critical value (or median), except for HDL-C, the reference is smaller than the critical value (or median), and the reference is greater than the critical value in HDL-C. Model was adjusted for age, sex, occupation, education level, income, smoking, alcohol consumption, exercise, high-salt diet, high-fat diet, BMI, hypertension, CHD, diabetes, hyperlipidemia, family history of kidney disease and baseline eGFR (Model 3). HRs, hazard ratios; CI, confidence interval; TC, total cholesterol; TG, triglyceride; HDL-C, high-density lipoprotein cholesterol; BMI, body mass index; CKD, chronic kidney disease; CHD, coronary heart disease; SD, standard deviation
-
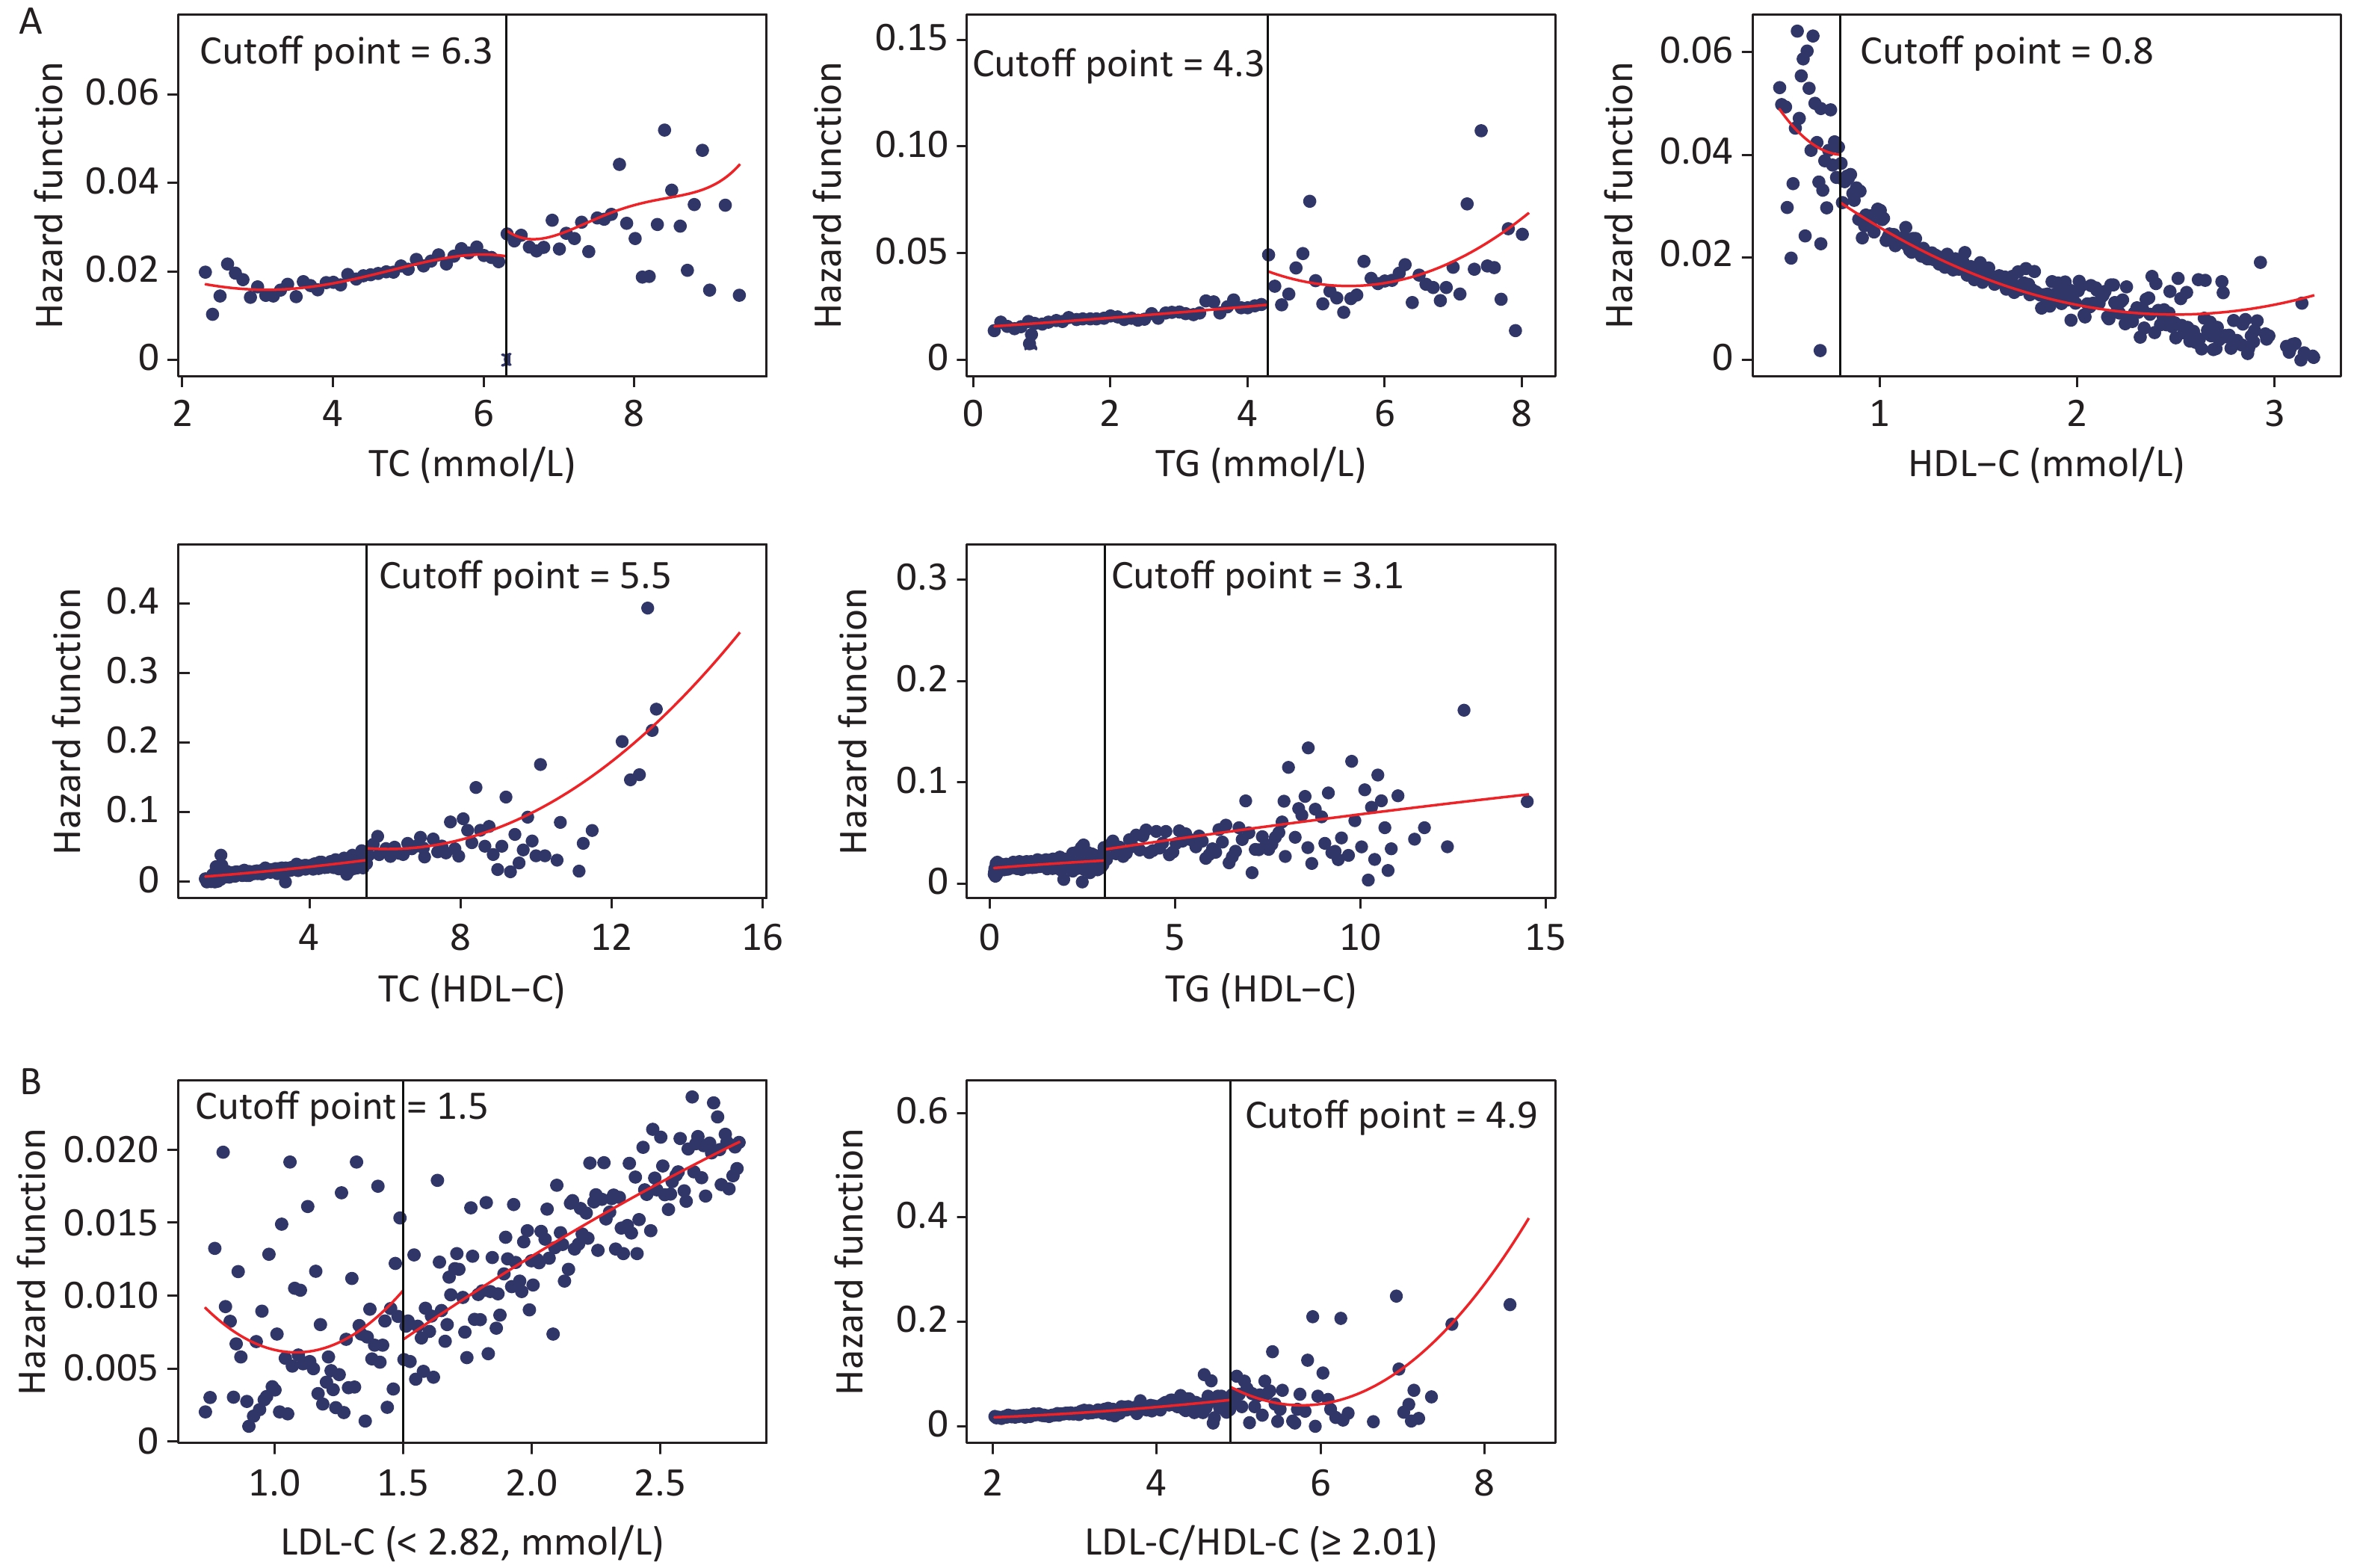
Figure 3 shows the fitted regression curves between the lipid profiles and CKD. With the increase of blood lipid levels, the risk of CKD appears to reach abruptly the cutoff value. TC, TG, TC/HDL-C, and TG/HDL-C presented an upward jump at cutoff value, while the cutoff values were 6.3, 4.3, 5.5, and 3.1 mmol/L, increasing the risk of CKD by 0.90% (P = 0.006), 1.50% (P = 0.016), 2.30% (P = 0.011), and 1.60% (P = 0.018), respectively; whereas HDL-C had a downward jump at the cutoff value (0.80 mmol/L), while the risk was reduced by 1% (P = 0.031) (Figure 3A). Because the relationship between LDL-C, LDL-C/HDL-C, and CKD was nonlinear, a group with statistically significant results was selected for RDD analysis. The cutoff value for LDL-C (< 2.82 mmol/L) was 1.50 mmol/L, and the risk of CKD was reduced by 0.50% (P = 0.018); the cutoff value for LDL-C/HDL-C (≥ 2.82 mmol/L) was 4.90 mmol/L, the risk increased by 1.60% (P = 0.008) (Figure 3B).
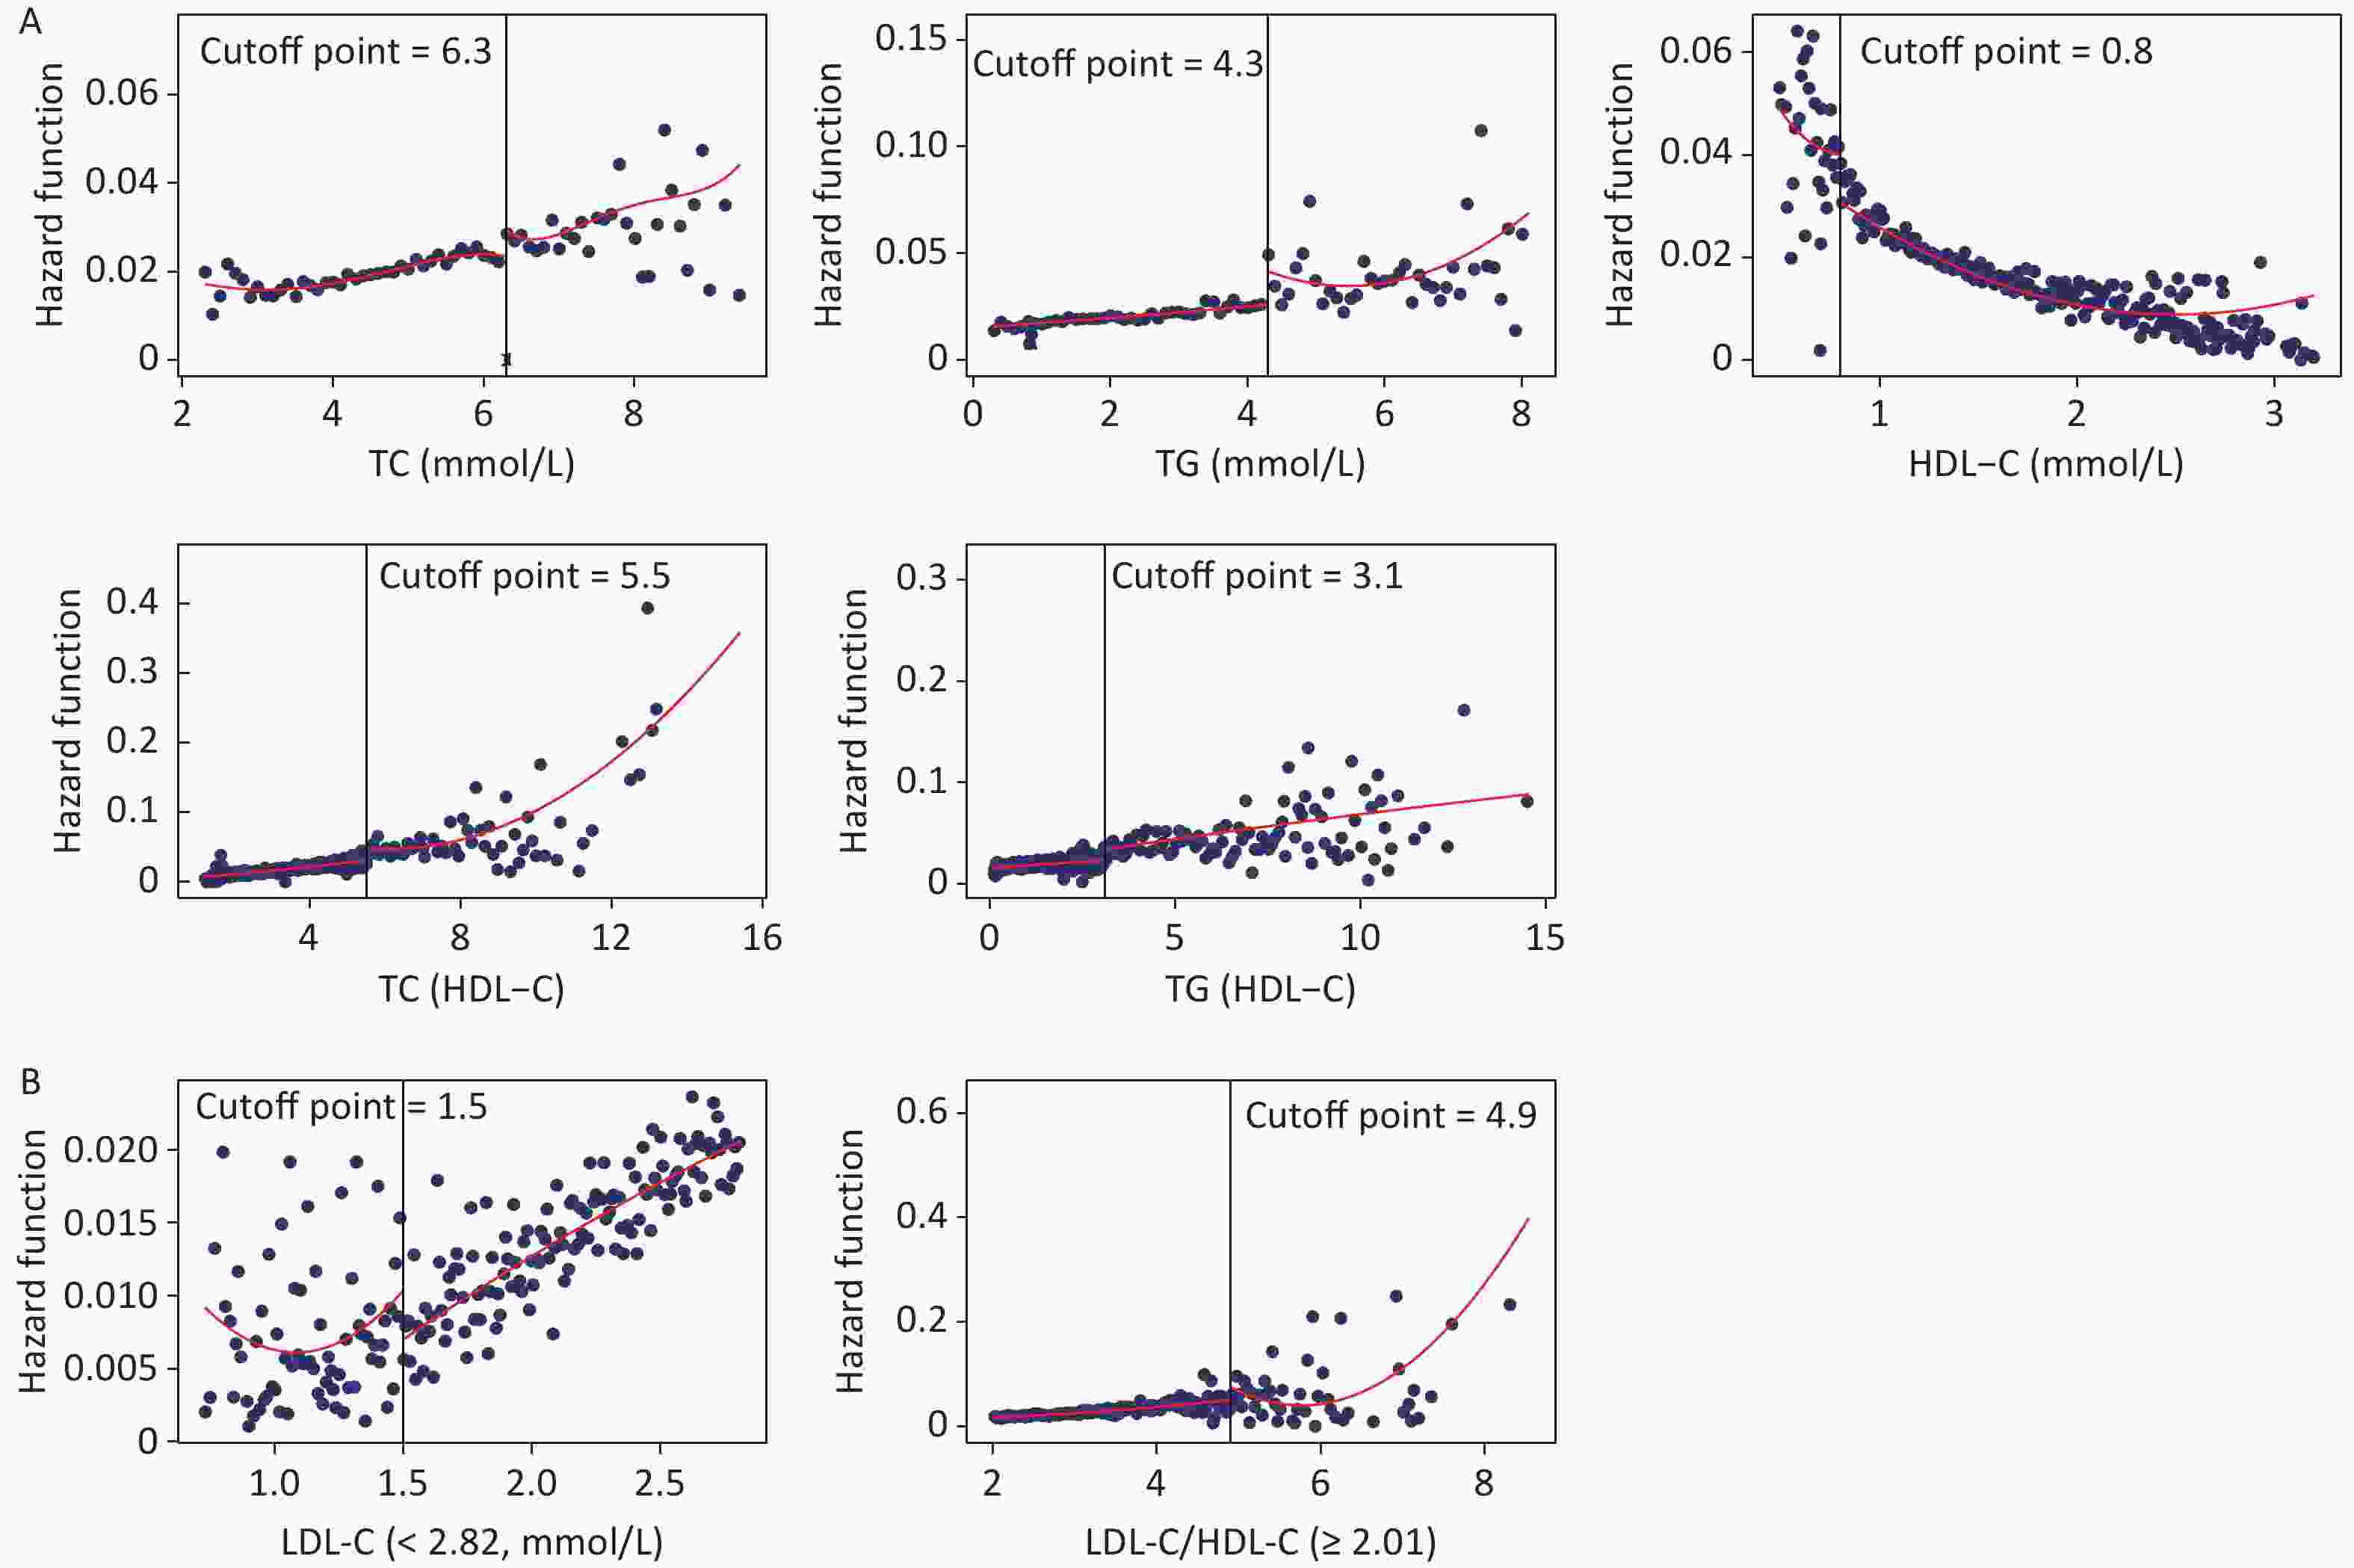
Figure 3. Fitted regression curves between lipid profiles and the risk of CKD. (A) Lipid profiles are linearly correlated with CKD. (B) Lipid profiles are nonlinearly associated with CKD, and groups with statistically significant results are grouped by inflection points. The x-axis is the level of lipid profiles, and the y-axis is the hazard function for CKD. TC, total cholesterol; TG, triglycerides; HDL-C, high-density lipoprotein cholesterol; LDL-C, low-density lipoprotein cholesterol; CKD, chronic kidney disease.
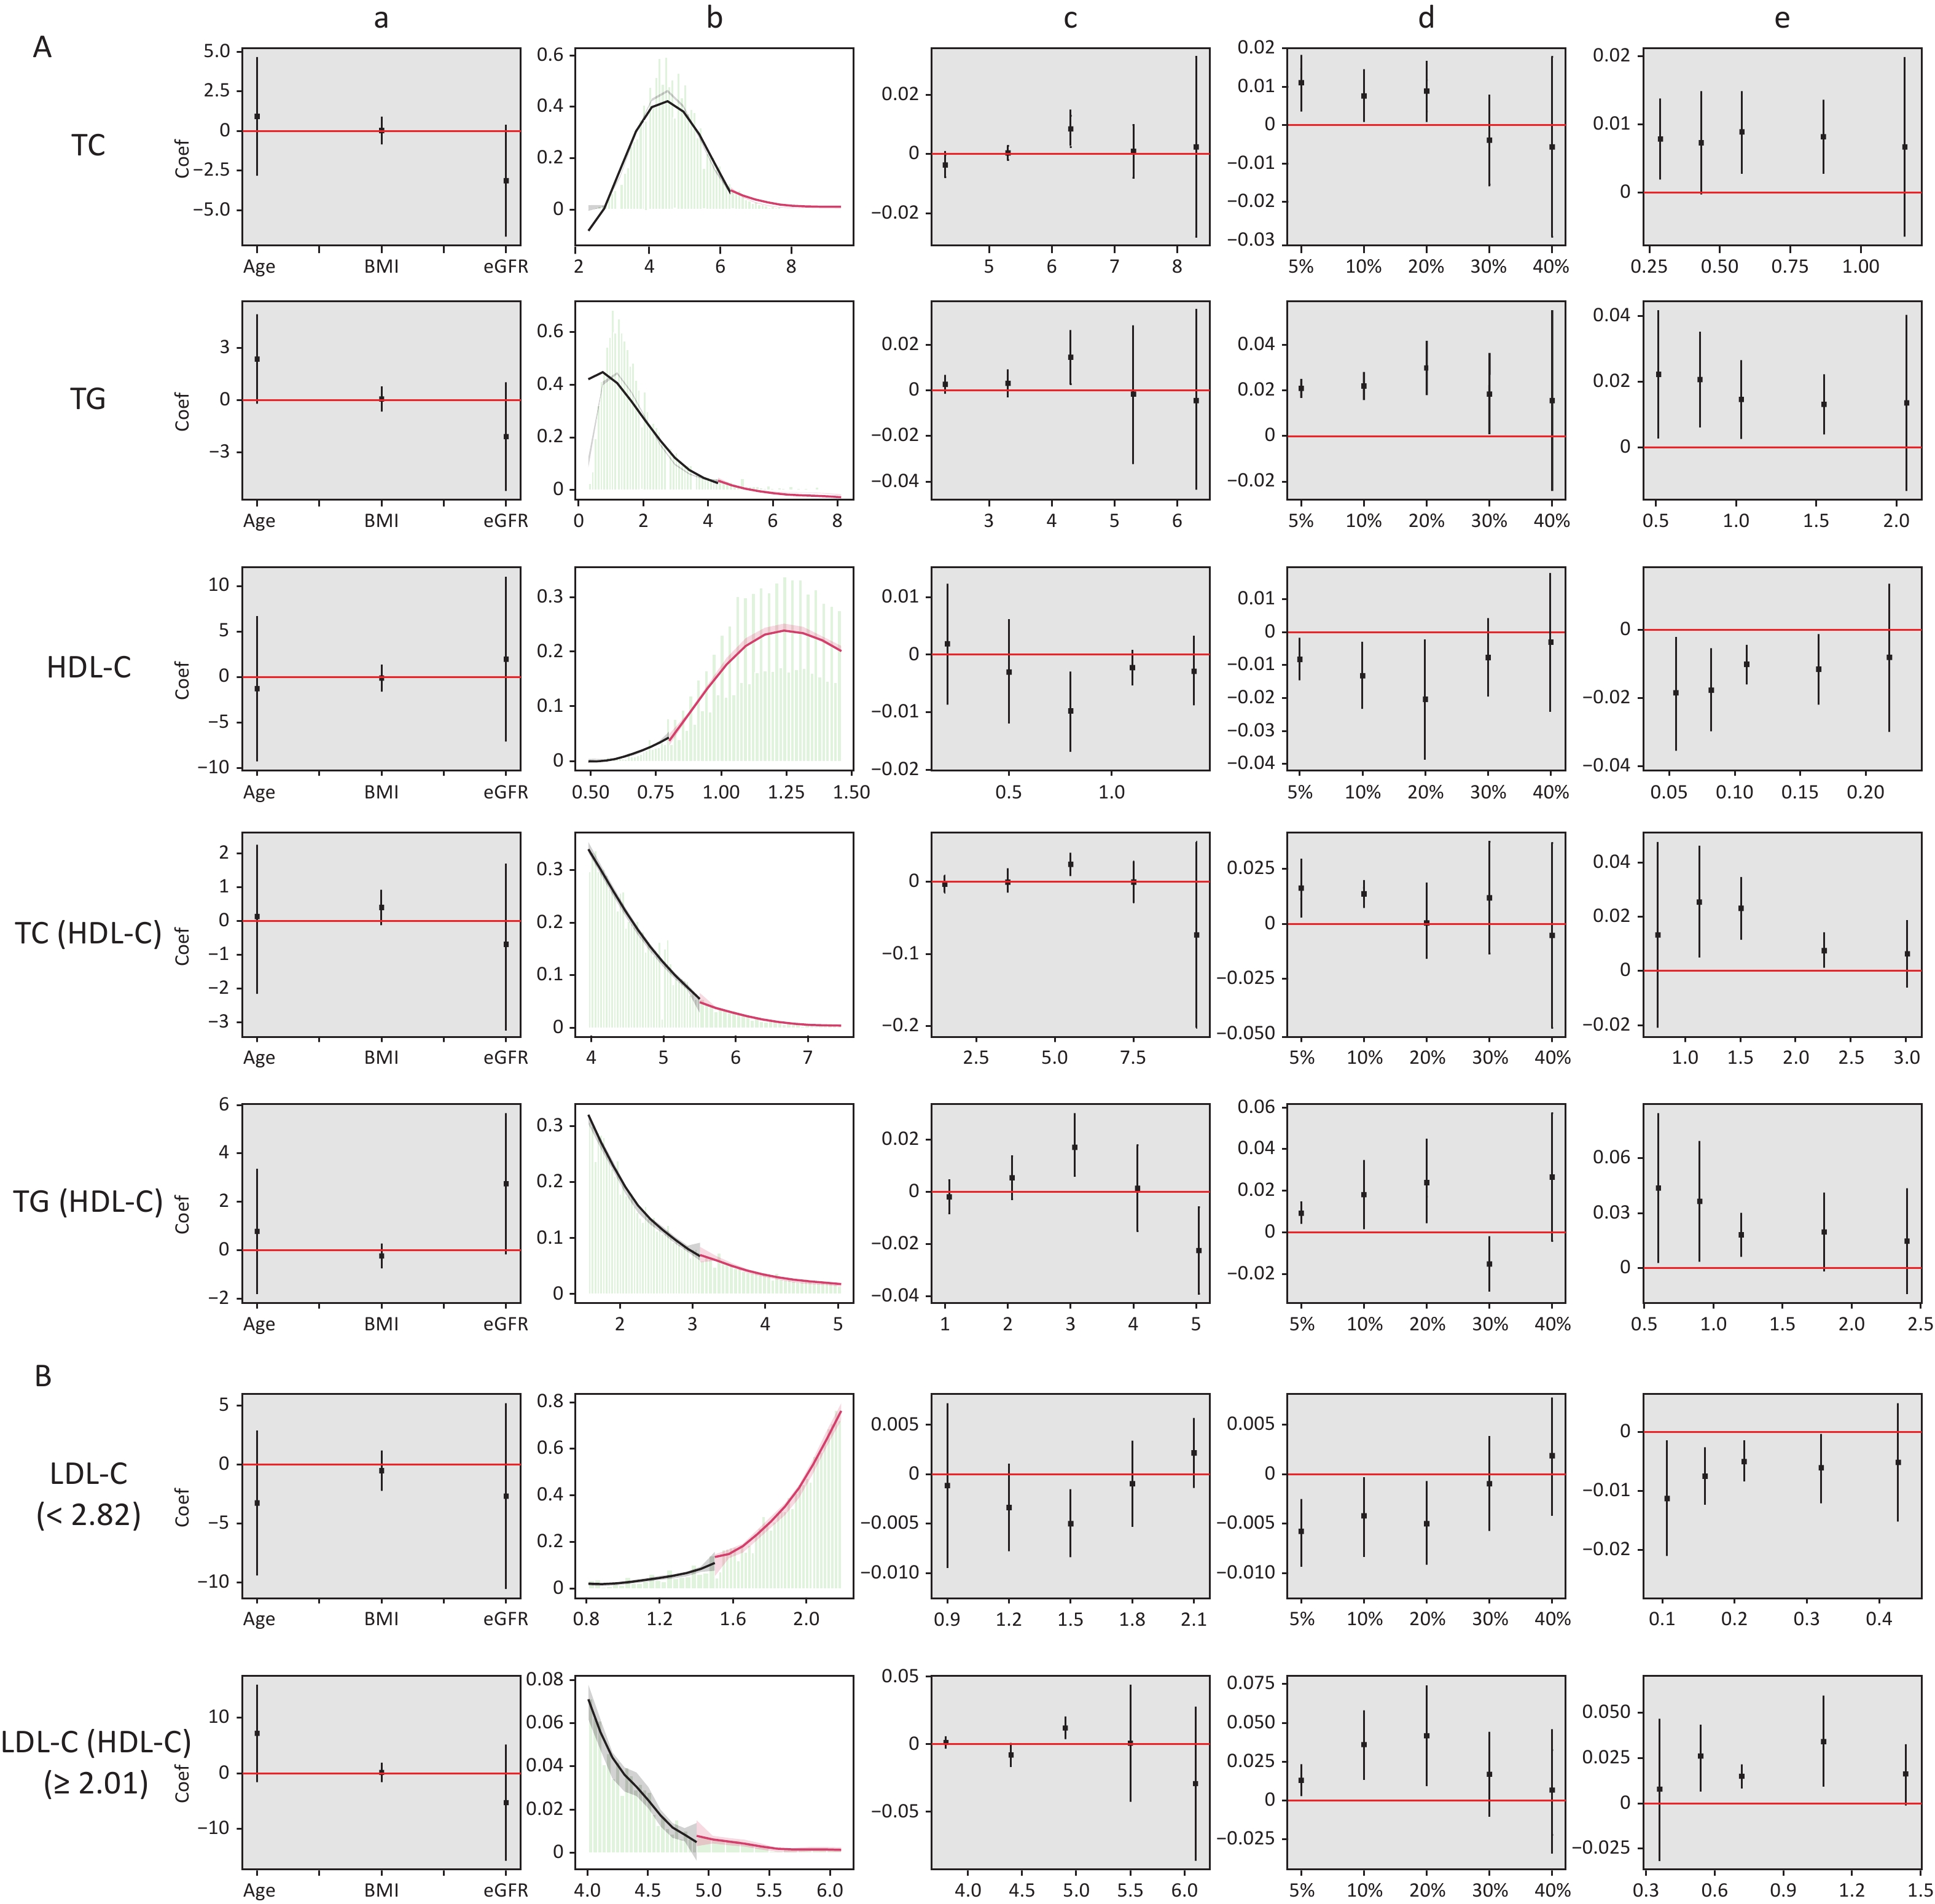
Figure 4 shows the results of the validity tests and robustness check for the RDD. In the validity tests, the pseudo-outcome results showed that the LATE estimate of the above covariates was not significant at the cutoff value, satisfying the smoothness assumption. The results of the McCrary’s test showed that the density function estimates were partially overlapping confidence intervals on both sides of the cutoff values. The results showed that the lipid level distribution at the cutoff value was continuous and met the continuous hypothesis. In the robustness check, the results of the pseudo-cutoff point showed that, after changing the cutoff value, the reference interval of the regression coefficient of all models was zero, indicating that the original cutoff value was real, and the regression results were relatively stable. The results of the donut-hole approach showed that after removing samples of 20% and below the cutoff value, the results were still significant, while after removing samples below 30% and 40% of the cutoff value, most of the results obtained were not statistically significant because too many samples were removed; however, the results could still be considered stable. The results of bandwidth selection showed that the majority of results was significant. All of the above test results showed that the cutoff values found in this study were effective and stable with high reliability.
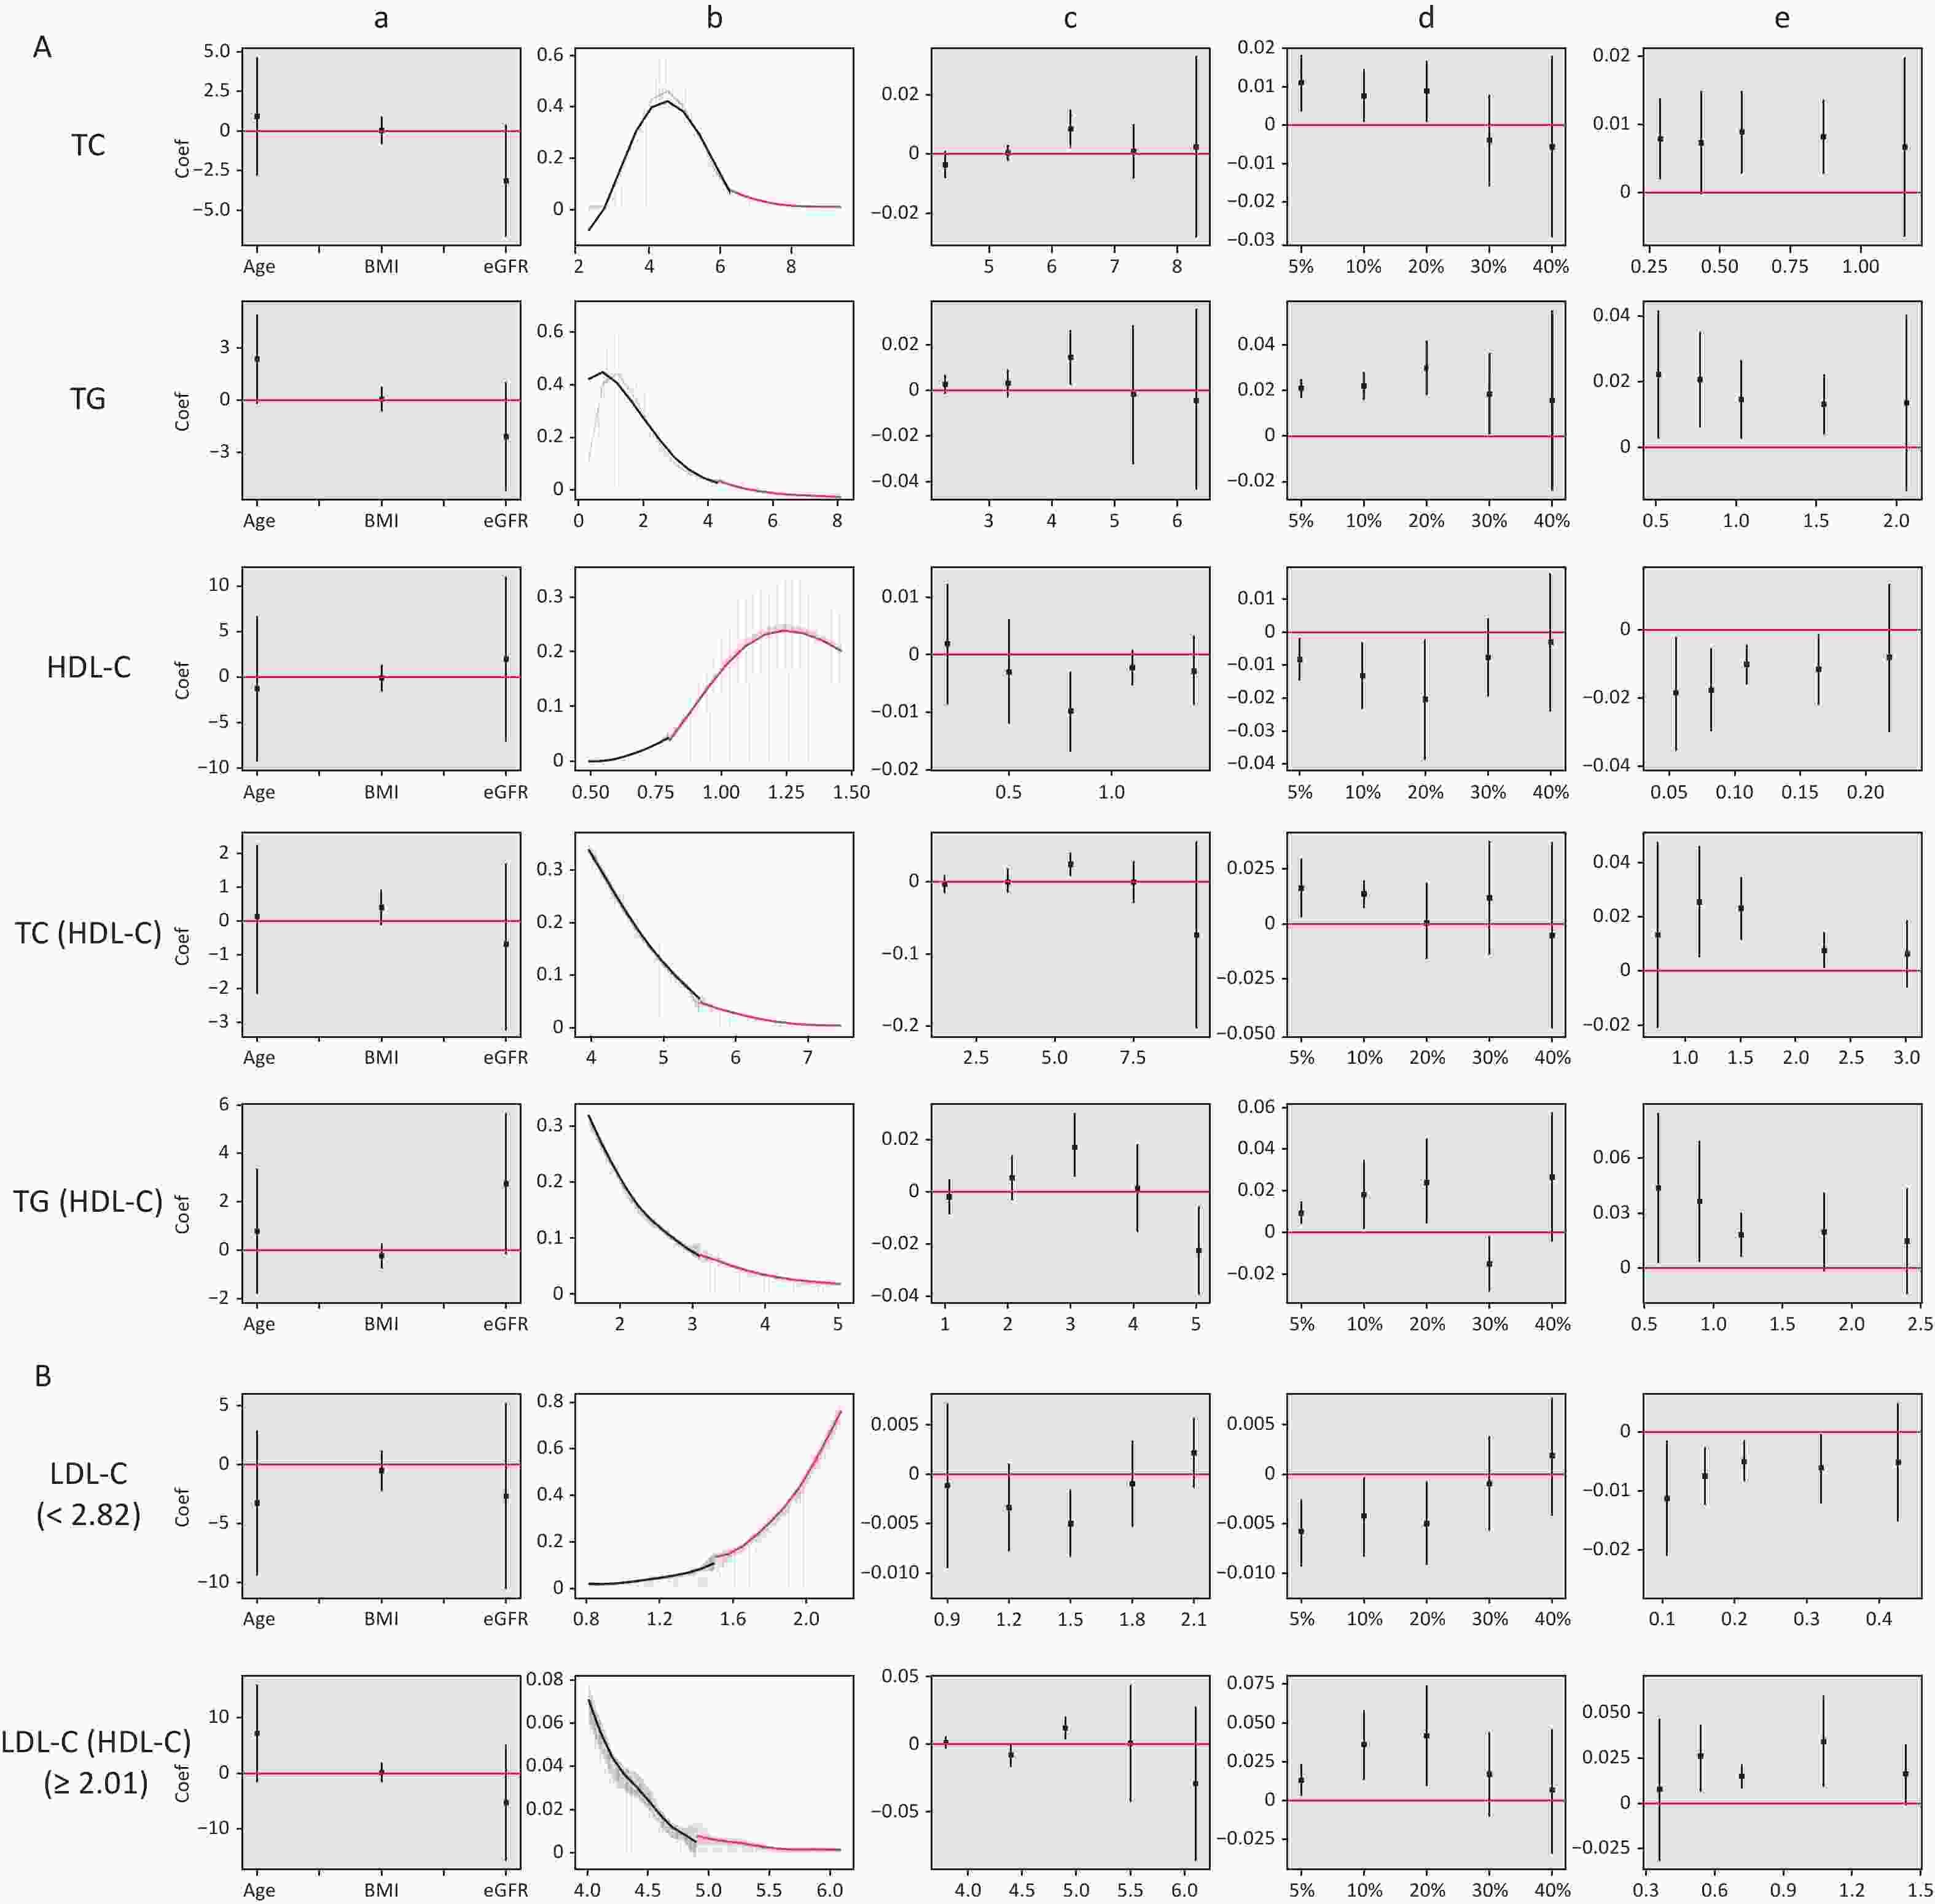
Figure 4. Validity test and robust check of RDD between lipid profiles and CKD. (A) Lipid profiles are linearly correlated with CKD; (B) lipid profiles are nonlinearly associated with CKD, and groups with statistically significant results are grouped by inflection points. a: Pseudo-outcome test, the x-axis is the variable for the pseudo-outcome, and the y-axis is the local average treatment effect estimate value; b: McCrary’s test, the x-axis is the level of lipid profiles, and the y-axis is the density function estimates; c: pseudo-cutoff point, the x-axis is the level of lipid profiles (i.e. the pseudo-cutoff value), and the y-axis is the local average treatment effect estimate value; d: donut-hole approach, the x-axis is the percentage of sample removed, and the y-axis is the local average treatment effect estimate value; e: bandwidth selection, the x-axis is the different bandwidth values, and the y-axis is the local average treatment effect estimate value. TC, total cholesterol; TG, triglycerides; HDL-C, high-density lipoprotein cholesterol; LDL-C, low-density lipoprotein cholesterol; CKD, chronic kidney disease.
-
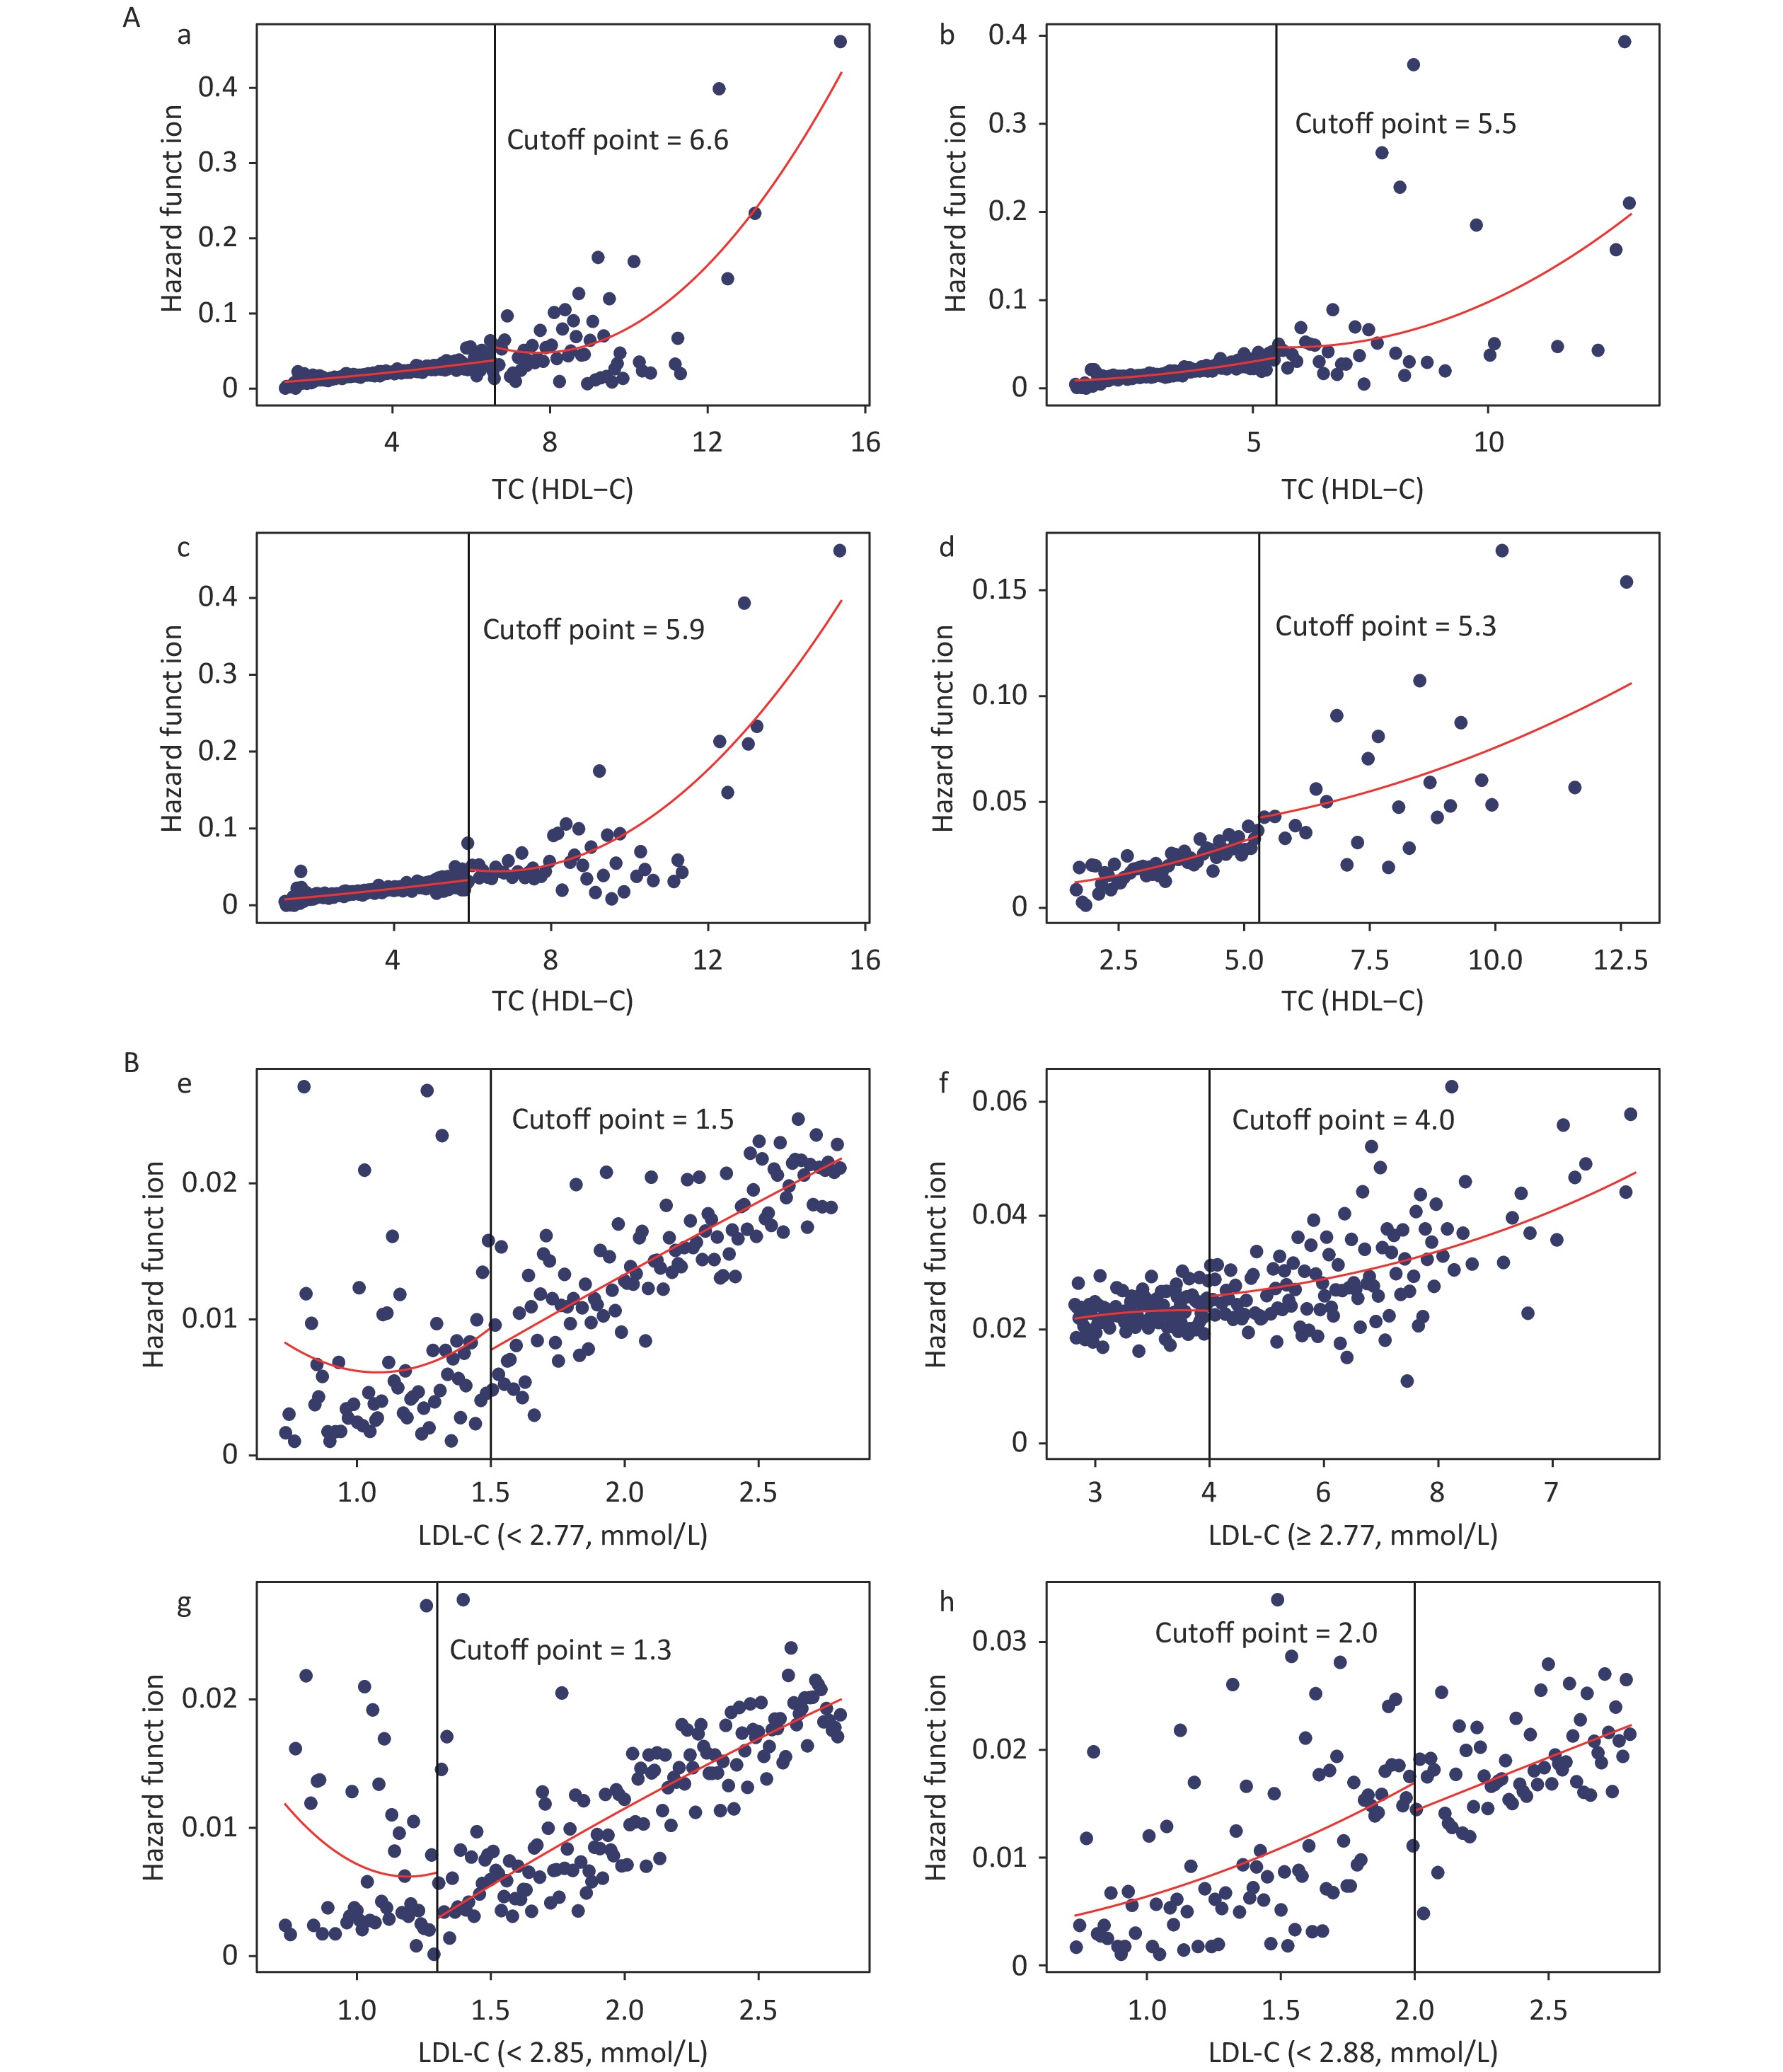
The dose-response curves for males and females (Supplementary Figure S2, available in www.besjournal.com), non-dyslipidemia, and dyslipidemia (Supplementary Figure S3, available in www.besjournal.com) were plotted separately. In each group, blood lipid levels (TC, TG, HDL-C, TC/HDL-C, and TG/HDL-C) were linearly correlated with CKD, while LDL-C was nonlinearly associated with CKD, except in female. The LDL-C/HDL-C ratio was nonlinearly associated with CKD in male and non-dyslipidemia. Table 3 shows the HRs for CKD associated with lipid profiles stratified by sex and dyslipidemia. These results were similar to those for the total population. In general, the effects of TG, TC/HDL-C, and TG/HDL-C were greater in women and patients with dyslipidemia than in men or patients without dyslipidemia. In the RDD analysis, the TC/HDL-C cutoff values in male, female, non-dyslipidemia, and dyslipidemia were 6.6, 5.5, 5.9, and 5.3, respectively, while the risk of CKD increased by 1.90% (P = 0.003), 1.10% (P = 0.038), 0.90% (P = 0.010), and 1.10% (P = 0.045), respectively. All the indicators passed the validity test (Supplementary Figure S4, available in www.besjournal.com). In addition, the LDL-C cutoff value for dyslipidemia was not statistically significant. In males, with a cutoff value of 1.50 for LDL-C (< 2.77), the risk of CKD was reduced by 0.60% (P = 0.038), while, with a cutoff value of 4.00 for LDL-C (≥ 2.77), this risk was increased by 1.50% (P = 0.024) (Figure 5B). LDL-C levels passed the validity and robustness tests (Supplementary Figure S5, available in www.besjournal.com).
Variables Sex Dyslipidemia Male
HRs (95% CI)Female
HRs (95% CI)NO
HRs (95% CI)YES
HRs (95% CI)TC 1.17 (1.05, 1.31)* 0.94 (0.78, 1.13) 1.09 (0.98, 1.21) 1.15 (0.93, 1.43) TG 1.08 (1.02, 1.14)* 1.18 (1.05, 1.32)* 1.07 (0.99, 1.16) 1.33 (1.01, 1.74)* HDL-C 0.84 (0.71, 0.99)* 0.58 (0.35, 0.95)* 0.70 (0.53, 0.94)* 1.02 (0.51, 2.01) TC/HDL-C 1.15 (1.06, 0.9)* 1.19 (1.01, 1.40)* 1.09 (1.02, 1.17)* 1.17 (1.08, 1.26)* TG/HDL-C 1.08 (1.03, 1.13)* 1.15 (1.06, 1.26)* 1.06 (0.96, 1.17) 1.14 (1.04, 1.25)* LDL-C −§ 0.78 (0.59, 1.02) −§ −§ LDL-C/HDL-C −§ 1.06 (0.76, 1.46) −§ 0.95 (0.65, 1.40) Note. *P < 0.05. §There is a nonlinear correlation between blood lipid levels and CKD. TC, total cholesterol; TG, triglycerides; HDL-C, high-density lipoprotein cholesterol; LDL-C, low-density lipoprotein cholesterol; CKD, chronic kidney disease; HRs, Hazard ratios. Table 3. Hazard ratios (per 1-SD) for CKD in the stratified analysis by sex and dyslipidemia
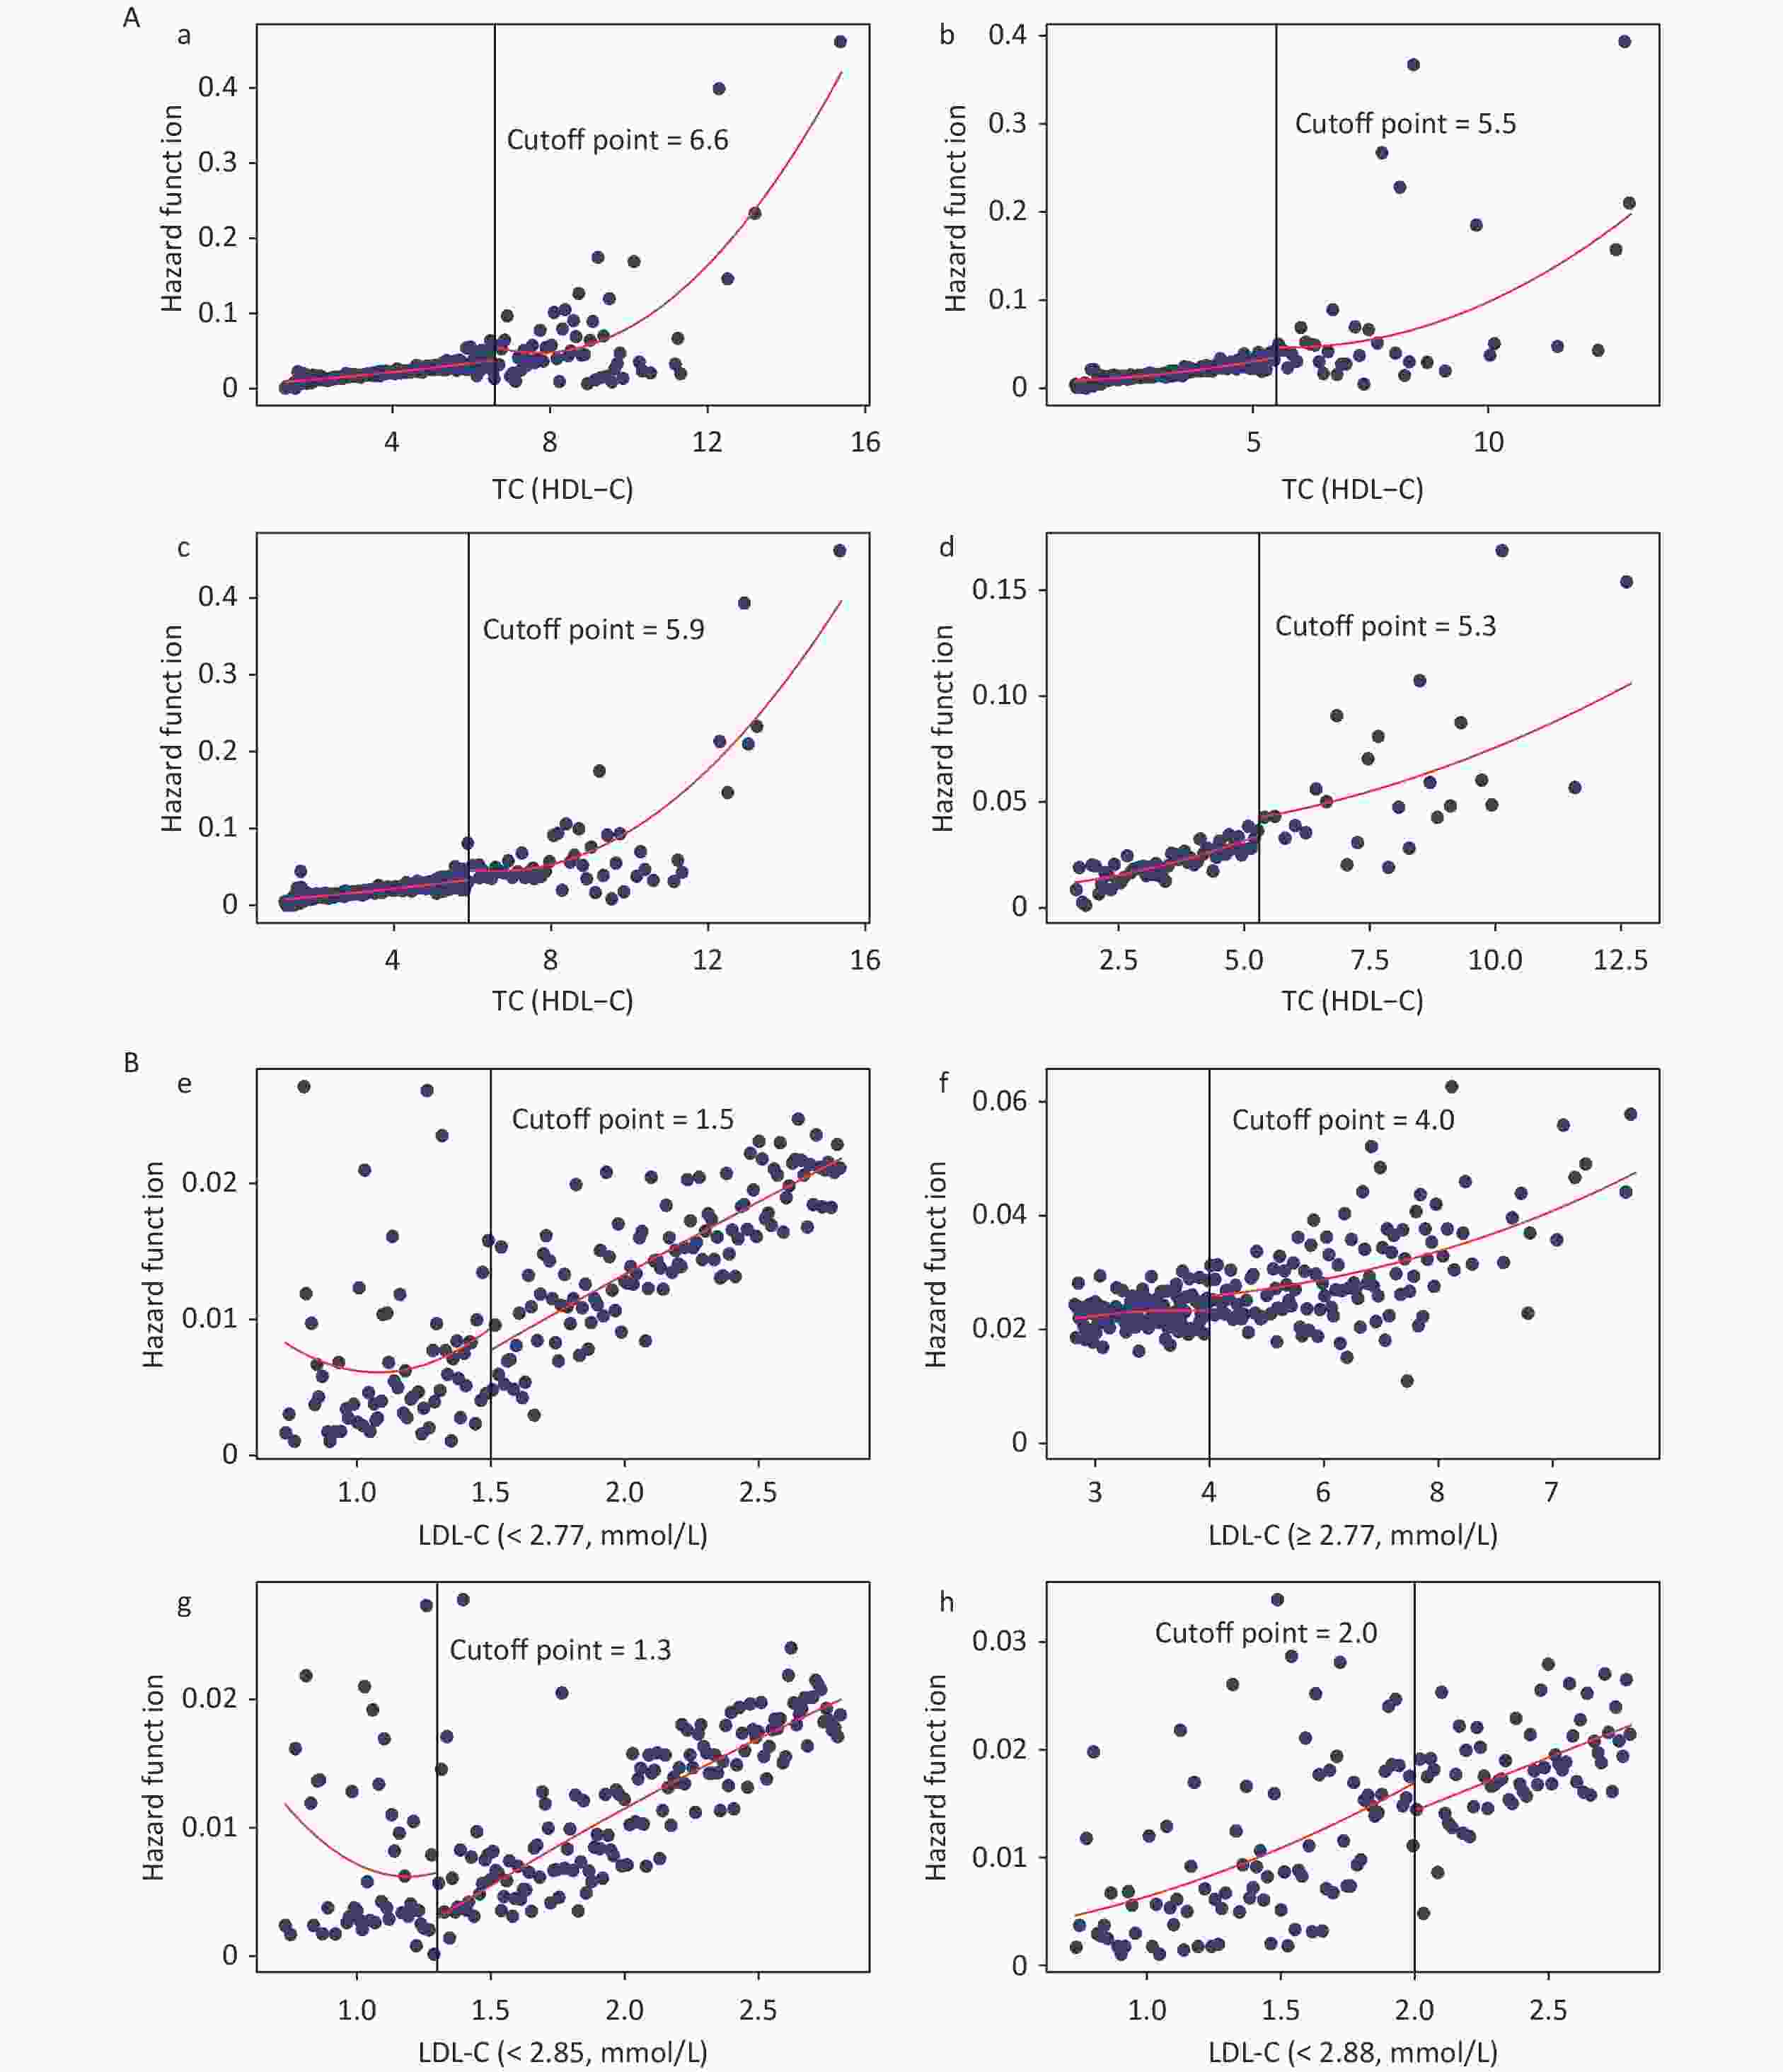
Figure 5. Fitted regression curves between Lipid Profiles and the risk of CKD. (A) Fitted regression curves between TC/HDL-C and CKD (fitted regression curves in a: male; b: female; c: non-dyslipidemia; d: dyslipidemia. The x-axis is the level of TC/HDL-C, and the y-axis is the hazard function for CKD. (B) Fitted regression curves between LDL-C and CKD (fitted regression curves between e: LDL-C (< 2.77) and CKD in males; f: LDL-C (≥ 2.77) and CKD in males; g: LDL-C (< 2.85) and CKD in non-dyslipidemia; h: LDL-C (< 2.88) and CKD in dyslipidemia. The x-axis is the level of LDL-C, and the y-axis is the hazard function for CKD). TC, total cholesterol; HDL-C, high-density lipoprotein cholesterol; LDL-C, low-density lipoprotein cholesterol; CKD, chronic kidney disease.
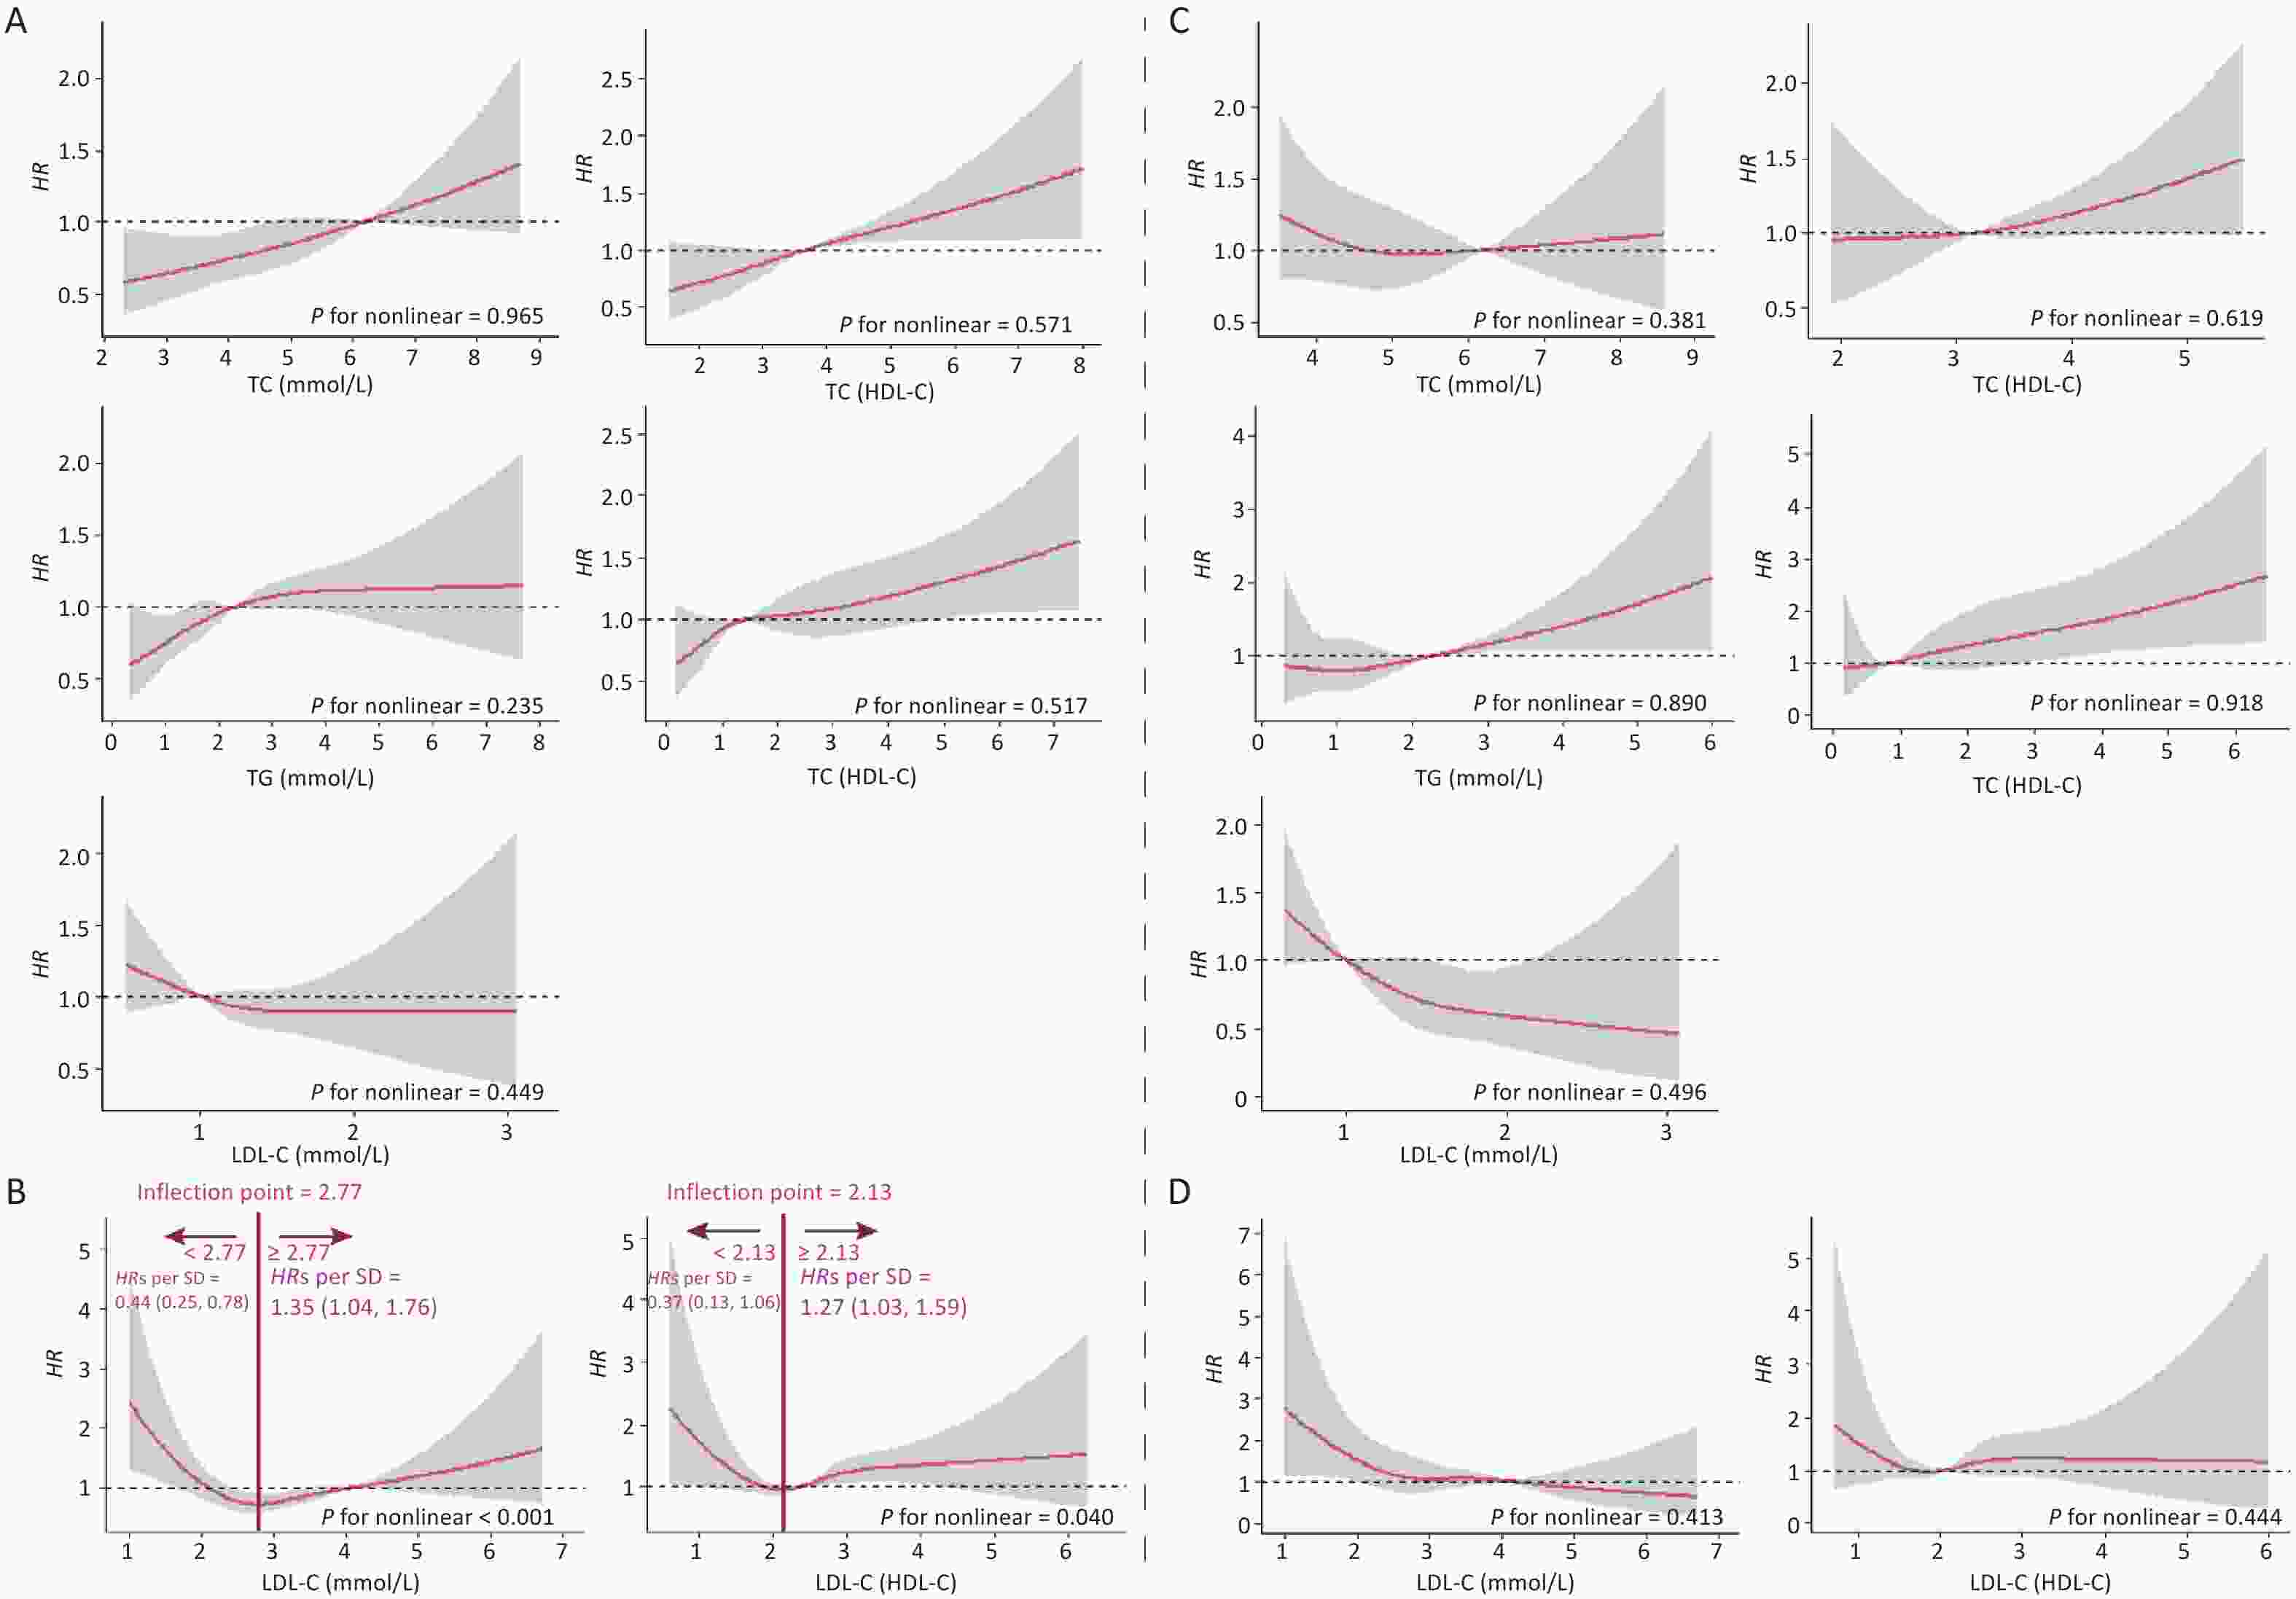
Figure S2. Dose-response Relationship between lipid profiles and risk of CKD in male and female. A: Lipid profiles are linearly correlated with CKD in male. B: Lipid profiles are nonlinearly associated with CKD in male. C and D: Lipid profiles are linearly correlated with CKD in female. The solid line indicates the adjusted HR, and the shaded area represents 95% CI for HR. The x-axes is the level of lipid profiles, and the y-axes is the HR for CKD. The reference point (HR = 1) was the critical value (for TC, TG, HDL-C and LDL-C) or median (for TC/HDL-C, TG/HDL-C and LDL-C/HDL-C). Model was adjusted for age, sex, occupation, education, income, smoking, drinking, exercise, high-salt diet, high-fat diet, BMI, hypertension, coronary heart disease, diabetes, hyperlipidemia, family history of kidney disease and baseline eGFR (Model 3). HR, Hazard ratios; TC, total cholesterol; TG, triglyceride; HDL-C, high-density lipoprotein cholesterol; LDL-C, low-density lipoprotein cholesterol.
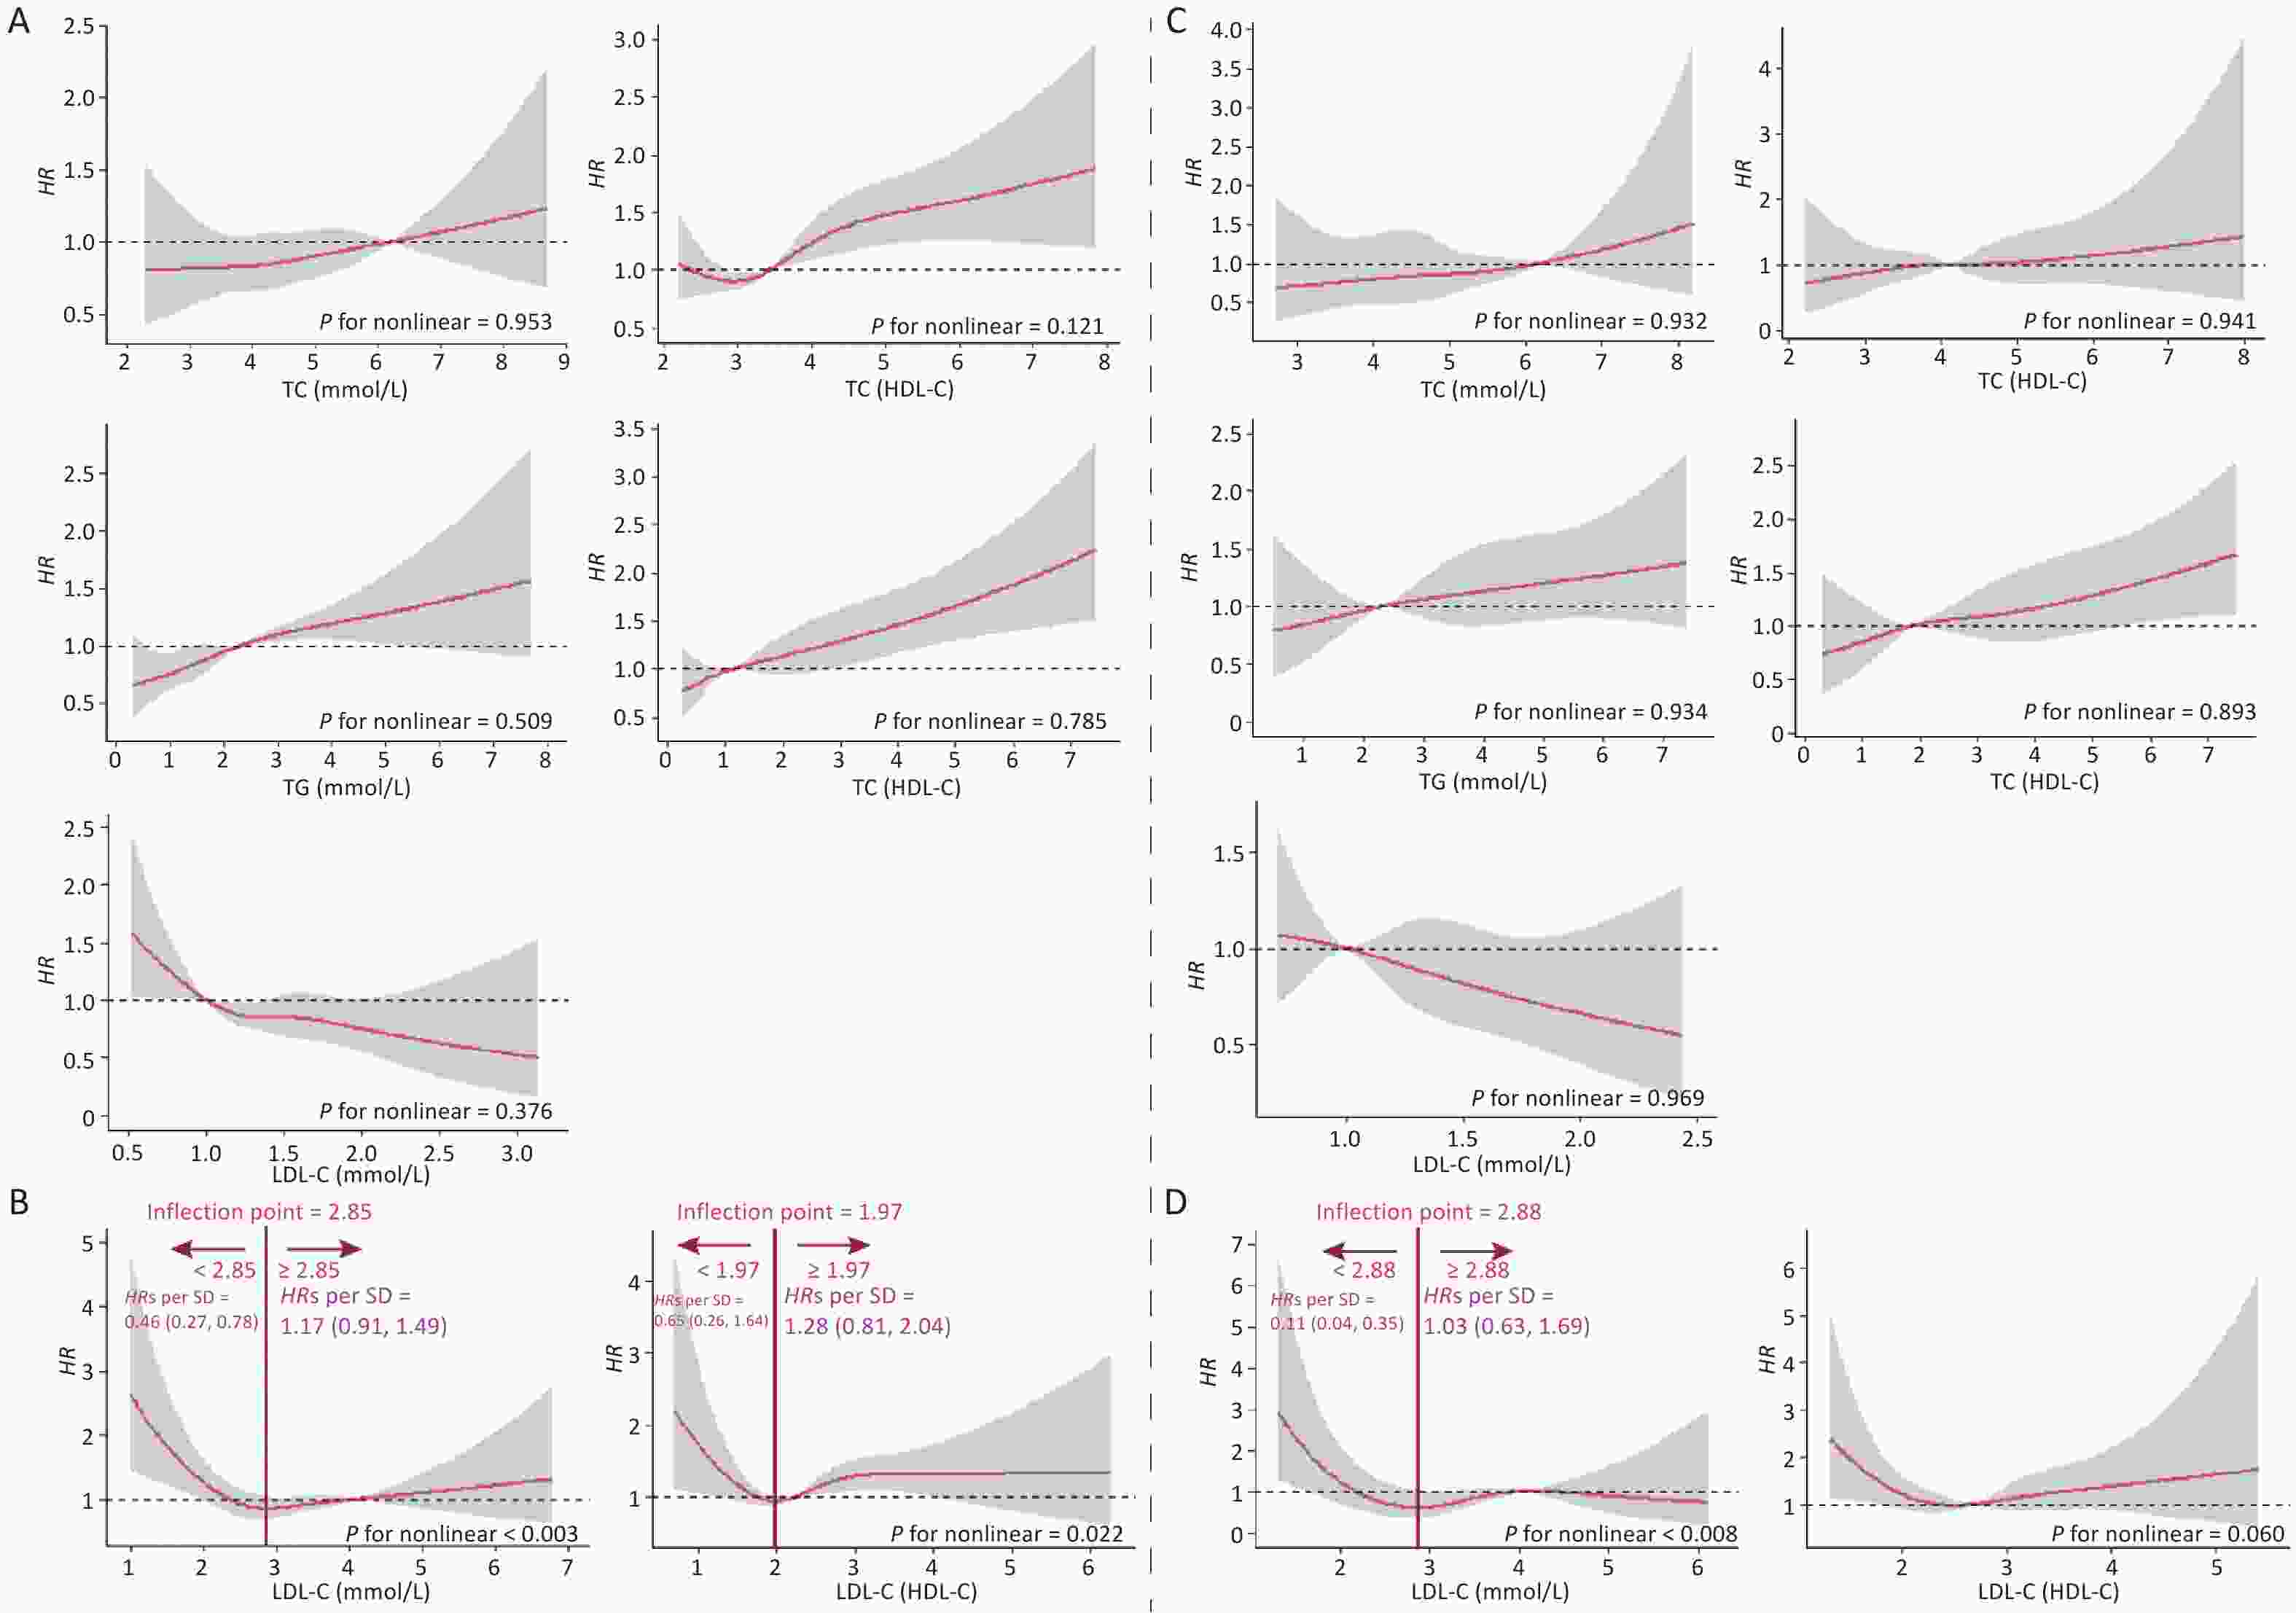
Figure S3. Dose-response relationship between lipid profiles and risk of CKD in stratified analysis by dyslipidemia. A: Lipid profiles are linearly correlated with CKD in non-dyslipidemia. B: Lipid profiles are nonlinearly associated with CKD in non-dyslipidemia. C: Lipid profiles are linearly correlated with CKD in dyslipidemia. D: Linearly (LDL-C/HDL-C) and non-linearly (LDL-C) correlated with CKD in dyslipidemia. The solid line indicates the adjusted HR, and the shaded area represents 95% CI for HR. The x-axes is the level of lipid profiles, and the y-axes is the HR for CKD. The reference point (HR = 1) was the critical value (for TC, TG, HDL-C and LDL-C) or median (for TC/HDL-C, TG/HDL-C and LDL-C/HDL-C). Model was adjusted for age, sex, occupation, education, income, smoking, drinking, exercise, high-salt diet, high-fat diet, BMI, hypertension, coronary heart disease, diabetes, hyperlipidemia, family history of kidney disease and baseline eGFR (Model 3). HR, Hazard ratios; TC, total cholesterol; TG, triglyceride; HDL-C, high-density lipoprotein cholesterol; LDL-C, low-density lipoprotein cholesterol.
The HRs on either side of the inflection point are shown in Supplementary Figures S1 and S2. The model was adjusted for age, sex, occupation, education level, income, smoking, alcohol consumption, exercise, high-salt and high-fat diets, BMI, hypertension, CHD, diabetes, hyperlipidemia, family history of kidney disease, and baseline eGFR (Model 3).
-
In this study, the incidence of CKD was 2% (n = 648) after a median follow-up of 2.2 (0.5, 4.2) years. The results showed that high levels of TC, TG, TC/HDL-C, and TG/HDL-C and low levels of HDL-C were significantly associated to the risk of CKD, while a linear dose-response relationship was demonstrated. LDL-C and LDL-C/HDL-C had a nonlinear relationship with CKD. In addition, the RDD was used to find a causal relationship between each lipid indicator and CKD, while cutoff values with a significantly increased risk were determined. In the stratified analysis, females and participants with dyslipidemia had a higher risk of developing CKD compared to male participants and those without dyslipidemia. TG, TC/HDL-C, and TG/HDL-C were the key indicators in this study, and their cutoff values were relatively higher and more specific than the clinically defined levels for dyslipidemia.
Dyslipidemia is common in every stage of CKD and can enable CKD progression. This condition can damage the glomerular filtration barrier and cause proteinuria[34]. The results of this study confirmed that TG, TC/HDL-C, and TG/HDL-C are significantly related to CKD, which is consistent with other studies’ findings[18,21,35-37]. A study including 5,183 participants without CKD in northeastern China showed that increased TG and high-TC were related to decreased eGFR and increased incidence of CKD[18]. Kawachi et al. showed that low HDL-C predicted CKD progression, with a multivariable-adjusted HR of 4.80 (1.44, 15.46) for in an eGFR decline ≥ 30%[35]. Additionally, another study demonstrated that a high-TC/HDL-C ratio was associated with a higher risk of CKD[37], while a higher TG/HDL-C ratio could influence eGFR reduction and the incidence of CKD in the Japanese population[36]. Moreover, the TC/HDL-C ratio was included as a secondary therapeutic goal in the 2006 Lipid Guidelines of Canada[38]. Therefore, combined indicators (TC/HDL-C and TG/HDL-C ratios) could reflect the relationship between serum lipid levels and CKD. Our findings were consistent with this inference.
In addition, this study showed a stronger effect of combined indicators, especially TC/HDL-C, compared with single lipid indicators. Additionally, the effect of TG/HDL-C in the quartile group was demonstrated. These results are consistent with those of previous studies. A prospective cohort study of 15,244 participants followed up for 5 years showed that TC/HDL-C and TG/HDL-C were more strongly related to CKD than other lipid indicators, while ORs were 2.21 (1.91, 2.57) and 2.14 (1.83, 2.51), respectively, compared with extreme quartiles[13]. Therefore, these results suggest that combined lipid indicators may be more valuable than single indicators for predicting the occurrence of CKD. Since glomerulosclerosis and atherosclerosis have similar pathogenesis[39], it is reasonable to assume that a high-TC/HDL-C ratio is associated with an increased incidence of CKD. Although the mechanisms of TC/HDL-C in the pathogenesis of CKD are unclear, previous studies have provided some possible explanations. First, the reabsorption of tubular epithelial cells on cholesterol and phospholipids could cause tubular interstitial inflammation, foam cell formation, and tissue damage[40]. Secondly, cellular cholesterol accumulation due to elevated synthesis and decreased outflow might change the structure and function of podocytes and proximal tubule cells to promote fibrosis and development of CKD[41,42]. Finally, the decline of kidney function could enhance lipid permeation and excretion, while dyslipidemia could be further aggravated in a vicious cycle[43].
This study found that LDL-C and the LDL-C/HDL-C ratio had a nonlinear relationship with CKD, with a negative correlation at low levels and a positive correlation at high levels. A Chinese study showed a nonlinear relationship between LDL-C and CKD in the Dongfeng-Tongji cohort, which is consistent with the results of the present study. However, in a Korean cohort study, the association between LDL-C levels and CKD was not statistically significant[17]. This may related to the fact that the study did not examine the dose-response relationship, therefore, the investigators conducted a subsection study[13]. However, previous studies have not found a nonlinear relationship between LDL-C/HDL-C ratio and CKD. In this study, the nonlinear relationship was not stable in the sensitivity analysis. The relationship was linear, but not significant, in female participants and those with dyslipidemia. LDL-C is easily oxidized to lipid peroxide, which has a strong atherosclerotic effect and common mechanisms of renal glomerular sclerosis, atherosclerosis, and oxidative LDL-C induced kidney injury[44]. A study including a Japanese population indicated that low-density LDL-C influences the incidence of CKD[36]. The results of clinical trials and meta-analyses have shown that the adjustment of LDL-C levels with medication inhibits the progression of CKD[45,46]. In our study, neither high or low LDL-C levels were not associated with CKD risk. This inconsistency may be related to the fact that LDL-C concentration itself does not reflect the LDL particle size. Therefore, further studies are necessary to determine the correlation and relationship between LDL-C and LDL-C/HDL-C levels and CKD.
Dyslipidemia may contribute to the development of CKD, but it is unknown to what extent blood lipid levels influenced the risk of CKD. In this study, the RDD method was used to analyze each blood lipid indicator associated with CKD, and it was found that certain cutoff values affected the risk of CKD. TG, TC/HDL-C, and TG/HDL-C ratios were the key indicators in this study. The cutoff values of TG, TC/HDL-C, and TG/HDL-C were relatively higher and more specific than the clinically defined dyslipidemia levels[47], which makes the estimation of CKD risk more precise. Early identification of individuals at high risk of developing CKD through lipid level measurments, could help physicians implement close follow-up visits and early treatment strategies, thus, delaying the onset of CKD[3]. In addition, the combined indicator did not have a clear clinical reference, and the analysis of the RDD provided a specific risk judgment basis. Consistently, the effect of the combined lipid indicator was greater than that of a single indicator in this study[3]. This may indicate that the combined lipid indicator could be used as a screening or diagnosis indicator[37], and the cutoff value in the RDD analysis could be considered as a reference for the risk of CKD. In addition, the sensitivity analysis showed that there was a difference in the cutoff values of RDD in different population characteristics, which suggests that more accurate prevention and monitoring strategies should be implemented to decrease the incidence of CKD caused by dyslipidemia in different populations.
The application of RDD in this study provides new insights into the etiology and prevention of a chronic disease. This study provided a reliable causal estimation based on the cutoff value under randomization principles, avoiding the limitations of long study periods and after testing the results for validity and robustness. The results of this study provide with spotential screening tools for the individuals with dyslipidemia and clear guidance for the prevention and treatment of CKD. However, there are some limitations to our study. First, owing to the resctricted manpower and financial resources, all indicators were measured only once, and failure to consider the levels of eGFR and proteinuria after 3 months may have introduced potential classification biases in the definition of CKD. To further analyze the accuracy of CKD diagnosis in this study, we combined kidney B-ultrasound results, complete renal function, routine urine and physical examination information to analyze newly detected patients with CKD. Among the 648 patients, 73.61% were found to have abnormal urine routine examination, 63.21% were found to have proteinuria ≥ 1+, and 35.49% were found to have abnormal serum creatinine. Abnormal renal B-ultrasound results were observed in 13.89% of the patients. The patients were diagnosed by physical examination, and although the symptoms were mild, they suggested that identification of patients with CKD was reliable. Second, although development of CKD is long, follow-up period was relatively limited, which might have resulted in uncertainty regarding CKD incidence. However, the incidence of this condition is variable, depending on the characteristics of different regions and populations. For example, the incidence of CKD in a Japanese cohort study with three years of follow-up was 16.3%, whereas in a Korean cohort study with 4.7 years of follow-up, the incidence of CKD was 3.5%. The results of different regional cohort studies should be interpreted with caution to overcoming these biases. Third, statin therapy may improve the progression of renal disease, while the lack of medication in this study’s population may have influenced the results. However, the effects of statins on kidney function remain unclear. The key lipid indicators identified in our study were consistent with those of similar studies that included participants with or without lipid-lowering medications. Therefore, the lack of information on lipid-lowering drugs might not have significantly impeacted our results, while this deficiency could be compensated during follow-up. Finally, the RDD infered causal relationships around the cutoff value, which may not be generalizable to all samples, thus, it has limited external validity. Further research is warranted in different populations to verify these findings.
-
In conclusion, there was a significant association between TG, TC/HDL-C, and TG/HDL-C ratios and the risk of CKD development, while the association between the combined indicators and CKD was more pronounced than that of the single indicators. The RDD analysis showed specific cutoff values for the causal association between each lipid indicator and CKD, which provides a clear clinical reference for the combined lipid indicator and improves the estimation of CKD risk in a population with different characteristics. Therefore, attention should be paid to controlling blood lipid levels, while prevention and treatment of high-risk groups for CKD should be strengthened.
-
Kang Lyu: Conceptualization, methodology, software, formal analysis, and writing of the original draft. Shaodong Liu, Yanli Liu, Jinlong You, and Xue Wang: Software, and formal analysis. Minzhen Wang: Writing, review, editing, and methodology. Min Jiang: Selection and recommendation of clinical indicators. Desheng Zhang, and Chun Yin: Data collection. Yana Bai: Conceptualization, project administration, and supervision. Shan Zheng: Conceptualization, methodology, validation, writing, review, editing and supervision.
-
All study participants provided written informed consent and the study protocol was approved by the Ethics Committee of the Public Health School of Lanzhou University.
-
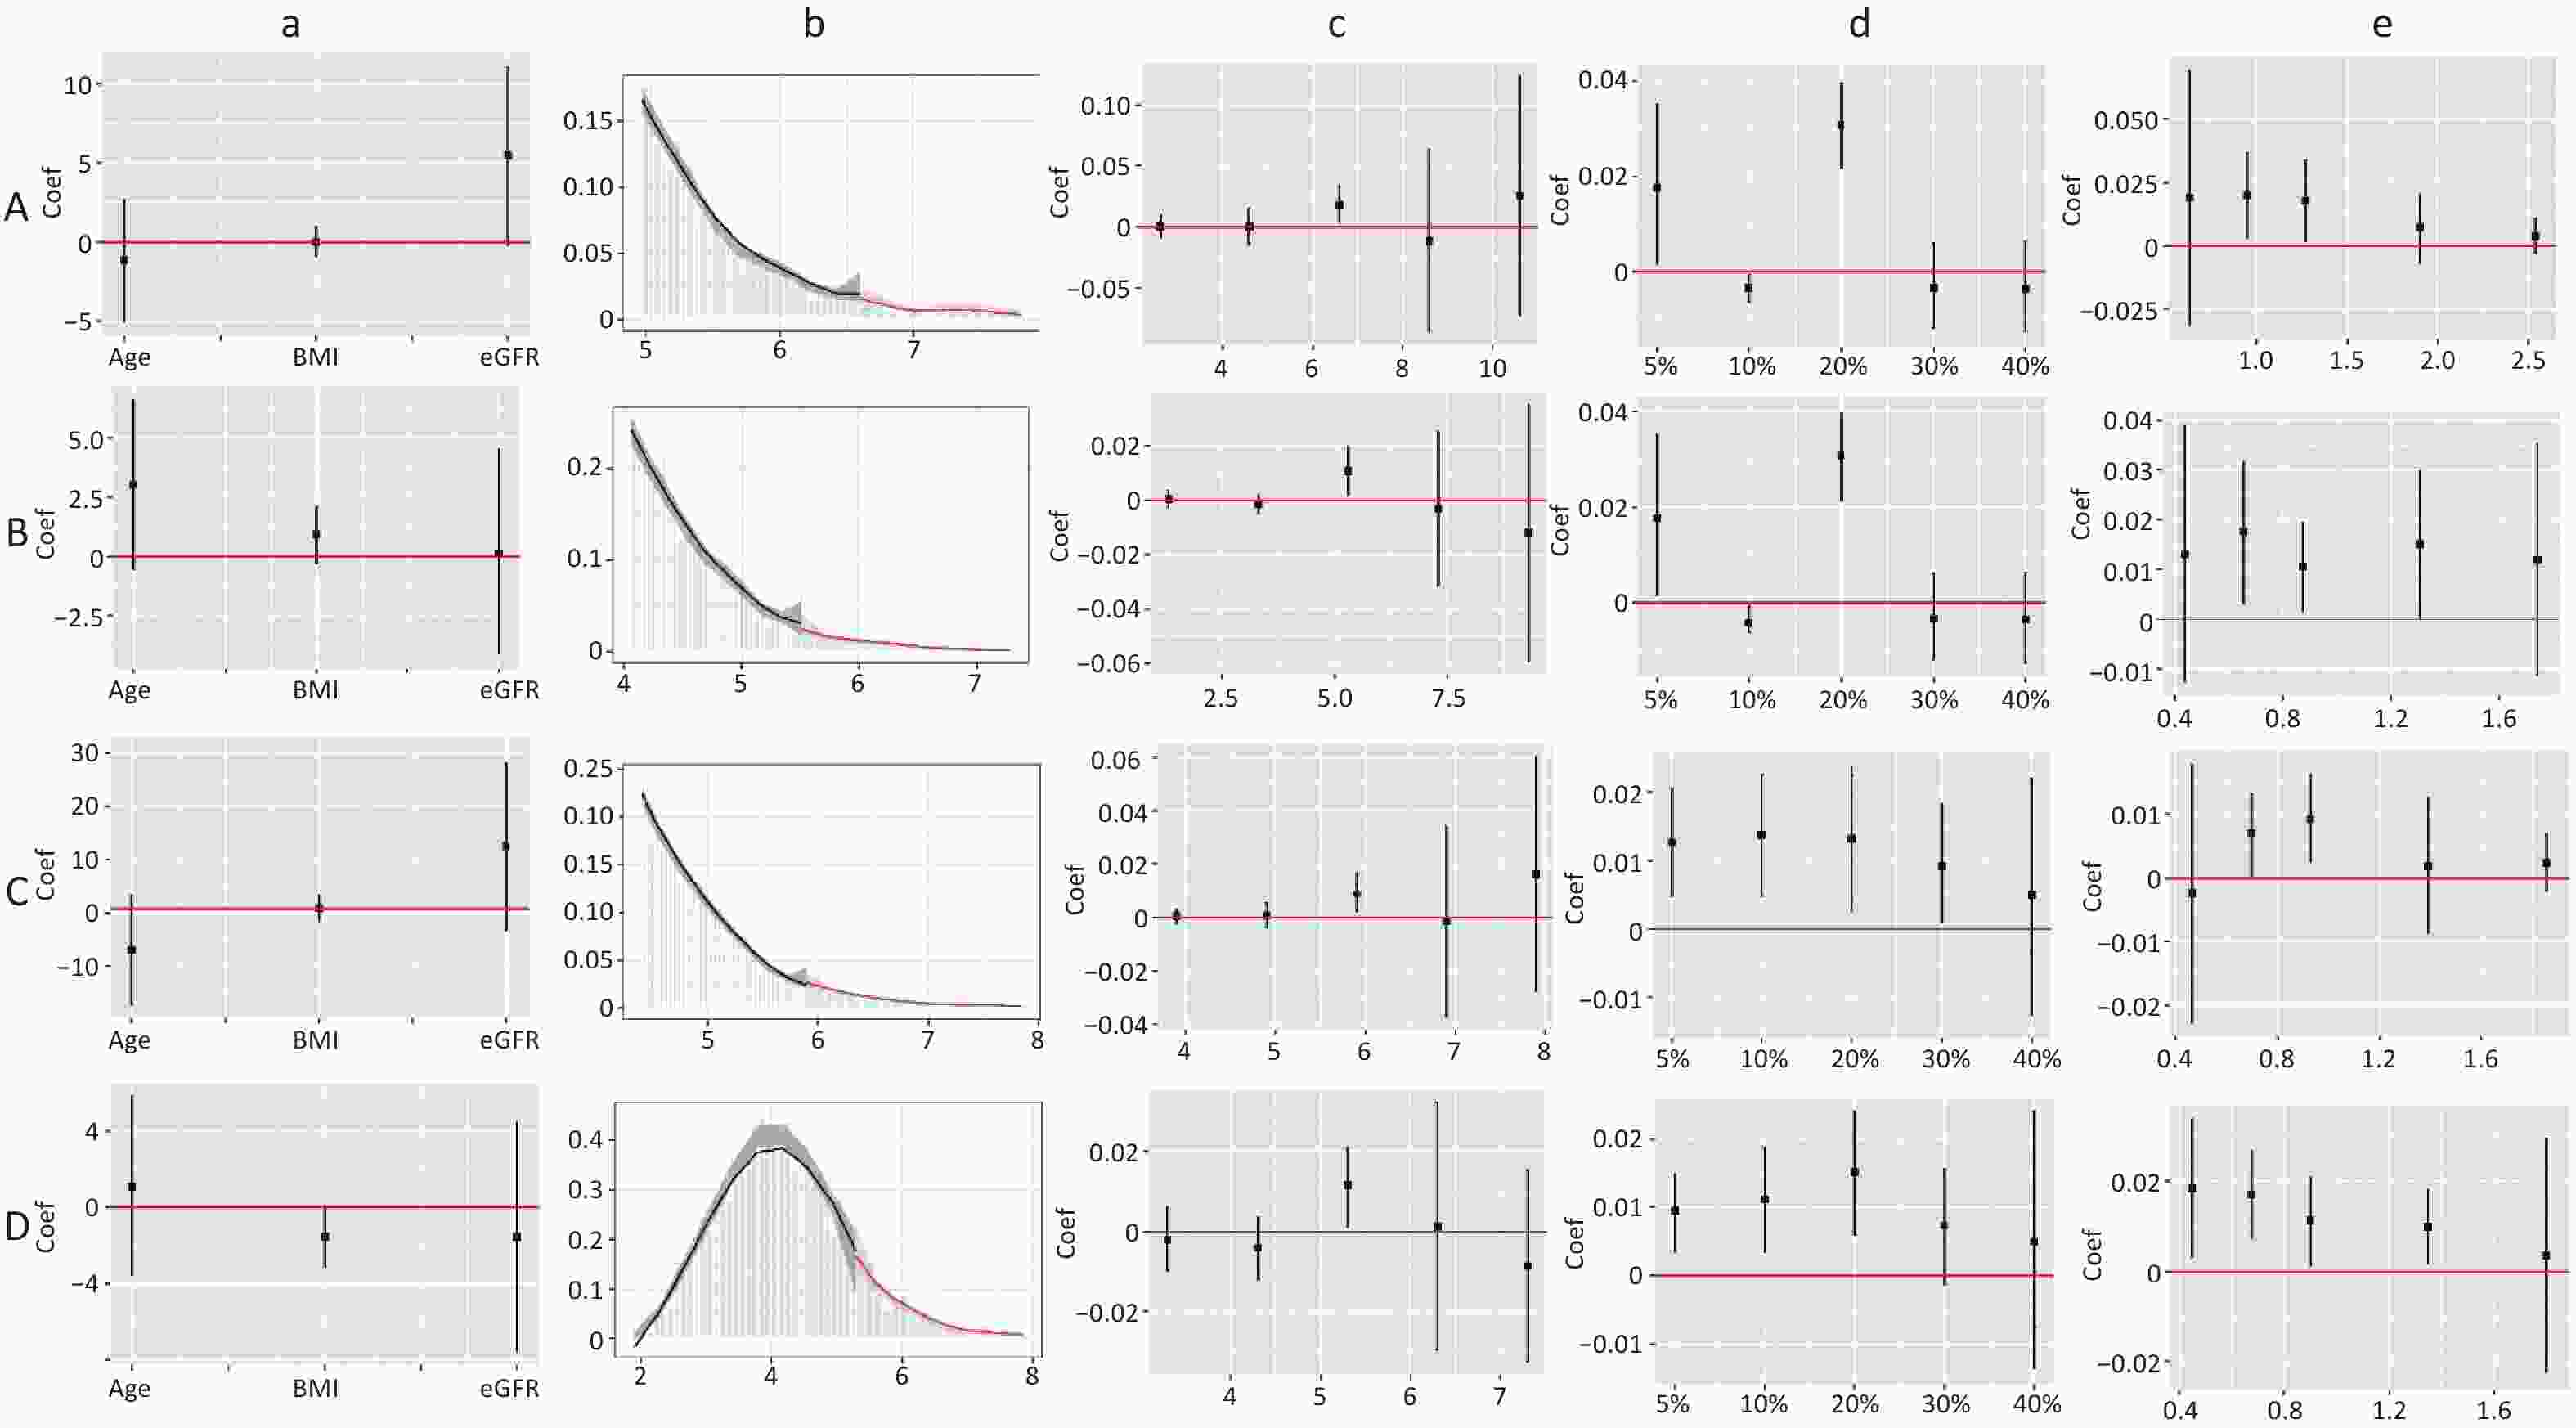
Figure S4. Validity test and robust check of RDD between TC/HDL-C and CKD. (1) A: validity test and robust check in male; B: validity test and robust check in female. C: validity test and robust check in non-dyslipidemia; D: validity test and robust check in dyslipidemia. (2) a: pseudo outcome test, the x-axes is the variable for the pseudo outcome, and the y-axes is the local average treatment effect estimate value; b: McCrary’s test, the x-axes is the level of lipid profiles, and the y-axes is the density function estimates; c: pseudo cutoff point, the x-axes is the level of lipid profiles (i.e. the pseudo cutoff value), and the y-axes is the local average treatment effect estimate value; d: donut hole approach, the x-axes is the percent of sample removed, and the y-axes is the local average treatment effect estimate value; e: bandwidth selection, the x-axes is the different bandwidth values, and the y-axes is the local average treatment effect estimate value. TC, total cholesterol; HDL-C, high-density lipoprotein cholesterol.
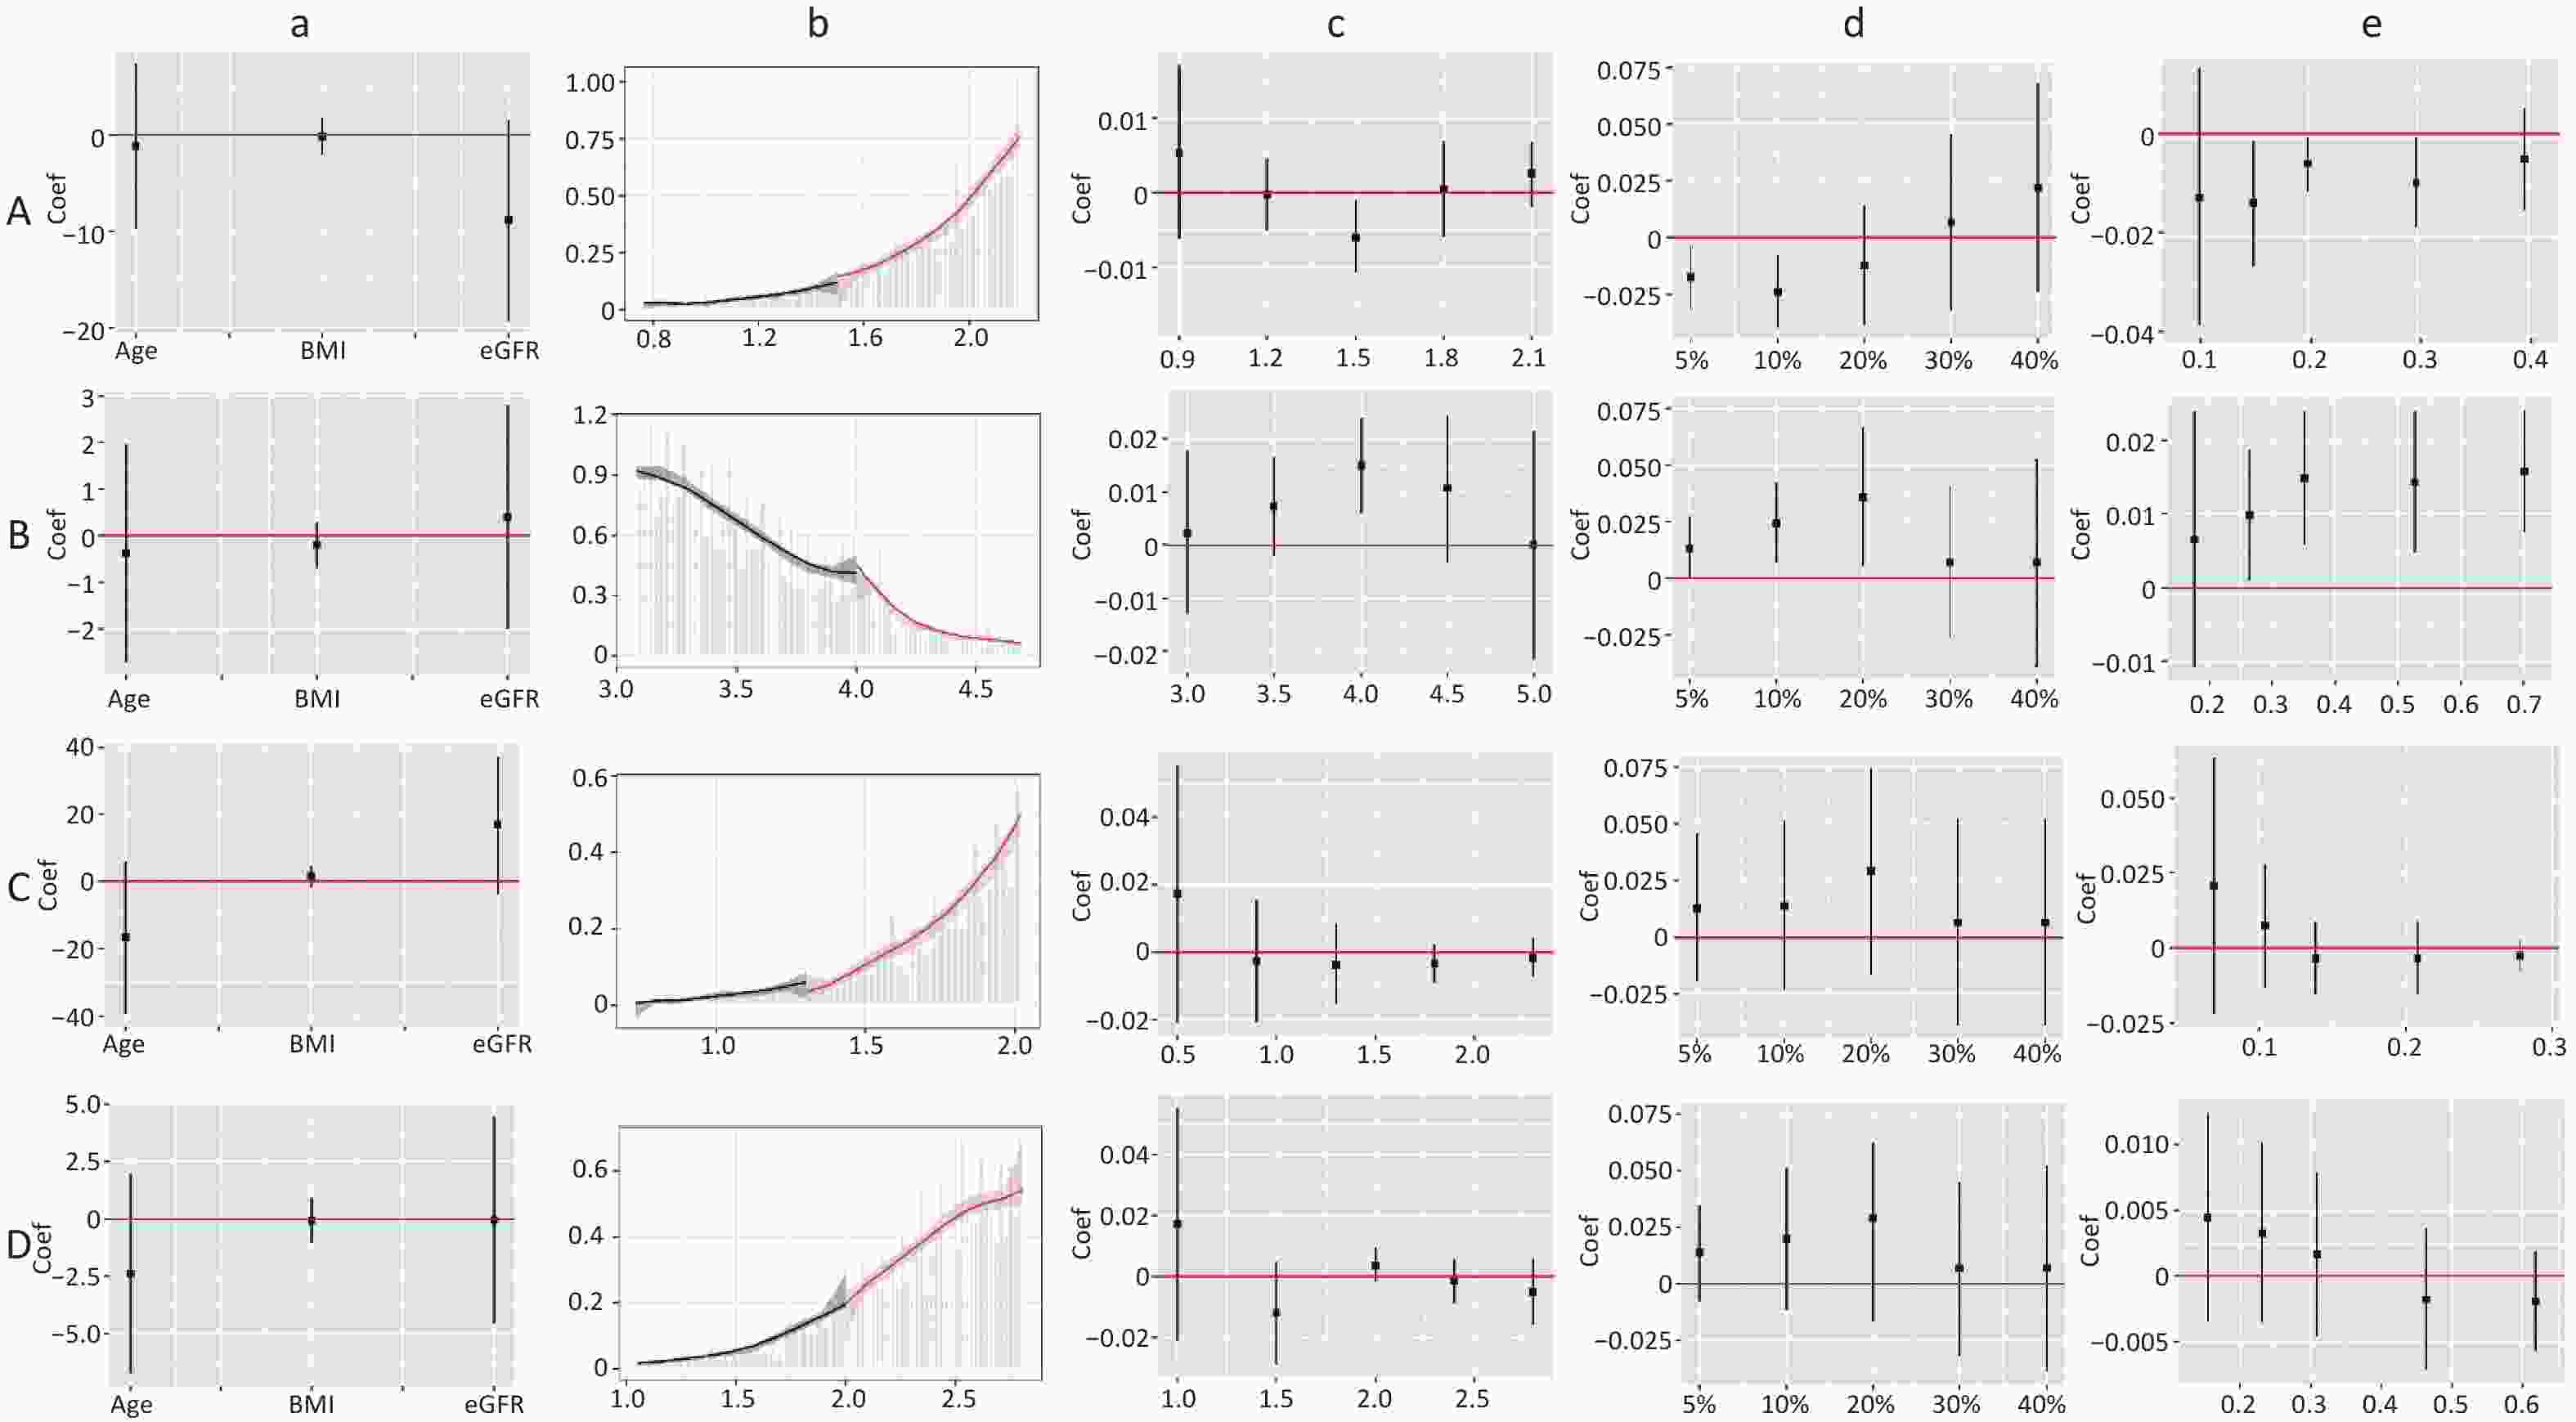
Figure S5. Validity test and robust check of RDD between LDL-C and CKD. (1) A: validity test and robust check of RDD between LDL-C (< 2.77) and CKD in male; B: validity test and robust check of RDD between LDL-C (≥ 2.77) and CKD in male; C: validity test and robust check of RDD between LDL-C (< 2.85) and CKD in non-dyslipidemia; D: validity test and robust check of RDD between LDL-C (< 2.88) and CKD in dyslipidemia. (2) a: pseudo outcome test, the x-axes is the variable for the pseudo outcome, and the y-axes is the local average treatment effect estimate value; b: McCrary's test, the x-axes is the level of lipid profiles, and the y-axes is the density function estimates; c: pseudo cutoff point, the x-axes is the level of lipid profiles (i.e. the pseudo cutoff value), and the y-axes is the local average treatment effect estimate value; d: donut hole approach, the x-axes is the percent of sample removed, and the y-axes is the local average treatment effect estimate value; e: bandwidth selection, the x-axes is the different bandwidth values, and the y-axes is the local average treatment effect estimate value. LDL-C, low-density lipoprotein cholesterol.
HTML
Subjects
Definition of Variables and Outcomes
Statistical Analysis
Description Statistics
Associations between Lipid Profiles and CKD
Analysis of RDD
Sensitivity Analysis
 23423+Supplementary Materials.pdf
|

|

 Quick Links
 DownLoad: