


-
Glioblastoma (GBM) is the most prevalent and devastating primary malignancy of the central nervous system (CNS), accounting for 47.7% of all primary CNS tumors[1]. Despite the implementation of current aggressive multimodal therapies, including extensive neurosurgical resection followed by combined radiochemotherapy, GBM remains an invariably fatal and incurable disease characterized by rapid progression, high invasive potential, and extremely poor prognosis. The recurrence rate of GBM is as high as 92.4%[2]. Consequently, patients with GBM exhibit a median overall survival of merely 16–18 months, accompanied by a meager five-year survival rate of only 5.6%[1,2].
Histologically, similar to most World Health Organization (WHO) grade 4 primary CNS tumors, GBMs exhibit robust angiogenic features. Therefore, antiangiogenic therapy (AAT) has been proposed as an important adjuvant treatment for GBM. The anti-vascular endothelial growth factor (VEGF) monoclonal antibody bevacizumab, which specifically targets vascular endothelial cells (ECs), has demonstrated efficacy in managing recurrent GBM and has been approved for the treatment of progressive GBM by the U.S. Food and Drug Administration[3]. Nevertheless, the clinical application of AAT fails to confer meaningful enhancement in patient overall survival[4], thus prompting an investigation into alternative neovascularization pathways that GBM might exploit, thereby evading EC-dependent angiogenesis.
Vascular mimicry (VM) is a recently identified angiogenic process believed to play a vital role in the rapid growth and severe invasion of AAT-resistant tumors[5,6]. Unlike traditional angiogenic processes involving the vascular endothelium, VM is established by highly invasive and genetically aberrant tumor cells. These cells form irregular microvascular channels rich in extravascular deposits and transport fluid from leaky blood vessels or connect to normal blood vessels[5-7]. VM has been detected in malignant gliomas and is hypothesized to complement the microcirculation within these tumors[8,9]. Researchers have observed that GBM VM is associated with poor clinical outcomes[10]. Both chemotherapy and AAT promote and accelerate VM in GBM, thus facilitating a more aggressive proliferative phenotype[11,12]. Thus, VM is considered a crucial target for GBM to overcome the side effects of conventional therapeutic strategies[13]. The mechanisms involved in VM are diverse and complicated and include the tumor microenvironment, plasticity of cancer stem cells (CSCs), epithelial-mesenchymal transition (EMT), angiogenic growth factors, and autophagy[6,14-16]. Among these factors, CSCs are thought to actively contribute to VM by adopting a dominant endothelial-like phenotype and promoting the expression of VM-related proteins, such as VE-Cadherin, Laminins, VEGF-2, thereby promoting angiogenesis in GBMs in addition to directly differentiating into endothelial cells (ECs)[17,18]. Therefore, there is an urgent need to explore the details of VM formation, such as the function of CSCs, and identify effective approaches for blocking the tumor blood supply in GBM, which could ultimately reverse the poor clinical outcome of this malignancy.
The serine/threonine kinase ataxia-telangiectasia mutated (ATM), widely recognized as a prominent regulator within the DNA damage response (DDR), belongs to the phosphatidylinositol 3-kinase (PI3K)-related protein kinase (PIKK) family[19]. ATM is involved in various biological processes, including cellular homeostasis, immune regulation, senescence, tumorigenesis, tumor progression, and angiogenesis[19-25]. In the context of pathological neoangiogenesis, ATM is an essential mediator that regulates downstream effectors and subsequently influences cellular homeostasis and metabolism[20,21]. Notably, ATM activation contributes to chemoradiotherapy resistance in gliomas[22-24]. Our previous study elucidated the impact of ATM activation through phosphorylation on VM in oligodendroglioma, with heightened levels of ATM activation and VM correlating with an unfavorable prognosis[25]. However, the precise involvement of activated ATM in the VM in GBM and its subsequent impact on clinical outcomes remain unclear. Furthermore, in GBM, glioma stem cells (GSCs) are responsible for radiation resistance owing to enhanced checkpoint activation and DNA double-strand break (DSB) repair, which are ATM-dependent, thereby contributing to the inadequacy of current therapies[26]. Therefore, it has piqued our interest to explore whether the regulation of ATM activation might affect VM formation mediated by GSCs in GBM.
In this study, we assessed the expression level of phosphorylated ATM (pATM) using semi-quantitative immunohistochemical (IHC) staining and analyzed VM formation using histochemical double staining in a cohort of 145 surgically excised GBM specimens. Furthermore, we investigated the potential correlations between pATM expression, VM, and various clinical parameters. Our findings revealed the prognostic significance of VM, exhibiting a positive correlation with high levels of pATM expression in GBMs. To elucidate whether pATM in glioma stem-like cells (GSLC) affects VM, suppression of activation or knockdown of ATM expression in GSLCs was investigated to explore the potential mechanism regulating VM.
-
Neutral formalin-fixed, paraffin-embedded (FFPE) GBM specimens were obtained from 145 patients who underwent surgical resection between March 2018 and August 2019 at the First Affiliated Hospital of the University of Science and Technology of China (USTC). Written informed consent was obtained from all the patients. Diagnosis of GBM was confirmed in accordance with the 2021 revision of the WHO classification of central nervous system tumors[27]. The clinicopathological parameters of the patients housed in the Department of Pathology were extracted from their medical records and are summarized in Table 1. Primary GBM refers to tumors diagnosed as GBM (WHO grade 4) at initial presentation without evidence of a precursor lower-grade glioma. Conversely, secondary GBM refers to tumors that progressed from a previously diagnosed lower-grade glioma, such as diffuse astrocytoma (WHO grade 2) or anaplastic astrocytoma (WHO grade 3), and transformed to GBM (WHO grade 4) at the time of enrollment in our study cohort. The follow-up period ranged from 1 to 29 months (median, 16 months). Progression-free survival (PFS) was defined as the duration from the date of surgery to the occurrence of the first relapse, secondary tumor emergence, death, or last follow-up. Overall survival (OS) was calculated from the date of surgery to death caused by the tumor or the last follow-up. The exclusion criterion included incomplete clinical information, which led to the exclusion of 23 patients. Consequently, 122 PFS and OS data sets were retained. Among these, 56 patients had relapsed tumors and 91 succumbed to the disease (Table 2).
Characteristics Total VM formation pATM expression Negative Positive P Low High P Number 122 75 47 71 51 Gender Male 52 30 22 0.567 44 31 1.000 Female 70 45 25 27 20 Age (years) < 56 52 30 22 0.573 28 24 0.460 ≥ 56 70 45 25 43 27 KPS score < 70 47 25 22 0.181 26 21 0.707 70–100 75 50 25 45 30 Primary or recurrent Primary 110 70 40 0.210 66 44 0.236 Recurrent 12 5 7 5 7 Primary or secondary Primary 118 74 44 0.297 71 47 0.028 Secondary 4 1 3 0 4 Tumor located side Left 54 31 23 0.320 31 23 0.739 Right 61 41 20 36 25 Middle 3 2 1 1 2 Bilateral 4 1 3 3 1 Tumor located lobe Frontal 25 15 10 0.699 14 11 0.152 Temporal 20 14 6 13 7 Others 16 11 5 13 3 Multiple center 61 35 26 31 30 Surgical resection STR 18 12 6 0.794 10 8 0.802 TR 104 63 41 61 43 Chemotherapy Unreceived 27 16 11 0.825 15 12 0.826 Received 95 59 36 56 39 Radiotherapy Unreceived 45 25 20 0.339 25 20 0.706 Received 77 50 27 46 31 Relapse Absent 66 52 14 < 0.001 46 20 0.006 Present 56 23 33 25 31 Death No 31 28 3 < 0.001 27 4 < 0. 001 Yes 91 47 44 44 47 Note. Data were represented as number. VM, vasculogenic mimicry; pATM, phosphorylate ataxia-telangiectasia mutated; GBM, glioblastoma; KPS, Karnofsky performance status; TR, totally removed; STR, subtotally removed. Table 1. Association between VM formation, pATM expression, and clinical characteristics in GBM patients
Genes Primers Sequence NANOG Forward 5’-AGGCAAACAACCCACTTCT-3’ Reverse 5’-TCACACCATTGCTATTCTTCG-3’ OCT4 Forward 5’-TATTCAGCCAAACGACCATCT-3’ Reverse 5’-TCAGCTTCCTCCACCCACTT-3’ SOX2 Forward 5’-ATCACCCACAGCAAATGACA-3’ Reverse 5’-CAAAGCTCCTACCGTACCACTA-3’ GAPDH Forward 5’-AAGGTGAAGGTCGGAGTCAAC-3’ Reverse 5’-GGGGTCATTGATGGCAACAATA-3’ Table 2. Primer sequences used for qRT-PCR analysis of stemness markers NANOG, OCT4, SOX2 and housekeeping gene GAPDH
-
Following the retrieval of GBM FFPE specimens, 3 µm-thick sections were cut and subjected to deparaffinization, hydration, antigen retrieval, and blocking. Subsequently, each section was incubated with the primary antibody pATM (Abcam, ab81292, 1:1,600 dilution) for 2 h at room temperature, followed by incubation with avidin-biotin-peroxidase (MXB Biotechnologies, KIT-5220) at room temperature for 15 min, and then with diaminobenzidine (MXB Biotechnologies, KIT-5220) for 1 to 2 min. Finally, all the sections were washed under running tap water for 15 min and counterstained with hematoxylin. The expression level of pATM was assessed by semi-quantitative analysis employing a composite score system, which considered both the percentage and intensity of stained tumor cells. Positive cells were evaluated per high-power field (HPF) at 400× magnification. Sections exhibiting 5% or fewer positive cells were assigned 0 points, whereas those featuring 5%–25%, 26%–50%, 51%–75%, and 76%–100% positive cells received scores of 1, 2, 3, and 4. Additionally, the stained signals within each section were assigned scores of 0, 1, 2, or 3, corresponding to negative, weak, moderate, or high intensity, respectively. The obtained percentage and intensity scores were then multiplied to derive an overall staining score, thus facilitating the classification of the tumor specimens into either a low-expression group (0–3 points) or a high-expression group (4–12 points). All sections were assessed by two independent pathologists who were blinded to patient identities and clinical outcomes.
-
VM was detected using the widely accepted CD31-PAS dual staining technique[28,29]. Initially, sections underwent IHC staining with an anti-CD31 monoclonal antibody (Cell Signaling Technology, 3528, 1:800 dilution). Subsequently, they were exposed to sodium periodate (BaSO, BA4080B) for 10 min, followed by rinsing with distilled water for 5 min. Thereafter, the cells were incubated with Schiff solution (BaSO, BA4080B) for 5 min. The sections were counterstained with hematoxylin, dehydrated, and mounted. Subsequent examination of the sections was conducted at a magnification of 400× by two pathologists who were blinded to demographic or outcome-related data. In accordance with the literature, VM were defined as PAS-positive tubular structures encompassed by tumor cells, with red blood cells (RBCs) present in the lumen, but devoid of an endothelial cell lining[5]. Consistent with previous experiments, tubes positive for PAS and lined with CD31-positive cells (PAS+/CD31+) were defined as endothelium-dependent vessels. In contrast, tubes positive for PAS staining encompassed by tumor cells containing RBCs but devoid of ECs (PAS+/CD31-) were identified as VM structures[28,29]. Each section underwent a comprehensive analysis to identify VM, and the VM ratio was calculated as the percentage of total vessels (VM vessels/total vessels per 10 HPF). Moreover, the GFAP/PAS dual-staining technique was employed using an anti-GFAP monoclonal antibody (ZSGB-BIO, ZA-0529, ready-to-use) to further validate the VM structures characterized by PAS-positive microchannels enclosed by tumor cells exhibiting strong GFAP expression.
-
Both U87 and U251 GBM cell lines (purchased from Applied Biosystems, authenticated by short tandem repeat profiling) were maintained in Dulbecco’s Modified Eagle Medium (DMEM, Gibco, C11995500BT) supplemented with 10% fetal bovine serum (FBS, Gibco, 10099141), and 1% penicillin-streptomycin (10,000 unit/mL, Gibco, 15140122) under a humidified incubator at 37 °C with 5% CO2. For sphere formation, U87 and U251 cells were plated in 100-mm culture dishes. Once the cells reached 70%–80% confluence, they were detached, washed twice with phosphate-buffered saline (PBS; Sigma-Aldrich, P3813), and cultured in a stem cell medium (STM). The STM consisted of Neurobasal Medium (Gibco, 12349015), L-Glutamine (Gibco, 35050061, 1:100 dilution), Sodium Pyruvate Solution (BI, 2008117, 1:100 dilution), Non-essential amino acids solution (BI, 2032603, 1:100 dilution), B27-supplement (Gibco, 17504044, 1:50 dilution), penicillin-streptomycin (10,000 unit/mL, Gibco, 15140122), human bFGF (Gibco, PHG0367, 1:50,000 dilution) and human EGF (Gibco, PHG0314, 1:50,000 dilution). Subsequently, the tumor cells underwent division and gradually formed suspended spheres within the STM. After 7–10 days, when the majority of spheres exhibited a size revealing a dark core under light microscopy, the cells were detached using Accutase (Millipore, SCR005) to obtain a single-cell suspension for subsequent experiments. Tumor cell spheres with an enhanced stem cell phenotype, as confirmed by quantitative real-time polymerase chain reaction (qRT-PCR), were characterized as GSLCs.
-
Total RNA was extracted using the TRIzol reagent (Invitrogen, 15596026) according to the manufacturer’s instructions. RNA concentration was quantified using a NanoDrop spectrophotometer (Thermo Scientific, NanoDrop One). The RNA samples were reverse-transcribed into cDNA using the RevertAid First Strand cDNA Synthesis Kit (Thermo Scientific, K1622). The primers used in this study were synthesized by Sangon Biotech, Ltd. (Shanghai, China) (Table 2). qRT-PCR was performed using the ChamQ Universal SYBR qPCR Master Mix (Vazyme, Q711) in a Real-Time PCR System (Roche, LightCycler96, Switzerland). The qRT-PCR protocol included an initial denaturation step of 95 °C for 30 s, followed by 40 cycles of 95 °C for 5 s and 60 °C for 30 s. Relative expression levels of RNAs were normalized to GAPDH, and relative fold changes were calculated using the 2−ΔΔCt method[30].
-
The effect of the ATM phosphorylation inhibitor KU55933 (SML1109; Sigma-Aldrich)[19] on the viability of U87 and U251 cells was examined using the CCK-8 assay. GSLCs were detached and seeded in a 96-well plate at a density of 1 × 10⁴ cells per well in 100 μL complete medium. KU55933 was added to each well to achieve final concentrations of 0.1, 1, 10, or 100 μmol/L. After incubating for 72 h, 10 μL CCK-8 solution (BBI, E606335) was added to each well, and incubated for an additional 2 h. Finally, the absorbance was measured at 450 nm using a Microplate Absorbance Reader (DeTie, HBS-1096A, China) to determine cell viability.
-
The 24-well tissue culture plate was uniformly pre-coated with growth factor-reduced Matrigel (200 µL/well, Corning, 354234) while kept on ice. Then, the Matrigel was allowed to polymerize for 1 h at 37 °C. GSLCs were detached and resuspended in an endothelial cell medium (ECM, ScienCell, 26327). Cells (1 × 10⁵) were added to each pre-coated well, layered above the Matrigel, and incubated at 37 °C for at least 6 h. Photomicrographs were captured using an IX51 inverted microscope (Olympus, Tokyo, Japan). The appearance of an intact hollow tubular structure wrapped in tumor cells was considered tube formation. The number of tube-like structures within five randomly selected fields (at 200× magnification) was counted and the resulting mean values were used for subsequent analyses.
-
Total protein was extracted by RIPA buffer (Beyotime Biotechnology, P0013B) premixed with protease inhibitors (Beyotime Biotechnology, P1050). After quantification, proteins were separated by SDS-PAGE (Biosharp, BL522A) and transferred onto PVDF membranes (Millipore). The membranes were blocked with 5% nonfat milk in PBST buffer (PBS containing 0.5% Tween-20; Beyotime Biotechnology, ST825) and then incubated with primary antibodies, including pATM (Abcam, ab81292, 1:5,000 dilution), ATM (Abcam, ab32420, 1:1,000 dilution), VEGFR-2 (Cell Signaling, 9698, 1:1,000 dilution), p-VEGFR-2 (Cell Signaling, 2478, 1:1,000 dilution), VE-Cadherin (Invitrogen, 36-1900, 1:500 dilution), LamininB2 (BD Biosciences, 611555, 1:250 dilution), and β-actin (Cell Signaling, 4970, 1:3,000 dilution). After washing, the membranes were incubated with goat rabbit-or goat mouse-peroxidase-conjugated secondary antibodies (Invitrogen; anti-rabbit IgG, 31635, 1:10,000 dilution; anti-mouse IgG, 31160, 1:10,000 dilution). Proteins were detected using a chemiluminescence detection system (Bio-Rad, ChemiDocTM MP Imaging System) and visualized using autoradiography.
-
ATM expression was downregulated using lentiviral vectors containing short hairpin RNA (shRNAs). HEK293T cells were co-transfected with ATM shRNA (5’-GCTAAGTCACTGACCCATATTCTC-3’ or 5’-CACAAACTCTTGGTCATTATACTC-3’) or scrambled shRNA plasmids and the lentiviral packaging mix. Subsequently, the lentiviral particles produced were used to infect U87- and U251-derived GSLCs. Cells exhibiting stable ATM knockdown were selected through exposure to puromycin-containing medium (1 μg/mL for U87-GSLC; 2 μg/mL for U251-GSLC). Transfection efficiency was confirmed using western blot analysis.
-
Total RNA was extracted from the two groups in which ATM was knocked down (U87-GSLC-shATM1, U87-GSLC-shATM2, U251-GSLC-shATM1, and U251-GSLC-shATM2) and the control groups (U87-GSLC-shNC and U251-GSLC-shNC) using TRIzol reagent (Invitrogen, 15596026). The RNA libraries were sequenced using the Illumina NovaSeq platform at the Novogene Genomic Sequencing Center in Tianjing, China. RNA-seq sequence reads were aligned to the reference genome using HISAT2 v2.0.5. Differential expression analysis was performed using the DESeq2 R package (1.20.0). The resulting P-values were adjusted using Benjamini and Hochberg’s approach to control for the false discovery rate. Genes with an adjusted P-value (padj) < 0.05 and an absolute fold change of 2 or higher were considered significantly differentially expressed.
-
This study was conducted in accordance with the Declaration of Helsinki and approved by the Ethics Committee of the First Affiliated Hospital of the University of Science and Technology of China (approval number: 2022KY274). All the patients provided written informed consent to participate in this study.
-
Chi-square test, Fisher’s exact test, and t-test were used for categorical and continuous variables, respectively. PFS and OS were evaluated using Kaplan–Meier analysis, and the differences between groups were determined using the log-rank test. Statistical significance was set and 0.05 were considered statistically significant (*P < 0.05, **P < 0.01, and ***P < 0.001). Spearman’s coefficient was used to determine the correlation between pATM levels and VM formation. A Cox proportional hazards regression model was used to perform both univariate and multivariate analyses. Variables with a significance of P < 0.05 in univariate analysis were included in the subsequent multivariate analysis using stepwise backward elimination procedures. All statistical analyses were performed using IBM SPSS Statistics for Windows, version 22.0.
-
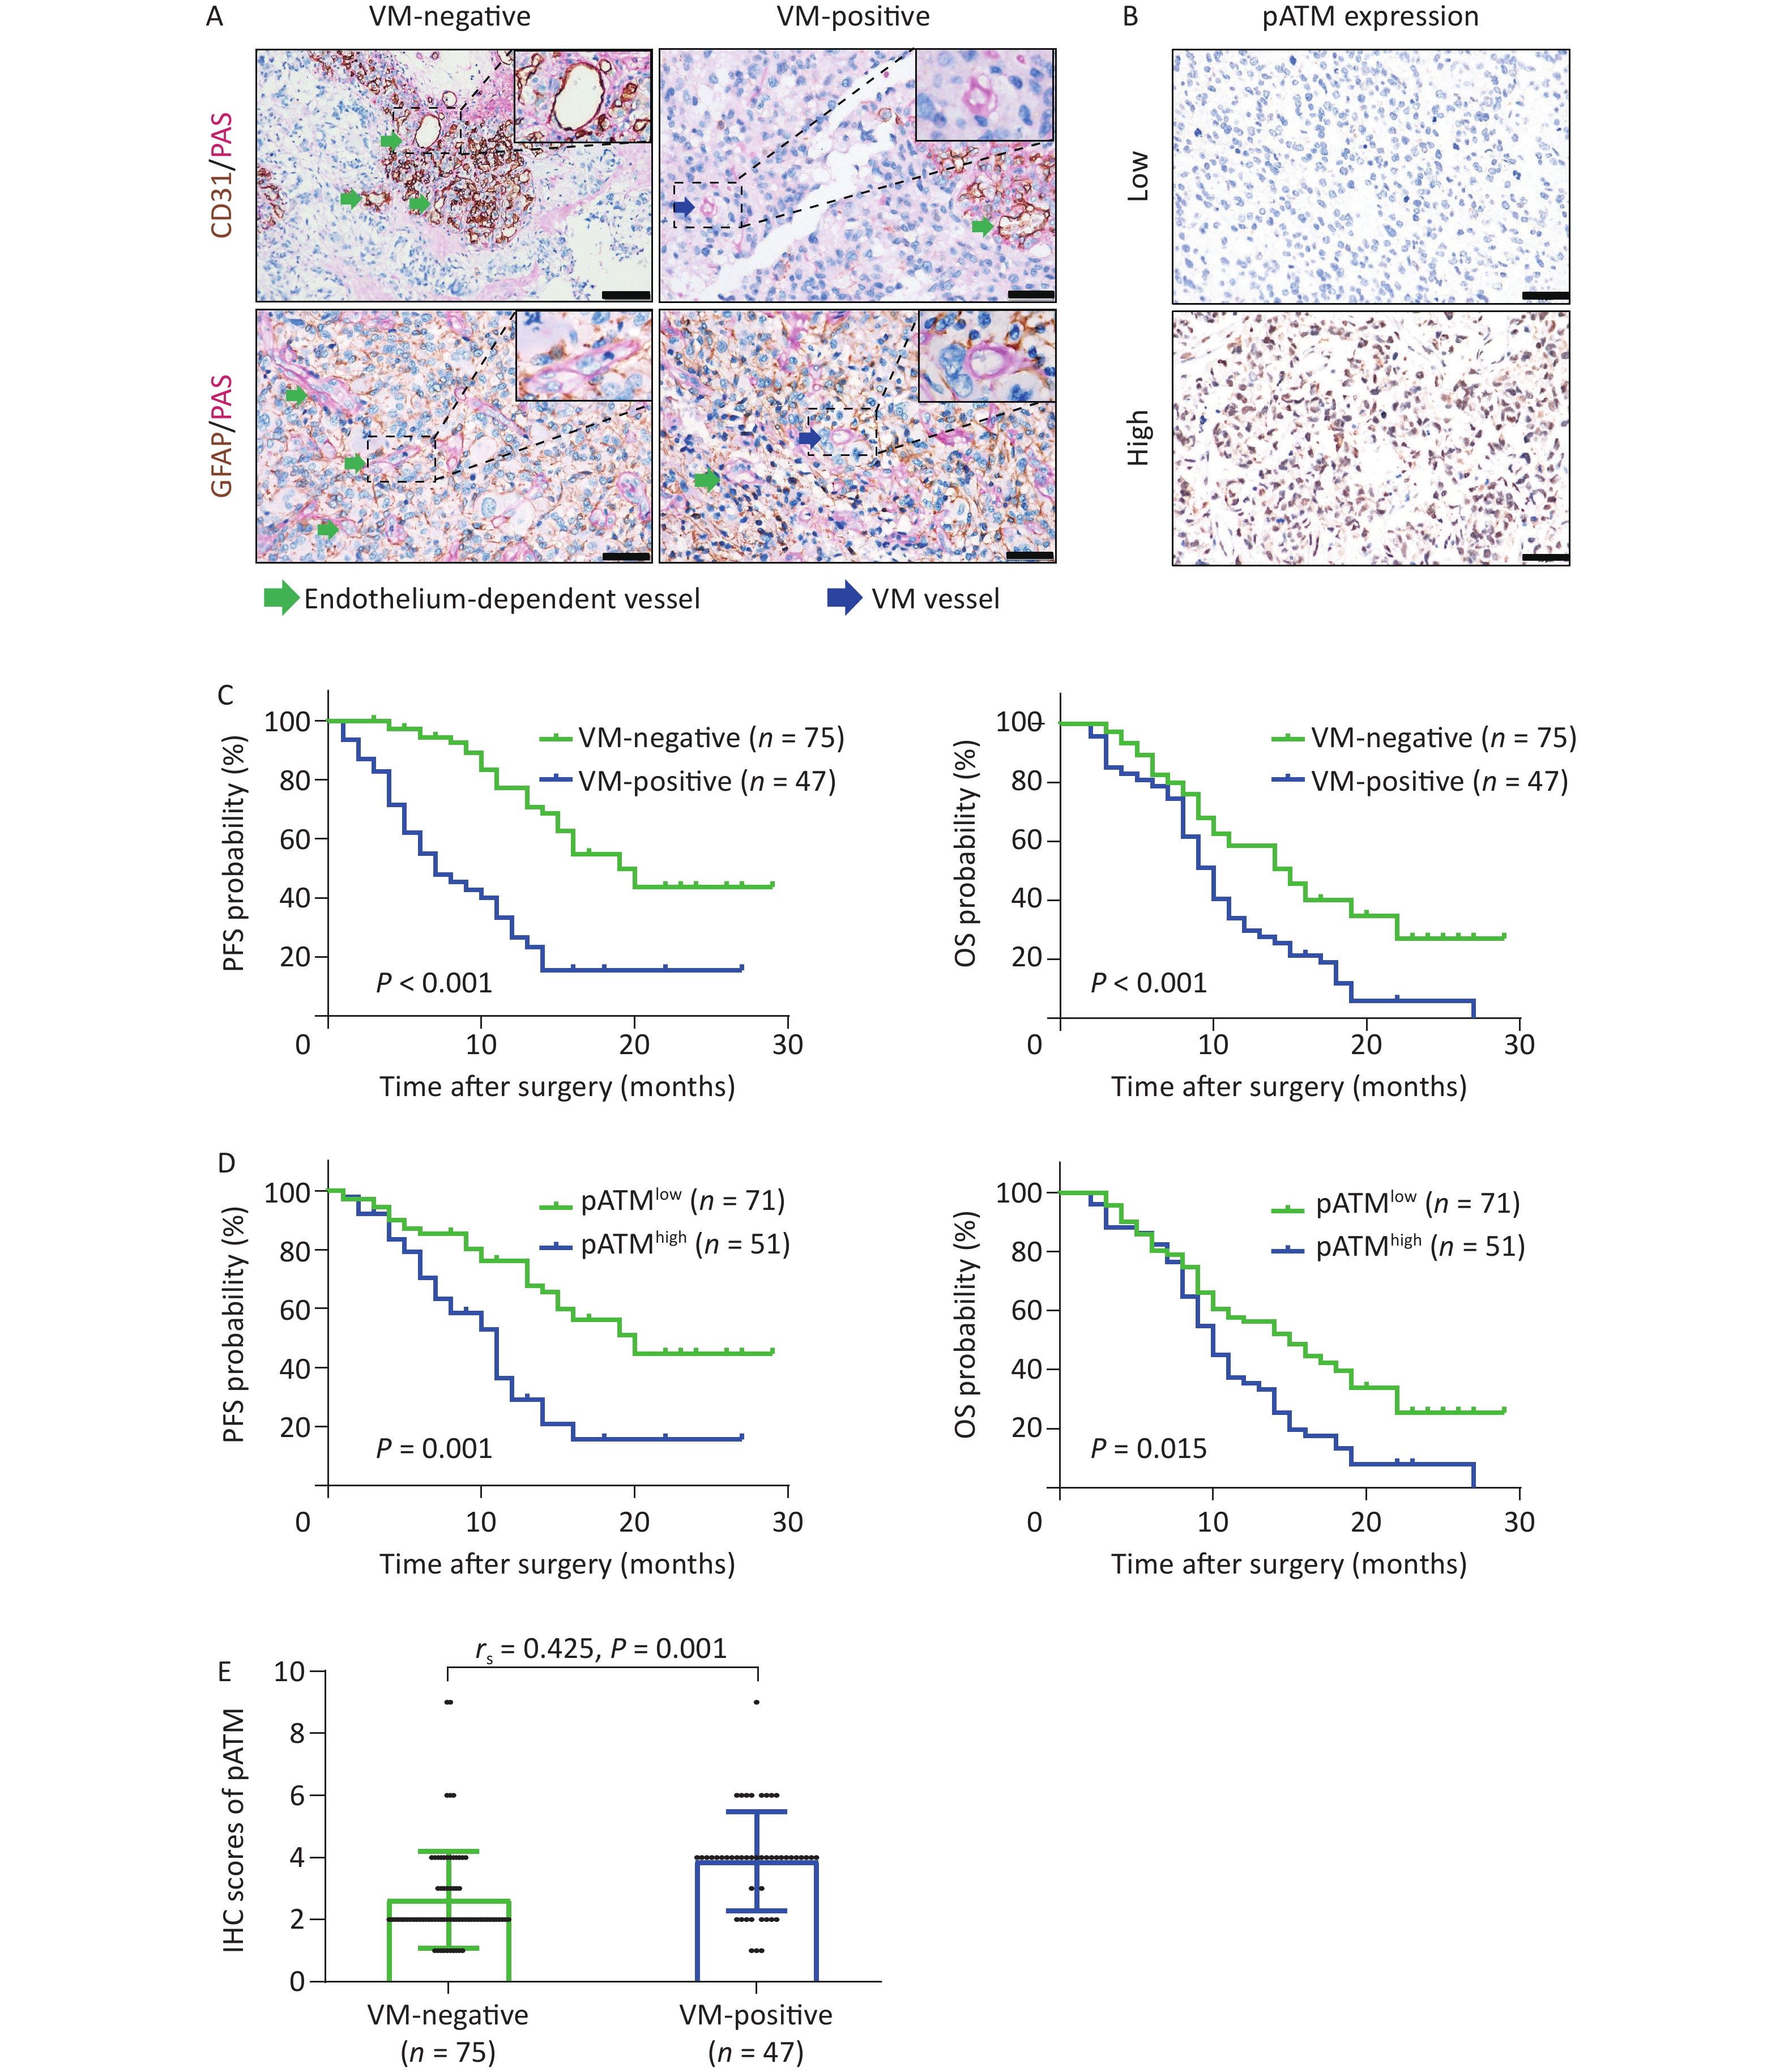
CD31/PAS and GFAP/PAS dual-staining were employed to distinguish VM vessels (CD31-/PAS+ and GFAP+/PAS+) from endothelium-dependent vessels (CD31+/PAS+) (Figure 1A). Among the 122 GBM specimens, VM vessels were detected in 51 (41.8%) cases, with an incidence of 1–12 VM vessels per 10 HPF within each section. The VM ratio ranged from 4.2% to 17.5% with an average of 10.6% and a median of 10.5%. Using receiver operating characteristic (ROC) curve analysis to assess various VM ratios, we calculated an area under the curve (AUC) of 0.693 for PFS and 0.681 for OS, both of which were statistically significant (P < 0.001 and P = 0.003, respectively) (Supplementary Figure S1, available in www.besjournal.com). Based on the maximal Youden index obtained from the PFS ROC curve, a “cutoff” value of 8.1% was established, classifying cases with a VM ratio exceeding 8.1% as VM-positive. As a result, 47 of 122 GBM specimens (38.5%) were categorized as VM-positive (Table 1). Through chi-square test analysis, VM-positive was significantly correlated with tumor relapse and patient death (both P < 0.001) but was not associated with sex, age, Karnofsky performance status (KPS) score, recurrent or secondary tumor (patients were diagnosed with recurrent or secondary GBM when enrolled in the study), tumor-located side, tumor-located lobe, surgical resection, chemotherapy, or radiotherapy (Table 1). Kaplan–Meier survival analyses illustrated that patients in the VM-positive group experienced notably shorter PFS and OS than those in the VM-negative group (both P < 0.001) (Figure 1C). To avoid potential confounding factors of recurrent tumors receiving advanced treatment, Kaplan–Meier survival analyses were reanalyzed in the series, excluding recurrent cases. These results remained significant (P < 0.001 for PFS and P = 0.002 for OS) (Supplementary Figure S2A, available in www.besjournal.com). These findings indicate the potential value of the VM in predicting the prognosis of patients with GBM.
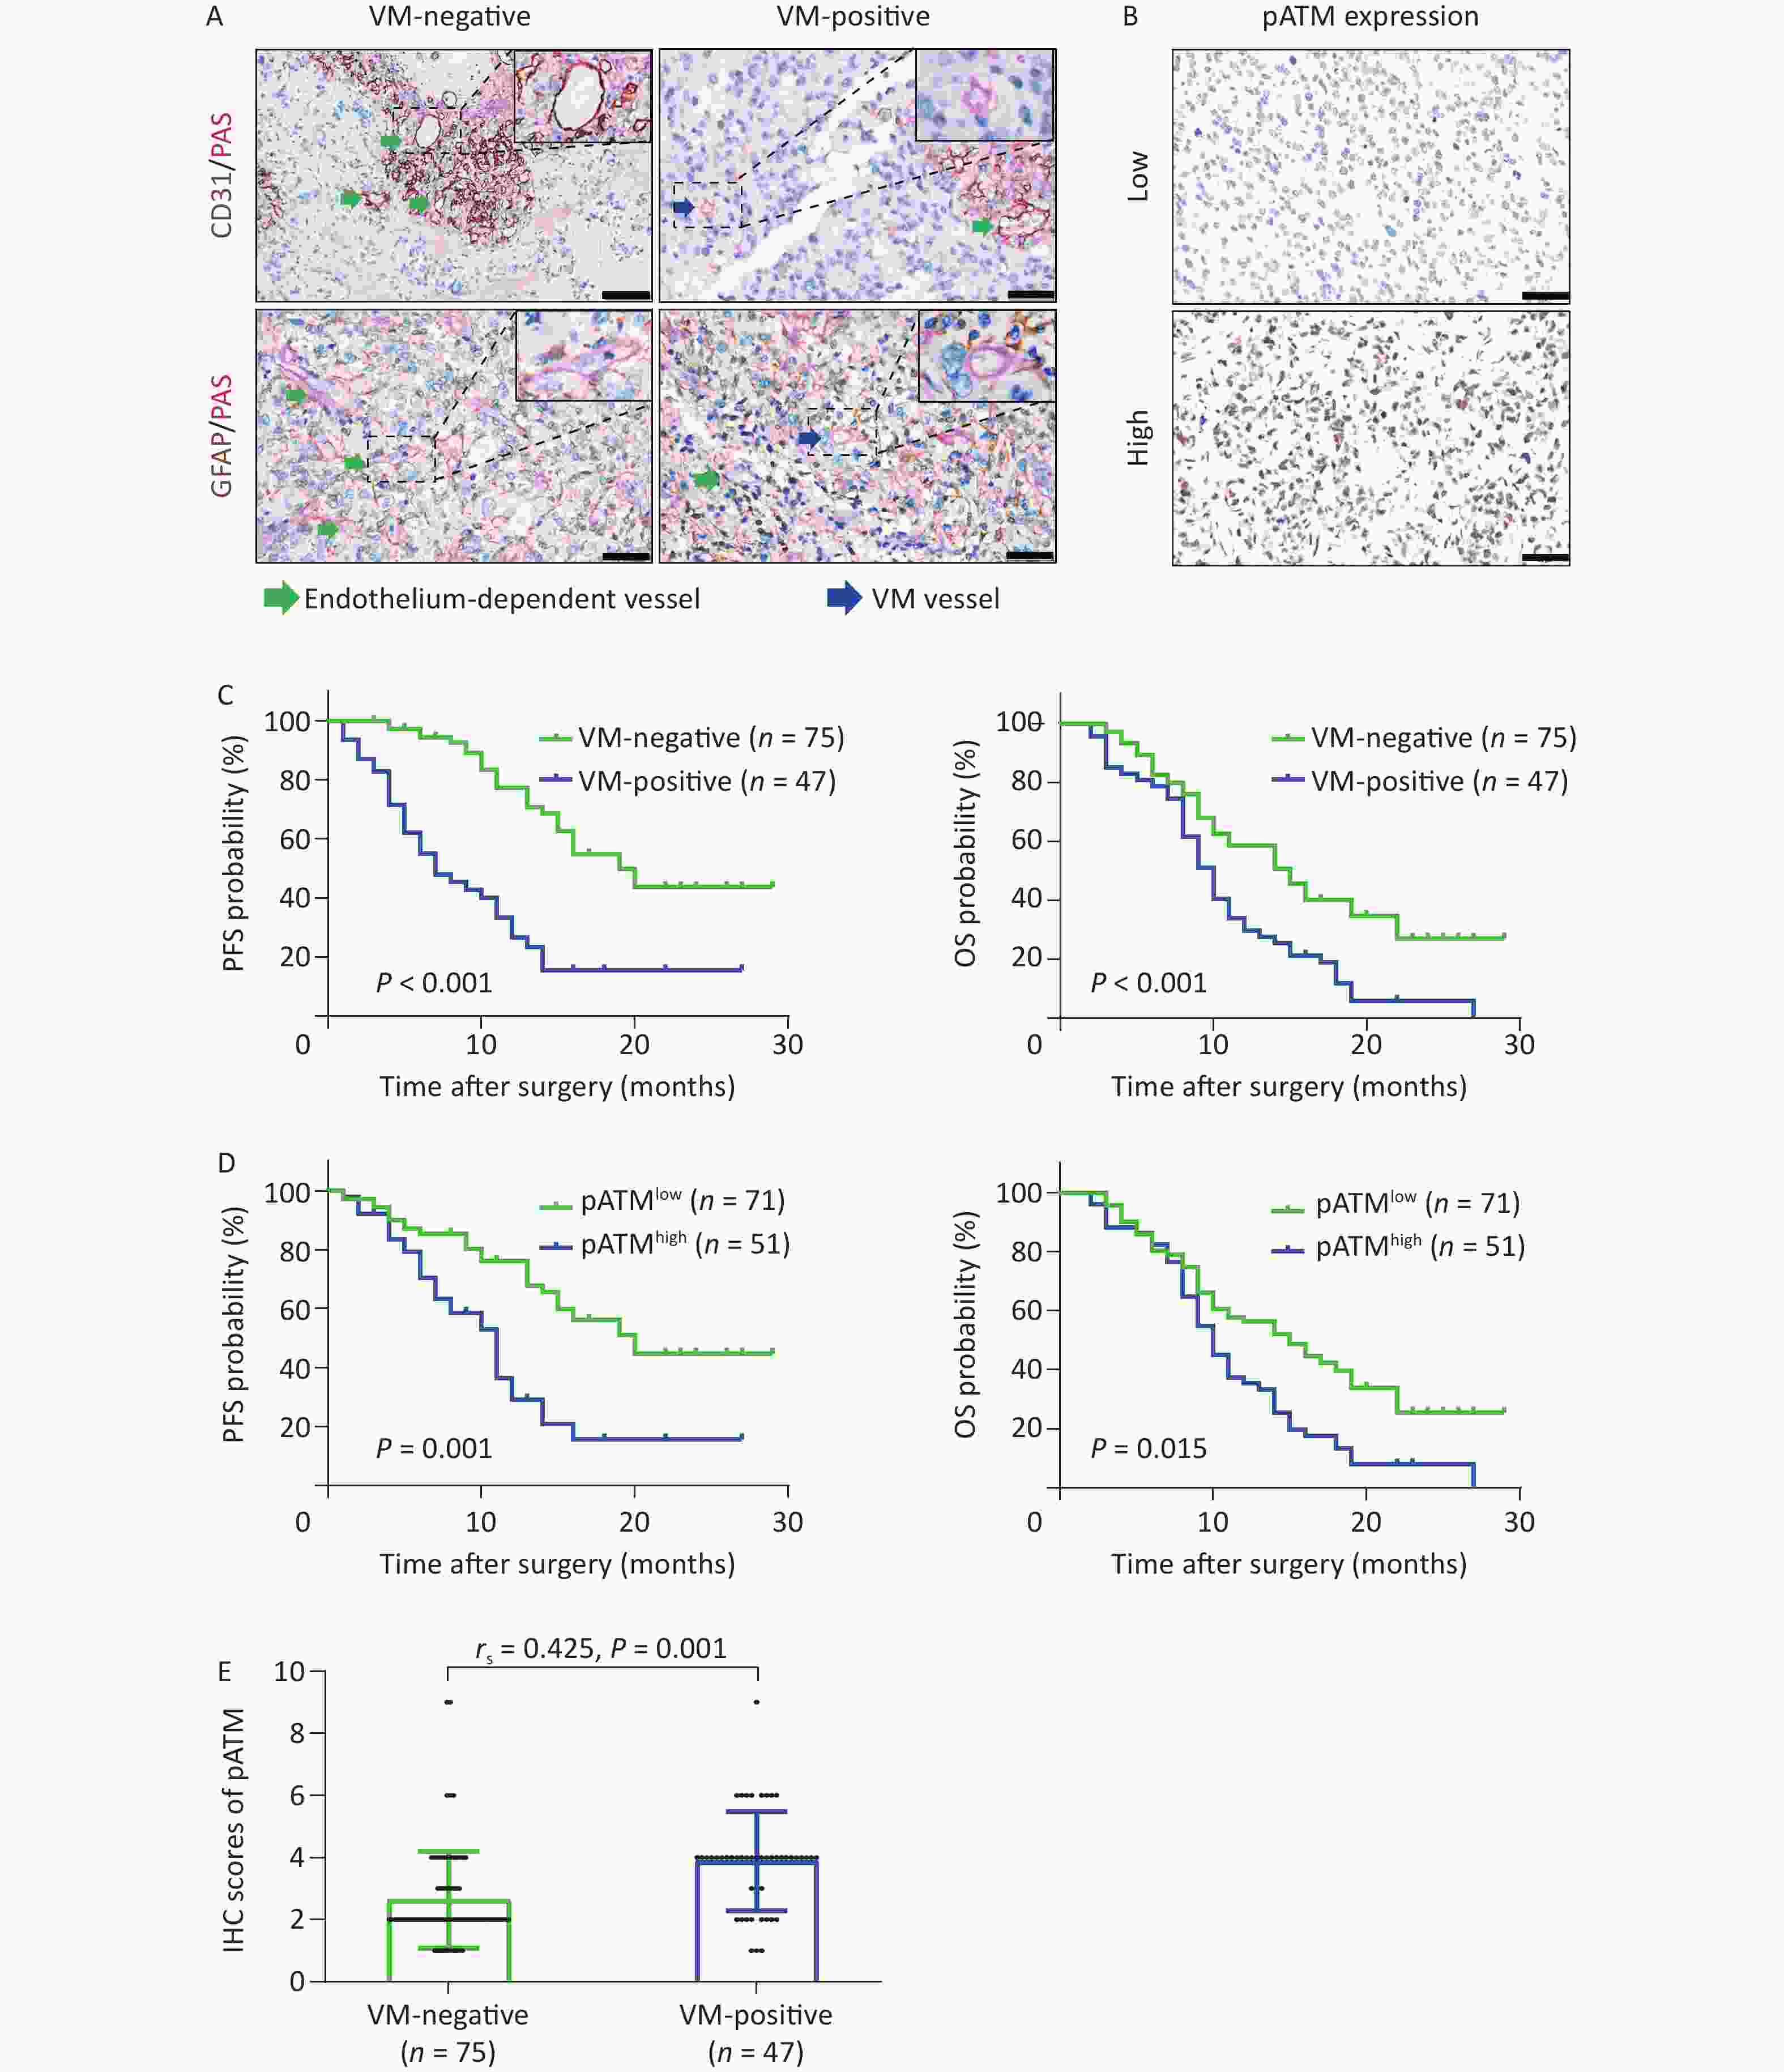
Figure 1. VM formation and high expression of pATM in GBM patients negatively correlated with PFS and OS. (A) CD31/PAS (above) and GFAP/PAS (below) stained GBM specimens showing endothelium-dependent vessels (CD31+/PAS+, green arrows) and VM vessels lacking endothelial cells (CD31-/PAS+, blue arrows) (400× magnification, scale bar = 50 μm), respectively. (B) Representative IHC images showing low (above) and high (below) nuclear expression of pATM in GBM specimens (400× magnification, scale bar = 50 μm). (C and D) Kaplan–Meier curves analyzing PFS (left) and OS (right) based on VM status (C; VM-negative, n = 75; VM-positive, n = 47) and pATM expression (D; low pATM, n = 71; high pATM, n = 51). VM formation and high pATM expression were associated with reduced PFS and OS (P < 0.05 for all comparisons). (E) Scatter plot showing higher pATM expression in VM-positive compared to VM-negative GBM specimens. Pearson’s correlation analysis confirmed a significant positive correlation between VM formation and pATM expressions (P = 0.01, rs = 0.425). VM: vasculogenic mimicry; GBM: glioblastoma; PFS: progression free survival; OS: overall survival; IHC: immunohistochemistry; pATM: phosphorylated ataxia-telangiectasia mutated.
ATM activation is crucial in the DDR and contributes to chemoradiotherapy resistance and the development of pathological neoangiogenesis in cancers. We detected phosphorylated ATM (pATM) in GBM specimens by IHC. The pATM signals were predominantly localized in the nuclei of the tumor cells (Figure 1B). Of the 122 GBM specimens, 71 (58.2%) exhibited low pATM expression and 51 (41.8%) displayed high pATM expression (Table 1). Notably, more patients in the high pATM expression group experienced tumor relapse and death than those in the low pATM expression group (tumor relapse: 60.8% vs. 35.2%, P = 0.006; death: 92.2% vs. 62.0%, P < 0.001). Notably, high pATM expression was identified only in secondary tumors (patients diagnosed with secondary GBM when enrolled in this study) (P = 0.028). However, no significant association was observed between pATM expression and other clinical characteristics (Table 1). Kaplan–Meier survival analyses showed that patients with high pATM expression exhibited poorer PFS and OS than those with low pATM expression (P = 0.001 for PFS and P = 0.015 for OS) (Figure 1D) in all enrolled patients, as well as in patients without recurrence (P < 0.001 for PFS and P = 0.004 for OS) (Supplementary Figure S2B). These results illustrated the prognostic value of pATM expression in patients with GBM.
To further assess the prognostic and predictive values of VM, pATM expression, and other clinical indicators, a Cox proportional hazards regression model was employed. Univariate analysis showed that among all the clinical features, recurrent tumor (P < 0.001 for PFS and P = 0.018 for OS), secondary tumor (P = 0.001 for PFS), unreceived chemotherapy (P < 0.001 for OS), unreceived radiotherapy (P < 0.001 for OS), high pATM expression (P < 0.001 for PFS and P = 0.003 for OS), and VM formation (P < 0.001 for PFS and P = 0.001 for OS) were unfavorable prognostic factors for GBM patients (Table 3). Multivariate analysis incorporating these independent prognostic factors from univariate analysis revealed that VM formation [P = 0.002 for PFS, hazard ratio (HR) = 3.309, 95% confidence interval (CI): 1.564–7.002] was an independent unfavorable predictor of tumor progression in GBM as well as recurrent tumor (P < 0.001 for PFS and P = 0.002 for OS), secondary tumor (P = 0.006 for PFS), unreceived chemotherapy (P = 0.002 for OS), and unreceived radiotherapy (P = 0.040 for OS) (Table 3).
Characteristics Univariate analysis Multivariate analysis PFS OS PFS OS HR (95% CI) P HR (95% CI) P HR (95% CI) P HR (95% CI) P Gender Male vs. female 0.792
(0.455–1.379)0.410 0.988
(0.647–1.508)0.954 Age (years) ≥ 56 vs. < 56 0.639
(0.371–1.082)0.096 1.113
(0.732–1.693)0.617 KPS score 70–100 vs. < 70 0.884
(0.517–1.511)0.651 0.749
(0.494–1.136)0.749 Recurrent tumor Recurrent vs. primary 6.444
(3.210–12.937)< 0.001 2.189
(1.147–4.177)0.018 5.179
(2.513–10.674)< 0.001 3.040
(1.524–6.064)0.002 Secondary tumor Secondary vs. primary 5.516
(1.960–15.524)0.001 2.055
(0.751–5.628)0.161 4.672
(1.561–13.990)0.006 Surgical resection TR vs. STR 1.445
(0.618–3.377)0.395 0.706
(0.450–1.296)0.318 Chemotherapy Received vs. unreceived 1.369
(0.538–3.480)0.509 0.257
(0.159–0.415)< 0.001 0.357
(0.188–0.676)0.002 Radiotherapy Received vs. unreceived 1.217
(0.636–2.329)0.553 0.332
(0.218–0.507)< 0.001 0.551
(0.313–0.973)0.040 Tumor located side Right vs. left 1.144
(0.660–1.983)0.632 1.260
(0.818–1.941)0.295 Tumor located lobe Multiple vs. single 1.443
(0.851–2.448)0.173 1.211
(0.801–1.829)0.364 pATM expression High vs. low 2.744
(1.598–4.713)< 0.001 1.873
(1.239–2.833)0.003 0.987
(0.464–2.100)0.974 1.459
(0.903–2.355)0.123 VM formation Present vs. absent 4.155
(2.419–7.138)< 0.001 2.013
(1.330–3.047)0.001 3.309
(1.564–7.002)0.002 1.281
(0.783–2.096)0.324 Note. HR, Hazard–ratio; CI, Confidence intervals; VM: vasculogenic mimicry; pATM: phosphorylate ataxia–telangiectasia mutated; PFS, progression–free survival; OS, overall survival; GBM, glioblastoma. Table 3. Univariate and multivariate Cox proportional hazards regression analysis of factors predictive of PFS and OS in GBM patients
Subsequently, we determined the IHC scores for pATM staining in GBM sections with and without VM. The results showed that VM-positive specimens exhibited higher pATM scores than VM-negative specimens (P < 0.001), and VM formation was positively correlated with pATM expression level, as analyzed by Spearman correlation assay (rs = 0.425, P = 0.01) (Figure 1E).
-
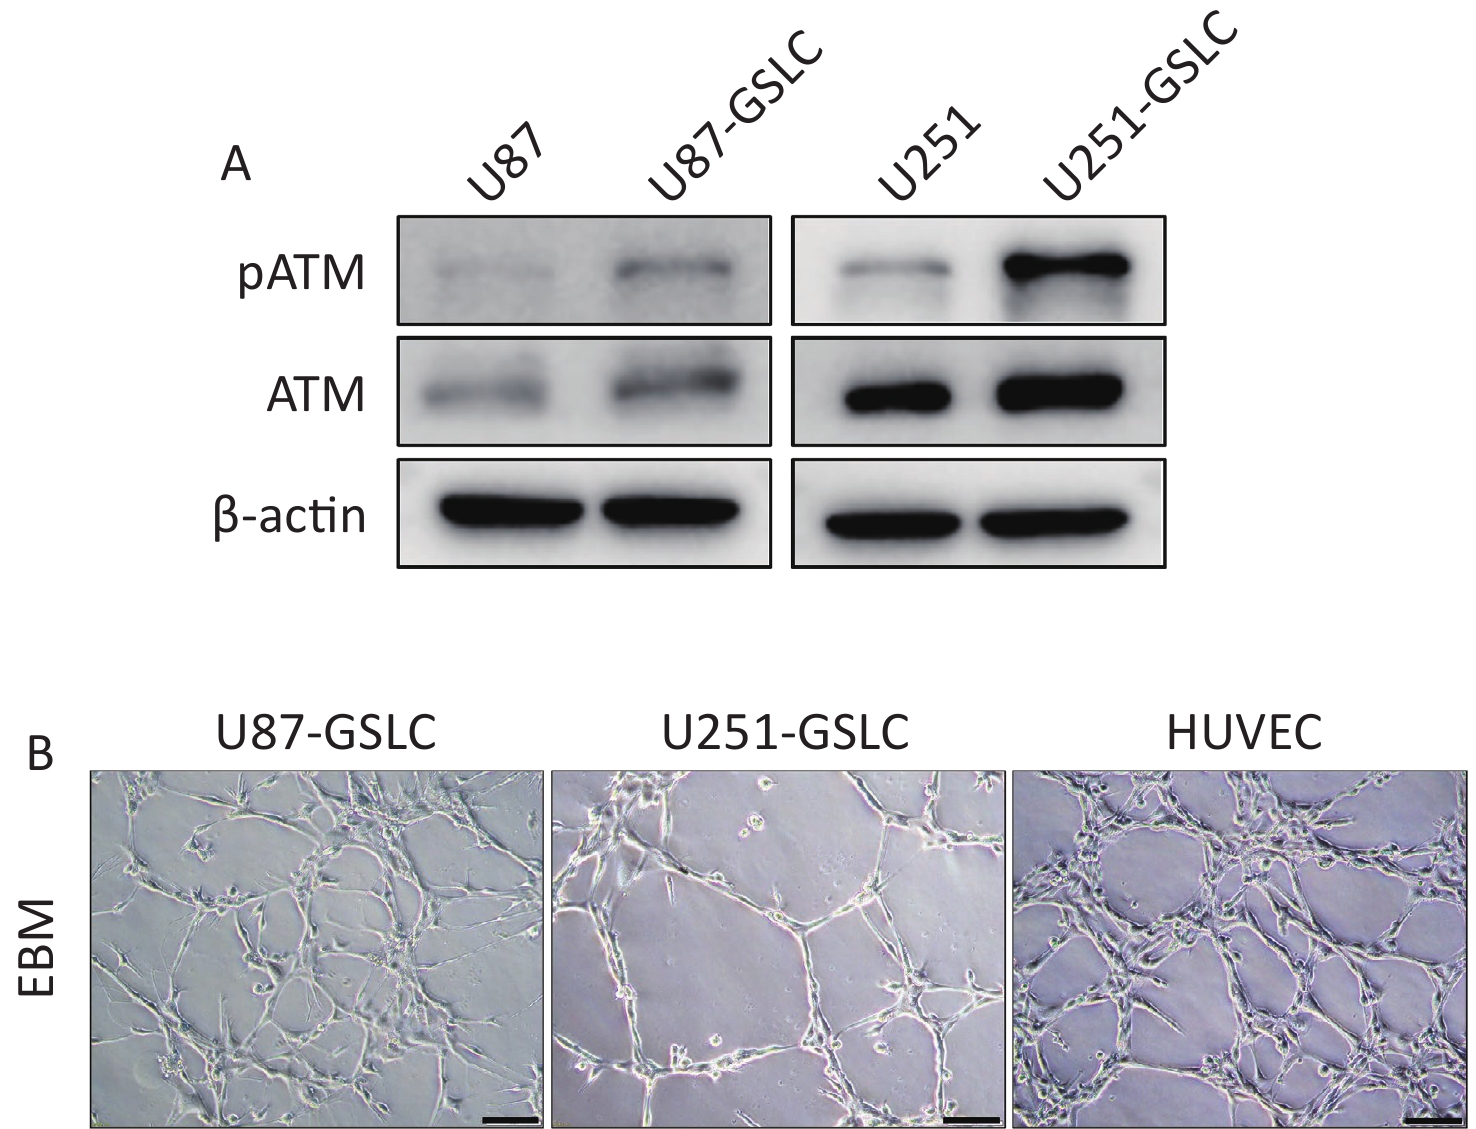
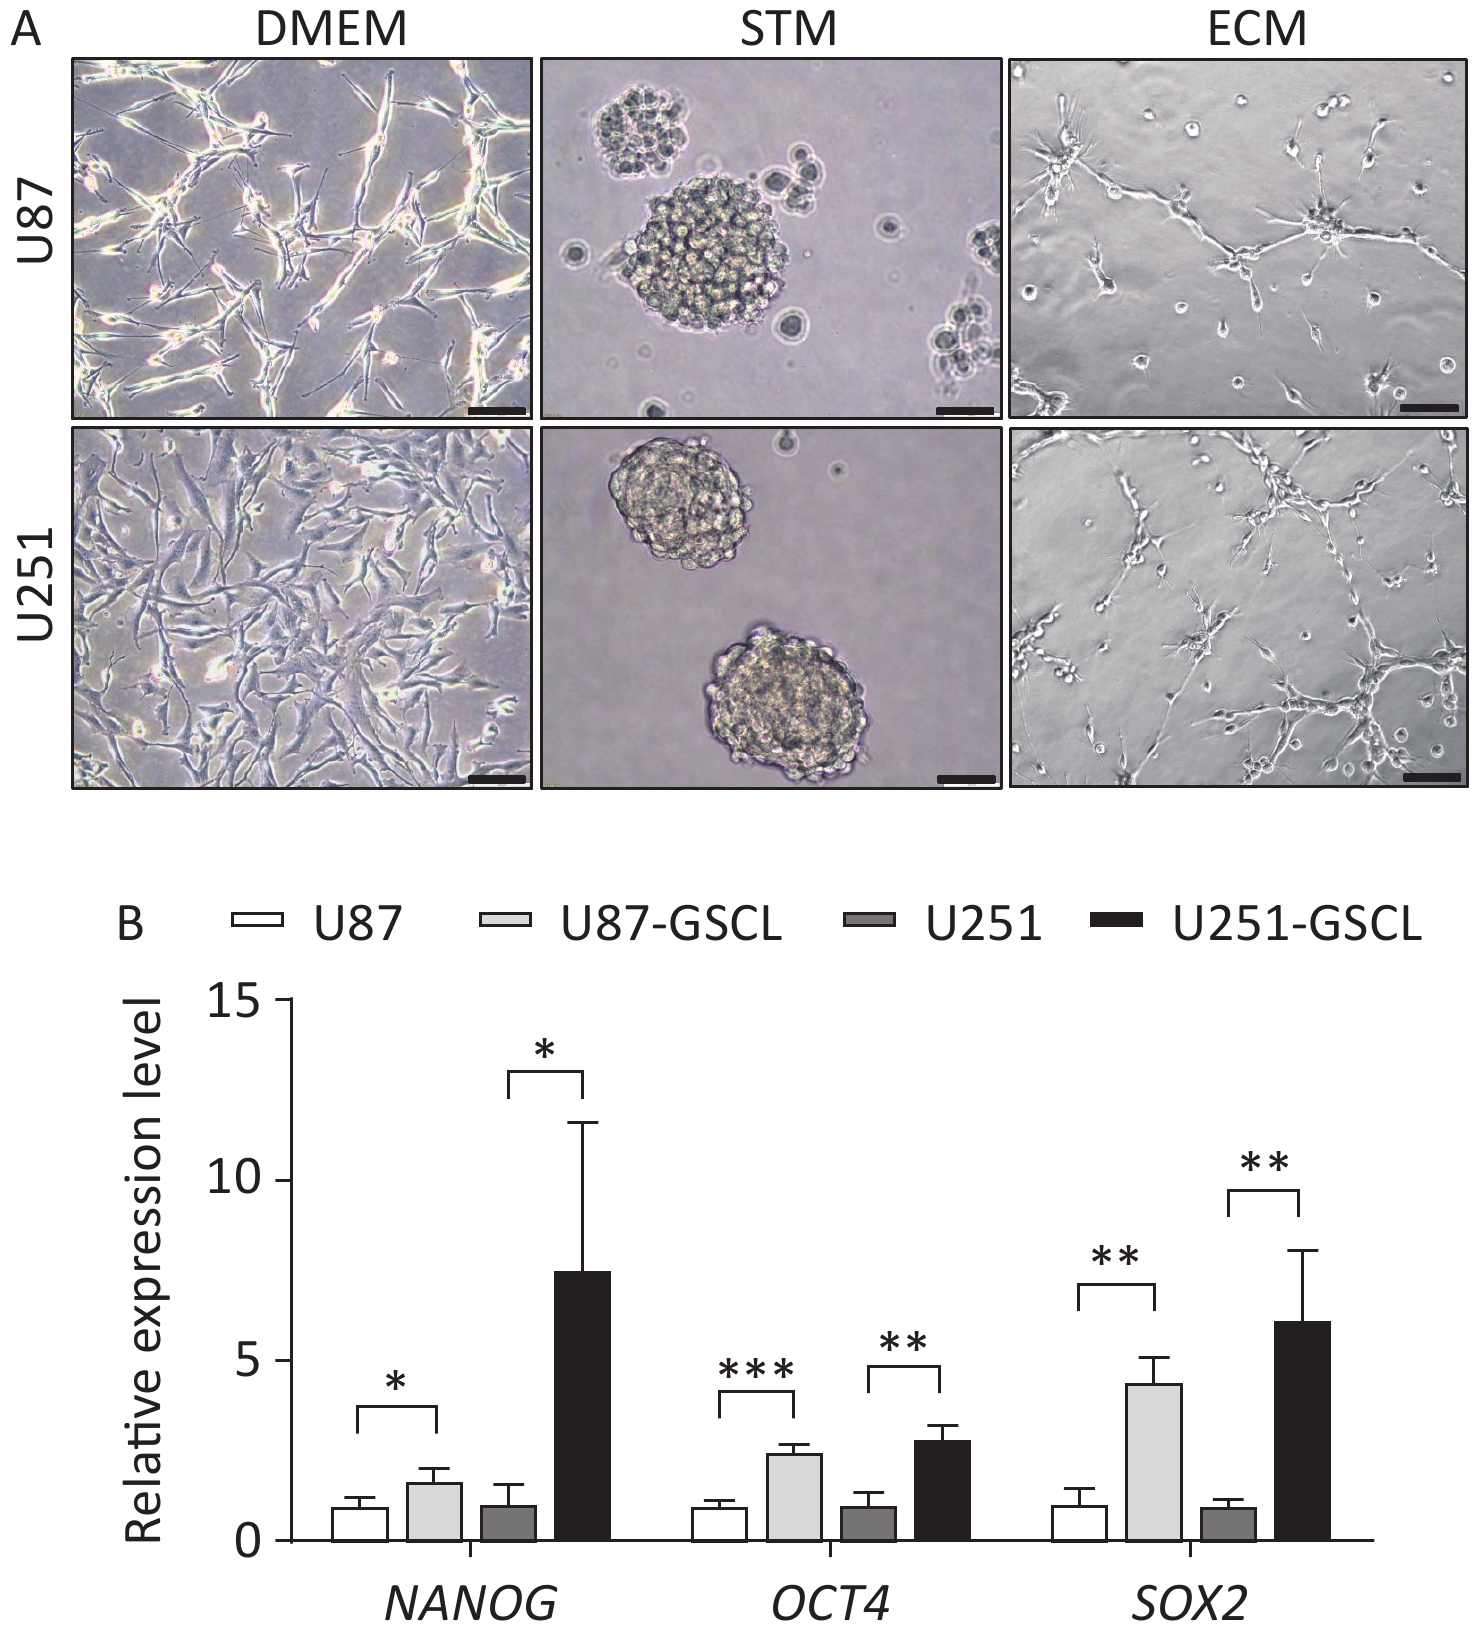
To further investigate the function of pATM in VM, GSLCs derived from the U87 and U251 parental cell lines were cultured in serum-free STM. After a few days of cultivation in the STM, U87 and U251 cells transformed from their inherent adherent morphology to spherical cell clusters characterized by a visible dark core under a light microscope (Supplementary Figure S3A, available in www.besjournal.com). To assess the acquisition of stemness, qRT-PCR was used to detect the expression of stemness markers, including NANOG, OCT4, and SOX2, in cell spheres. The results revealed that U87- and U251-derived spheres expressed higher levels of stemness-associated genes than the parental cells (Supplementary Figure S3B, available in www.besjournal.com), which demonstrated that these cells were good GSLCs. Furthermore, GSLCs exhibited elevated levels of pATM protein as detected by western blotting (Figure 2A).
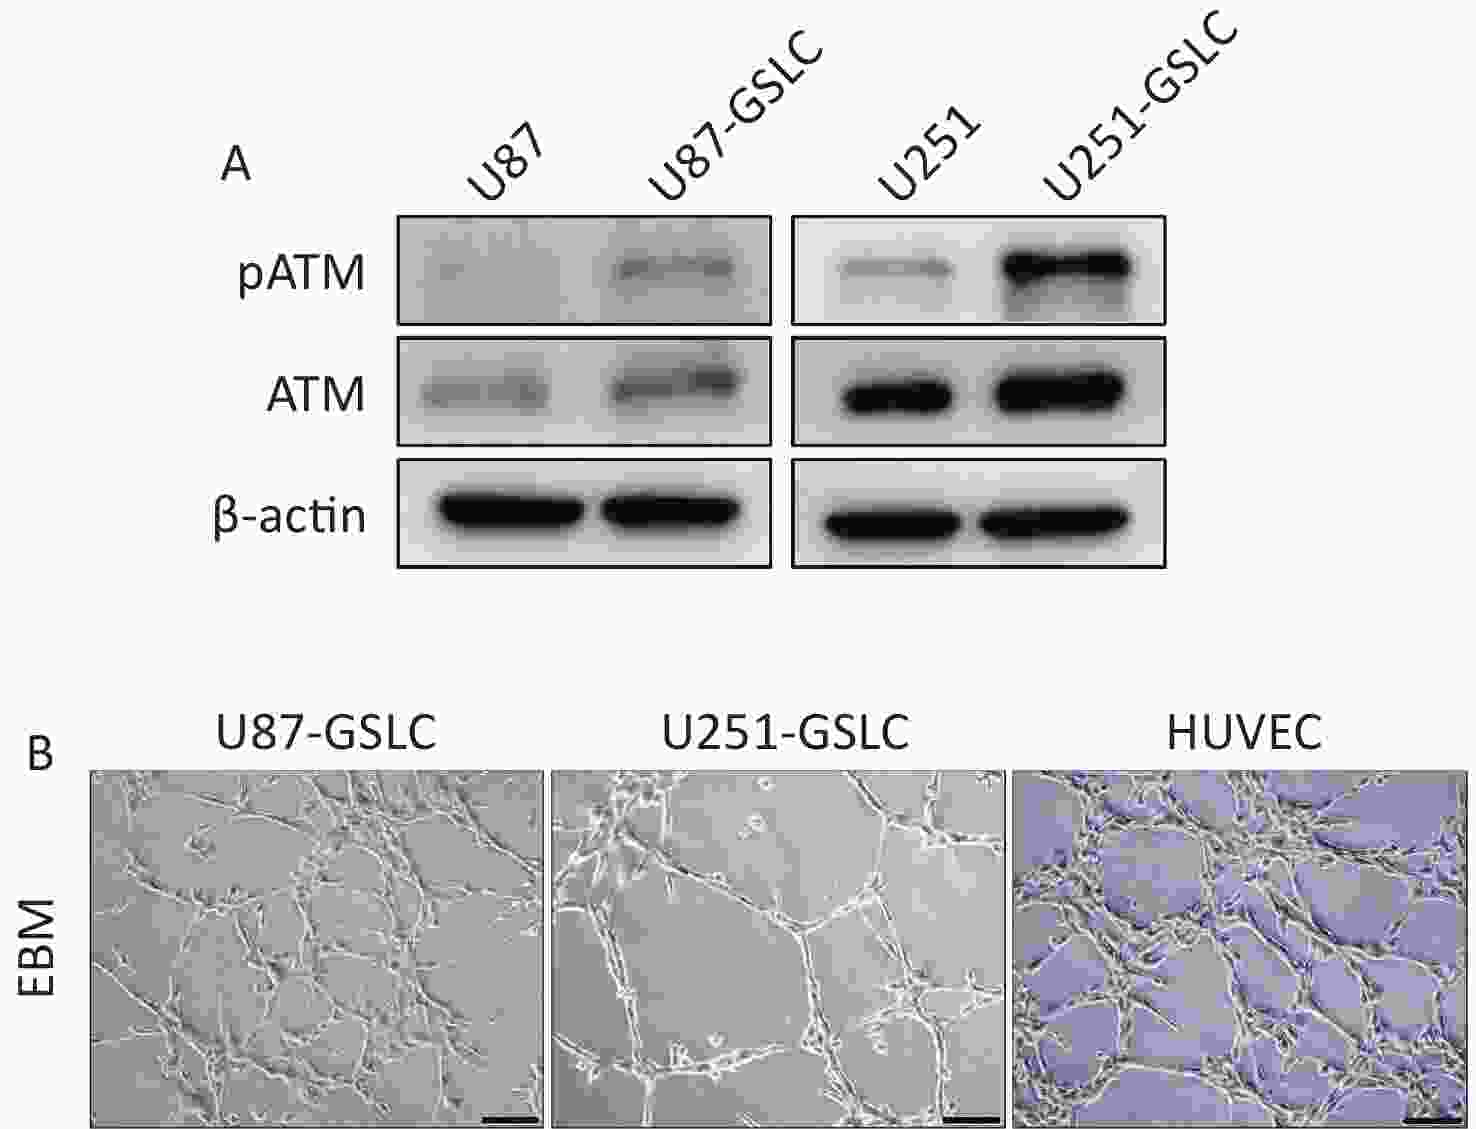
Figure 2. GSLCs derived from GBM cell lines expressed higher level of pATM compared to parental cells. (A) Western blot showing increased pATM and ATM protein levels in GSLCs compared to that in parental GBM cells. (B) Representative images of tube formation assay showing GSLCs and HUVEC forming irregular microvascular networks when cocultured on Matrigel matrix in ECM (200× magnification, scale bar = 100 μm). GSLC: glioma stem-like cell; GBM: glioblastoma; ATM: ataxia-telangiectasia mutated; HUVEC: human umbilical vein endothelial cells; ECM: endothelial cell medium.
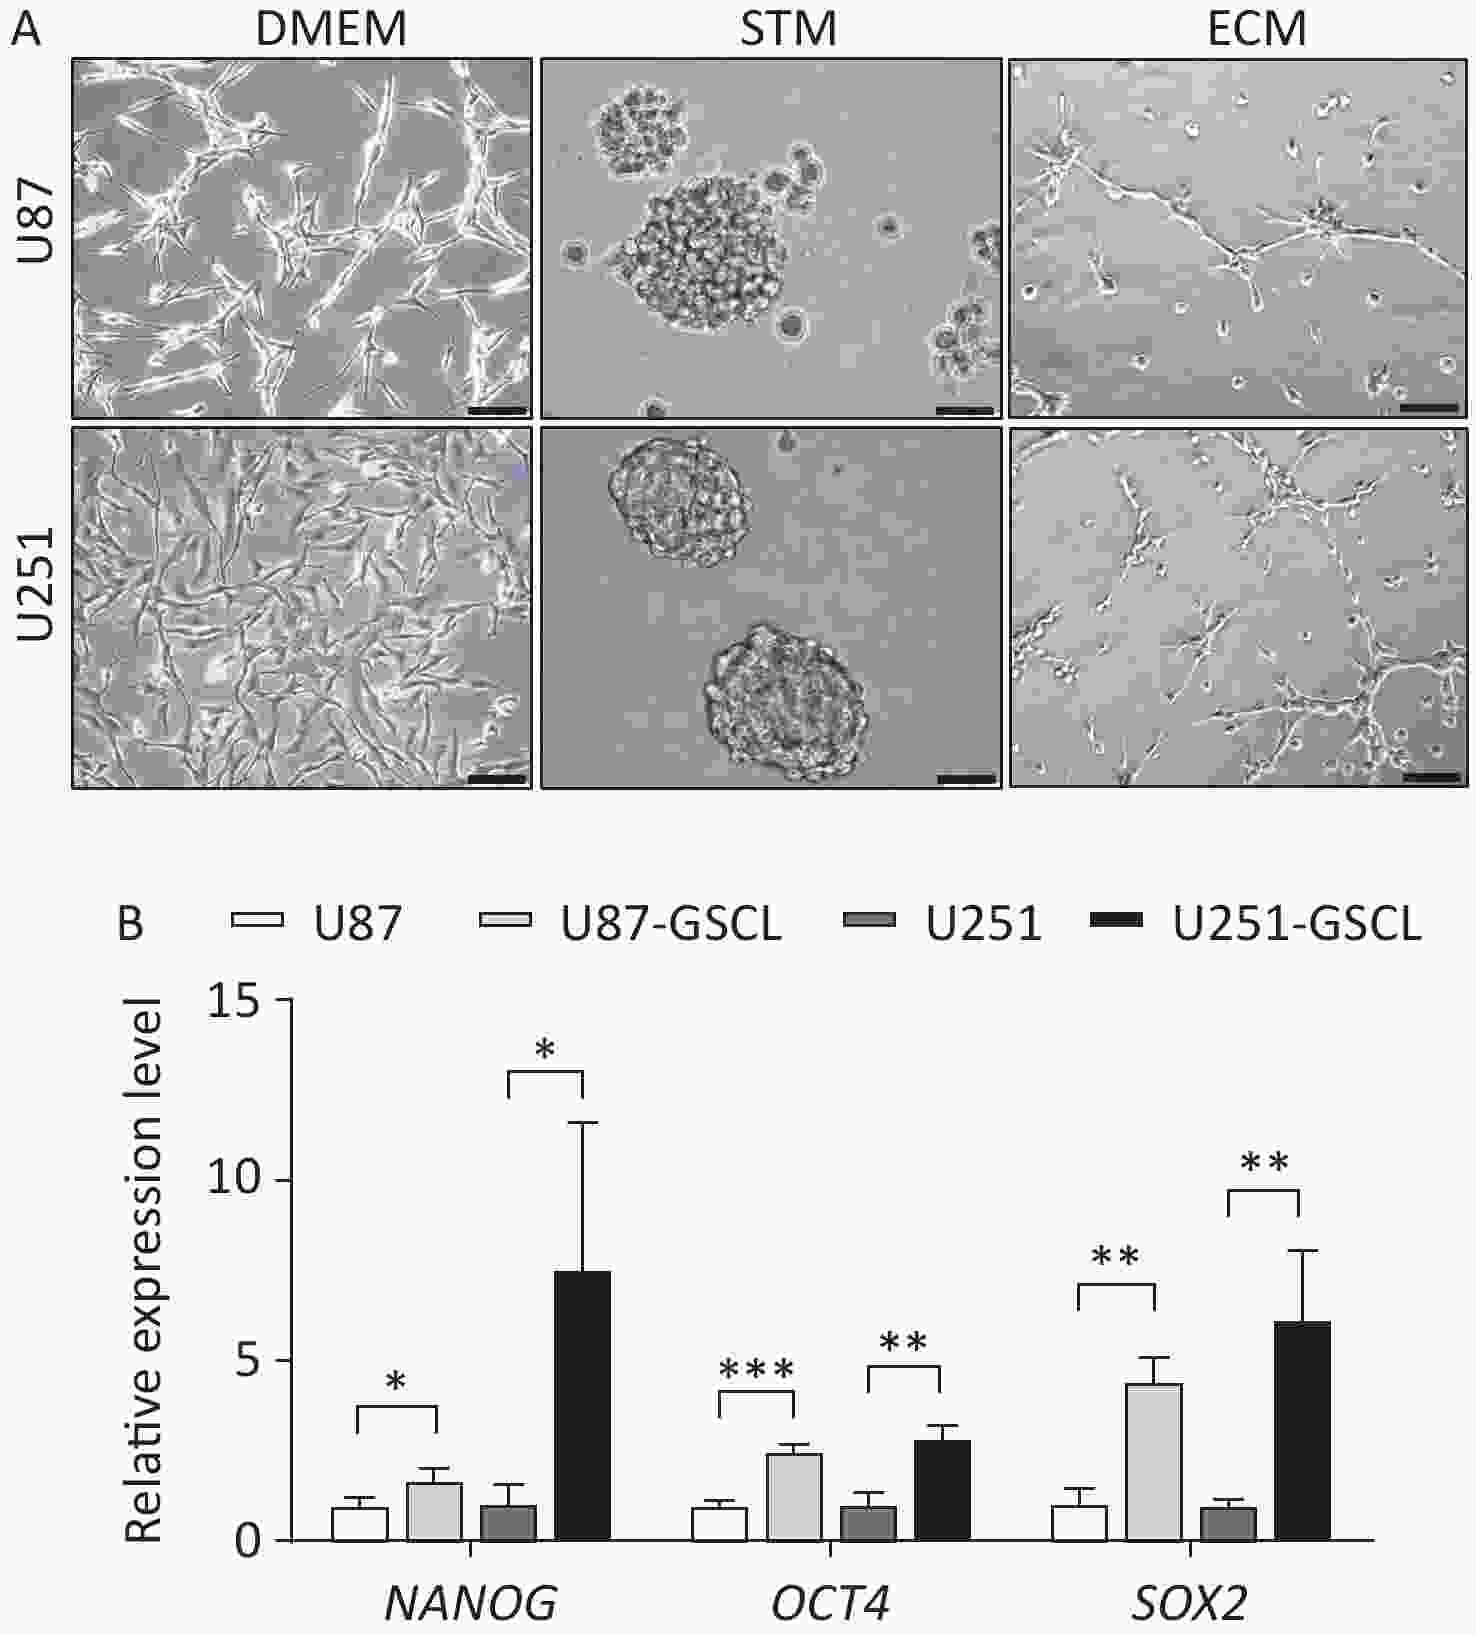
Figure S3. Characterization of parental U87 and U251 glioblastoma (GBM) cell lines cultured in Dulbecco’s Modified Eagle’s Medium (DMEM), stem cell medium (STM) (representing glioma stem-like cells (GSLCs) verified by qRT-PCR analysis showing enhanced expression of stemness markers), and endothelial cell medium (ECM) respectively. (A) Representative phase contrast images showing parental U87 and U251 GBM cell lines cultured in DMEM (left, 200× magnification, scale bar = 100 μm) compared to U87- and U251-derived GSLCs grown as suspended spheroids in STM (middle) (400× magnification, scale bar = 50 μm) and parental U87 and U251 GBM cell lines cultured in ECM on Matrigel (right, 200× magnification, scale bar = 100 μm). (B) GSLCs derived from GBM cell lines showed increased expression of NANOG, OCT4 and SOX2 compared to parental cells.
Single-cell suspensions of GSLCs were seeded onto Matrigel-coated wells cultured in ECM to mimic three dimensional structures and observe VM formation. Within 6 h, both the U87- and U251-GSLCs initiated the formation of preliminary tube-like structures. After seeding for 12–18 h, an intricate network comprising irregular microvascular channels became evident (Figure 2B). Nevertheless, these structures gradually deteriorated over time. Parental U87 and U251 cells exhibited weaker tube-forming capacity when seeded in the ECM on Matrigel (Supplementary Figure S3A,available in www.besjournal.com).
-
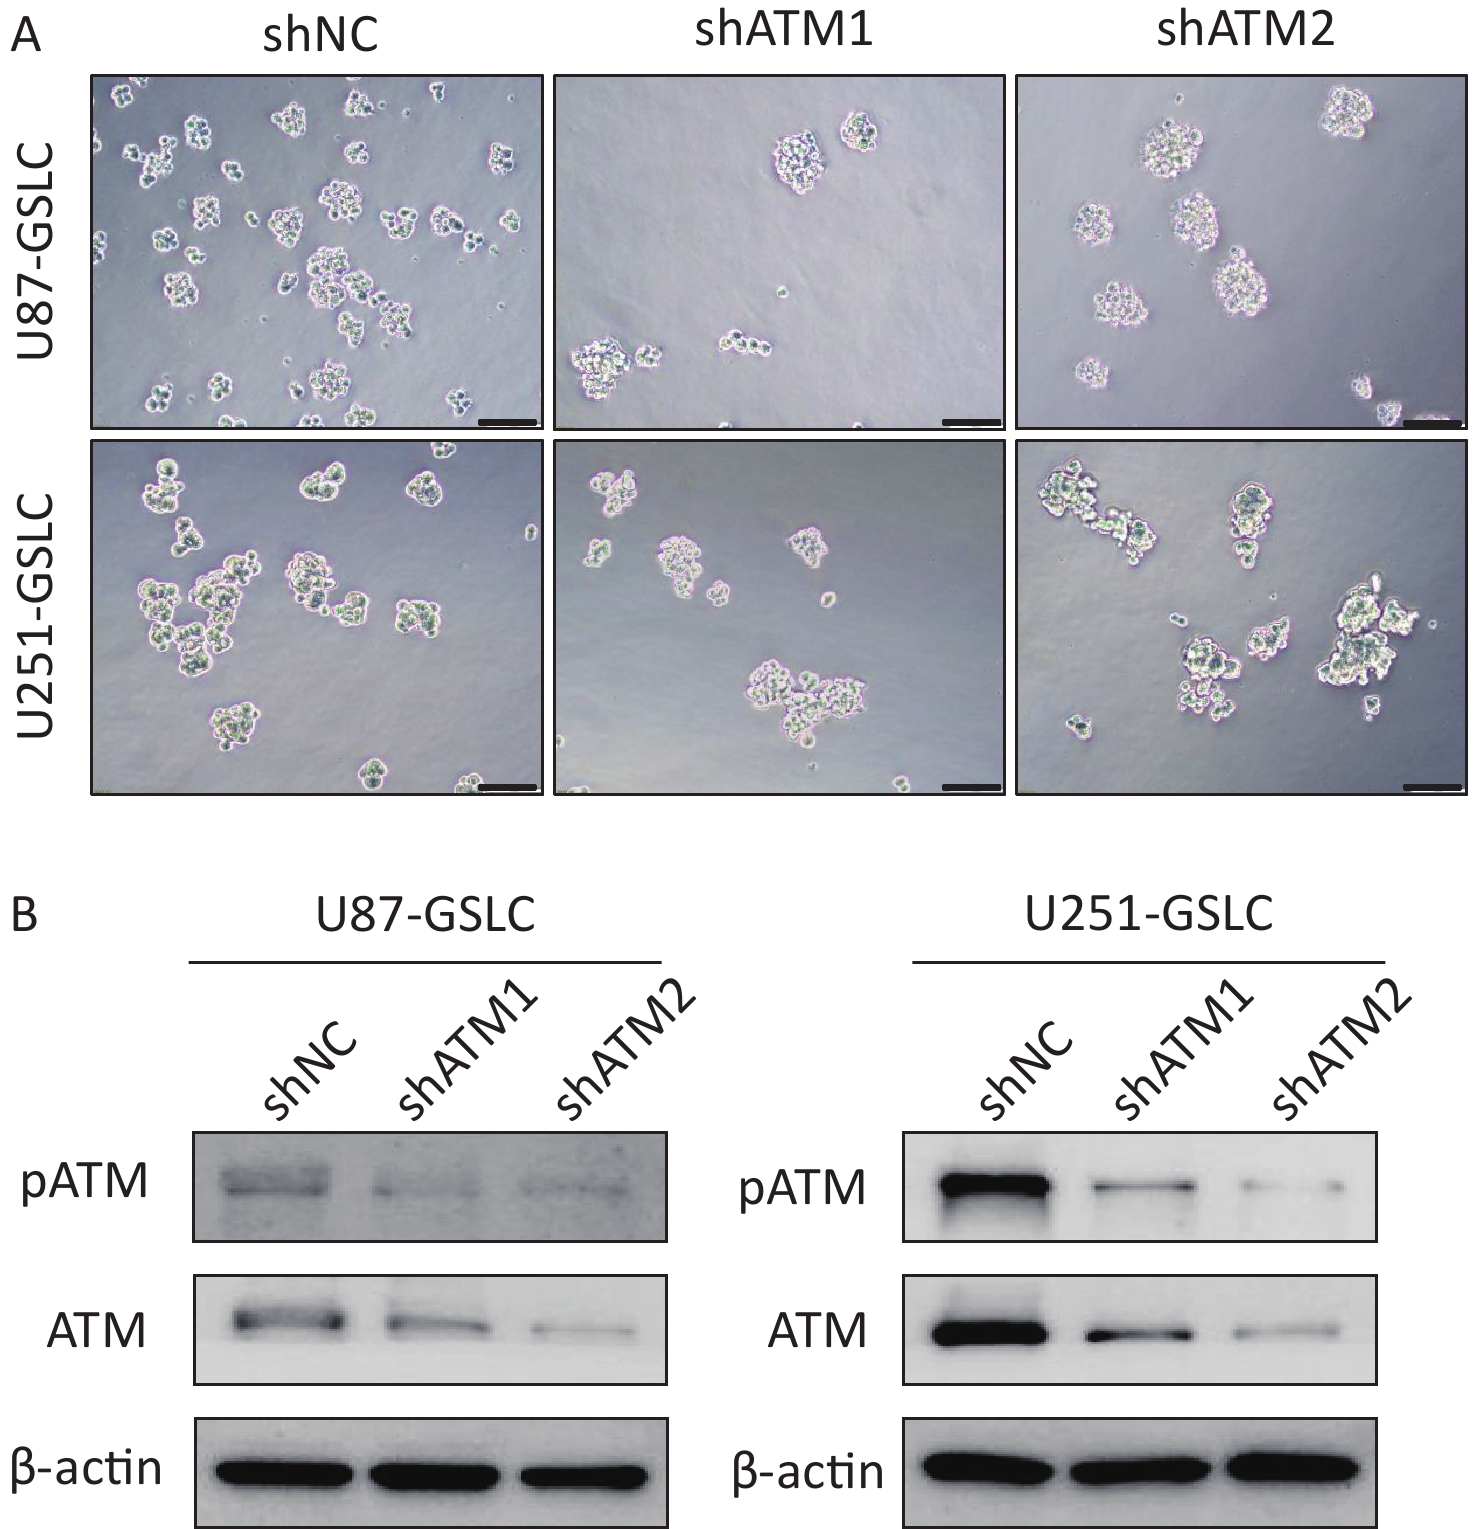
To explore the potential functional role of pATM in the VM-like network formation, KU55933, an inhibitor of ATM phosphorylation[18], was employed. An optimized concentration of 10 μmol/L of KU55933 was used for the following experiments, which showed no significant cytotoxicity by cell viability assay (Supplementary Figure S4, available in www.besjournal.com). Concurrently, ATM knockdown U87- and U251-GSLC stably transfected cell lines (U87-GSLC-shATM1, U87-GSLC-shATM2, U251-GSLC-shATM1, and U251-GSLC-shATM2) were constructed and derived using an shRNA lentiviral transfection system and puromycin selection. All cell lines exhibited almost the same spherical phenotype (Supplementary Figure S5A, available in www.besjournal.com), and ATM knockdown was confirmed by western blotting (Supplementary Figure S5B , available in www.besjournal.com). As shown in Figure 3, both inhibition of ATM activation (Figure 3A–B) and knockdown of ATM expression (Figure 3C–D) significantly impaired the formation of tube-like structures. Upon seeding ATM-deactivated or-knocked down GSLCs on the Matrigel matrix, a distinct lack of a well-defined network structure was observed. Most of these cells exhibited a shrunken morphology and failed to extend, merge, or interlace into cohesive networks (Figure 3A and C).
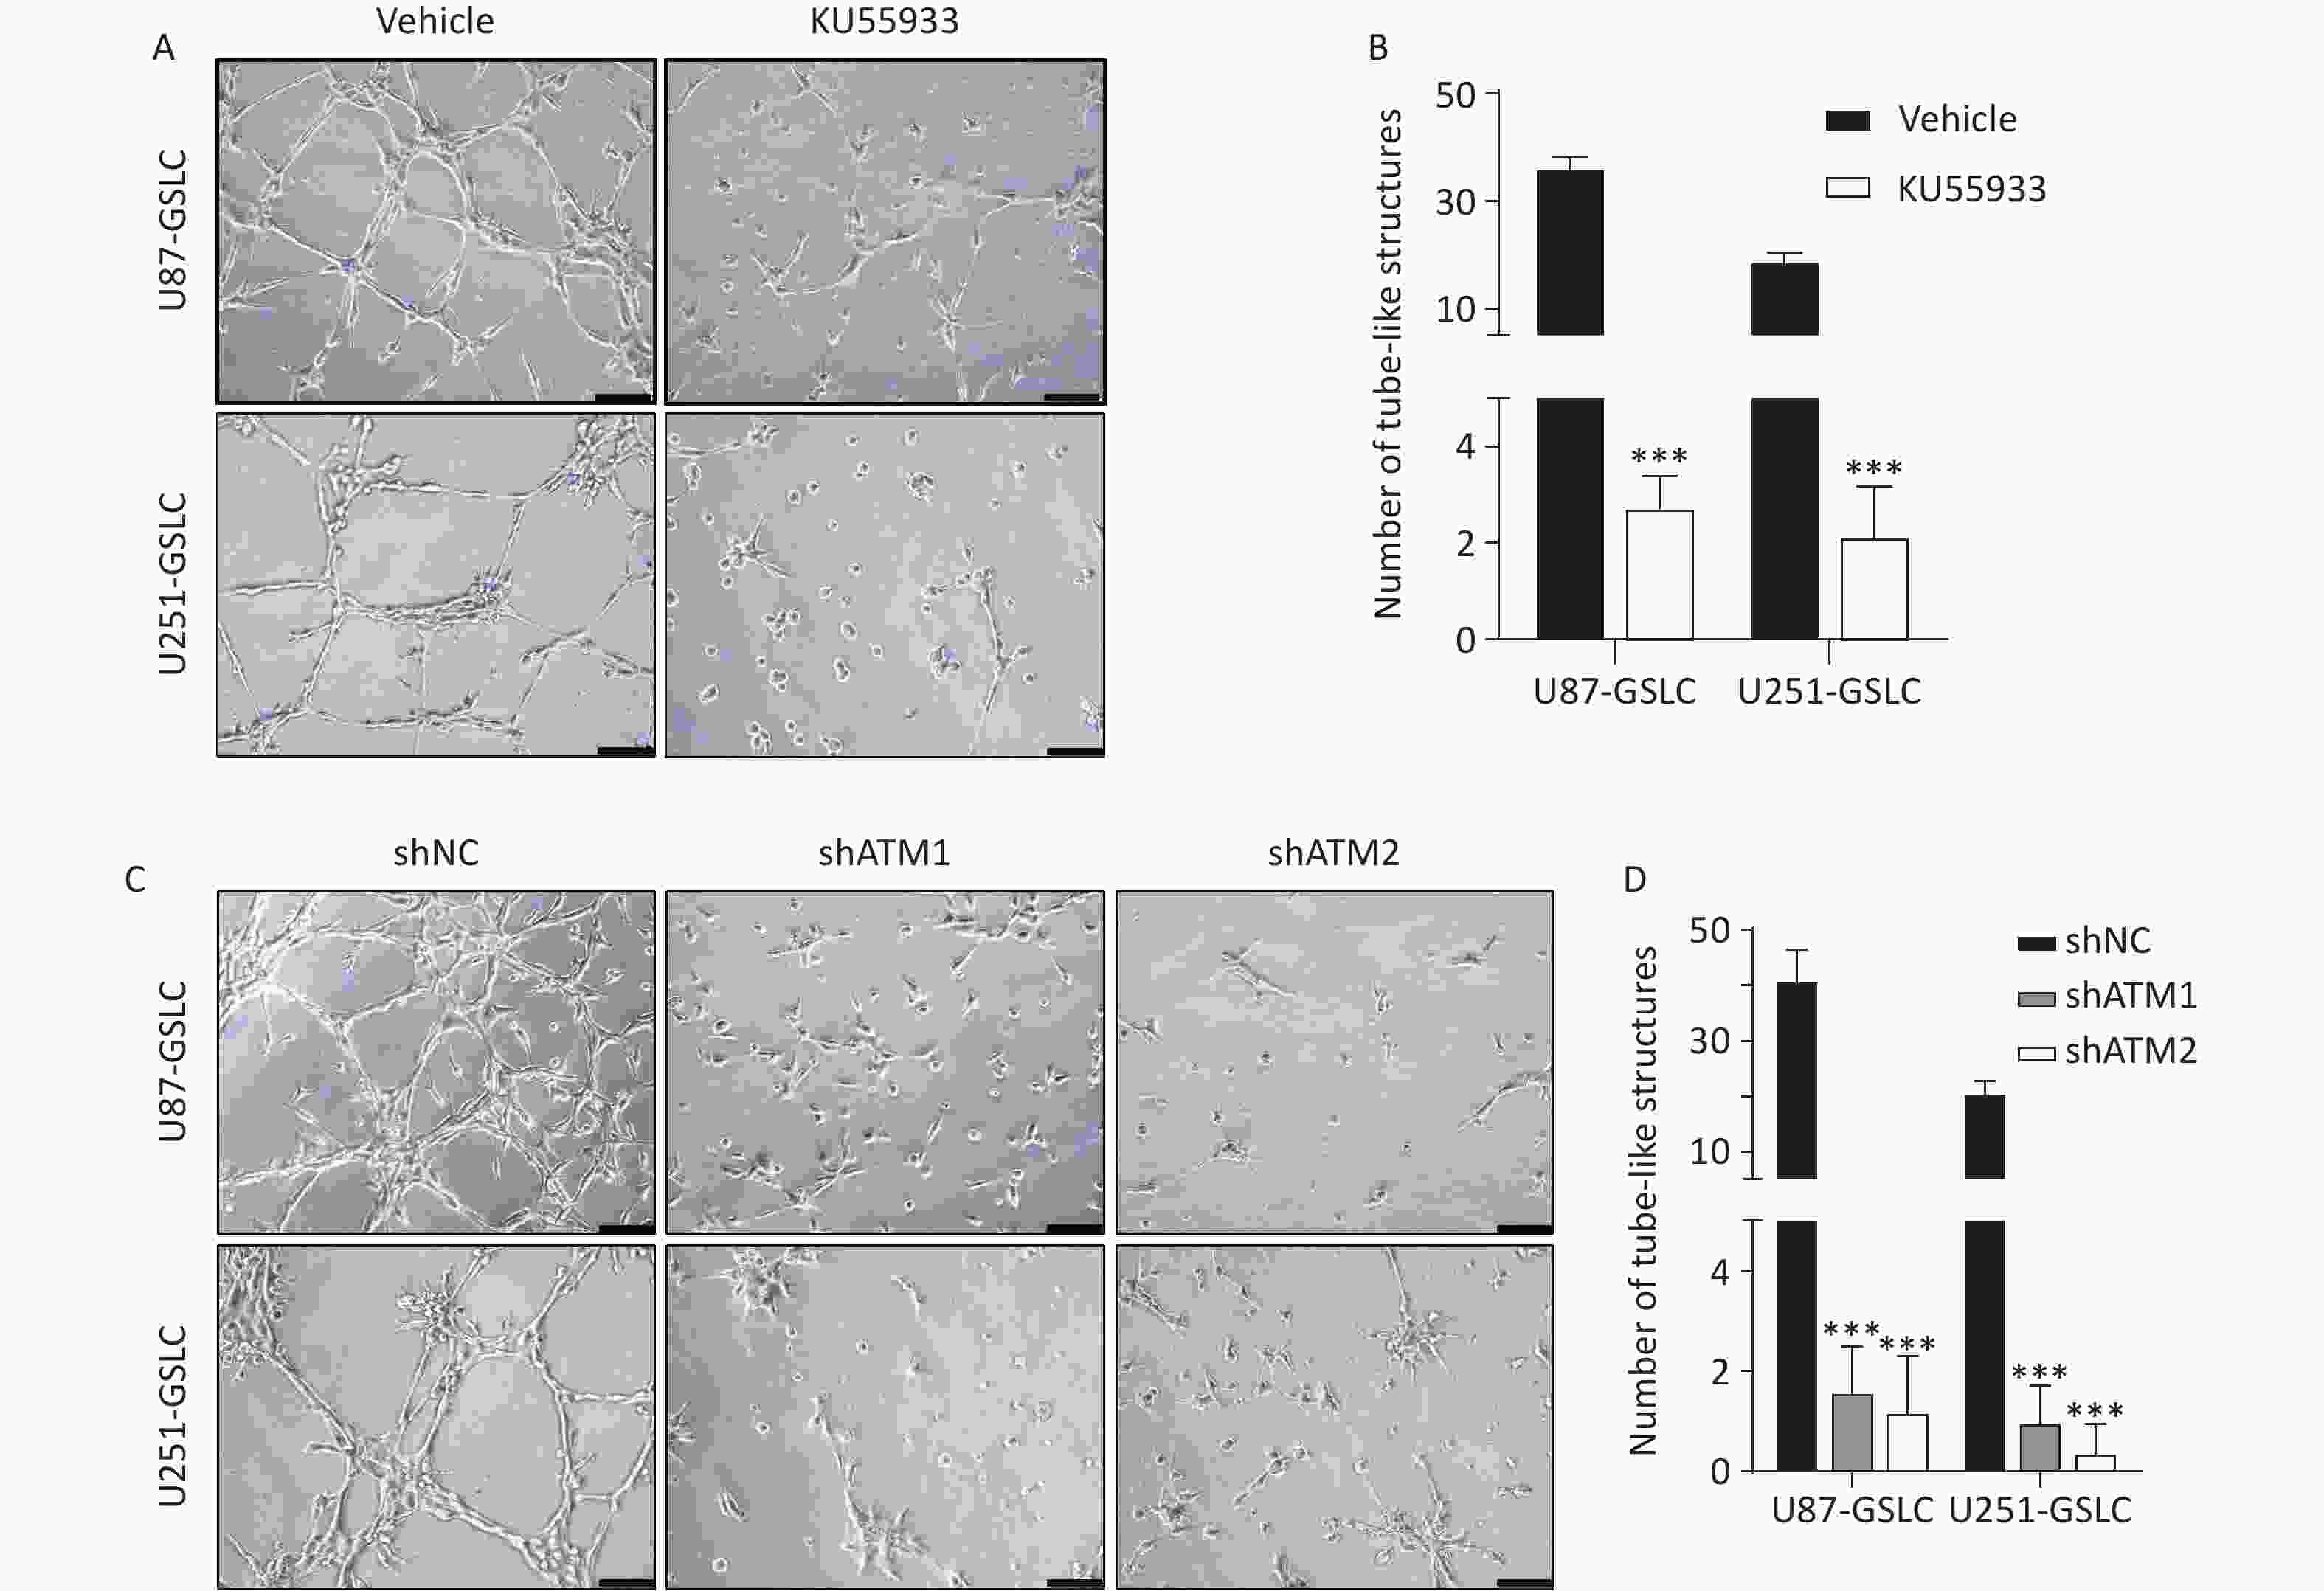
Figure 3. Inhibiting ATM activation or knocking-down ATM expression in GSLCs disrupted VM formation in vitro. (A, C) Representative images of tube formation assays showing an impaired VM network formation by GSLCs treated with the ATM phosphorylation inhibitor KU55933 (A) or ATM shRNA knockdown (C) compared to vehicle and control shRNA groups, respectively (200× magnification, scale bar = 100 μm). (B, D) Quantitative analysis of the number of tubules structures formed in formation assays. Treatment with KU55933 (B) or ATM knockdown (D) significantly reduced the number of tubules formed compared to controls. Data presented as mean ± standard error (n = 5). ***P < 0.001. ATM: ataxia-telangiectasia mutated; GSLC: glioma stem-like cell; VM: vasculogenic mimicry.
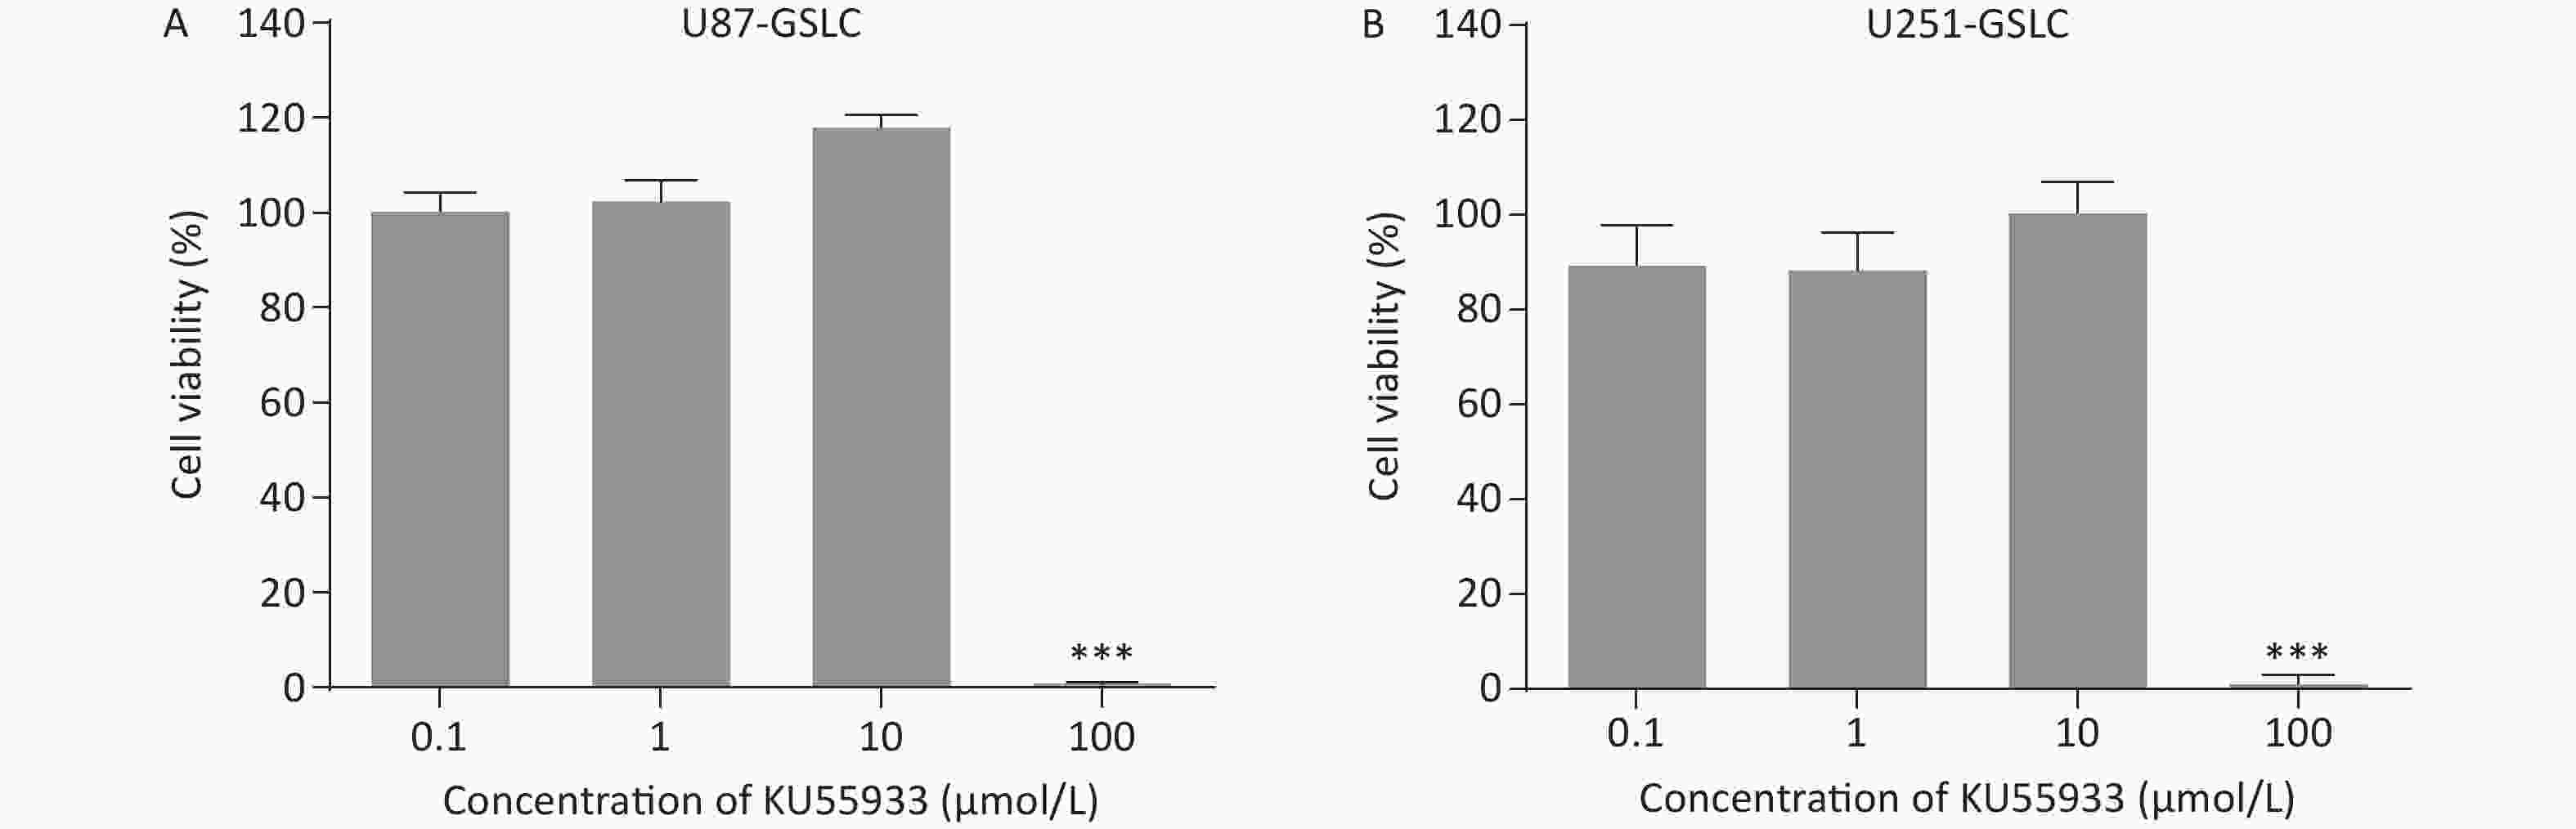
Figure S4. Cell viability of glioma stem-like cells (GSLCs) treated with phosphorylated ataxia-telangiectasia mutated (pATM) inhibitor KU55933. (A–B) Cell viability assay of U87- (A) and U251- (B) GSLCs treated with varying KU55933 concentrations. We found that 10 μmol/L was optimal with no significant cytotoxicity. ***P < 0.001.
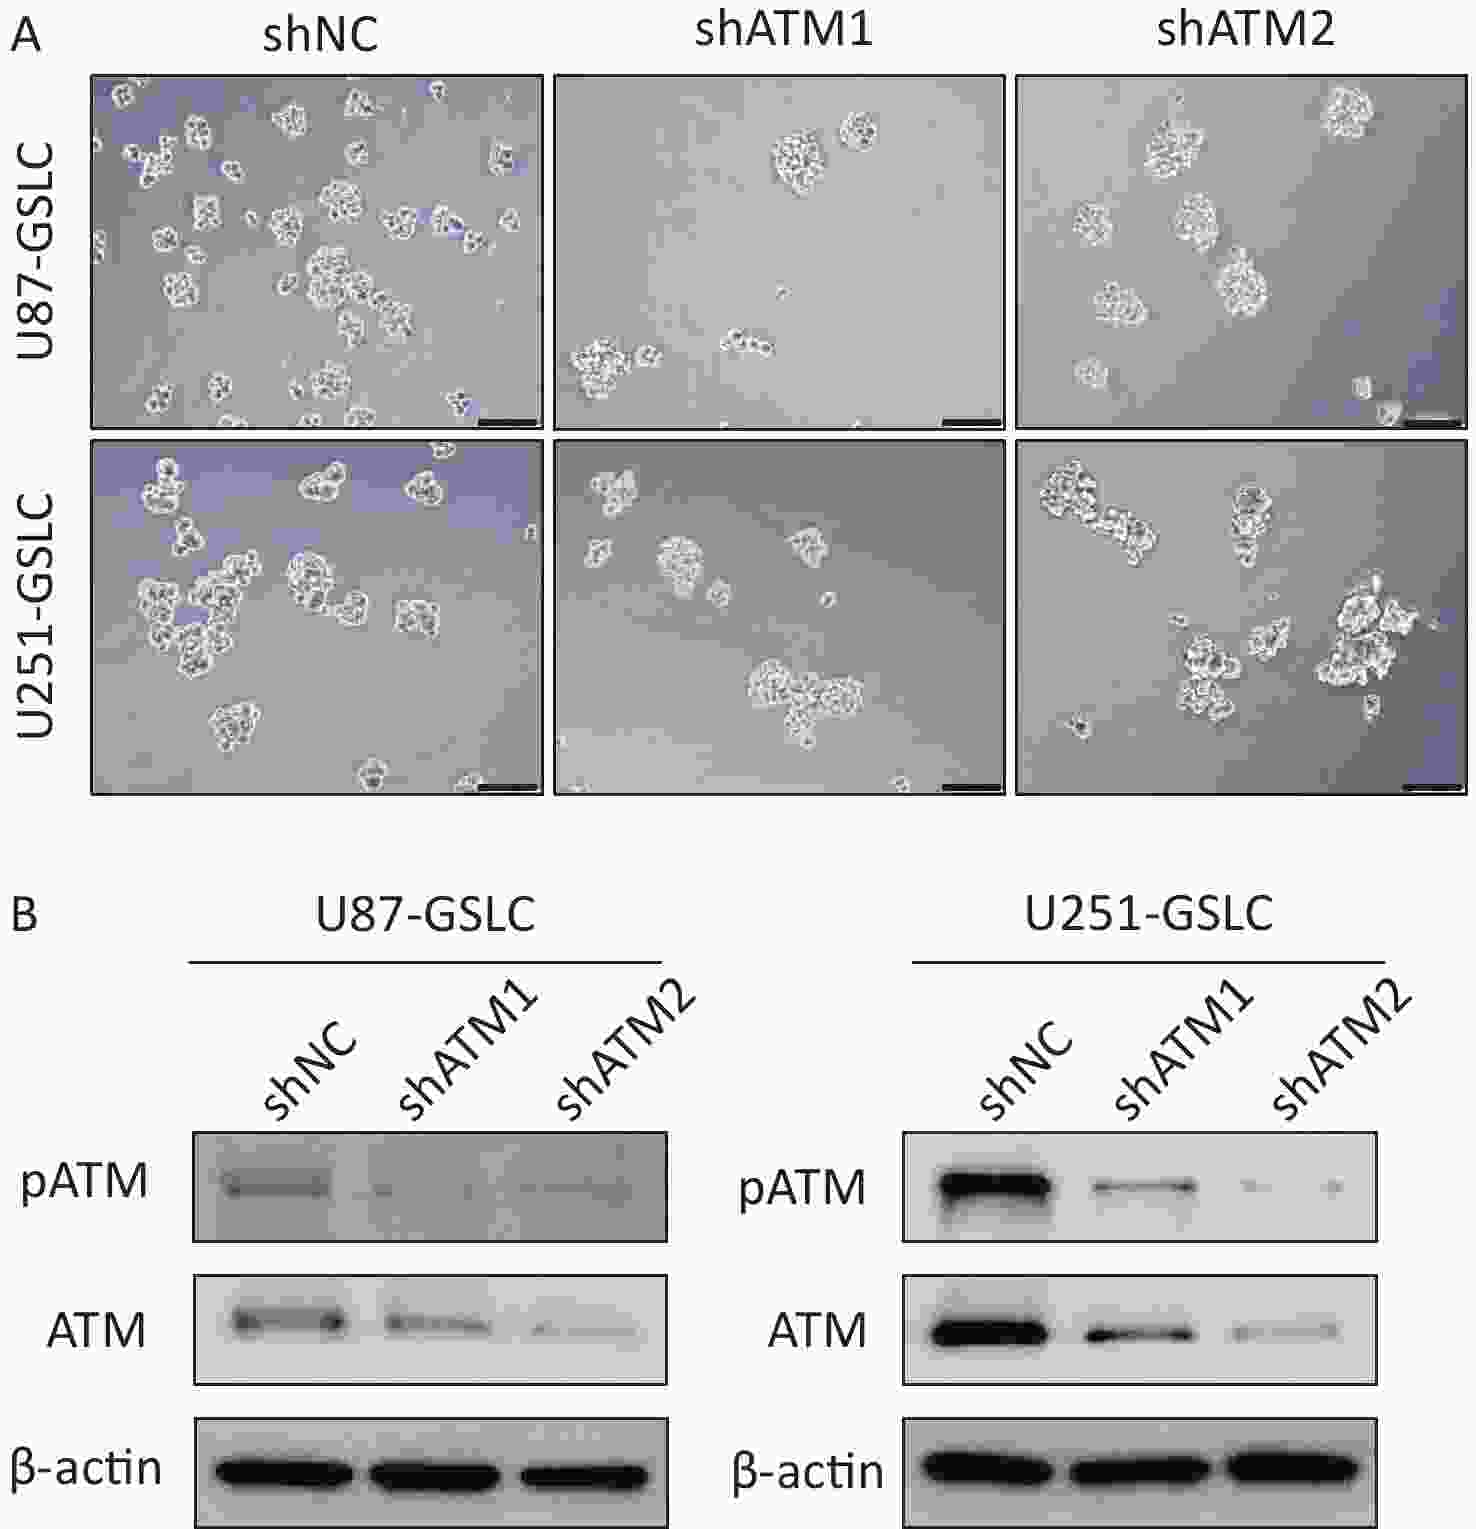
Figure S5. Characterization of glioma stem-like cells (GSLCs) with stable ataxia-telangiectasia mutated (ATM) knockdown. (A) Representative images of U87- (above) and U251- (below) GSLCs stably expressing non-targeting control shRNA (shNT) or ATM-targeting shRNA (shATM) (100× magnification, scale bar = 200 μm). (B) Western blot showing efficient ATM knockdown in shATM GSLCs compared to shNT controls.
-
To further investigate the mechanism by which pATM influences VM-like network formation, RNA-seq analysis was conducted on GSLCs and compared with those in which ATM was knocked down in a control group. The comparative analysis yielded 615 overlapping differentially expressed genes (DEGs) between the two groups. Profiling the functions of these 615 DEGs revealed enrichment in various biological processes related to VM, including cytokine-cytokine receptor interactions, cell adhesion molecules (CAMs), the IL-17 signaling pathway, and the TNF signaling pathway (Figure 4A). Gene Ontology (GO) function classification indicated involvement in processes such as the regulation of signaling receptor activity, cell-cell adhesion, and inflammatory response, and other recognized VM-associated functions such as angiogenesis, extracellular matrix (ECM) organization, and reactive oxygen species (ROS) metabolic processes (Figure 4B).

Figure 4. pATM-regulated VM formation by GSLCs through altering phenotypic characteristics. (A, B) Bar plot (A) and bubble graph (B) showing top KEGG pathways and GO biological processes, respectively, among DEGs between control and ATM-inhibited GSLCs. In (A), the X-axis represents the -log10 (P value), and the colors of the bars indicate the count of enriched genes. In (B), the X-axis represents the gene ratio, the colors of the bubbles correspond to the P value, and the size of the bubbles is proportional to the gene count. (C-D) Western blot showing decreased expression of VM-associated proteins p-VEGFR-2, VE-Cadherin, and lamininB2 in GSLCs treated with the ATM phosphorylation inhibitor KU55933 (C) or ATM knockdown by shRNA (D) compared to controls. ATM: ataxia-telangiectasia mutated; GSLC: glioma stem-like cell; VM: vasculogenic mimicry; GO: gene ontology; KEGG: Kyoto encyclopedia of genes and genomes; DEG: differentially expressed genes.
Based on the results of the RNA-seq analysis and in accordance with our previous research[16], we detected the expression levels of VM-related proteins, including pVEGFR-2, VE-Cadherin, and lamininB2 using western-blot analysis. There was a notable reduction in the expression of these proteins after ATM activation was inhibited by KU55933 (Figure 4C) or ATM downregulation by shRNA (Figure 4D) in GSLCs cultured in ECM for VM formation. This corroborates the notion that activated ATM plays a role in the regulation of VM by inducing a transformation in the phenotype and characteristics of GSLCs. This transformation enables the acquisition of EC-like functions and facilitates microenvironmental adjustments through ECM remodeling, which is pivotal for the establishment of vascular-like structures.
-
In GBM, tumor expansion is intricately linked to the vascular support provided by various neovascularization processes, including co-option, angiogenesis, vasculogenesis, VM, and transdifferentiation[31]. These complex processes collectively contribute to the challenges posed by AAT. Among these processes, VM, a distinct de novo vasculature formation mechanism, has garnered significant attention owing to its implications in prognosis, therapeutic response, and enigmatic formation. In contrast to angiogenesis and vasculogenesis, VM involves the development of patterned vasculogenic-like networks comprising aggressive tumor cells that exhibit a multipotent and stem cell-like phenotype. These networks mimic the characteristics of ECs but operate independently. Notably, they are rich in ECM and originate from the existing cerebral vasculature, providing an alternate perfusion pathway for oxygen and nutrient supply[7,32]. VM relies on two major elements: tumor cell plasticity and the tumor microenvironment niche. VM is orchestrated by a range of biological processes and signaling pathways, including cancer stemness, hypoxia, EMT, angiogenic signaling, matrix metalloproteinases, cell adhesion, metabolism, autophagy, and the activation of oncogenic molecules. These factors result in enhanced tumor metastasis, increased invasion, accelerated progression, and ultimately diminished survival rate[33]. Consistent with previous studies, we confirmed a positive relationship between VM and unfavorable outcomes in patients with GBM. This substantiates VM as a viable prognostic indicator of shorter survival periods. Consequently, when assessing the severity of GBM, particular consideration should be given to the presence of VM. This becomes especially crucial when considering the administration of AAT to circumvent potential drug resistance[13].
As a pivotal molecule in the DDR, ATM has garnered increasing recognition for its significant role in both tumor progression and therapy resistance. ATM inhibition has the potential to induce radiosensitization and increase the responsiveness of tumors to chemotherapeutic agents[22, 34-36]. In GBM, the ATM signaling pathway has been identified as a promoting factor of tumorigenesis[37]. To further elucidate the multifaceted contributions of ATM, we employed immunohistochemical methods on GBM specimens and found a noteworthy correlation between elevated pATM expression and reduced PFS and OS (Figure 1D). This finding implies that patients exhibiting elevated pATM levels face an elevated risk of tumor recurrence and mortality, even with regular chemoradiotherapy regimens. The activation of ATM potentially plays a significant role in mediating resistance to chemoradiotherapy by enhancing the DDR capacity in specific tumor cells, leading to poor therapeutic outcomes in GBM patients. Furthermore, a high level of pATM is particularly prevalent in cases of GBM characterized by VM formation (Figure 1E). This observation raises the intriguing possibility that ATM activation exerts an additional influence on VM and thus promotes the overall progression of this disease.
In this study, we observed that parental GBM cell lines exhibited the ability to form neurospheres in suspension when cultured in STM medium (Supplementary Figure S3A). This characteristic feature, akin to that of stem cells, was accompanied by notable upregulation of mRNA levels associated with stemness (Supplementary Figure S3B). Additionally, upon seeding these cells in a three-dimensional culture, the GSLC entities demonstrated the capacity to generate vessel-like structures (Figure 2B). These structures recapitulate VM and substantiate the indispensable role of GSLCs in VM initiation. When cultured on Matrigel, both inhibition of ATM activation and reduction in pATM expression resulted in discernible attenuation of capillary-like tube formation by GSLCs (Figure 3). This observation suggests that activated ATM is involved in VM. Notably, ATM has been implicated in maintaining genomic stability within stem cells, and its deficiency has been shown to impede neural stem cell proliferation[38,39]. CSCs are involved in VM in malignant tumors, including breast cancer and hepatocellular carcinoma[40,41]. In GBM, chemoradiotherapy resistance is partially due to the ATM-mediated enhancement of DDR in GSCs[26,42]. Moreover, VM formation bears a resemblance to embryonic angiogenesis. GSCs, which actively participate in VM, are suggested to be crucial for this process because of their pluripotent, embryonic-like phenotype, remarkable stem cell plasticity, and ability to differentiate into EC-like functions[43-45]. In light of these findings, we propose that pATM may exert a favorable influence on the VM by supporting the population and characteristics of GSLC that are capable of assuming an EC-like role. Consequently, this interaction provides a niche that fosters the survival and growth of GSLC, thereby expanding our understanding of the impact of activated ATM’s on GSCs in GBMs.
To further investigate the mechanism by which pATM influences VM, we conducted a comparative analysis of global gene expression profiles between the ATM-downregulated and control groups in GSLCs using RNA-seq analysis. Functional profiling of the overlapping DEGs suggested that the affected genes were enriched in significant biological processes related to VM formation, including cell-cell adhesion, angiogenesis, and ECM (Figure 4B). The ECM and CSCs have an interrelated and complementary role in fostering a tumor-supportive environment. In pancreatic ductal adenocarcinoma, CSCs are cultured in early-stage tumor ECM-activated growth programs dedicated to vascular niche preparation, with robust secretion of proangiogenic factors that promote VM and overexpression of VEGFR-2[46]. Hypoxic conditions enhance CSC stemness and differentiation potential through hypoxia-induced epithelial-endothelial transition and ECM remodeling, representing a specific mechanism underlying VM[47]. Tumor cells lining VM networks secrete matrix metalloproteinases and express VE-cadherin and laminin, stimulating ECM remodeling, and thereby facilitating VM development[41]. Moreover, in our previous study, we identified that autophagy promotes VM formation in GBM, leading to the upregulation of VM-related proteins such as pVEGFR-2, VE-cadherin, and lamininB2. Given the intimate association between ATM and autophagy, the former has the potential to trigger the latter[48], and consistent with the findings of our transcriptome analysis, we detected the expression of pVEGFR-2, VE-cadherin, and lamininB2 using western blot (Figure 4C–D). The results showed a significant downregulation of these proteins in GSLCs when seeded in ECM with suppressed or knocked-down ATM, as opposed to the control group. VEGFR-2, a high-affinity receptor for VEGF, plays a crucial role in inducing VM formation. It is not limited to ECs, but is also expressed by GBM cells, especially GSCs, to maintain stemness, thereby supporting GSC-mediated VM formation and positively regulating VE-Cadherin expression[49,50]. VE-cadherin is a transmembrane protein that is characteristically expressed in the endothelium and is responsible for cell-cell adhesion. However, aberrant expression in tumor cells is pivotal for stimulating VM[17,51]. pATM is believed to activate VEGFR-2 and VE-cadherin, which are preferentially expressed by CSCs, along with their downstream signaling cascades, thereby facilitating intercellular adhesion and chemotaxis for tubule formation. Additionally, laminins, heterotrimeric glycoproteins implicated in angiogenesis as integral components of endothelial basement membranes, contribute to the formation of the VM-patterned network. Laminins are present in the basement membranes lining the lumen-like structures enclosed by tumor cells in the external wall, thus serving as a bridge connecting the VM with CSCs[52,53]. It is plausible that pATM modulates the microenvironment by reshaping the ECM, which includes laminins, thereby establishing a conducive niche for CSC transformation.
-
VM, an important component of the intricate vasculogenic processes in GBM, remains a topic of intense debate, encompassing a multitude of intrinsic and facilitating factors that traverse various interconnected pathways. This multifaceted phenomenon is associated with increased mortality rates and requires further comprehensive elucidation. The present study sheds light on the contribution of activated ATM to VM and emphasizes the fundamental role of GSLCs. Moreover, this study suggests potential mechanisms of involvement linked to the VE-cadherin and VEGFR-2 signaling pathways. These findings provide valuable insights into the role of pATM in GBM and introduce novel perspectives for anti-VM strategies in conventional AAT, thereby potentially enhancing therapeutic outcomes in human GBM.
HTML
Tumor Specimens
pATM Immunohistochemical (IHC) Staining and Scoring
CD31/GFAP-periodic Acid-Schiff (PAS) Dual-staining and VM Detection
Cell Culture and Sphere Formation
Quantitative Real-time Polymerase Chain Reaction (qRT-PCR)
Cell Viability Assay
Three-dimensional Culture
Western Blot
Lentiviral Constructs and Infection
Human Genome-wide Expression Profiling and Bioinformatic Analyses
Ethical Statement
Statistical Analysis
VM Formation Correlated with pATM Expression and Predicted a Poor Clinical Outcome in GBM
GSLCs Highly Expressed pATM and Demonstrated the Capacity to Generate Vascular-like Tubules
Deactivation or Knockdown of ATM Disrupted VM-like Network Formation by GSLCs in vitro
Activated ATM Regulated VM-like Network Formation by GSLCs through Phenotype Transformation
Data Availability The original contributions of this study are included in this report, and further inquiries can be directed to the corresponding authors.
&These authors contributed equally to this work.
 23376+Supplementary Materials.pdf
|

|

 Quick Links
 DownLoad: