


-
According to the World Health Organization’s Global Tuberculosis Report 2023, there were 10.6 million cases of tuberculosis (TB) worldwide in 2022, an increase of 2.8% over 2021, and 1.3 million people had already died of the disease. The report also indicated that approximately 748,000 new cases occurred in China in 2022, accounting for 7.1% of the global total, with an incidence of 52/100,000. In that same year, the reported number of new TB cases in Hainan, China was 4,377, with an incidence of 43/100,000[1]. The most common form of TB infection is pulmonary tuberculosis (PTB). The development of the Hainan free-trade economic zone has brought new challenges to the prevention and control of PTB in the island province. Exploring the risk factors that affect the incidence of PTB has important value for guiding disease prevention and control measures. In a previous study, Pu et al. had found that the number of permanent residents and meteorological factors were the main factors influencing the incidence of PTB in Hainan[2]. Other studies have found nonlinear exposure-lag-response relationships between meteorological factors and PTB incidence[3–9], with the meteorological factors having different risk and delayed effects on the disease incidence in different regions.
The People’s Government of Hainan Province governs four prefecture-level cities, five county-level cities, four counties, and six autonomous counties. By the end of 2022, the province had a permanent population of 104,321,000. Hainan Island, which is the main island, is located in the northern edge of the tropics (latitude 18°10'–20°10' N, longitude 108°37'–11°03' E) and has a unique tropical monsoon climate. Therefore, study of the delayed effects of meteorological factors on the incidence of PTB in Hainan is needed. In this study, a distributed lag nonlinear model (DLNM) was constructed to estimate the lag and nonlinearity effects of meteorological factors on the incidence of PTB in Hainan. The results could guide the development of effective measures to prevent and control the disease.
The reported monthly incidences of PTB in Hainan (1/100,000) from 2004 to 2018 were obtained from the Data Center for Public Health Sciences (https://www.phsciencedata.cn/Share/). The 2004–2018 monthly data of several meteorological factors, including average temperature (°C), average air pressure (hPa), average relative humidity (%), and average precipitation (mm), were obtained from the China Meteorological Information Center (http://data.cma.cn/).
The monthly number of PTB cases, PTB incidence, and meteorological factors were statistically described. Spearman’s correlation test was used to explore the correlations among the meteorological factors, and the influencing factors were determined by eliminating collinearity factors. Suppose that $ {Y}_{\mathit{t}} $ denotes the PTB incidence at month $ \mathit{t} $ and follows a Poisson distribution; then, the DLNM would be described as follows:
$$ \begin{aligned} {log}[{E}\left({{Y}}_{{t}}\right)]=\; & \alpha +cb(temp,lag)+cb(hr,lag)\;+\\ & ns(time,6)+\beta month \end{aligned} $$ where $ E(Y_t)$ is the expected number of PTB incidences, $ {\alpha } $ is the intercept, $ cb$ is the cross-basis term constructed for each meteorological factor, and $ \mathit{l}\mathit{a}\mathit{g} $ is the maximum lag time. The priori lag time for $ \mathit{l}\mathit{a}\mathit{g} $ was 12[3], and the maximum lag time was 20[4]. The cross-basis terms were composed of two dimensions, wherein the exposure–response dimension fitting was modeled using natural cubic splines with 2 or 3 internal knots at equally spaced values, and the exposure–lag dimension fitting adopted a natural cubic spline function with an a priori degrees of freedom of 3[3,5]. Because the author had found that the monthly incidence of PTB had a long-term trend and seasonality[2], $ \mathit{t}\mathit{i}\mathit{m}\mathit{e} $ was used to represent the long-term trend and seasonality, with a natural cubic spline $ \mathit{n}\mathit{s} $ and a priori degrees of freedom of 6 or 7, and $ \mathit{m}\mathit{o}\mathit{n}\mathit{t}\mathit{h} $ was included as the indicator variable.
For parameter determination, a certain number of internal knots of the natural spline function for the exposure-response dimension was first assumed to be given. Then, the optimal maximum time of $ \mathit{l}\mathit{a}\mathit{g} $ was determined on the basis of the prior maximum time for $ \mathit{l}\mathit{a}\mathit{g} $, the degrees of freedom of $ \mathit{t}\mathit{i}\mathit{m}\mathit{e} $, and the natural cubic spline function in the exposure–lag dimension using the significance test of risk rate at maximum lag time. Next, the optimal degrees of freedom of $ \mathit{t}\mathit{i}\mathit{m}\mathit{e} $ and the natural cubic spline function were determined using the Akaike information criterion (AIC). Finally, the number of optimal knots was calculated on the basis of the optimal parameters determined using the significance test of delayed relative risk (RR) and AIC. The RRs of the monthly PTB incidence at each meteorological factor at different lag months, compared with their median, were reported with corresponding 95% confidence intervals (95% CI). The statistical analyses were performed using the “dlnm” package in R software (Version 4.2.2) and Python 3.11.7. A P value of less than 0.05 was considered statistically significant.
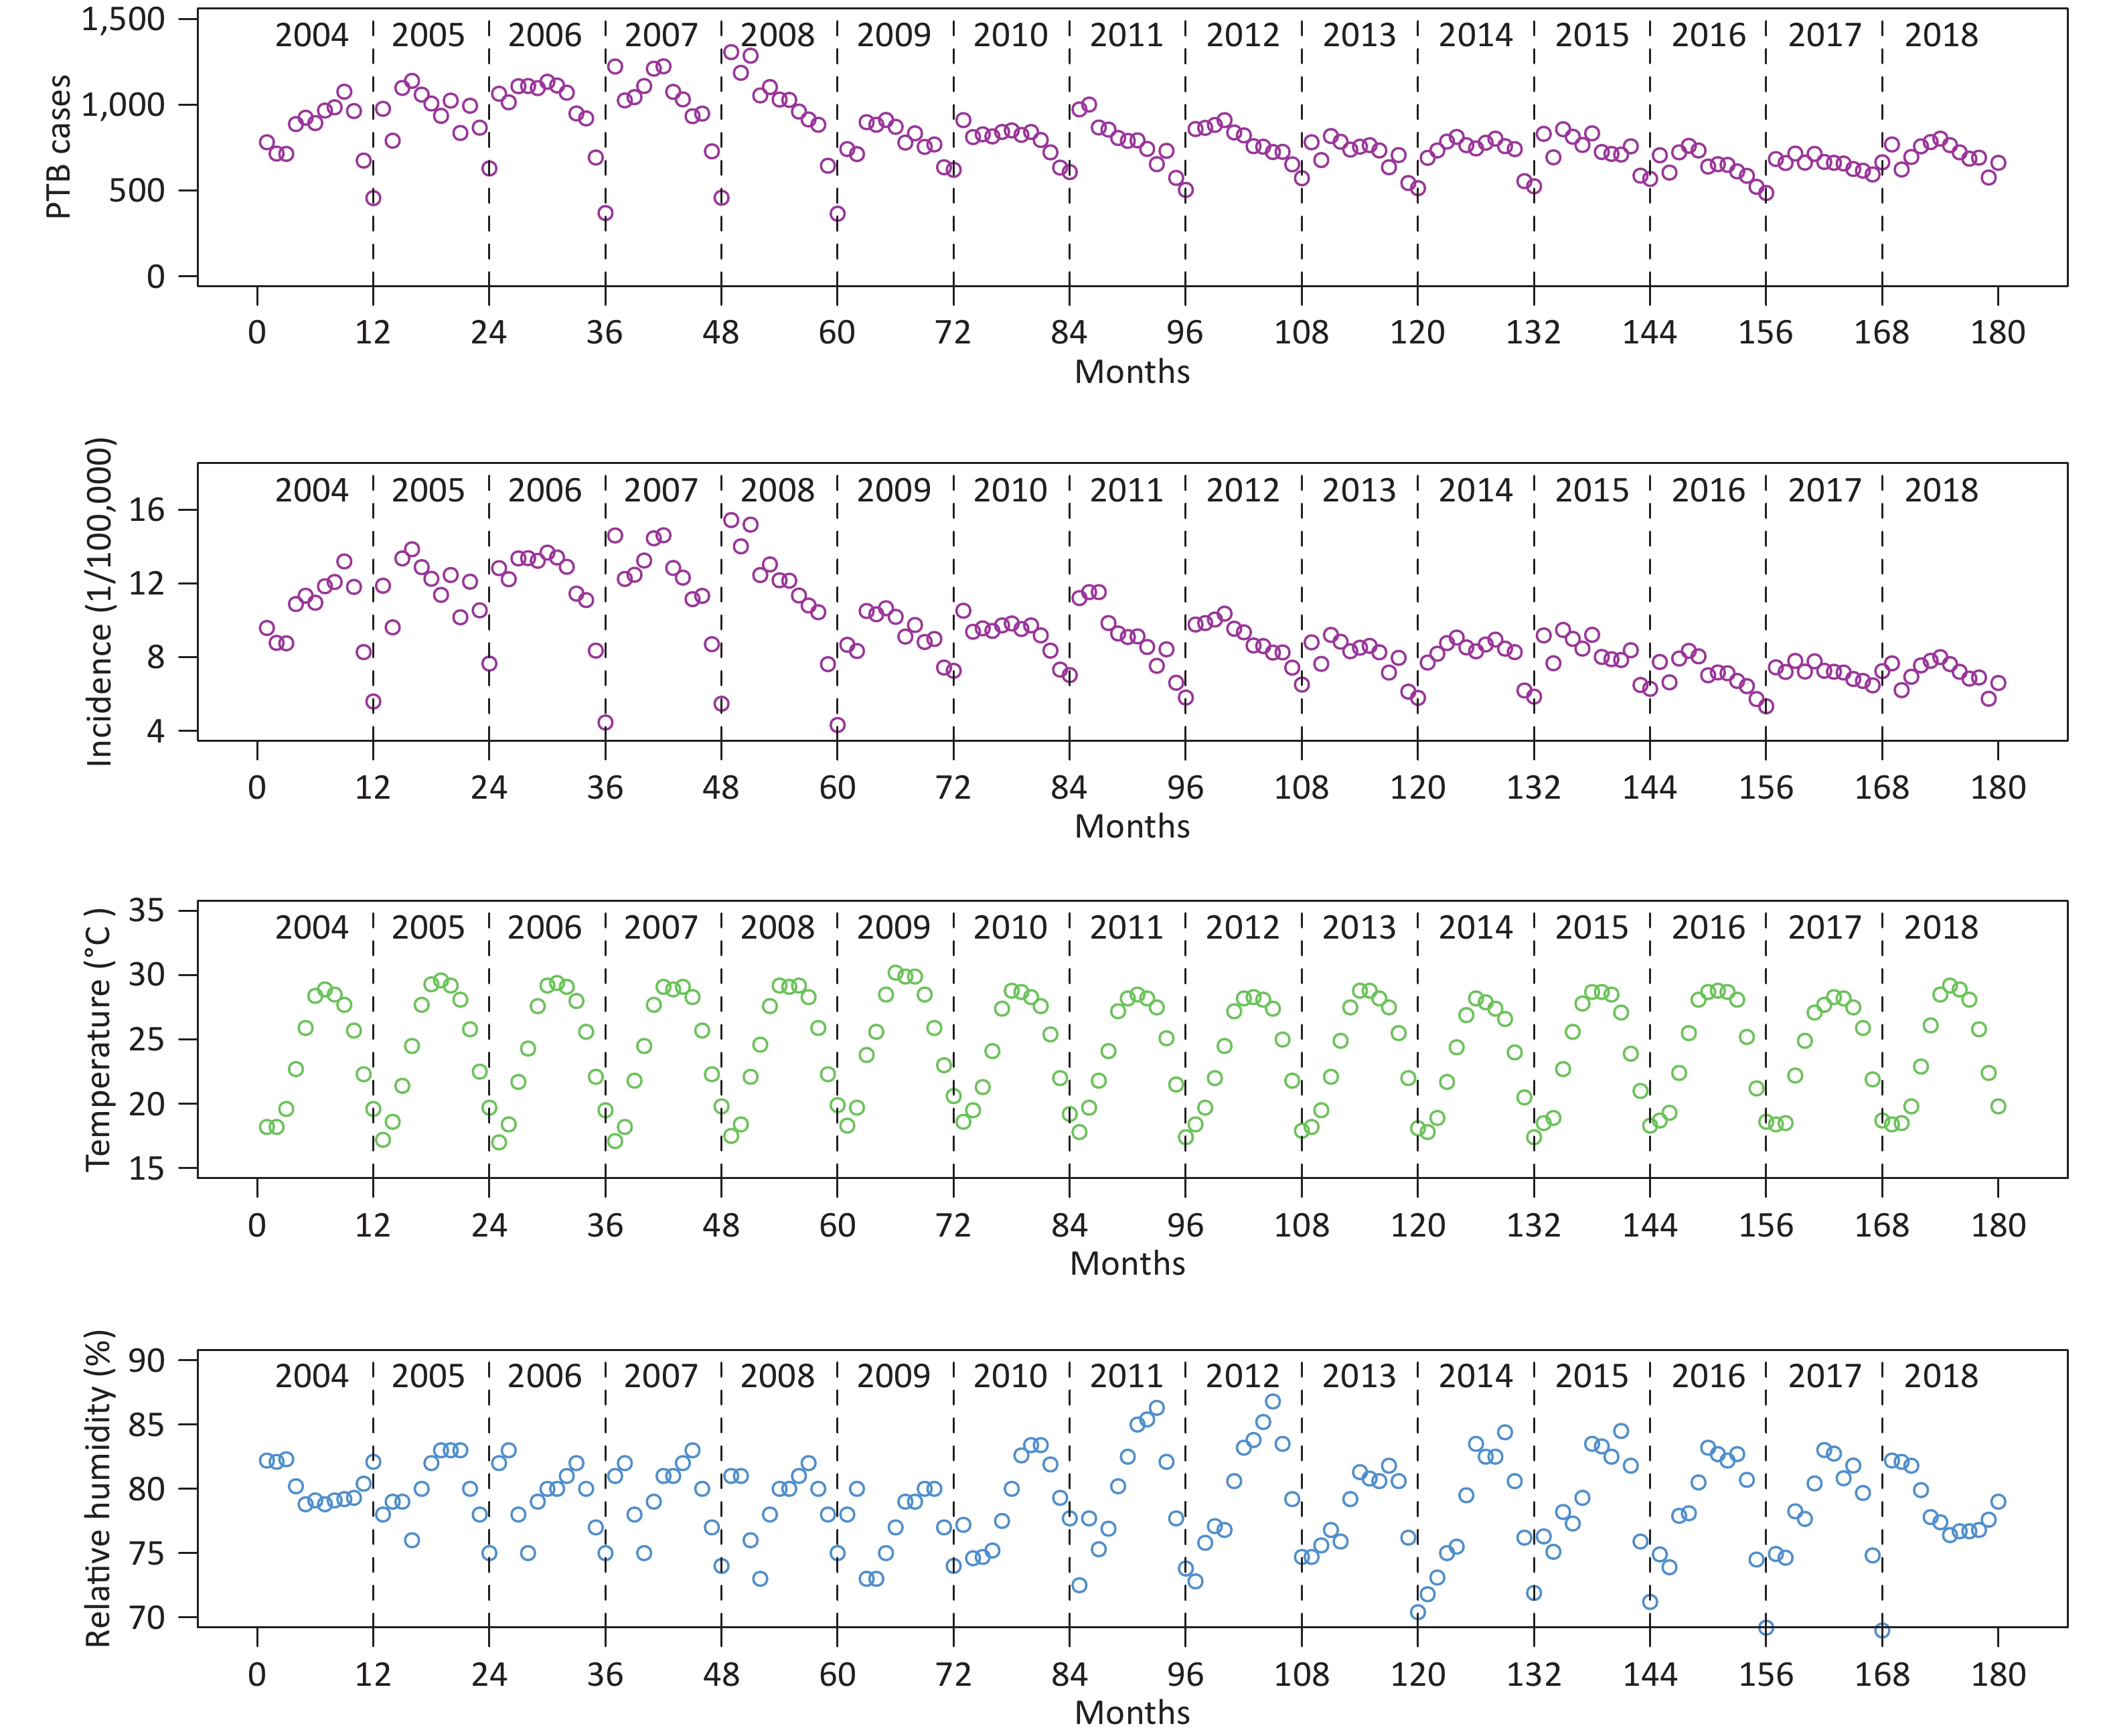
The distributions of monthly PTB cases and meteorological factors in Hainan were summarized (Supplementary Table S1, available in www.besjournal.com). Figure 1 shows the time series of the various monthly data. In total, there were 144,394 cases of PTB, with a mean of 802 cases. Spearman’s correlation analysis (Supplementary Table S2, available in www.besjournal.com) revealed associations of the average temperature with the average air pressure and average precipitation, with correlation coefficients of –0.71 and 0.81, respectively. We eventually explored the impact of monthly average temperature and relative humidity on the incidence of PTB.
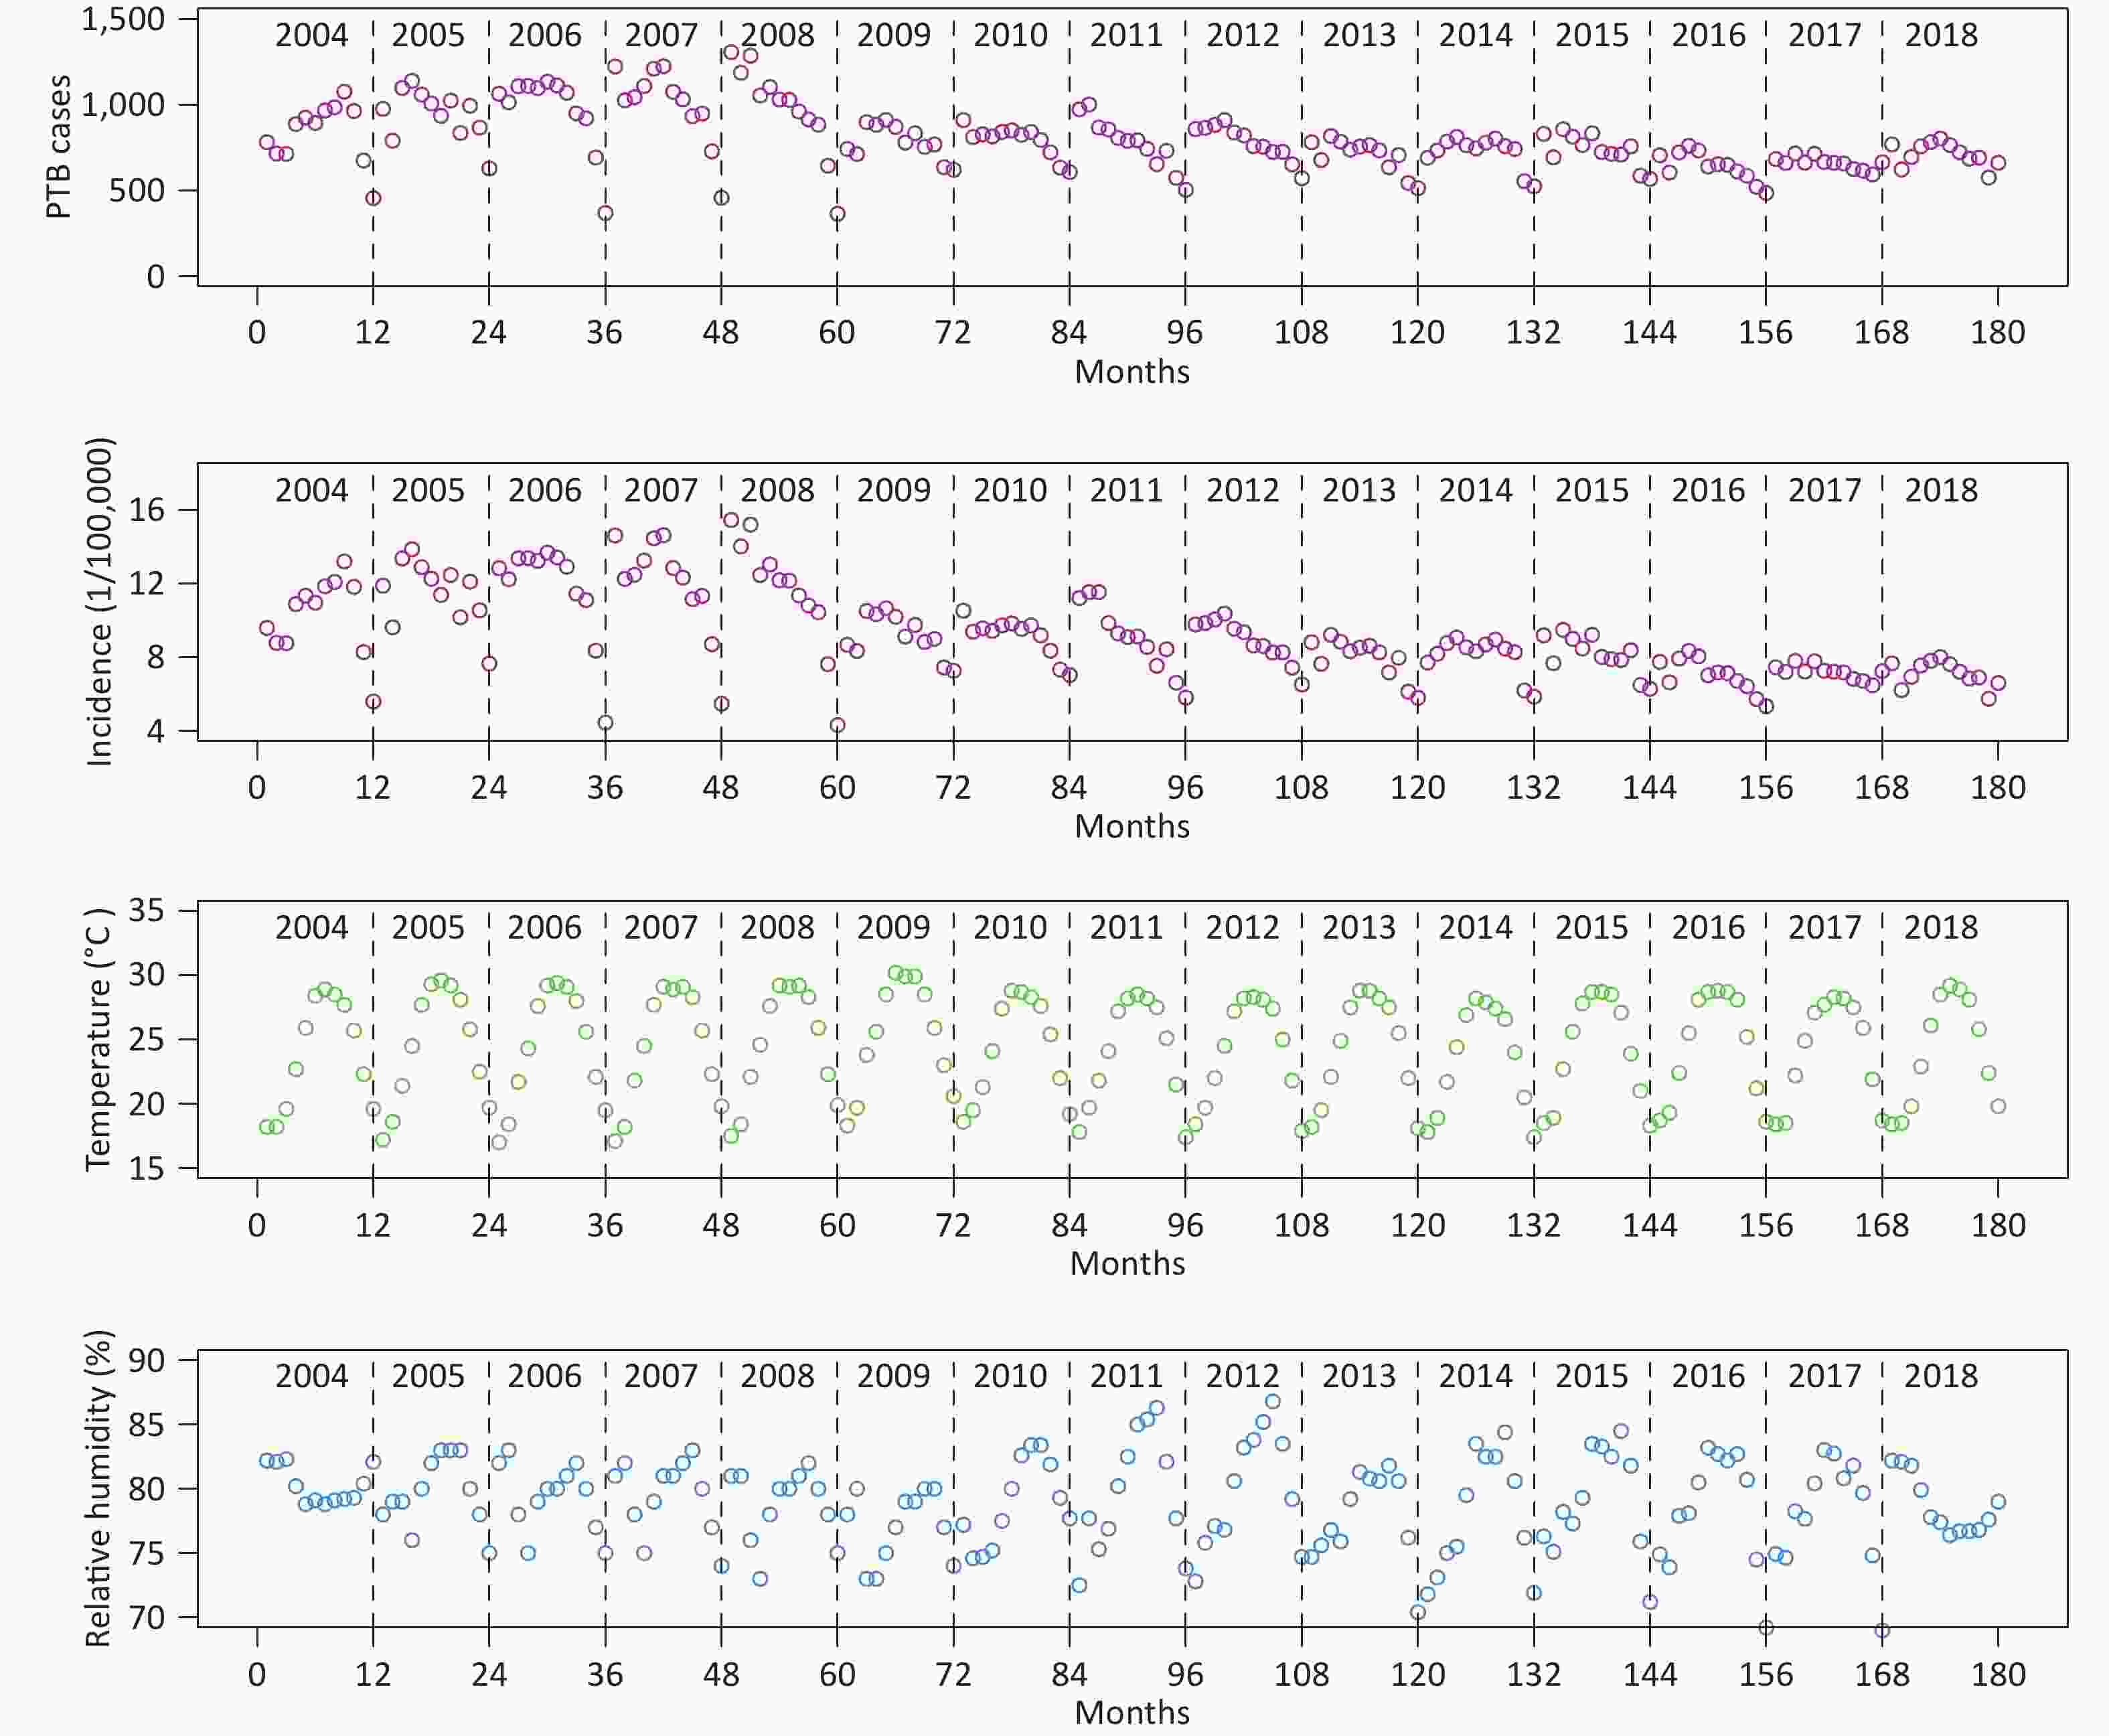
Figure 1. Time series of the monthly number of pulmonary tuberculosis (PTB) cases, monthly incidence of PTB, monthly average temperature, and monthly average relative humidity in Hainan, 2004–2018.
Variables Mean SD Minimum P10 P25 P50 P75 P90 Maximum Monthly PTB cases 802 180.19 364 603 684 773 910 1,065 1,307 Monthly PTB incidence (1/100 000) 9.25 2.37 4.31 6.52 7.54 8.76 10.95 12.9 15.47 Monthly average temperature (°C) 24.23 4.06 17 18.4 19.83 25.05 28.18 28.89 30.2 Monthly average air pressure (hPa) 1010.46 3.66 999.1 1005.3 1009 1011 1012.58 1015.2 1018.6 Monthly average relative humidity (%) 78.88 3.49 68.98 74.6 76.33 79.2 81.88 83 86.8 Monthly average precipitation (mm) 117.3 96.09 1.8 15.51 36.1 78.95 191.78 261.53 401.6 Note. SD is standard deviation of variables, and P10 , P25 , P50, P75, P90 are the 10th, 25th, 50th, 75th, 90th percentiles of variables, respectively. Table S1. Summarized statistics of monthly PTB cases, monthly meteorological factors in Hainan, 2004–2018
The optimal $ \mathit{l}\mathit{a}\mathit{g} $ times of temperature and relative humidity were 13 and 11 months, respectively, and the optimal degrees of freedom for $ \mathit{t}\mathit{i}\mathit{m}\mathit{e} $ was 7. The degrees of freedom for the natural cubic spline functions of temperature and relative humidity in the exposure–lag dimension were both 3, respectively (Supplementary Table S3, available in www.besjournal.com). The numbers of internal knots in the cross-basis terms of temperature and relative humidity were 2 and 3, respectively (Supplementary Table S4, available in www.besjournal.com).
(Lag1, Lag2) N (N1, N2) Whether it passes the
significance test of RR1Whether it passes the
significance test of RR2AIC criterion (12, 12) 6 (2, 3) Yes No 698.32 (12, 12) 6 (3, 3) Yes No 698.06 (12, 12) 6 (2, 2) No No 701.44 (12, 12) 6 (3, 2) No No 701.91 (12, 12) 7 (2, 3) Yes No 698.99 (12, 12) 7 (3, 3) Yes No 698.28 (12, 12) 7 (2, 2) No No 701.95 (12, 12) 7 (3, 2) No No 701.48 (12, 11) 6 (2, 3) Yes Yes 698.23 (12, 11) 6 (3, 3) Yes Yes 698.35 (12, 11) 6 (2, 2) Yes Yes 701.43 (12, 11) 6 (3, 2) Yes Yes 700.7 (12, 11) 7 (2, 3) Yes Yes 698.64 (12, 11) 7 (3, 3) Yes Yes 697.41 (12, 11) 7 (2, 2) Yes Yes 699.9 (12, 11) 7 (3, 2) Yes Yes 700.9 (13, 11) 6 (2, 3) Yes Yes 694.2 (13, 11) 6 (3, 3) Yes Yes 694.05 (13, 11) 6 (2, 2) Yes Yes 697.23 (13, 11) 6 (3, 2) Yes Yes 694.95 (13, 11) 7 (2, 3) Yes Yes 694.87 (13, 11) 7 (3, 3) Yes Yes 693.2 (13, 11) 7 (2, 2) Yes Yes 695.9 (13, 11) 7 (3, 2) Yes Yes 695.95 (14, 11) 6 (2, 3) No Yes 690.01 (14, 11) 6 (3, 3) No Yes 690.03 (14, 11) 6 (2, 2) No Yes 691.36 (14, 11) 6 (3, 2) No Yes 692.3 (14, 11) 7 (2, 3) No Yes 690.28 (14, 11) 7 (3, 3) No No 690.15 (14, 11) 7 (2, 2) No Yes 690.58 (14, 11) 7 (3, 2) No Yes 691.5 Note. Lag1: the maximum $ \mathit{l}\mathit{a}\mathit{g} $ time of average temperature. Lag2: the maximum $ \mathit{l}\mathit{a}\mathit{g} $ time of average relative humidity. N: the freedom of natural cubic spline of $ \mathit{t}\mathit{i}\mathit{m}\mathit{e} $. N1: the degrees of freedom of the natural cubic spline function in the expose-lag dimension of cross-basis terms for average temperature. N2: the degrees of freedom of the natural cubic spline function in the expose-lag dimension of cross-basis terms for average relative humidity. The significance test of RR1: the significance test of delayed RR at the average temperature corresponding to the maximum RR at the maximum lag1. The significance test of RR2: the significance test of delayed RR of average relative humidity corresponding to the maximum RR at the maximum lag2. Table S3. The parameters determination of $ \mathit{l}\mathit{a}\mathit{g} $ time and degree of freedom of $ \mathit{t}\mathit{i}\mathit{m}\mathit{e} $ and natural cubic spline function
(M1, M2) Whether it passes the significance test of RR3 Whether it passes the significance test of RR4 AIC criterion (2, 3) Yes Yes 693.2 (2, 2) Yes No 695.5 (3, 2) Yes No 694.21 (3, 3) Yes No 692.55 Note. M1: the number of internal knots at equally spaced values for the natural cubic spline function in the cross-basis terms of average temperature. M2: the number of internal knots at equally spaced values for the natural cubic spline function in the cross-basis terms of average relative humidity. The significance test of RR3 : the significance test of delayed RR at the average temperature corresponding to the maximum RR at the maximum lag 13. The significance test of RR4 : the significance test of delayed RR of average relative humidity corresponding to the maximum RR at the maximum 11. Table S4. The parameters determination for internal knots number at equally spaced values for the natural cubic spline function in the cross-basis terms
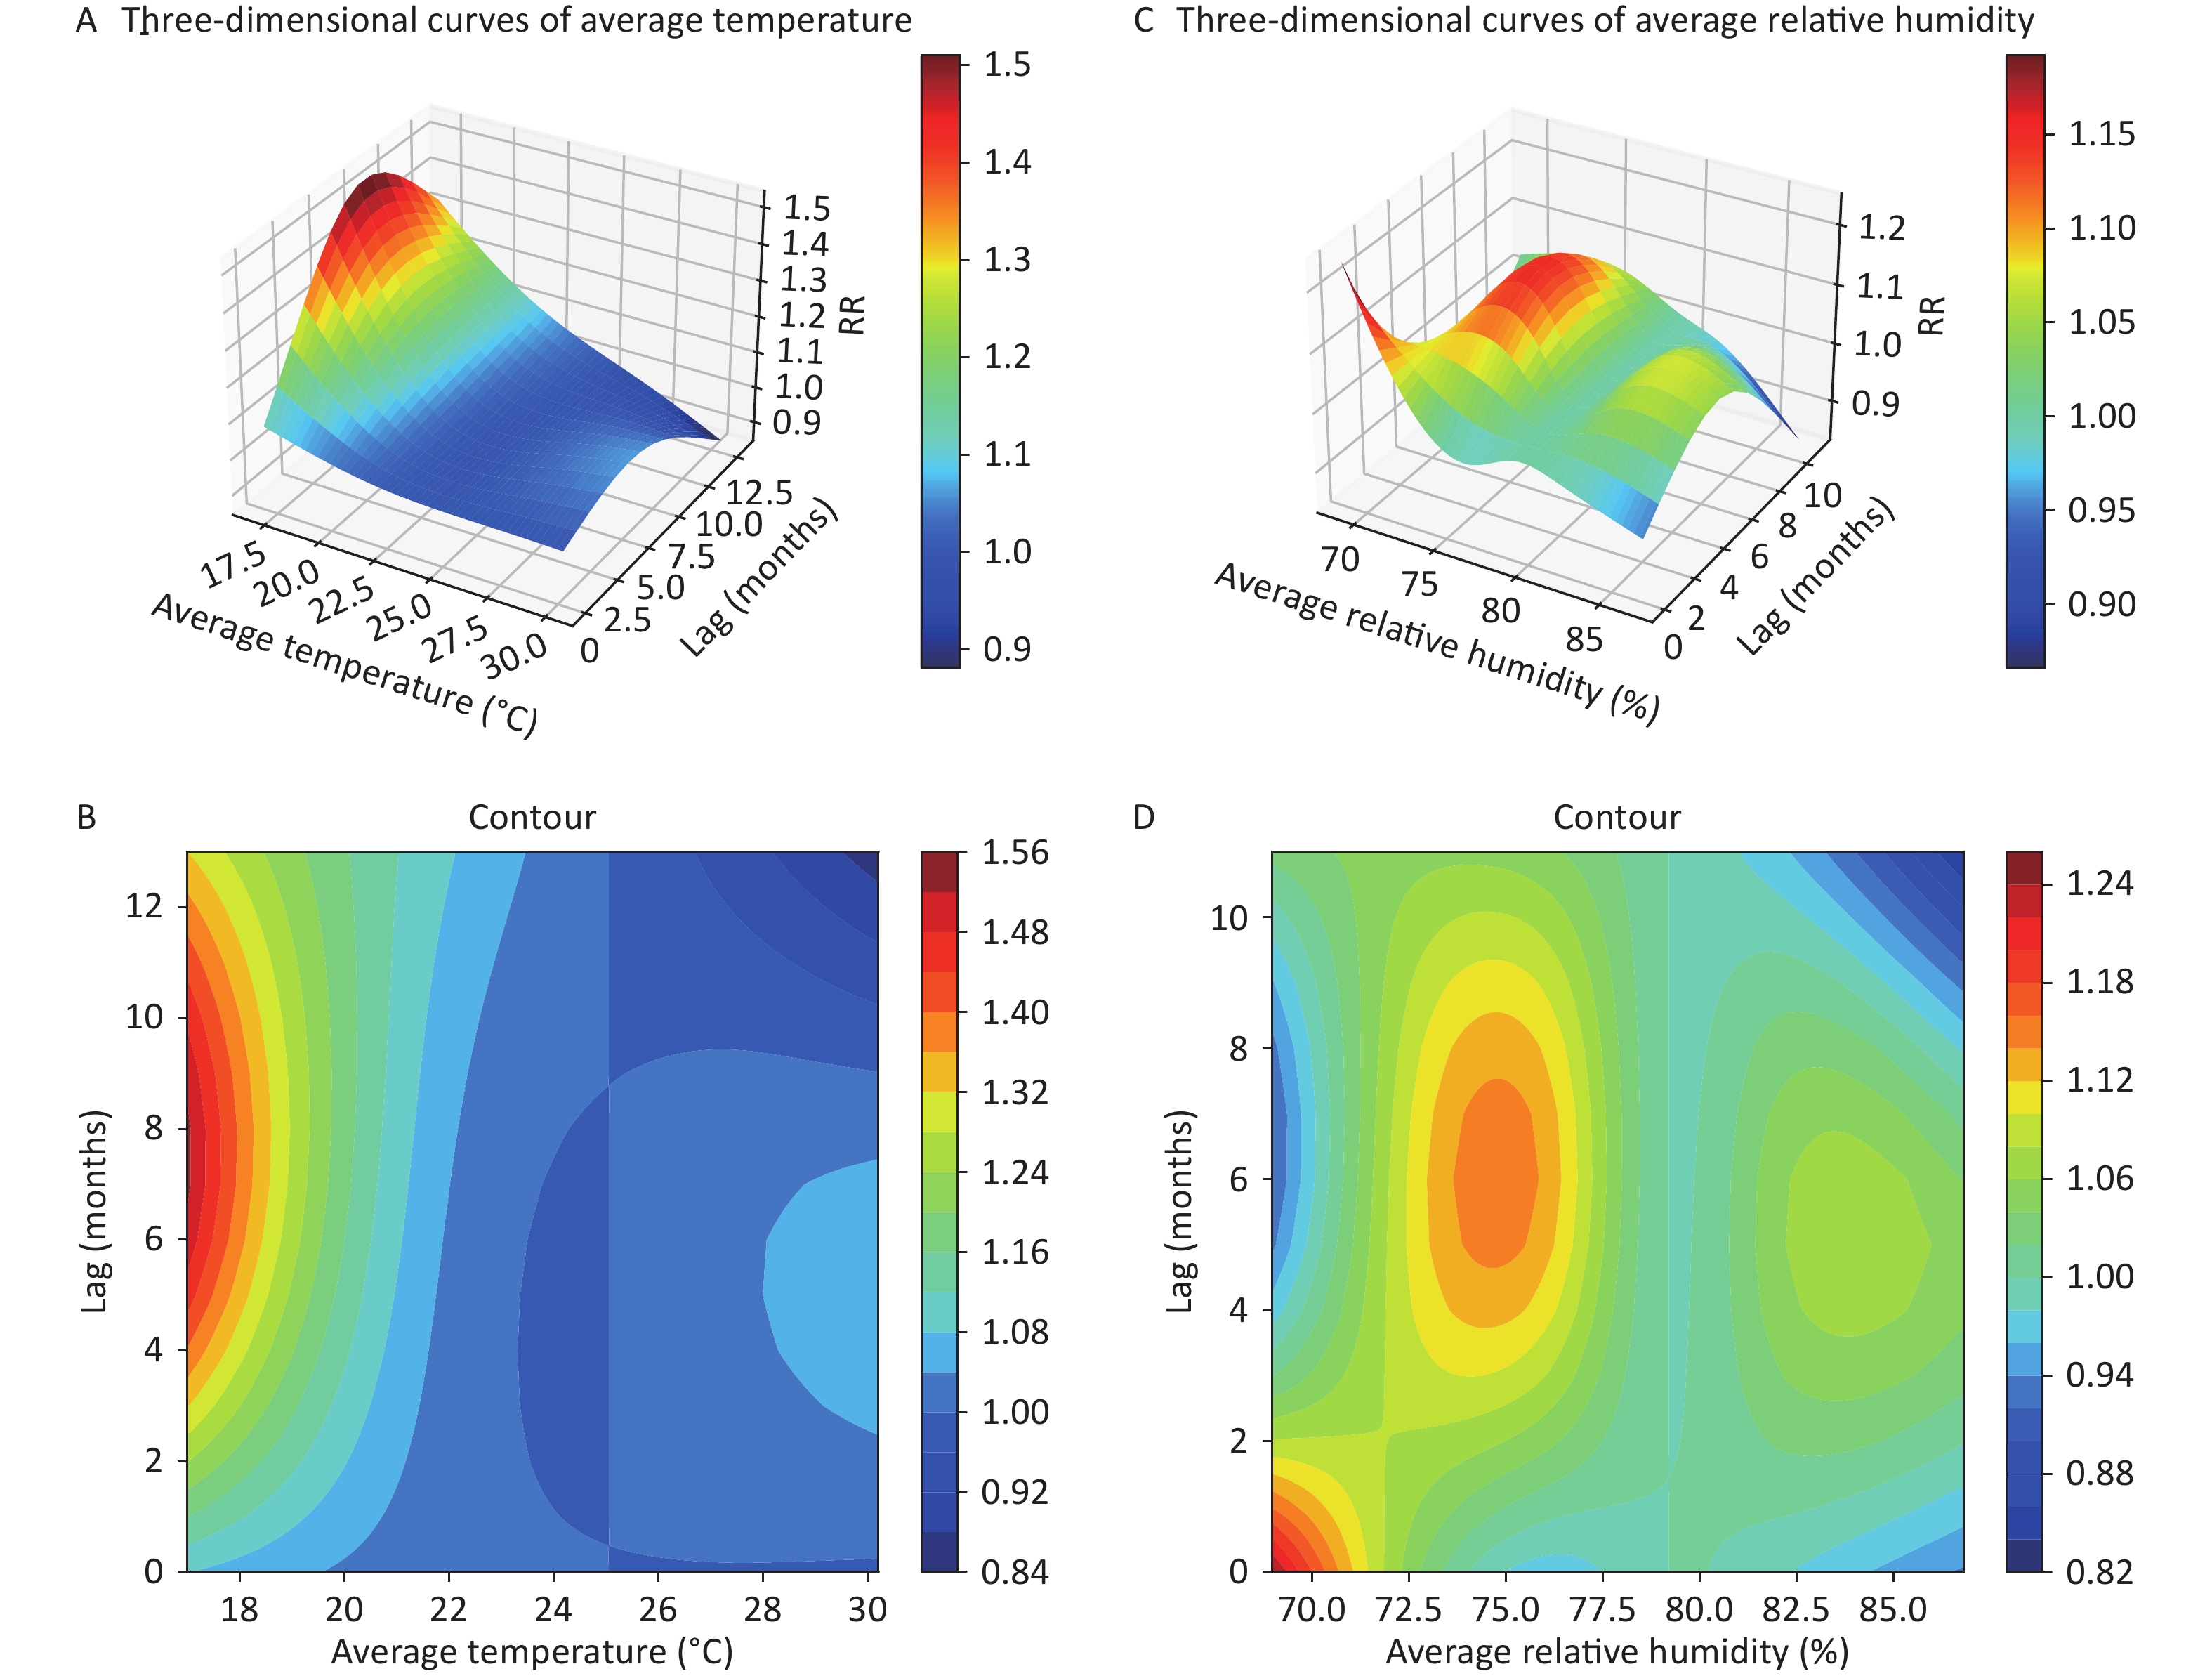
Figure 2A shows a three-dimensional plot of the estimated effect of temperature on the incidence of PTB at 0–13 lag months. As shown in Figure 2B, the average temperature between 17.00 °C and 21.15 °C had significant delayed risk effects. With increasing lag, the RR first increased gradually and then decreased and peaked with lag 7 at the minimum average temperature of 17.00 °C (Supplementary Table S5, available in www.besjournal.com). A low temperature was also a risk factor for increasing the incidences of TB[6,7] and PTB[4,8]. By contrast, although a high temperature had neither a significant risk or protective effect on the incidence of PTB in Hainan, it was a risk factor for both TB[9] and PTB[3,5,6,10]. The RR decreased with increasing temperature, which was consistent with the PTB incidence[8,9]. With increasing lag, the RR of PTB incidence first gradually increased and then gradually decreased, consistent with results observed for Hong Kong, China[4]. However in Kashgar, the trend of RR of TB differs significantly, attributed to the substantial differences in their climate characteristics[6].
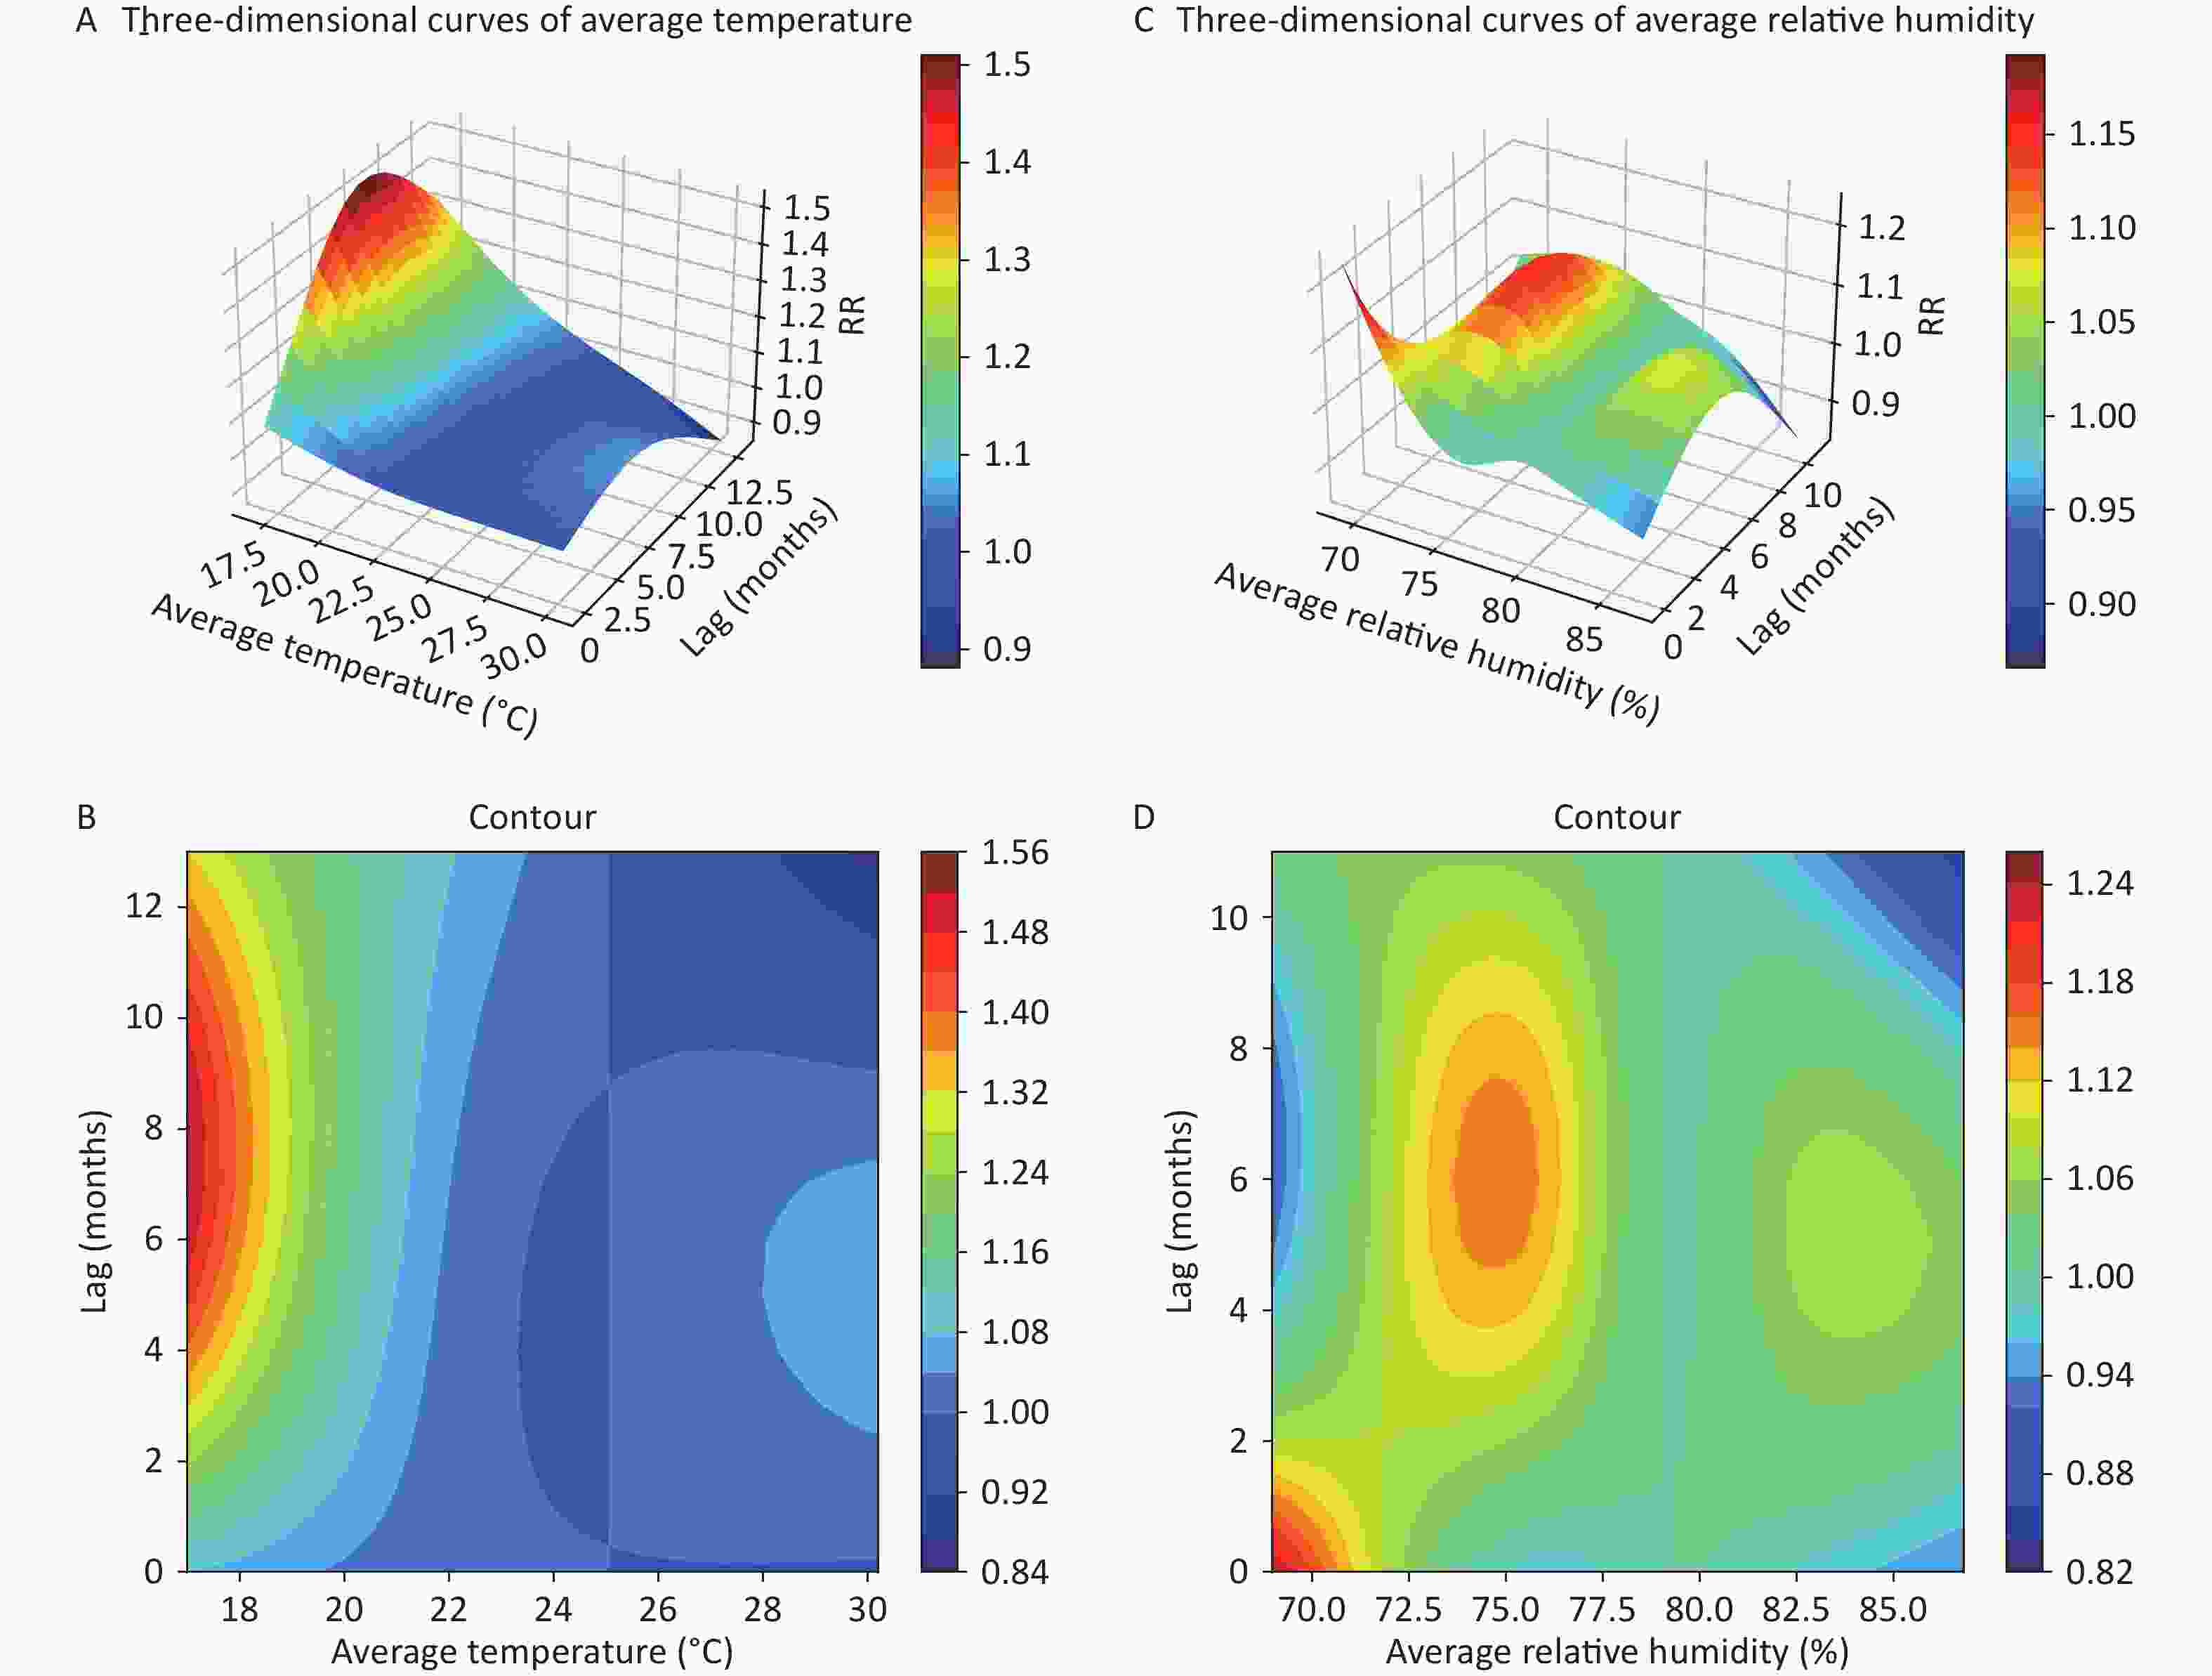
Figure 2. Three-dimensional exposure-lag-response curves and corresponding contour plots showing the RRs of pulmonary tuberculosis (PTB) at lagged months with various meteorological factors. (A, B) Monthly average temperature (°C) and (C, D) monthly average relative humidity (%).
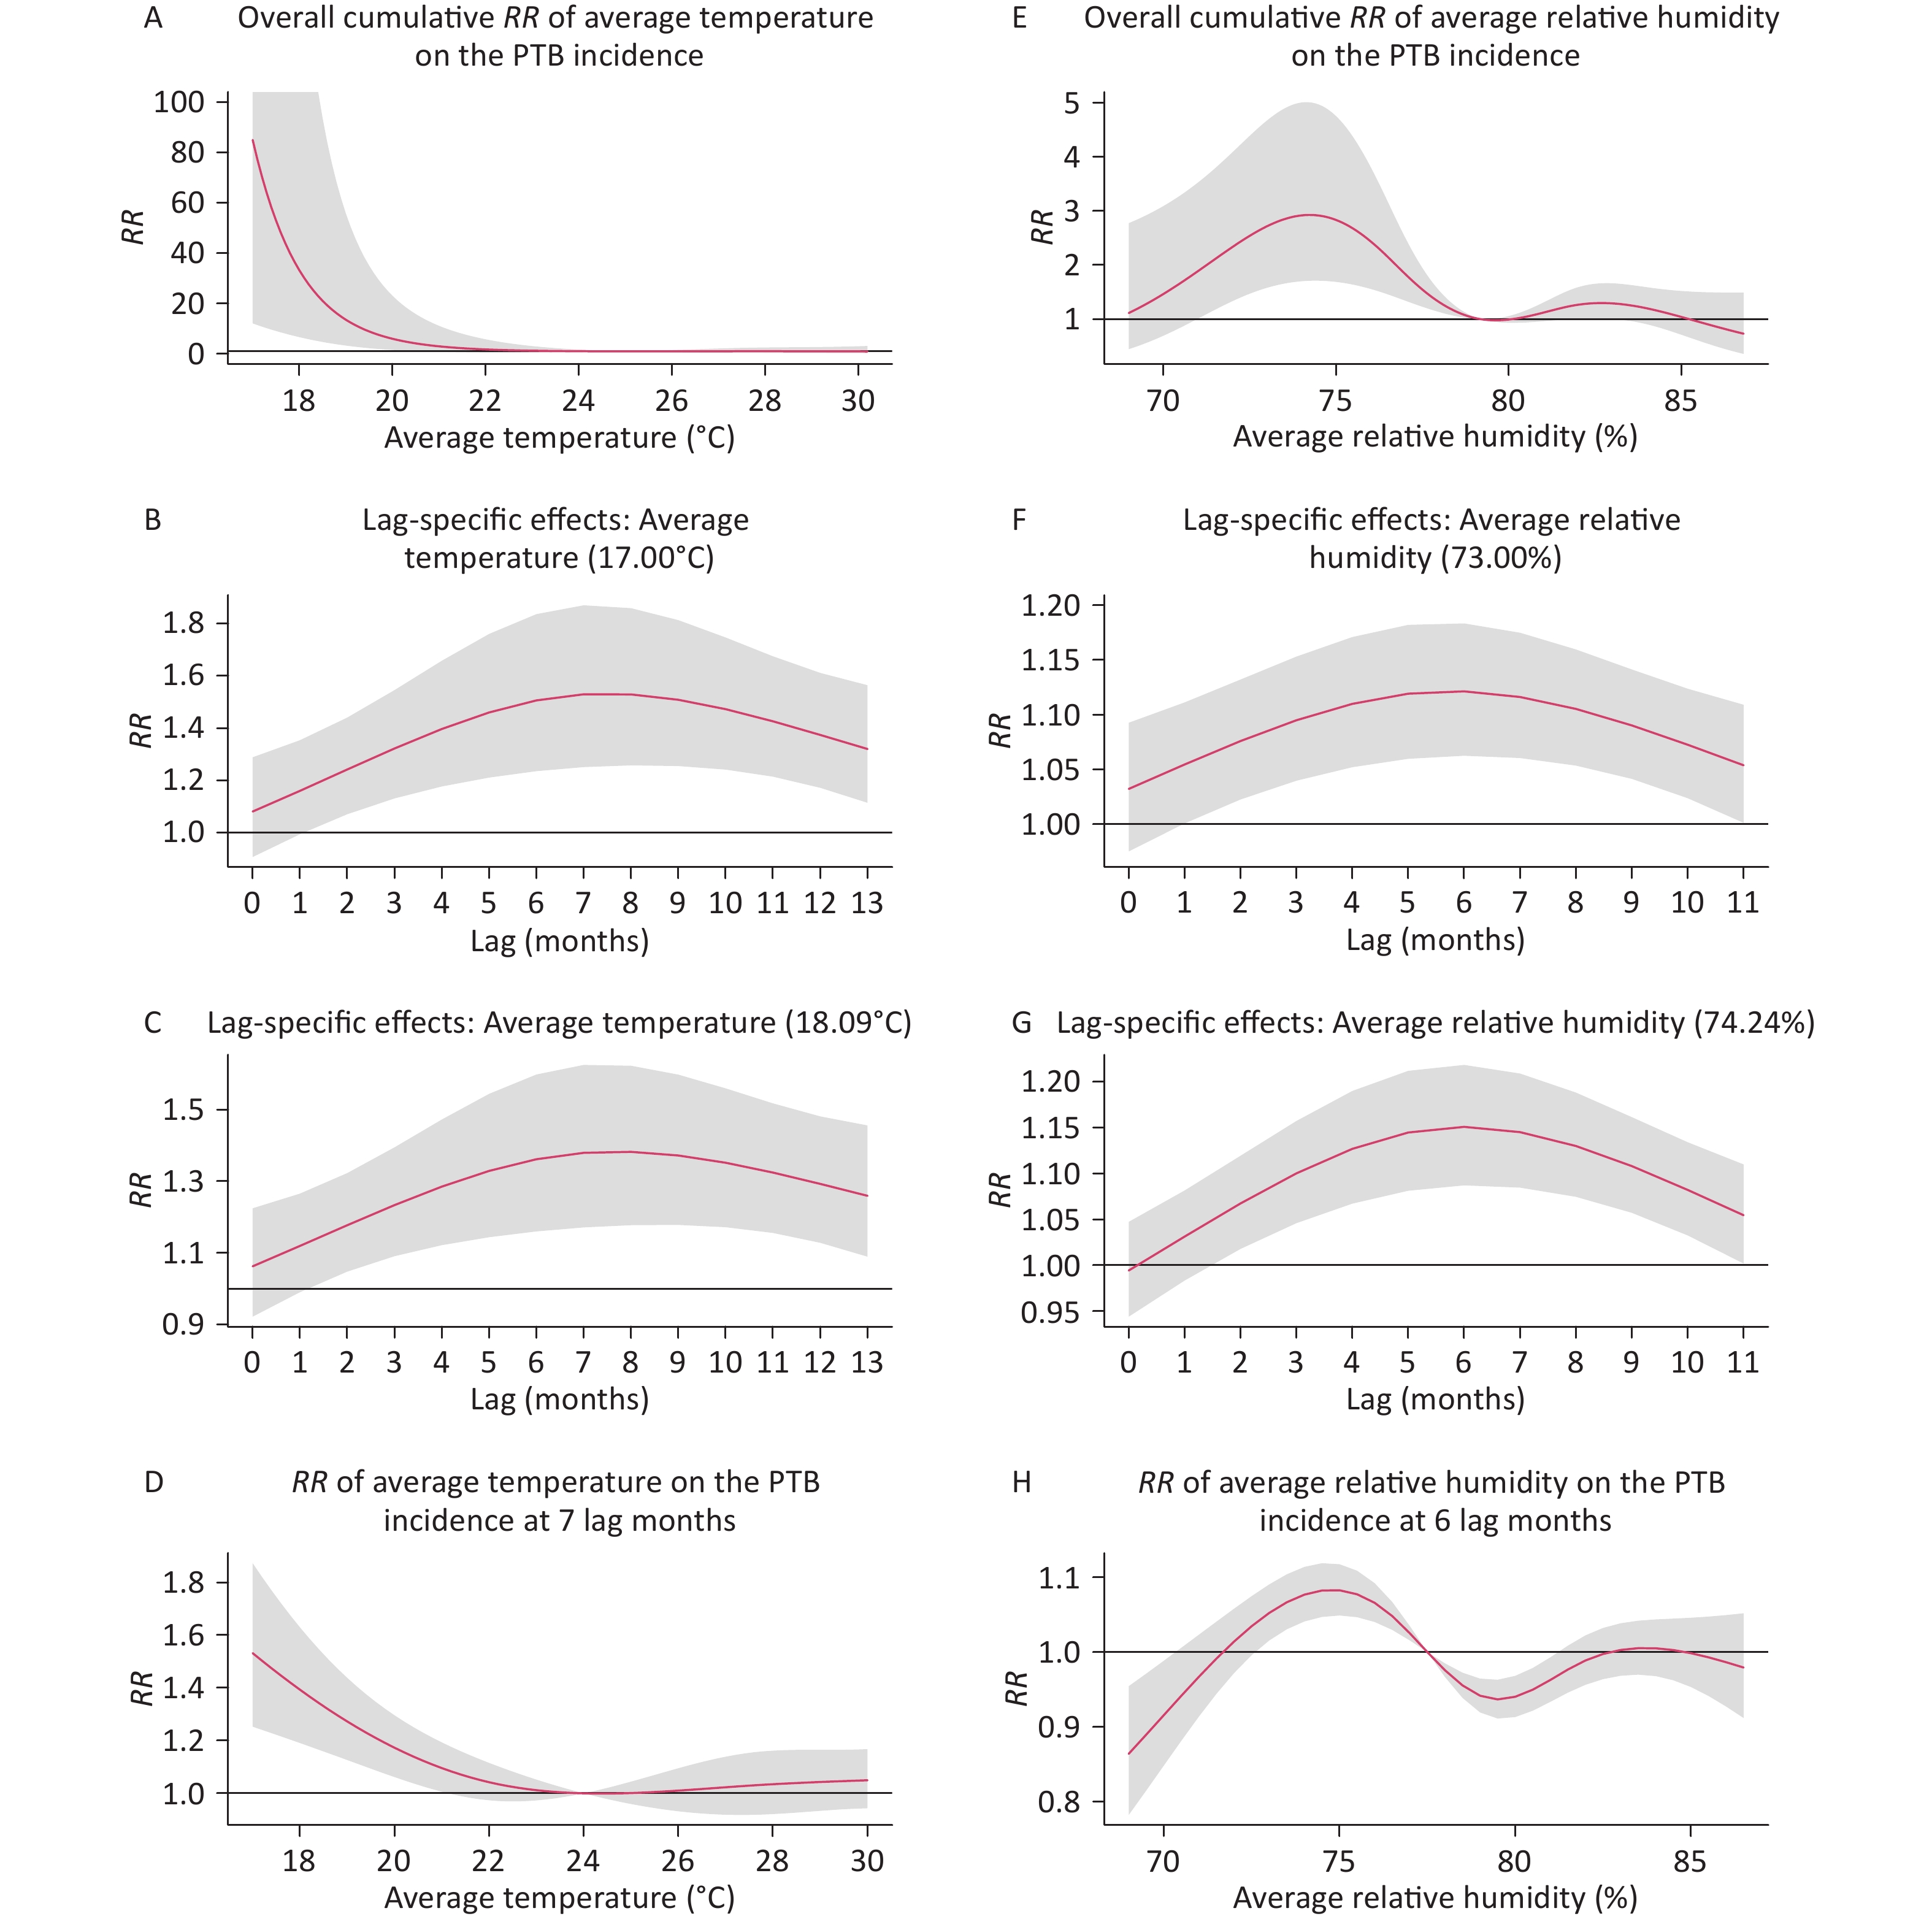
As shown in Figure 3A, the overall cumulative RR peaked at 17.00 °C (RR = 85.01, 95% CI: 12.11–596.83) (Supplementary Table S6, available in www.besjournal.com). Figures 3B and 3C show that the risk effects at both 17.00 °C and 18.09 °C first gradually increased with increase in the lag order, reaching their peak values at lag 7, respectively (RR = 1.53, 95% CI: 1.25–1.87; RR = 1.38, 95% CI: 1.17–1.62), and then gradually decreased thereafter (Supplementary Table S7, available in www.besjournal.com). Figure 3D shows that there were significant risk effects between 17.00 °C and 21.13 °C at lag 7, where with increase in the average temperature, the RR values showed a decreasing trend. In another study on Chinese Hong Kong, the longest lag with a delayed RR of PTB was 15 months, and the delayed lag of the maximum RR was 14 months[4], which were inconsistent with the results of our study. These diverging results may be due to the fact that the minimum monthly average temperature in Hong Kong, China is approximately 3 °C lower than that in Hainan.
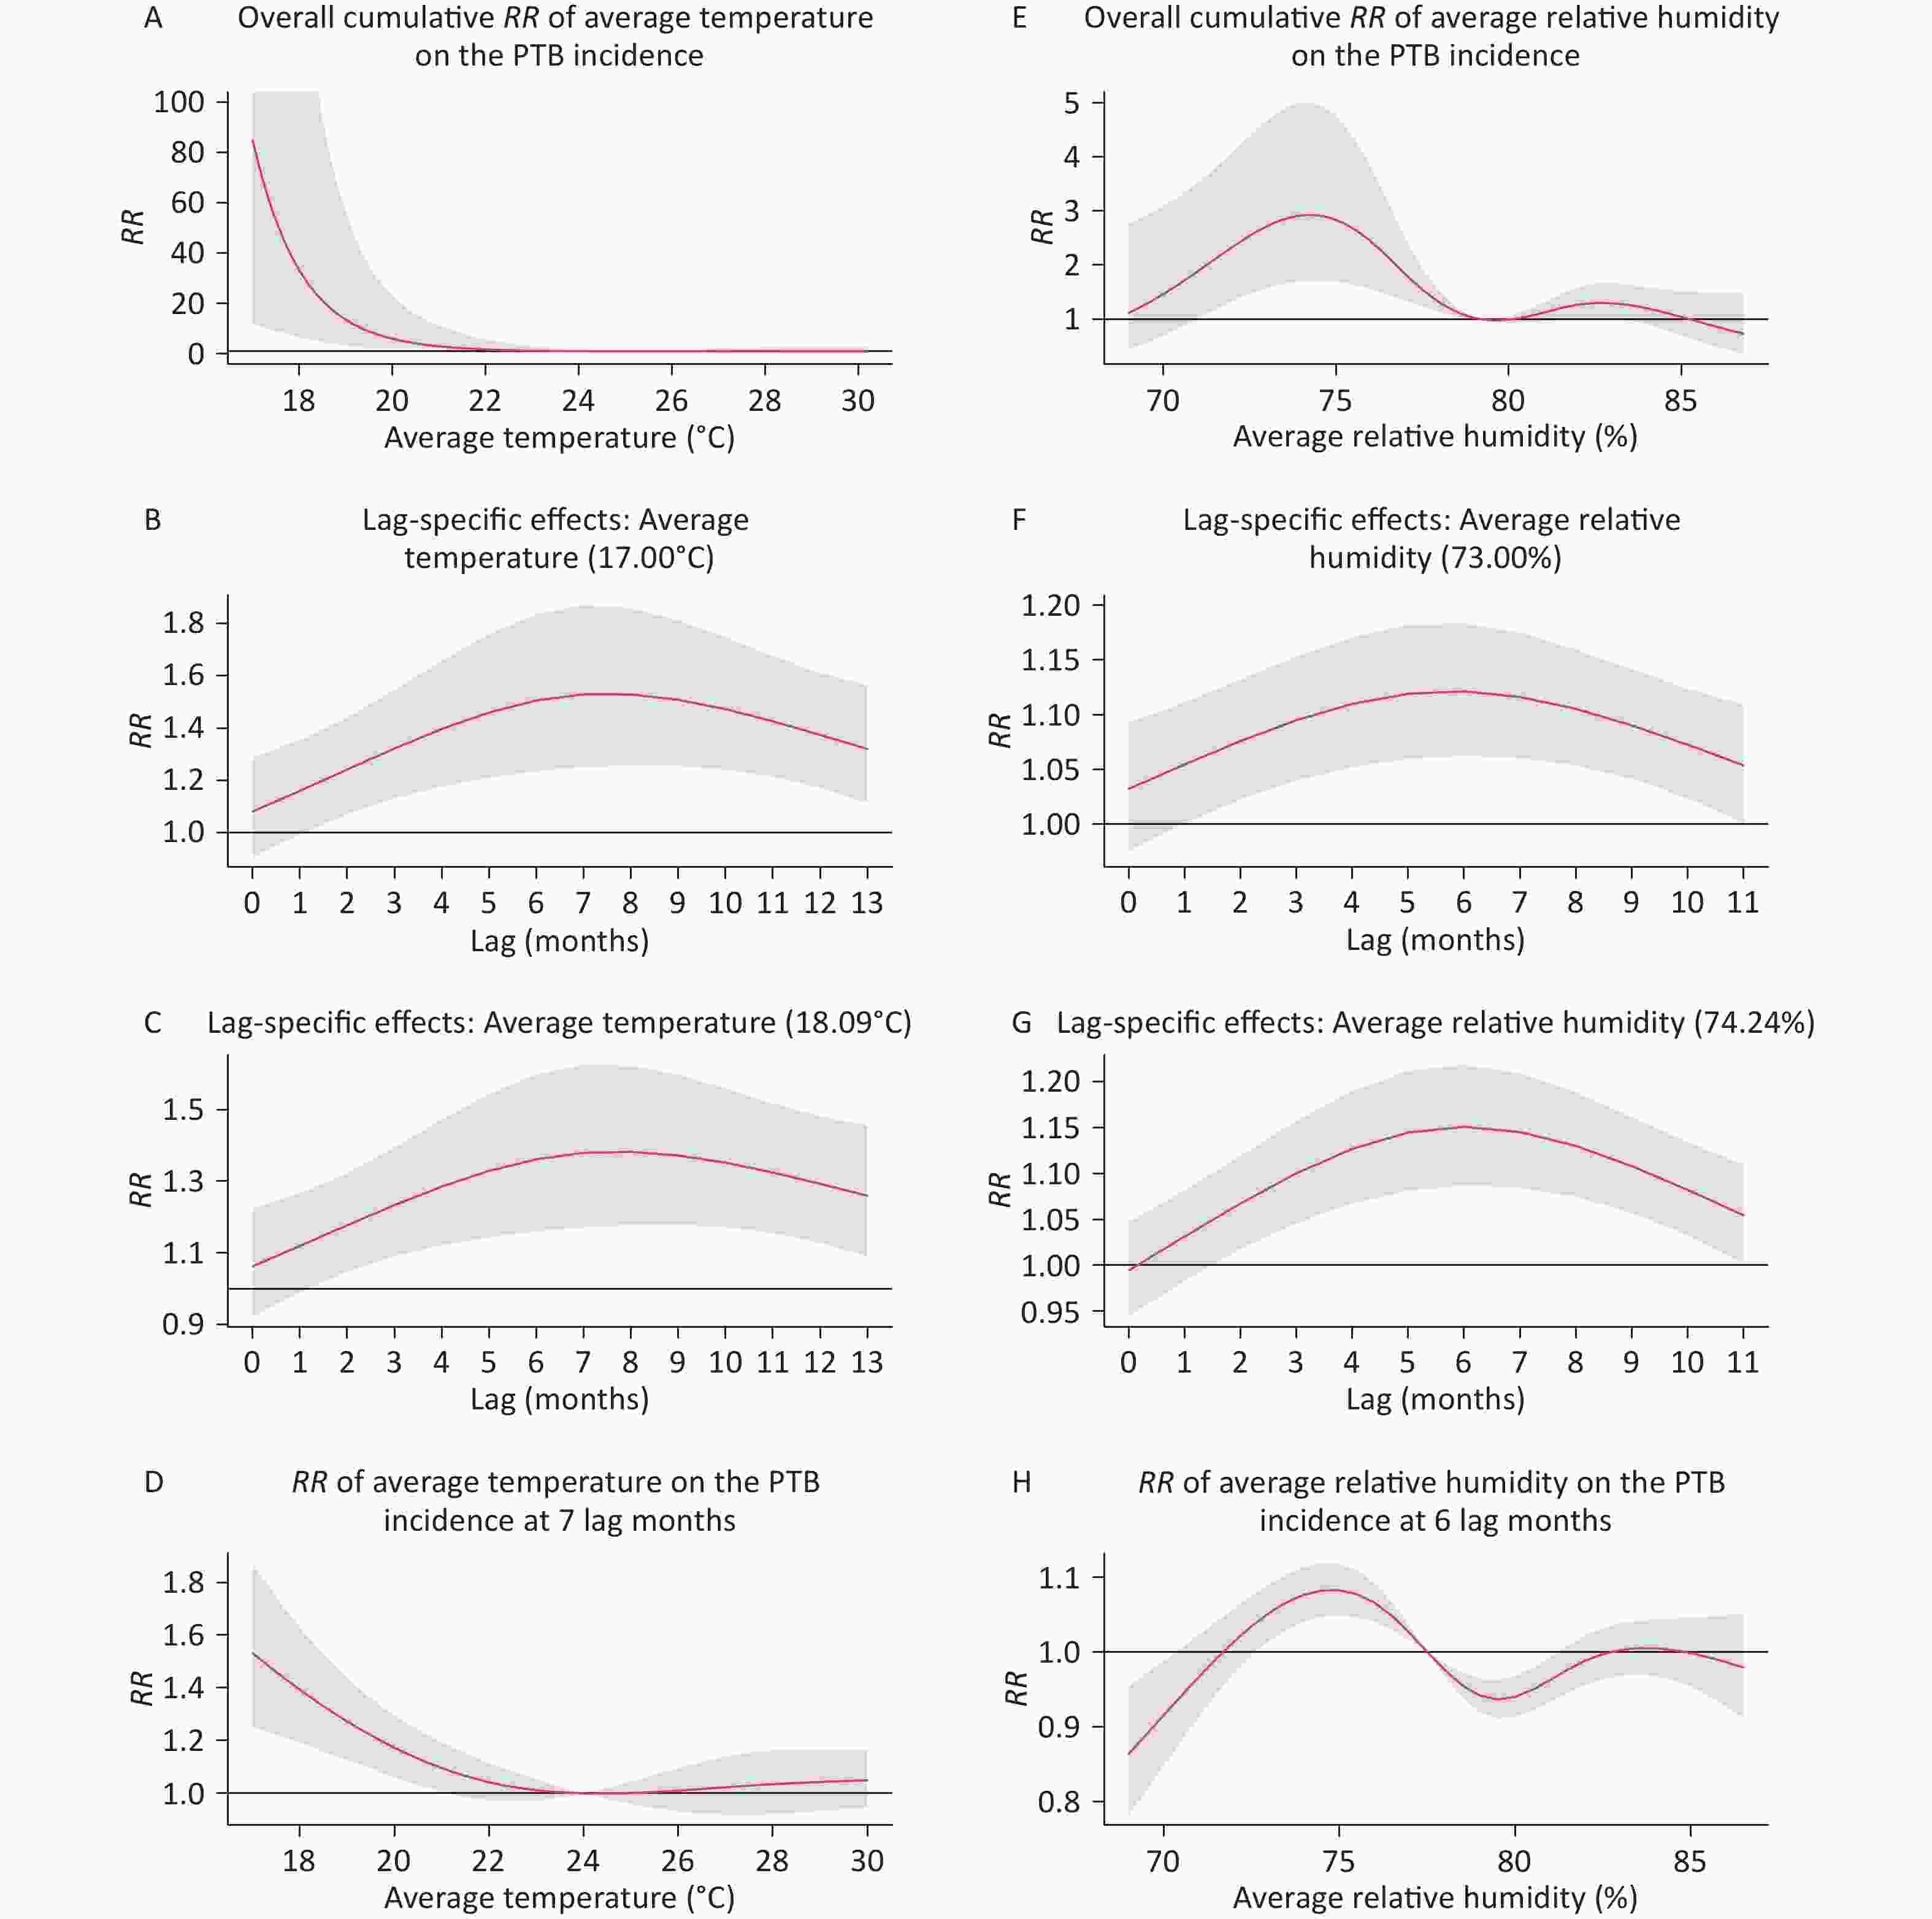
Figure 3. RRs (95% CI) of meteorological factors on the incidence of pulmonary tuberculosis (PTB).
Figure 2C depicts a three-dimensional plot of the estimated effect of average relative humidity on the incidence of PTB at 0–11 lag months. As shown in Figure 2D, an average relative humidity of between 68.98% and 79.19% had significant delayed risk effects on the incidence of PTB (Supplementary Table S8, available in www.besjournal.com). The RR first increased and then decreased with increasing relative humidity and lag time, which are consistent with the results of Chinese Hong Kong study[4]. However, other studies have either shown that a high relative humidity has a significant risk effect on TB[8,9] or that relative humidity was not a significant risk factor for PTB[5]. Nie et al. showed that a relative humidity above 64.1% had a risk effect on PTB in Urumqi, with the RR increasing with increase in the humidity value[3], which was inconsistent with our results. This is because Urumqi lies to the north of China and is drier than Hainan.
RH
(%)lag0 lag1 lag2 lag3 lag4 lag5 lag6 lag7 lag8 lag9 lag10 lag11 68.98 1.24
(1.06,
1.45)*1.16
(1.02,
1.31)*1.08
(0.97,
1.2)1.02
(0.93,
1.12)0.97
(0.89,
1.06)0.94
(0.85,
1.03)0.92
(0.84,
1.01)0.92
(0.85,
1)0.93
(0.87,
1.01)0.96
(0.89,
1.04)0.99
(0.9,
1.09)1.03
(0.91,
1.16)69.98 1.18
(1.05,
1.33)*1.13
(1.02,
1.25)*1.08
(0.99,
1.18)1.04
(0.97,
1.12)1.01
(0.94,
1.09)0.99
(0.92,
1.06)0.98
(0.91,
1.05)0.97
(0.91,
1.04)0.98
(0.92,
1.04)1
(0.93,
1.06)1.01
(0.94,
1.09)1.04
(0.94,
1.14)70.98 1.12
(1.02,
1.23)*1.1
(1.02,
1.19)*1.08
(1.01,
1.16)*1.06
(1,
1.13)*1.05
(0.99,
1.11)1.04
(0.98,
1.1)1.03
(0.97,
1.09)1.03
(0.97,
1.08)1.03
(0.98,
1.08)1.03
(0.98,
1.09)1.04
(0.98,
1.1)1.04
(0.97,
1.12)71.98 1.07
(1.00,
1.15)*1.08
(1.01,
1.15)*1.08
(1.02,
1.14)*1.08
(1.02,
1.14)*1.08
(1.03,
1.14)*1.08
(1.03,
1.14)*1.08
(1.03,
1.14)*1.08
(1.02,
1.13)*1.07
(1.02,
1.12)*1.06
(1.02,
1.12)*1.06
(1.01,
1.11)*1.05
(0.99,
1.11)72.98 1.03
(0.98,
1.09)1.05
(1.00,
1.11)*1.08
(1.02,
1.13)*1.09
(1.04,
1.15)*1.11
(1.05,
1.17)*1.12
(1.06,
1.18)*1.12
(1.06,
1.18)*1.12
(1.06,
1.17)*1.11
(1.05,
1.16)*1.09
(1.04,
1.14)*1.07
(1.02,
1.12)*1.05
(1,
1.11)*73.98 1.00
(0.95,
1.05)1.04
(0.99,
1.09)1.07
(1.02,
1.12)*1.1
(1.05,
1.16)*1.13
(1.07,
1.19)*1.14
(1.08,
1.21)*1.15
(1.08,
1.21)*1.14
(1.08,
1.2)*1.13
(1.07,
1.18)*1.11
(1.06,
1.16)*1.08
(1.03,
1.13)*1.05
(1,
1.11)*74.98 0.98
(0.93,
1.03)1.02
(0.97,
1.07)1.06
(1.01,
1.11)*1.1
(1.04,
1.15)*1.13
(1.07,
1.19)*1.15
(1.08,
1.21)*1.15
(1.09,
1.22)*1.15
(1.09,
1.21)*1.13
(1.08,
1.19)*1.11
(1.06,
1.16)*1.08
(1.03,
1.13)*1.05
(1,
1.11)*75.98 0.97
(0.93,
1.02)1.01
(0.97,
1.05)1.05
(1.01,
1.09)*1.08
(1.04,
1.13)*1.11
(1.06,
1.16)*1.13
(1.07,
1.19)*1.14
(1.08,
1.19)*1.13
(1.08,
1.19)*1.12
(1.07,
1.17)*1.1
(1.05,
1.14)*1.07
(1.03,
1.12)*1.04
(1,
1.09)*76.98 0.97
(0.94,
1.01)1.00
(0.97,
1.03)1.03
(1,
1.06)*1.05
(1.02,
1.08)*1.07
(1.04,
1.11)*1.09
(1.05,
1.13)*1.09
(1.05,
1.13)*1.09
(1.05,
1.13)*1.08
(1.05,
1.11)*1.07
(1.04,
1.1)*1.05
(1.02,
1.08)*1.03
(1,
1.07)*77.98 0.99
(0.97,
1.00)1.00
(0.99,
1.01)1.01
(1,
1.02)*1.02
(1.01,
1.04)*1.03
(1.01,
1.05)*1.04
(1.02,
1.05)*1.04
(1.02,
1.06)*1.04
(1.02,
1.06)*1.04
(1.02,
1.05)*1.03
(1.02,
1.04)*1.02
(1.01,
1.04)*1.02
(1,
1.03)*78.98 1
(1, 1)1
(1, 1)1
(1, 1)1
(1, 1)1
(1, 1)1
(1, 1.01)1
(1, 1.01)1
(1, 1.01)1
(1, 1.01)1
(1, 1)1
(1, 1)1
(1, 1)79.98 1.00
(0.99,
1.01)1.00
(0.99,
1.01)1.00
(1.00,
1.01)1.00
(1.00,
1.01)1.00
(1.00,
1.1)*1.00
(1,
1.01)*1.00
(0.99,
1.01)1
(0.99,
1.01)1.00
(0.99,
1.00)1.00
(0.99,
1.00)0.99
(0.99,
1.00)0.99
(0.98,
1.00)80.98 0.99
(0.97,
1.02)1.00
(0.98,
1.02)1.01
(1.00,
1.03)1.02
(1.00,
1.04)1.02
(1.01,
1.04)*1.03
(1.01,
1.05)*1.03
(1.01,
1.04)*1.02
(1,
1.04)1.01
(1.00,
1.03)1.00
(0.99,
1.02)0.99
(0.97,
1.01)0.98
(0.96,
1.00)81.98 0.98
(0.95,
1.02)1.00
(0.97,
1.03)1.02
(1,
1.05)1.04
(1.01,
1.06)*1.05
(1.02,
1.08)*1.06
(1.03,
1.08)*1.05
(1.03,
1.08)*1.04
(1.02,
1.07)1.03
(1.01,
1.05)1.01
(0.99,
1.03)0.99
(0.96,
1.02)0.97
(0.93,
1.00)82.98 0.97
(0.93,
1.02)1.00
(0.97,
1.04)1.03
(1,
1.06)1.05
(1.02,
1.08)*1.06
(1.03,
1.09)*1.07
(1.04,
1.1)*1.07
(1.04,
1.1)*1.06
(1.03,
1.08)1.03
(1.01,
1.06)1.01
(0.98,
1.03)0.98
(0.95,
1.01)0.95
(0.91,
0.98)83.98 0.96
(0.92,
1.01)0.99
(0.96,
1.03)1.02
(0.99,
1.05)1.05
(1.02,
1.08)*1.07
(1.04,
1.1)*1.08
(1.04,
1.11)*1.07
(1.04,
1.1)*1.05
(1.02,
1.08)1.03
(1.00,
1.06)0.99
(0.97,
1.02)0.96
(0.92,
0.99)0.92
(0.88,
0.97)84.98 0.95
(0.9,
1.01)0.99
(0.94,
1.03)1.02
(0.98,
1.05)1.04
(1.01,
1.08)*1.06
(1.03,
1.1)*1.07
(1.03,
1.11)*1.06
(1.02,
1.1)*1.04
(1.01,
1.08)1.01
(0.98,
1.05)0.98
(0.94,
1.02)0.93
(0.89,
0.99)0.89
(0.83,
0.96)85.98 0.94
(0.88,
1.02)0.98
(0.92,
1.03)1.01
(0.96,
1.06)1.04
(0.99,
1.08)1.05
(1,
1.1)*1.06
(1.01,
1.12)*1.05
(1.00,
1.11)1.03
(0.98,
1.08)0.99
(0.94,
1.05)0.95
(0.9,
1.01)0.91
(0.84,
0.98)0.86
(0.79,
0.95)Note. *P-value<0.05, and RH is the monthly average relative humidity. Table S8. The RR (95% CI) of monthly average relative humidity on the PTB incidence at different lag months
Figure 3E shows a significant cumulative RR when the relative humidity is above 71.00%, with the maximum reached at 74.24% relative humidity (RR = 2.93, 95% CI: 1.71–5.01). A relative humidity of 74.24% resulted in a significant cumulative RR in different lag periods, except for the 0–3 lag months (Supplementary Table S6). A relative humidity of 73.00% resulted in a significant RR at lags of 1–11 months, whereas 74.24% relative humidity resulted in a significant RR at lags of 2–11 months (Supplementary Table S7). As evident in Figures 3F and 3G, the risk effects on the incidence of PTB first increased and then decreased with increase in the lag time. The delayed risk effect of 74.24% relative humidity on the incidence of PTB peaked at lag 6 (RR = 1.15, 95% CI: 1.09–1.22). Figure 3H shows that an average relative humidity of between 72.60% and 77.49% had significant risk effects at lag 7. With an increase in relative humidity, the RR first increased and then decreased, peaking at 74.24% relative humidity.
The model showed that a low average temperature and low average relative humidity do not have significant risk effects on the incidence of PTB in the same period, but there were significant risk effects after 2 months and 1 month, respectively, which peaked after 7 and 6 months, respectively. These results suggest that we should be vigilant and strengthen infection prevention and control measures after incidences of low mean temperature and relative humidity conditions.
This study had several limitations. First, considering the impact of corona virus disease 2019 after 2019, we fitted the model with data from 2018 and before. Second, the model did not take into account confounding factors such as air pollution and the interactions among factors, which may lead to a certain bias. Third, the sample of monthly data may be limited for evaluating the risk effects in the short term.
No potential conflicts of interest were disclosed.
Weixia Li proposed concepts, analyzed the data, and wrote the manuscript. Xiaodan Wang managed and analyzed data. Bo Bi performed software visualization. Jingjing Lu searched for and investigated resources. Zhengyuan Li performed data curation. Li Cao proposed concepts and methodology and participated in the review and editing of the manuscript. Hao Zhang proposed concepts, performed project administration and supervision, and participated in the review and editing of the manuscript.
-
The study described in this article did not involve any experiments conducted on human participants or animals by any of the authors.
-
Factors Monthly PTB
incidenceMonthly average
temperatureMonthly average
air pressureMonthly average
relative humidityMonthly average
precipitationMonthly PTB incidence 1 0.24* −0.26* 0.15* 0.21* Monthly average temperature 1 −0.71* 0.50* 0.81* Monthly average air pressure 1 −0.26* −0.58* Monthly average relative humidity 1 0.60* Monthly average precipitation 1 Note. *P < 0.05. Table S2. Spearman correlation coefficient between monthly PTB incidence and meteorological factors in Hainan, 2004—2018
TM
(°C)lag0 lag1 lag2 lag3 lag4 lag5 lag6 lag7 lag8 lag9 lag10 lag11 lag12 lag13 17 1.08
(0.91, 1.29)1.16
(0.99, 1.35)1.24
(1.07, 1.44)*1.32
(1.13, 1.55)*1.4
(1.18, 1.66)*1.46
(1.21, 1.76)*1.51
(1.24, 1.84)*1.53
(1.25, 1.87)*1.53
(1.26, 1.86)*1.51
(1.25, 1.81)*1.47
(1.24, 1.75)*1.43
(1.21, 1.68)*1.37
(1.17, 1.61)*1.32
(1.11, 1.56)*18 1.06
(0.92, 1.23)1.12
(0.99, 1.27)1.18
(1.05, 1.33)*1.24
(1.09, 1.41)*1.29
(1.13, 1.49)*1.34
(1.15, 1.56)*1.37
(1.17, 1.62)*1.39
(1.18, 1.64)*1.39
(1.18, 1.64)*1.38
(1.18, 1.61)*1.36
(1.18, 1.57)*1.33
(1.16, 1.53)*1.3
(1.13, 1.49)*1.26
(1.09, 1.46)*19 1.05
(0.93, 1.19)1.09
(0.98, 1.21)1.13
(1.02, 1.25)*1.17
(1.05, 1.30)*1.2
(1.07, 1.35)*1.23
(1.08, 1.41)*1.26
(1.09, 1.45)*1.27
(1.10, 1.47)*1.28
(1.11, 1.47)*1.27
(1.11, 1.46)*1.26
(1.11, 1.43)*1.25
(1.1, 1.41)*1.23
(1.09, 1.39)*1.21
(1.06, 1.38)*20 1.03
(0.92, 1.16)1.06
(0.96, 1.17)1.08
(0.98, 1.19)1.11
(1.00, 1.22)*1.13
(1.01, 1.26)*1.15
(1.01, 1.29)*1.16
(1.02, 1.32)*1.17
(1.03, 1.34)*1.18
(1.03, 1.34)*1.18
(1.04, 1.34)*1.18
(1.05, 1.33)*1.17
(1.05, 1.32)*1.17
(1.04, 1.30)*1.16
(1.03, 1.31)*21 1.02
(0.92, 1.14)1.03
(0.94, 1.14)1.05
(0.95, 1.15)1.06
(0.96, 1.17)1.07
(0.96, 1.19)1.08
(0.96, 1.21)1.09
(0.96, 1.23)1.09
(0.97, 1.24)1.1
(0.97, 1.24)1.11
(0.98, 1.24)1.11
(0.99, 1.24)1.11
(1.00, 1.24)*1.12
(1.00, 1.24)*1.12
(1.00, 1.25)*22 1.01
(0.92, 1.11)1.02
(0.93, 1.11)1.02
(0.94, 1.11)1.02
(0.93, 1.12)1.03
(0.93, 1.13)1.03
(0.93, 1.14)1.04
(0.93, 1.16)1.04
(0.93, 1.16)1.05
(0.94, 1.17)1.05
(0.95, 1.17)1.06
(0.96, 1.17)1.07
(0.97, 1.17)1.08
(0.98, 1.18)1.08
(0.98, 1.20)23 1.01
(0.94, 1.08)1.00
(0.94, 1.07)1.00
(0.94, 1.07)1.00
(0.94, 1.08)1.00
(0.93, 1.08)1.00
(0.93, 1.09)1.01
(0.93, 1.09)1.01
(0.93, 1.10)1.02
(0.94, 1.10)1.02
(0.95, 1.10)1.03
(0.96, 1.11)1.04
(0.97, 1.11)1.04
(0.98, 1.12)1.05
(0.98, 1.13)24 1
(0.96, 1.04)1.00
(0.97, 1.04)1.00
(0.96, 1.03)1.00
(0.96, 1.03)1.00
(0.96, 1.04)1.00
(0.95, 1.04)1.00
(0.95, 1.04)1.00
(0.96, 1.04)1.00
(0.96, 1.05)1.01
(0.96, 1.05)1.01
(0.97, 1.05)1.01
(0.98, 1.05)1.02
(0.98, 1.06)1.03
(0.99, 1.07)25 1
(1, 1)1
(1, 1)1
(1, 1)1
(1, 1)1
(1, 1)1
(1, 1)1
(1, 1)1
(1, 1)1
(1, 1)1
(1, 1)1
(1, 1)1
(1, 1)1
(1, 1)1
(1, 1)26 1.00
(0.97, 1.03)1.00
(0.97, 1.03)1.01
(0.98, 1.04)1.01
(0.98, 1.04)1.01
(0.98, 1.04)1.01
(0.98, 1.05)1.01
(0.97, 1.05)1.01
(0.97, 1.05)1.01
(0.97, 1.04)1.00
(0.97, 1.04)1.00
(0.96, 1.03)0.99
(0.96, 1.02)0.98
(0.95, 1.01)0.98
(0.95, 1.01)27 1.00
(0.94, 1.06)1.01
(0.95, 1.06)1.01
(0.96, 1.07)1.02
(0.97, 1.08)1.02
(0.97, 1.08)1.03
(0.97, 1.09)1.03
(0.96, 1.09)1.02
(0.96, 1.09)1.01
(0.95, 1.08)1.01
(0.95, 1.07)0.99
(0.94, 1.05)0.98
(0.93, 1.04)0.97
(0.91, 1.02)0.95
(0.9, 1.01)28 1.00
(0.92, 1.08)1.01
(0.94, 1.08)1.02
(0.96, 1.09)1.03
(0.97, 1.10)1.04
(0.97, 1.11)1.04
(0.97, 1.12)1.04
(0.97, 1.12)1.03
(0.96, 1.11)1.02
(0.95, 1.10)1.01
(0.94, 1.08)0.99
(0.92, 1.06)0.97
(0.9, 1.04)0.95
(0.88, 1.02)0.92
(0.85, 1.00)29 1.00
(0.9, 1.10)1.01
(0.93, 1.10)1.03
(0.95, 1.11)1.04
(0.97, 1.11)1.05
(0.98, 1.12)1.05
(0.98, 1.13)1.05
(0.98, 1.13)1.04
(0.97, 1.12)1.03
(0.95, 1.11)1.01
(0.93, 1.09)0.98
(0.91, 1.06)0.95
(0.88, 1.04)0.92
(0.84, 1.02)0.9
(0.81, 1.00)30 1.00
(0.87, 1.13)1.01
(0.91, 1.13)1.03
(0.94, 1.13)1.05
(0.97, 1.13)1.06
(0.98, 1.14)1.06
(0.98, 1.15)1.06
(0.98, 1.15)1.05
(0.96, 1.14)1.03
(0.94, 1.12)1.00
(0.92, 1.10)0.97
(0.88, 1.07)0.94
(0.84, 1.04)0.9
(0.8, 1.02)0.87
(0.75, 1.00)Note. *P-value < 0.05, and TM is the monthly average temperature. Table S5. The RR (95% CI) of monthly average temperature on the PTB incidence at different lag months
Average temperature (°C) Average relative humidity (%) Lag Value RR (95% CI) Lag Value RR (95% CI) lag0-3 17 2.06 (1.13, 3.74)* lag0-3 73.00 1.28 (1.05, 1.57)* lag0-6 17 6.32 (2.22, 18.01)* lag0-6 73.00 1.79 (1.26, 2.53)* lag0-9 17 22.31 (4.85, 102.70)* lag0-9 73.00 2.40 (1.49, 3.87)* lag0-13 17 85.01 (12.11, 596.83)* lag0-11 73.00 2.72 (1.58, 4.67)* lag0-3 18.09 1.73 (1.08, 2.77)* lag0-3 74.24 1.20 (0.99, 1.45) lag0-6 18.09 4.02 (1.76, 9.15)* lag0-6 74.24 1.79 (1.28, 2.50)* lag0-9 18.09 10.51 (3.12, 35.40)* lag0-9 74.24 2.56 (1.60, 4.10)* lag0-13 18.09 30.64 (6.28, 149.50)* lag0-11 74.24 2.93 (1.71, 5.01)* Note. *P-value < 0.05. Table S6. The cumulative RRs (95% CI) of monthly average temperature and monthly average relative humidity on the PTB incidence by different lag period
Lag Average temperature (°C) Average relative humidity (%) 17.00 18.09 73.00 74.24 lag0 1.08 (0.91, 1.29) 1.06 (0.92, 1.22) 1.03 (0.98, 1.09) 0.99 (0.94, 1.05) lag1 1.16 (0.99, 1.35) 1.12 (0.99, 1.27) 1.05 (1.00, 1.11)* 1.03 (0.98, 1.08) lag2 1.24 (1.07, 1.44)* 1.18 (1.05, 1.32)* 1.08 (1.02, 1.13)* 1.07 (1.02, 1.12)* lag3 1.32 (1.13, 1.55)* 1.23 (1.09, 1.39)* 1.09 (1.04, 1.15)* 1.10 (1.05, 1.16)* lag4 1.40 (1.18, 1.66)* 1.29 (1.12, 1.47)* 1.11 (1.05, 1.17)* 1.13 (1.07, 1.19)* lag5 1.46 (1.21, 1.76)* 1.33 (1.14, 1.54)* 1.12 (1.06, 1.18)* 1.14 (1.08, 1.21)* lag6 1.51 (1.24, 1.84)* 1.36 (1.16, 1.60)* 1.12 (1.06, 1.18)* 1.15 (1.09, 1.22)* lag7 1.53 (1.25, 1.87)* 1.38 (1.17, 1.62)* 1.12 (1.06, 1.17)* 1.15 (1.08, 1.21)* lag8 1.53 (1.26, 1.86)* 1.38 (1.18, 1.62)* 1.11 (1.05, 1.16)* 1.13 (1.07, 1.19)* lag9 1.51 (1.25, 1.81)* 1.37 (1.18, 1.60)* 1.09 (1.04, 1.14)* 1.11 (1.06, 1.16)* lag10 1.47 (1.24, 1.75)* 1.35 (1.17, 1.56)* 1.07 (1.02, 1.12)* 1.08 (1.03, 1.13)* lag11 1.43 (1.21, 1.68)* 1.32 (1.16, 1.52)* 1.05 (1.00, 1.11)* 1.05 (1.00, 1.11)* lag12 1.37 (1.17, 1.61)* 1.29 (1.13, 1.48)* − − lag13 1.32 (1.11, 1.56)* 1.26 (1.09, 1.46)* − − Note. *P-value < 0.05. Table S7. The RRs (95% CI) of monthly average temperature and monthly average relative humidity on the PTB incidence at different lag months
HTML
 24058+Supplementary Materials.pdf
|

|

 Quick Links
 DownLoad: