


-
Neurological disorders, including headaches (tension-type headaches, medication-overuse headaches, and migraines) and dementias that include Alzheimer’s disease, are among the most prevalent and debilitating global conditions. In 2016, these disorders affected 276 million people worldwide and were the second leading cause of death that year[1]. This highlights the urgent need for effective prevention, treatment, and support strategies. The etiology of neurological disorders is multifaceted and involves genetic, environmental, physiological, and social factors[2].
Recent studies have identified ambient air pollution as a major risk factor for neurological disorders. For instance, research conducted on a Canadian urban population demonstrated a link between ambient air pollution and an increase in emergency department visits for neurological disorders, particularly paroxysmal diagnoses[3]. Additionally, both extremely high and low temperatures contribute to increased mortality owing to neurological disorders. Temperature often acts as a confounding factor in studies examining the health effects of air pollution, and vice versa.
The synergistic effects of the ambient temperature and air pollution on neurological conditions remain poorly understood. Existing research has primarily focused on individual neurological conditions and produced inconsistent results. Comprehensive studies of the combined effects of ambient temperature and air pollution on a broad range of neurological disorders are limited.
This study aimed to assess whether ambient temperature modifies the effects of nitrogen dioxide (NO2) on first-aid for neurological disorders. A subgroup analysis sought to identify sensitive populations.
Shenzhen, located in the Pearl River Delta region with a low-latitude subtropical monsoon climate, is a densely populated first-tier city, making it an ideal location for studying the interactions between NO2 and temperature, considering its population characteristics, geography, and urban development.
Data on daily first-aid cases between 01 January 2013 and 31 December 2020 were provided by the Shenzhen Center for Disease Control and Prevention. We extracted individual-level data for the neurological disease outcome groups (G00–G99) according to the International Classification of Diseases, 10th revision. First-aid records were categorized according to sex and age (individuals < 65 and ≥ 65 years of age).
Data on air pollutants, including NO2, inhalable particulate matter (PM2.5 and PM10), and sulfur dioxide (SO2), were collected from seven environmental monitoring stations located in different administrative districts of Shenzhen. The Shenzhen Meteorological Service Centre provided meteorological information on temperature and humidity. The data included daily average values of temperature and relative humidity. These values were calculated as the average of four values based on hourly measurements taken at 02:00, 08:00, 14:00, and 20:00 h each day to ensure a comprehensive representation of the daily meteorological conditions. Temperatures were stratified into high and low levels, with the cutoff value defined as the median temperature[4]. The cold and warm seasons were defined as the periods from November to April and from May to October, respectively[5].
Based on previous studies on neurological disorders and air pollutants, we expected the impact of air pollutants on neurological disorders to persist for approximately one week[6]. Accordingly, we employed the following quasi-Poisson regression model to control for overdispersion:
$$ \begin{aligned} \text{log} \left[E\left({Y}_{t}\right)\right]=\; & \alpha +\beta {NO}_{2t,l}+ns\left(Time,df\right)+ns\left(Temp,3\right)\\ & +ns\left(Humid,3\right)+\gamma Holiday+\gamma DOW \end{aligned} $$ (1) where $ E\left({Y}_{t}\right) $ represents the expected number of emergency cases at a time (variable t); α is the intercept; $ \beta {NO}_{2t,l} $ signifies the cross-basis constructs designed to calculate the linear effects of air pollutants; $ l $ is the number of lag days; $ \beta $ is the coefficient vector for $ {NO}_{2t,l} $.
A natural cubic spline function was utilized to capture lag effects, and a linear function was adopted to depict the exposure-response trajectory for the correlation between air pollutants and the occurrence of first-aid cases. In the above-mentioned equation, ns (Temp, 3) and ns (Humid, 3) represent natural spline functions indicating the intraday temperature and humidity, respectively; DOW denotes the day of the week with its regression coefficient $ \gamma $; Holiday is a binary variable indicating a public holiday.
To compare the relative influence of air pollutants, we quantified the rise in the number of first-aid instances for neurological diseases as the percentage increased, which was calculated using the formula (RR-1) ×100% for every 10 μg/m3 increase in NO2 concentration.
Parametric stratification models were integrated with generalized additive models to estimate the interactive effects of NO2 and temperature on neurological disorders. To analyze the lag effects of NO2, we employed a moving average approach, considering that the effects of NO2 typically persist for several days. Using a moving average, lag effect (lag0–2, lag0–4, and lag0–6) was deemed appropriate for capturing the lagged effect. The formula for this model is as follows:
$$ \begin{split} \text{log}\left[E\left({Y}_{t}|X\right)\right]=\;& \alpha +{\beta }_{1}{NO}_{2}+{\beta }_{2}{Temp}_{k}+{\beta }_{3}({NO}_{2}:{Temp}_{k})\;+\\ & ns\left(Time,df\right)+ns\left(Temp,3\right)+ns\left(Humid,3\right)\\ &+\gamma Holiday+\gamma DOW \end{split}$$ (2) where $ {Temp}_{k} $ represents the temperature on the current day, $ {\beta }_{1} $, $ {\beta }_{2} $ and $ {\beta }_{3} $ denote the main effects of NO2 and ambient temperature on neurological disorders and the interactive effects of the two factors, respectively. The estimated effects of NO2 on days with low temperature can be denoted as $ {\beta }_{1} $, while $ {\beta }_{1} $ + $ {\beta }_{3} $ represents the effects of NO2 on days with high temperature.
To estimate the covariance intervals, we used a method incorporating pollutant coefficients, pollutant covariance, and interaction terms, expressed as:
$$ \widehat{{Q}_{1}}-\widehat{{Q}_{2}}\pm \sqrt{{\widehat{{SE}_{1}}}^{2}+{\widehat{{SE}_{2}}}^{2}} $$ (3) where $ \widehat{{Q}_{1}} $ and $ \widehat{{Q}_{2}} $ are the estimates of the two categories and $ \widehat{{SE}_{1}} $ and $ \widehat{{SE}_{2}} $ are their respective standard errors.
To test the stability of the seasonal adjustment models, sensitivity analyses of ambient air pollution were performed by varying the maximum number of lag days of ambient air pollution. To mitigate the potential confounding effects of other ambient pollutants, additional co-pollutants were incorporated into both the seasonally stratified and temperature-stratified models. This enabled the fitting of a two-pollutant model, thus addressing the potential confounding effects. To prevent bias from the possible prolonged effects of cold temperature on the nervous system, a 14-day moving average and cross-lagged nonlinear treatments were applied to the models in seasonal stratification. The cutoff values for temperature stratification were adjusted accordingly. We included a binary variable in our model to indicate whether the period was affected by the pandemic, defining 23rd January 2020 to 31st December 2020 as the pandemic period.
All analyses were performed using R version 4.2.2 with the dlnm and mgcv packages.
Table 1 displays data on environmental pollutants, meteorological conditions, and the daily incidence of emergencies related to neurological diseases in Shenzhen between 2013 and 2020. The average number of daily first-aid cases per year was 25. The average values for the cold and warm seasons were 24 and 26, respectively. The average temperature values for the two temperature levels were 24 °C and 26 °C, respectively. The average concentration of NO2 was 39.42 and 29.55 μg/m3 during the cold and warm seasons, respectively. Considering the median daily air temperature of 24.70 °C, NO2 concentrations in the low- and high-temperature layers were 39.24 and 29.72 μg/m3, respectively. Additional statistical characteristics are presented in Table 1.
Variables Sum Min P25 M P75 Max x s IQR Weather parameters Mean temperature (°C) Full year 3.50 19.60 24.70 28.10 33.00 23.55 5.30 8.50 Cold season 3.50 16.60 19.60 22.40 28.00 19.30 4.03 5.80 Warm season 18.80 26.50 28.10 29.40 33.00 27.76 2.09 2.90 Low temperature 3.50 16.60 19.60 22.20 24.60 19.10 3.76 5.60 High temperature 24.70 26.60 28.10 29.40 33.00 27.97 1.68 2.80 Relative humidity (%) Full year 19.00 70.00 78.00 84.00 100.00 75.73 12.88 14.00 Cold season 19.00 65.00 75.00 83.00 100.00 72.63 14.55 18.00 Warm season 34.00 73.00 80.00 86.00 100.00 78.80 10.09 13.00 Low temperature 19.00 64.00 74.50 83.00 100.00 72.09 14.99 19.00 High temperature 39.00 74.00 80.00 85.00 100.00 79.35 9.03 11.00 Daily air pollutant components NO2 (μg/m3) Full year 6.73 23.73 31.40 41.11 139.40 34.46 16.17 17.38 Cold season 9.55 26.98 35.23 48.00 139.40 39.42 18.49 21.02 Warm season 6.73 21.16 27.71 35.87 83.80 29.55 11.56 14.71 Low temperature 9.55 26.45 35.25 48.00 139.40 39.24 18.58 21.55 High temperature 6.73 21.45 28.00 35.83 83.80 29.72 11.55 14.38 Daily onset counts All Full year 79,853 4 19 25 35 69 27 11 16 Cold season 38,608 4 18 24 34 69 27 11 16 Warm season 41,245 5 20 26 35 64 28 11 15 Low temperature 38,784 4 18 24 34 69 27 11 16 High temperature 41,069 5 20 26 35 64 28 11 15 Female Full year 32,216 0 7 10 14 31 11 5 7 Cold season 15,487 0 7 10 14 31 11 6 7 Warm season 16,729 0 7 11 15 30 11 5 8 Low temperature 15,563 0 7 10 14 31 11 6 7 High temperature 16,653 0 7 11 14 30 11 5 7 Male Full year 47,622 2 11 15 21 40 16 7 10 Cold season 23,114 2 11 15 20 40 16 7 9 Warm season 24,508 3 12 16 21 38 17 7 9 Low temperature 23,212 2 11 15 20 40 16 7 9 High temperature 24,410 3 12 16 21 38 17 7 9 Age < 65 years Full year 69,270 3 17 23 30 56 24 9 13 Cold season 32,966 4 16 22 28 56 23 9 12 Warm season 36,304 3 18 24 31 56 25 9 13 Low temperature 33,106 4 16 22 28 56 23 9 12 High temperature 36,164 3 18 24 31 56 25 9 13 Age ≥ 65 years Full year 10,583 0 1 3 5 21 4 3 4 Cold season 5,642 0 1 3 5 21 4 4 4 Warm season 4,941 0 1 2 5 17 3 3 4 Low temperature 5,678 0 1 3 5 21 4 4 4 High temperature 4,905 0 1 2 5 17 3 3 4 Note. NO2, nitrogen dioxide; Sum, total number; Min, minimum; M, median; Max, maximum; s, standard deviation; x, daily mean temperature; IQR, interquartile range. Table 1. Summary statistics for air pollution, weather parameters, and first-aid volume of neurological diseases stratified by season and temperature in Shenzhen, 2013–2020
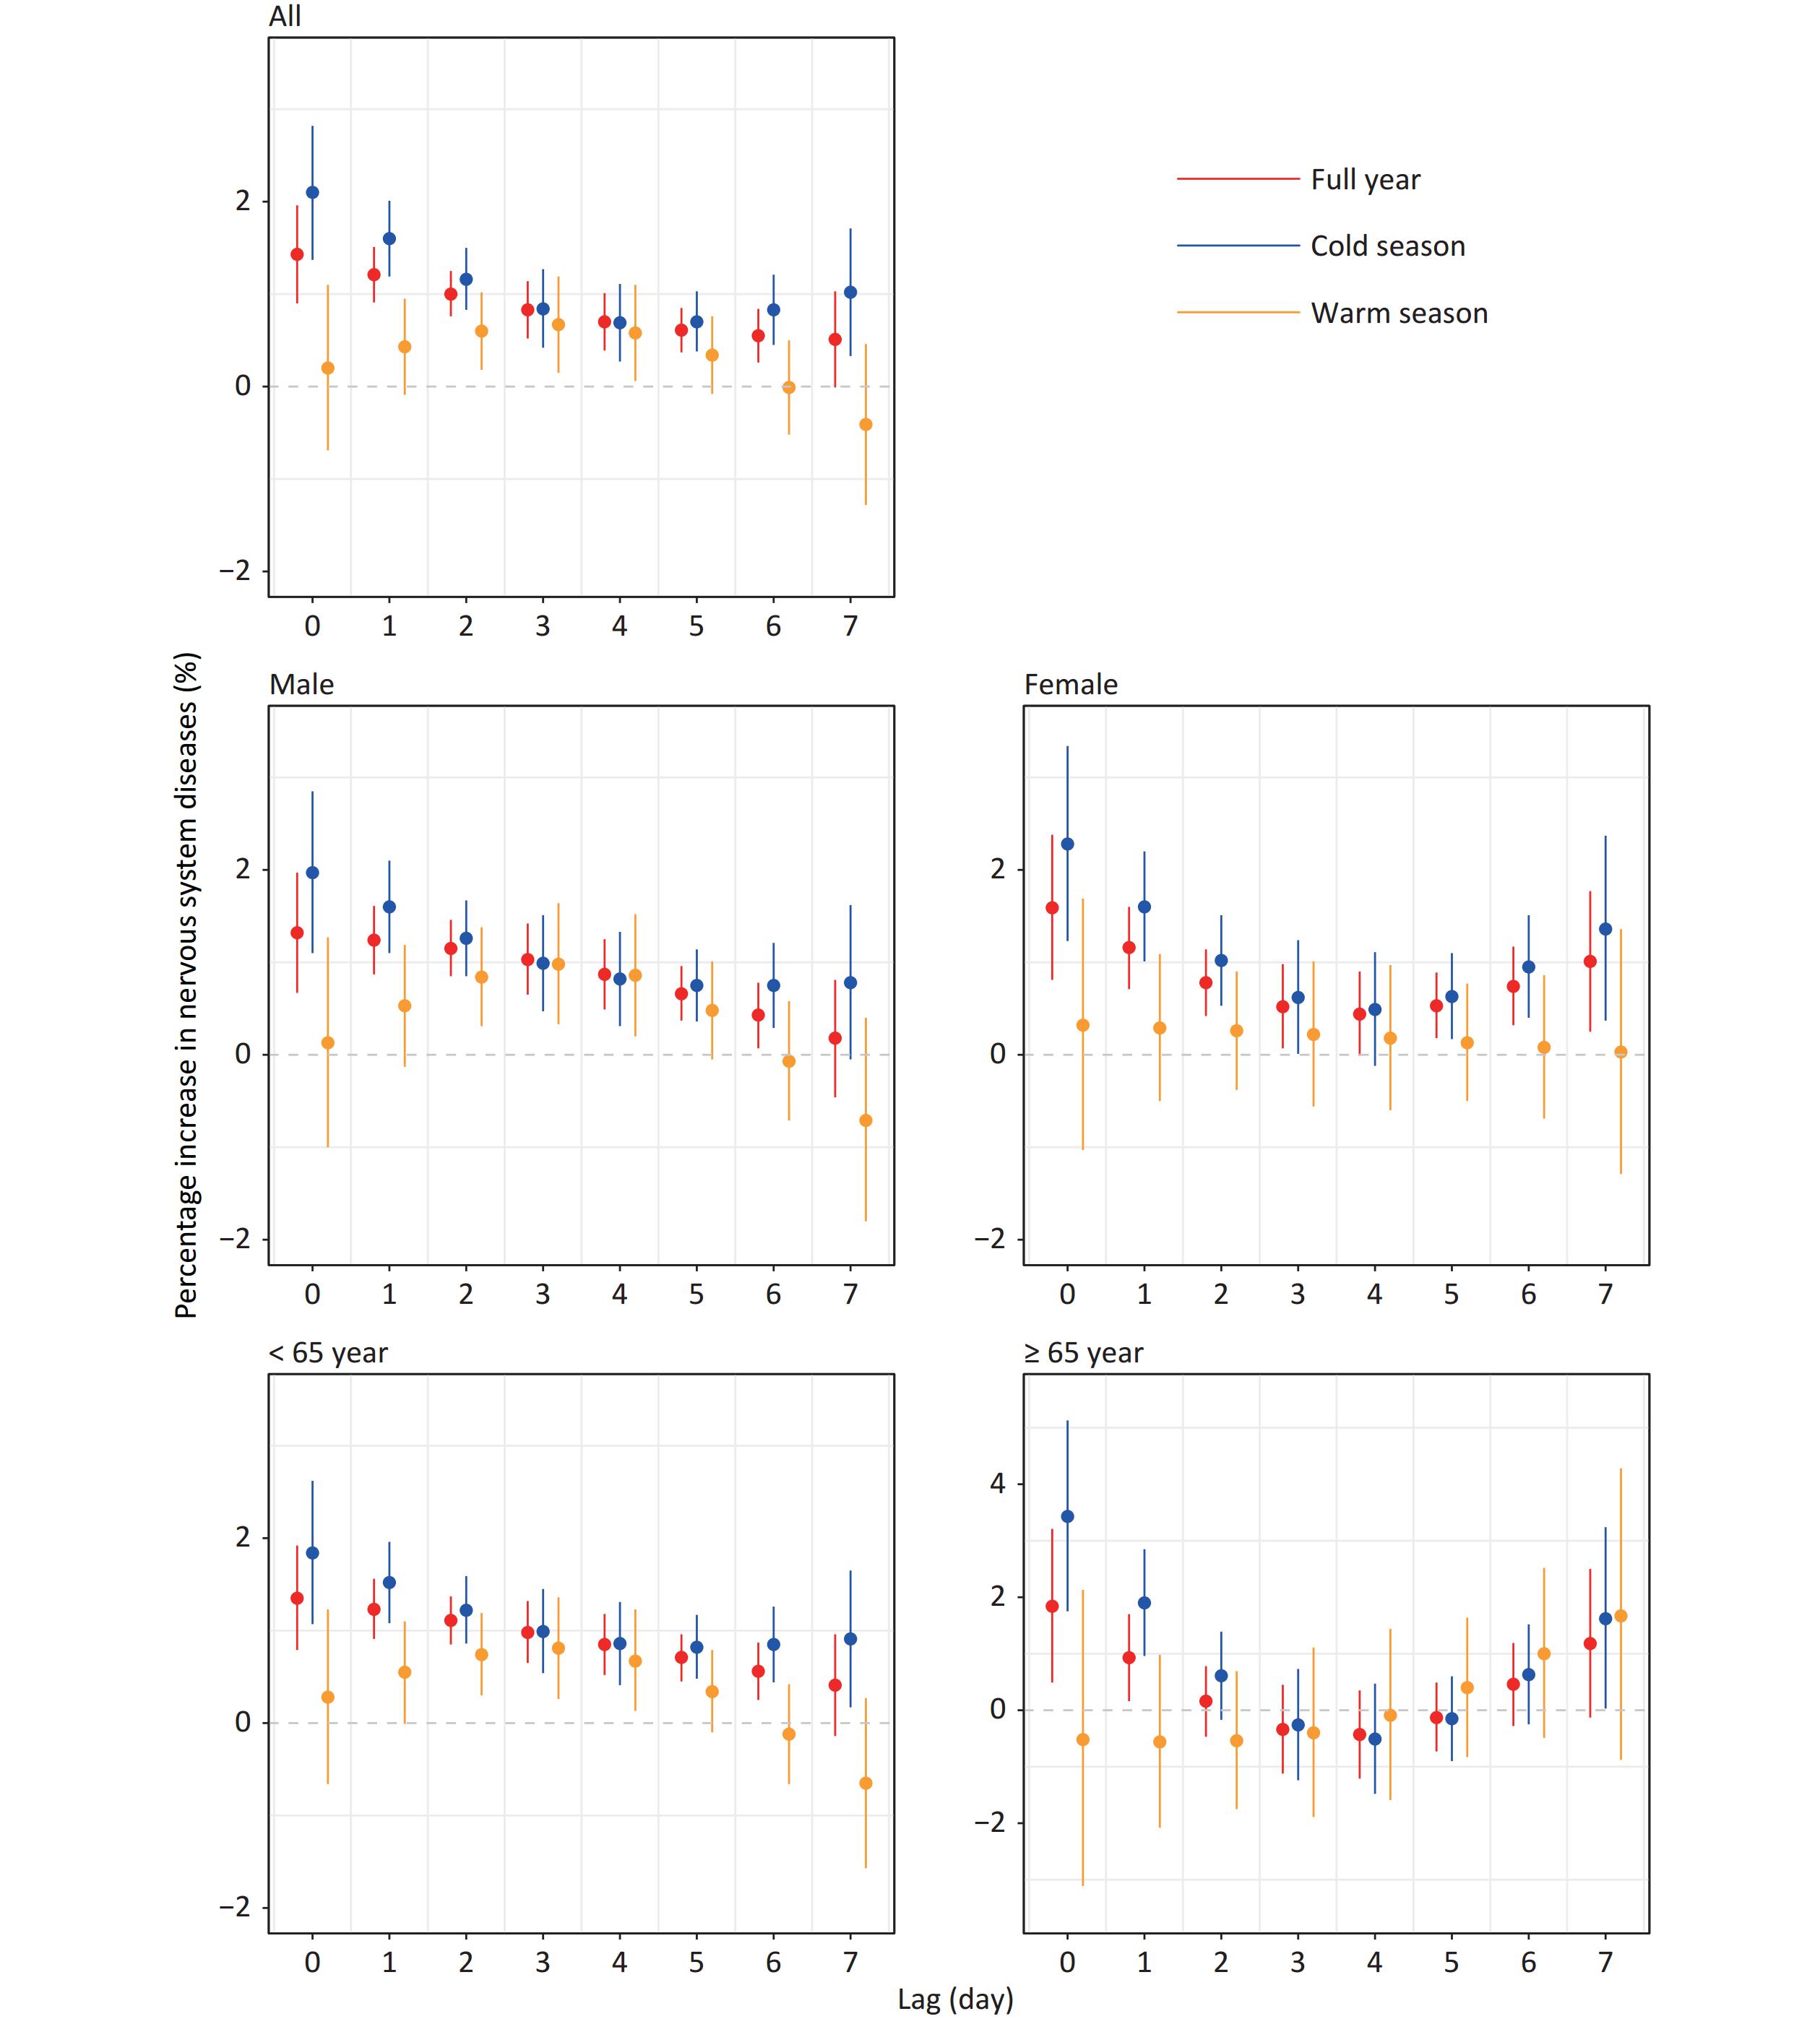
The percentage increase in neurological disease emergencies due to NO2 concentrations surpassed zero for each single-day lags (lag0–6) throughout the year (Figure 1). During the cold season, the percentage increase in first-aid cases owing to NO2 concentrations exceeded that during the warm season. This increase was particularly notable in the female and elderly groups, mainly at short-term lags (lag0 and lag1). Conversely, during the warm season, the observed percentage increase was marginally above 0 in the overall population, with the male group and those < 65 years of age exhibiting significant effects at single-day lags (lag2, lag3, and lag4); the rest showed no significant effects. Females and young adults were at a higher risk of exposure than the other groups. Studies have explored sex-based differences in neurological disorders from a physiological standpoint. For instance, exposure to sex-specific events, such as pregnancy, has been linked to an increased risk of a certain type of multiple sclerosis[7]. In contrast to the findings of most previous studies, we found that younger individuals were more susceptible to NO2 pollution during low temperature conditions and cold seasons than were older individuals (≥ 65 years). Young people often spend more time outdoors, thereby increasing their exposure to unfavorable factors such as air pollution.
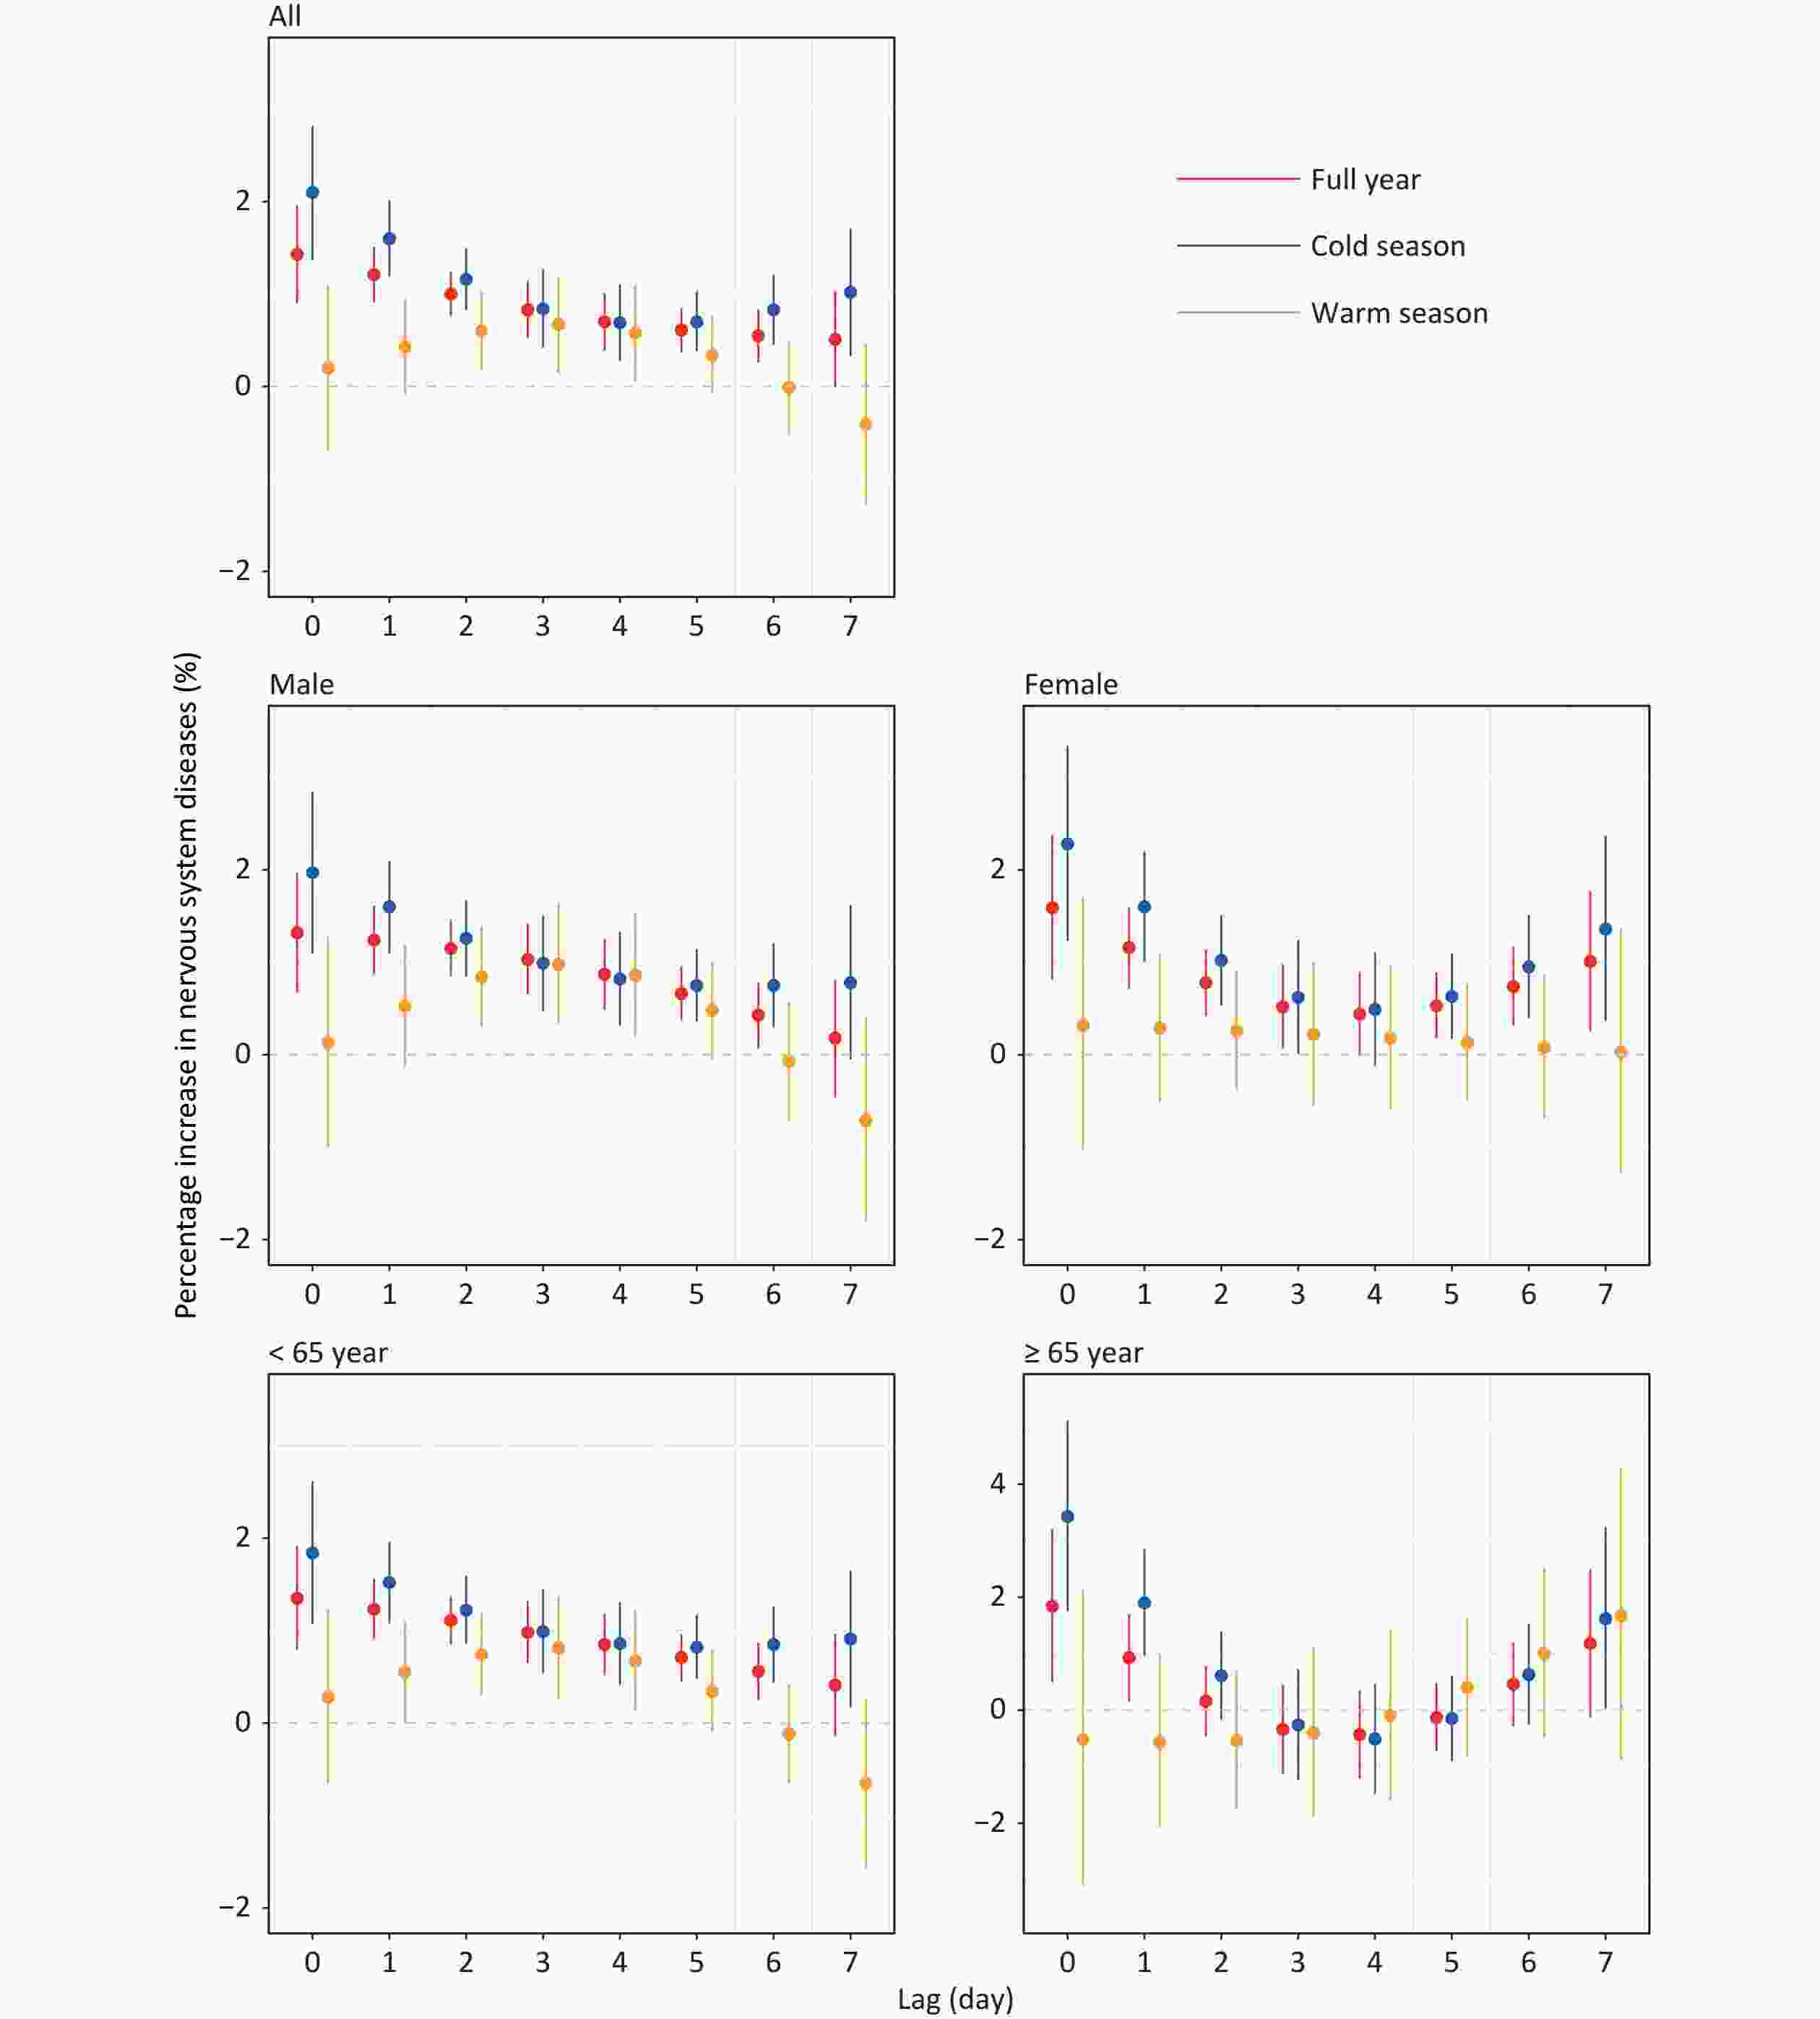
Figure 1. Distributed lag analysis of seasonal-adjusted NO2 impacts on neurological emergencies per 10 μg/m3 rise.
We investigated the seasonal stratification of the effects of ambient air pollutants, focusing on the cumulative percentage increase in first-aid cases for neurological diseases. As shown in Table 2, throughout the period of one year, the effect of NO2 was significant in all populations and subgroups of lag0–2, lag0–4, and lag0–6, except for lag0–4 and lag0–6 in those ≥ 65 years of age. The effects of NO2 during the cold season resulted in a significant increase in the number of neurological disease emergencies than that during the warm season for the total population as well as for both the sex subgroups in all lag periods. Seasonal analysis showed that elevated NO2 concentrations were positively correlated with the number of neurological emergencies. Additionally, we observed a significant impact of air pollution on the onset of neurological diseases in winter.
Group Season/temperature Percentage increase in death (95% CI)b Lag0–2 Lag0–4 Lag0–6 Alla Full year 3.68 (2.74, 4.63)* 5.27 (4.16, 6.39)* 6.50 (5.27, 7.74)* Cold season 4.94 (3.64, 6.25)† 6.55 (5.02, 8.12)† 8.20 (6.50, 9.92)† Warm season 1.23 (0.36, 2.85) 2.50 (0.60, 4.44) 2.83 (0.67, 5.04) Low temperature 4.43 (3.30, 5.57)† 5.40 (4.06, 6.75)† 6.22 (4.70, 7.77)† High temperature 1.47 (0.12, 3.08) 2.52 (0.67, 4.41) 3.02 (0.97, 5.10) Female Full year 3.57 (2.19, 4.97)* 4.57 (2.95, 6.22)* 5.91 (4.11, 7.74)* Cold season 4.99 (3.11, 6.89)† 6.16 (3.95, 8.43)† 7.85 (5.40, 10.35)† Warm season 0.88 (1.53, 3.35) 1.29 (1.57, 4.22) 1.50 (1.75, 4.87) Low temperature 5.04 (3.47, 6.63)† 5.82 (3.97, 7.71)† 6.97 (4.86, 9.13)† High temperature 0.04 (2.13, 2.27) 0.19 (2.72, 2.40) 0.26(2.53, 3.13) Male Full year 3.76 (2.61, 4.93)* 5.75 (4.38, 7.13)* 6.90 (5.39, 8.43)* Cold season 4.90 (3.34, 6.48)† 6.80 (4.94, 8.70)† 8.41 (6.36, 10.50)† Warm season 1.50 (0.52, 3.57) 3.38 (0.96, 5.87) 3.81 (1.04, 6.64) Low temperature 4.71 (3.34, 6.10)† 5.97 (4.37, 7.60) 6.85 (5.04, 8.70) High temperature 2.07 (0.10, 4.07) 3.83 (1.54, 6.17) 4.33 (1.82, 6.91) < 65
yearsFull year 3.74 (2.74, 4.76)* 5.65 (4.47, 6.85)* 6.99 (5.68, 8.32)* Cold season 4.65 (3.27, 6.06)† 6.60 (4.95, 8.28)† 8.39 (6.57, 10.24)† Warm season 1.58 (0.12, 3.30) 3.09 (1.06, 5.16) 3.31 (1.01, 5.67) Low temperature 5.47 (4.27, 6.68)† 7.00 (5.59, 8.43)† 8.10 (6.50, 9.72)† High temperature 2.22 (0.52, 3.94) 3.71 (1.74, 5.72) 4.23 (2.07, 6.44) ≥ 65 years Full year 2.95 (0.58, 5.36)* 2.15 (0.58, 4.97) 2.49 (0.53, 5.60) Cold season 6.03 (3.05, 9.09)† 5.22 (1.74, 8.81)† 5.72 (1.91, 9.67) Warm season 1.61 (6.14, 3.13) 2.09 (7.39, 3.51) 0.72 (6.86, 5.82) Low temperature 2.92 (0.22, 5.70) 1.71 (1.42, 4.94) 1.98 (1.51, 5.60) High temperature 0.67 (4.93, 3.78) 0.99 (5.88, 4.16) 1.37 (4.12, 7.17) Note. NO2, nitrogen dioxide; CI, confidence interval; Temp, temperature; a“All” means daily death count, not stratified by sex or age; bEstimates were generated using a distributed lag linear model, adjusted for calendar day [natural cubic spline with 5 degrees of freedom (df )for full year and 3 df for seasonal analysis], day of the week, holiday, temperature (lag0, natural smooth function, 3 df), and humidity (lag0, natural smooth function, 3 df). We used a sevenday lag distributed linear model to examine the lag effect of NO2 on mortality; *Statistically significant at the 5% level of significance (P < 0.05); †Z test for the difference between the two relative risks of subgroup analysis results at the 5% level of significance (P < 0.05). Table 2. Percentage increase (95% CI) in the firstaid volume of neurological diseases for each 10 μg/m3 increment in NO2 concentrations by season and temperature in Shenzhen, 2013–2020
To more comprehensively assess this relationship, we stratified the temperature to investigate the interaction between NO2 concentration and temperature on first-aid rates for neurological diseases. A temperature-stratified model was used to assess the effects of pollutants at different temperatures. Table 2 presents the estimated effects of NO2 on the number of first-aid sessions for neurological diseases on low-temperature days. The differences between low and high temperatures were statistically significant at moving average lags of lag0–2, lag0–4, and lag0–6 days. For instance, for all individuals, with each 10 μg/m3 increment in NO2 concentration, the instances of first-aid for neurological diseases increased by 4.43% (95% CI: 3.30, 5.57) on low-temperature days and by 1.47% (95% CI: –0.12, 3.08) on high-temperature days. Subgroup analysis revealed that the effects of NO2 on the number of first-aid sessions for neurological diseases were higher on low-temperature days in women and youn people than those in men and older individuals (≥ 65 years), respectively. Consistent with the results of seasonal analyses, we observed that the effect of NO2 on neurological diseases was more pronounced on low-temperature (≤ median temperature) days than on high-temperature days. There are several possible mechanisms for the relationship between ambient temperature and air pollutants. First, cold stress may induce glial cell activation, neuroinflammation, and neuronal damage, as demonstrated in the hippocampus[8]. Moreover, NO2 inhalation can increase the levels of the c-fos and c-jun oncogenes and the expression of the p53, bax, and bcl-2 apoptosis-related genes, induce neurotoxicity, and cause various neurological disorders[9]. Inflammation and oxidative stress are the two main processes through which air pollutants exert toxic effects on the central nervous system[10]. The two processes are linked, and this common mechanism may be responsible for the synergistic effect.
The sensitivity analyses conducted using various NO2 lag days (Supplementary Table S1, available in www.besjournal.com) revealed consistent seasonal effects. Adjustment for temperature (Supplementary Table S2, available in www.besjournal.com) revealed varying effects on the male population throughout the year, and among individuals, it varied by age during the cold season. However, the effect on the total population remained unchanged. The effect of NO2 on neurological diseases did not change significantly (except for the male group at lag0–2) when different ambient temperatures were chosen as the cutoff points for the temperature-stratified models (Supplementary Table S3, available in www.besjournal.com). The addition of co-pollutants to our model did not significantly alter the rate of first-aid due to onset of neurological disorders in either of the seasonal or temperature models (Supplementary Tables S4–S5, available in www.besjournal.com). The addition of variables representing the epidemic measure in the model showed that the significance of the impact of NO2 concentration on neurological diseases in both the cold and warm seasons remained unchanged (Supplementary Table S6, available in www.besjournal.com).
Group Modelling choices Season Percentage increase in onset (95% CI)b Lag0–2 Lag0–4 Lag0–6 All a Main model Full year 3.68 (2.74, 4.63) * 5.27 (4.16, 6.39) * 6.50 (5.27, 7.74) * Cold season 4.94 (3.64, 6.25) † 6.55 (5.02, 8.12) † 8.20 (6.50, 9.92) † Warm season 1.23 (0.36, 2.85) 2.50 (0.60, 4.44) 2.83 (0.67, 5.04) Lag period: 5 days Full year 3.71 (2.77, 4.66) * 5.56 (4.44, 6.70) * Cold season 5.33 (3.83, 6.85) † 7.58 (5.83, 9.35) † Warm season 1.62 (0.33, 3.62) 2.79 (0.58, 5.06) Lag period: 9 days Full year 3.63 (2.70, 4.58) * 5.32 (4.23, 6.41) * 6.44 (5.20, 7.70) * Cold season 5.20 (3.70, 6.71) † 7.24 (5.52, 8.98) † 8.61 (6.72, 10.54) † Warm season 1.44 (0.49, 3.41) 2.47 (0.25, 4.73) 3.02 (0.61, 5.49) Females Main model Full year 3.57 (2.19, 4.97) * 4.57 (2.95, 6.22) * 5.91 (4.11, 7.74) * Cold season 4.99 (3.11, 6.89) † 6.16 (3.95, 8.43) † 7.85 (5.40, 10.35) † Warm season 0.88 (1.53, 3.35) 1.29 (1.57, 4.22) 1.50 (1.75, 4.87) Lag period: 5 days Full year 3.60 (2.21, 5.00) * 5.08 (3.44, 6.75) * Cold season 4.87 (3.01, 6.76) † 6.88 (4.63, 9.17) † Warm season 0.92 (1.46, 3.36) 1.33 (1.53, 4.27) Lag period: 9 days Full year 3.42 (2.04, 4.81) * 4.86 (3.28, 6.47) * 5.91 (4.09, 7.76) * Cold season 4.87 (2.99, 6.78) † 6.42 (4.26, 8.63) † 7.59 (5.12, 10.12) † Warm season 0.54 (1.86, 3.01) 1.19 (1.62, 4.08) 1.51 (1.76, 4.88) Males Main model Full year 3.76 (2.61, 4.93) * 5.75 (4.38, 7.13) * 6.90 (5.39, 8.43) * Cold season 4.90 (3.34, 6.48) † 6.80 (4.94, 8.70) † 8.41 (6.36, 10.50) † Warm season 1.50 (0.52, 3.57) 3.38 (0.96, 5.87) 3.81 (1.04, 6.64) Lag period: 5 days Full year 3.79 (2.64, 4.95) * 5.89 (4.51, 7.28) * Cold season 5.01 (3.46, 6.58) † 7.25 (5.37, 9.16) † Warm season 1.66 (0.36, 3.72) 3.38 (0.94, 5.88) Lag period: 9 days Full year 3.78 (2.64, 4.94) * 5.63 (4.30, 6.97) * 6.81 (5.28, 8.35) * Cold season 4.84 (3.28, 6.42) † 6.86 (5.06, 8.69) † 8.21 (6.15, 10.32) † Warm season 1.66 (0.38, 3.74) 2.86 (0.47, 5.31) 3.62 (0.84, 6.48) < 65 years Main model Full year 3.74 (2.74, 4.76) * 5.65 (4.47, 6.85) * 6.99 (5.68, 8.32) * Cold season 4.65 (3.27, 6.06) † 6.60 (4.95, 8.28) † 8.39 (6.57, 10.24) † Warm season 1.58 (0.12, 3.30) 3.09 (1.06, 5.16) 3.31 (1.01, 5.67) Lag period: 5 days Full year 3.78 (2.78, 4.80) * 5.96 (4.76, 7.17) * Cold season 4.66 (3.29, 6.05) † 7.08 (5.41, 8.77) † Warm season 1.75 (0.07, 3.46) 3.20 (1.17, 5.28) Lag period: 9 days Full year 3.74 (2.74, 4.74) * 5.62 (4.46, 6.79) * 6.91 (5.59, 8.26) * Cold season 4.56 (3.18, 5.96) † 6.58 (4.98, 8.20) † 8.09 (6.26, 9.96) † Warm season 1.58 (0.12, 3.31) 2.68 (0.69, 4.71) 3.23 (0.92, 5.60) ≥ 65 years Main model Full year 2.95 (0.58, 5.36) * 2.15 (0.58, 4.97) 2.49 (0.53, 5.60) Cold season 6.03 (3.05, 9.09) † 5.22 (1.74, 8.81) † 5.72 (1.91, 9.67) Warm season 1.61 (6.14, 3.13) 2.09 (7.39, 3.51) 0.72 (6.86, 5.82) Lag period: 5 days Full year 2.91 (0.56, 5.32) * 2.35 (0.42, 5.19) Cold season 6.20 (3.25, 9.23) † 6.25 (2.73, 9.89) † Warm season 1.94 (6.41, 2.74) 2.85 (8.15, 2.76) Lag period: 9 days Full year 2.62 (0.28, 5.02) * 2.76 (0.09, 5.51) * 2.61 (0.44, 5.74) Cold season 6.04 (3.06, 9.11) † 6.42 (3.02, 9.94) † 6.04 (2.18, 10.04) Warm season 2.01 (6.52, 2.71) 1.88 (7.13, 3.67) 0.94 (7.08, 5.60) Note. NO2, nitrogen dioxide; CI, confidence interval; df, degrees of freedom. a ”All” meant daily onset count, not stratified by sex and age. b Estimates were generated using distributed lag linear model, day of the week, holiday, temperature (lag0, natural smooth function, 3df), humidity (lag0, natural smooth function, 3df). * Statistically significant results at the 5% level (P < 0.05). † Z test for the difference between the two relative risks of subgroup analysis results at the 5% level (P < 0.05). Table S1. Percentage increase (95% CI) of first aid volume of neurological diseases for each10 μg/m3 increment in NO2 by selecting different lag times
Group Season Percentage increase in onset (95% CI)b Templag0c Templag0-14d Tempt,le All a Full year 3.68 (2.74, 4.63) * 3.13 (2.19, 4.08) * 3.26 (2.32, 4.21) * Cold season 4.94 (3.64, 6.25) † 3.93 (2.66, 5.21) † 4.25 (2.97, 5.55) † Warm season 1.23 (0.36, 2.85) 1.26 (0.34, 2.88) 1.12 (0.47, 2.73) Females Full year 3.06 (1.77, 4.37) * 3.42 (2.04, 4.83) * 3.58 (2.19, 4.99) * Cold season 3.52 (1.83, 5.24) † 4.52 (2.69, 6.39) † 4.79 (2.93, 6.69) † Warm season 0.42 (1.85, 2.75) 1.06(1.35,3.53) 0.87 (1.52, 3.33) Males Full year 3.76 (2.61, 4.93) * 2.94 (1.80, 4.10) * 3.05 (1.90, 4.21) * Cold season 4.90 (3.34, 6.48) † 3.53 (2.01, 5.08) 3.89 (2.35, 5.45) † Warm season 1.50 (0.52, 3.57) 1.41 (0.61, 3.47) 1.31 (0.70, 3.37) < 65 years Full year 3.74 (2.74, 4.76) * 3.30 (2.30, 4.32) * 3.40 (2.40, 4.42) * Cold season 4.65 (3.27, 6.06) 3.82 (2.47, 5.19) 4.15 (2.77, 5.54) † Warm season 1.58 (0.12, 3.30) 1.66 (0.04, 3.38) 1.47 (0.22, 3.19) ≥ 65 years Full year 2.95 (0.58, 5.36) * 1.79 (0.56, 4.18) 2.23 (0.12, 4.65) Cold season 6.03 (3.05, 9.09) † 4.14 (1.23, 7.13) † 4.57 (1.63, 7.60) † Warm season 1.61 (6.14, 3.13) 1.87 (6.36, 2.84) 1.65 (6.15, 3.07) Note. NO2, nitrogen dioxide; CI, confidence interval; Temp, temperature. a“All” meant daily onset count, not stratified by sex and age. bEstimates were generated using distributed lag linear model accumulated over lags 0 to 2 days. c$ {\mathrm{T}\mathrm{e}\mathrm{m}\mathrm{p}}_{\mathrm{l}\mathrm{a}\mathrm{g}0} $ meant currentday temperature, using natural smooth function (3df). d$ {\mathrm{T}\mathrm{e}\mathrm{m}\mathrm{p}}_{\mathrm{l}\mathrm{a}\mathrm{g}0-14} $ meant 14 day moving average temperature, using natural smooth function (3df). e$ {\mathrm{T}\mathrm{e}\mathrm{m}\mathrm{p}}_{t,l} $ meant crossbasis functions for the two dimensions of exposure and lags, using 14 days as the maximum lag for temperature. *Statistically significant results at the 5% level (P < 0.05). †Z test for the difference between the two relative risks of subgroup analysis results at the 5% level (P < 0.05). Table S2. Percentage increase (95% CI) of first aid volume of neurological diseases for each10 μg/m3 increment in NO2 with adjustment temperature
Cutoff Group Temperature levels Percentage increase in onset (95% CI) Lag0–2 Lag0–4 Lag0–6 24.70 °C All a Low 5.21 (4.13, 6.31)† 6.25 (5.00, 7.51)† 7.05 (5.66, 8.46)† High 2.31 (0.72, 3.93) 3.69 (1.85, 5.56) 4.41 (2.41, 6.46) Females Low 5.51 (3.92, 7.13)† 6.32 (4.48, 8.19)† 7.16 (5.12, 9.25)† High 1.86 (0.46, 4.24) 2.50 (0.17, 5.25) 3.46 (0.53, 6.47) Males Low 5.02 (3.70, 6.36)† 6.20 (4.67, 7.75) 6.98 (5.28, 8.71) High 2.63 (0.68, 4.62) 4.51 (2.25, 6.81) 5.09 (2.63, 7.60) < 65 years Low 5.55 (4.39, 6.73)† 6.88 (5.54, 8.24)† 7.78 (6.28, 9.29)† High 2.63 (0.95, 4.34) 4.19 (2.25, 6.17) 4.72 (2.61, 6.88) ≥ 65 years Low 2.95 (0.33, 5.63) 1.92 (1.08, 5.01) 2.12 (1.19, 5.54) High 0.63 (4.88, 3.80) 0.80 (5.66, 4.31) 1.55 (3.86, 7.26) 23.55 °C b All a Low 5.24 (4.14, 6.35)† 6.32 (5.04, 7.61)† 7.16 (5.74, 8.60)† High 2.59 (1.09, 4.12) 3.89 (2.17, 5.64) 4.54 (2.66, 6.45) Females Low 5.63 (4.01, 7.27)† 6.50 (4.63, 8.41)† 7.57 (5.49, 9.70)† High 2.10 (0.10, 4.34) 2.64 (0.14, 5.20) 3.10 (0.37, 5.90) Males Low 4.98 (3.64, 6.34) 6.19 (4.64, 7.77) 6.88 (5.15, 8.64) High 2.95 (1.11, 4.84) 4.76 (2.64, 6.91) 5.54 (3.23, 7.91) < 65 years Low 5.58 (4.40, 6.78)† 6.97 (5.60, 8.36)† 7.91 (6.38, 9.45)† High 2.89 (1.29, 4.51) 4.36 (2.54, 6.21) 4.84 (2.86, 6.87) ≥ 65 years Low 2.97 (0.31, 5.69) 1.98 (1.07, 5.11) 2.17 (1.18, 5.64) High 0.12 (4.12, 4.04) 0.38 (4.91, 4.38) 1.64 (3.40, 6.93) Note. a “All” meant daily onset count, not stratified by sex and age. b The 23.55 °C of daily temperature as the cutoff value was the mean temperature. †Z test for the difference between the two relative risks of subgroup analysis results at the 5% level (P < 0.05). Table S3. Percentage increase (95% CI) of first aid volume of neurological diseases for each 10 μg/m3 increment in NO2 using different cutoffs
Pollution Group Effect Percentage increase in onset (95% CI)b Lag0–2 Lag0–4 Lag0–6 NO2 Alla Full year 3.68 (2.74, 4.63) * 5.27 (4.16, 6.39) * 6.50 (5.27, 7.74) * Cold season 4.94 (3.64, 6.25) † 6.55 (5.02, 8.12) † 8.20 (6.50, 9.92) † Warm season 1.23 (0.36, 2.85) 2.50 (0.60, 4.44) 2.83 (0.67, 5.04) Female Full year 3.06 (1.77, 4.37) * 3.84 (2.32, 5.38) * 4.93 (3.24, 6.65) * Cold season 3.52 (1.83, 5.24) † 4.77 (2.77, 6.82) † 6.09 (3.86, 8.37) † Warm season 0.42 (1.85, 2.75) 0.03 (2.72, 2.73) 0.21 (3.27, 2.95) Male Full year 3.76 (2.61, 4.93) * 5.75 (4.38, 7.13) * 6.90 (5.39, 8.43) * Cold season 4.90 (3.34, 6.48) † 6.80 (4.94, 8.70) † 8.41 (6.36, 10.50) † Warm season 1.50 (0.52, 3.57) 3.38 (0.96, 5.87) 3.81 (1.04, 6.64) < 65 years Full year 3.74 (2.74, 4.76) * 5.65 (4.47, 6.85) * 6.99 (5.68, 8.32) * Cold season 4.65 (3.27, 6.06) † 6.60 (4.95, 8.28) † 8.39 (6.57, 10.24) † Warm season 1.58 (0.12, 3.30) 3.09 (1.06, 5.16) 3.31 (1.01, 5.67) ≥ 65 years Full year 2.95 (0.58, 5.36) * 2.15 (0.58, 4.97) 2.49 (0.53, 5.60) Cold season 6.03 (3.05, 9.09) † 5.22 (1.74, 8.81) † 5.72 (1.91, 9.67) Warm season 1.61 (6.14, 3.13) 2.09 (7.39, 3.51) 0.72 (6.86, 5.82) NO2+PM10 Alla Full year 4.05 (2.98, 5.14) * 5.98 (4.70, 7.28) * 7.59 (6.14, 9.05) * Cold season 4.82 (3.31, 6.35) † 7.00 (5.18, 8.85) † 9.11 (7.06, 11.20) † Warm season 1.28 (0.59, 3.19) 2.22 (0.05, 4.43) 2.36 (0.06, 4.85) Female Full year 3.75 (2.17, 5.35) * 4.95 (3.08, 6.86) * 6.43 (4.32, 8.57) * Cold season 5.53 (3.38, 7.72) † 7.43 (4.84, 10.09) † 9.73 (6.79, 12.74) † Warm season 0.87 (1.82, 3.62) 0.60 (2.50, 3.80) 0.01 (3.50, 3.60) Male Full year 4.27 (2.95, 5.60) * 6.70 (5.12, 8.30) * 8.40 (6.62, 10.20) * Cold season 5.02 (3.24, 6.82) 7.38 (5.23, 9.58) † 9.53 (7.11, 12.02) † Warm season 2.17 (0.10, 4.49) 3.83 (1.16, 6.57) 4.43 (1.39, 7.56) < 65 years Full year 4.11 (2.97, 5.27) * 6.35 (4.98, 7.73) * 8.07 (6.53, 9.64) * Cold season 5.02 (3.24, 6.82) † 7.38 (5.23, 9.58) † 9.53 (7.11, 12.02) † Warm season 2.17 (0.10, 4.49) 3.83 (1.16, 6.57) 4.43 (1.39, 7.56) ≥ 65 years Full year 3.34 (0.59, 6.16) * 3.01 (0.22, 6.34) 3.67 (0.07, 7.40) * Cold season 7.25 (3.72, 10.91) † 7.26 (3.05, 11.65) † 8.64 (3.92, 13.58) † Warm season 2.23 (7.21, 3.03) 3.55 (9.27, 2.53) 2.96 (9.52, 4.07) NO2 + PM2.5 All a Full year 4.25 (3.12, 5.40) * 6.22 (4.86, 7.61) * 7.88 (6.33, 9.46) * Cold season 5.64 (4.10, 7.21) † 8.06 (6.17, 9.99) † 10.57 (8.39, 12.79) † Warm season 1.50 (0.48, 3.52) 2.34 (0.03, 4.70) 2.30 (0.27, 4.93) Female Full year 4.45 (2.78, 6.15) * 5.74 (3.73, 7.78) * 7.31 (5.03, 9.64) * Cold season 6.20 (3.96, 8.49) † 8.30 (5.54, 11.12) † 11.05 (7.86, 14.33) † Warm season 1.70 (1.17, 4.65) 1.28 (2.06, 4.74) 0.39 (3.33, 4.25) Male Full year 4.14 (2.75, 5.54) * 6.58 (4.90, 8.28) * 8.30 (6.39, 10.24) * Cold season 5.17 (3.33, 7.05) † 7.63 (5.35, 9.95) † 9.97 (7.35, 12.65) † Warm season 1.86 (0.54, 4.31) 3.52 (0.68, 6.44) 4.07 (0.86, 7.38) < 65 years Full year 4.30 (3.09, 5.52) * 6.53 (5.07, 8.01) * 8.30 (6.64, 9.99) * Cold season 5.22 (3.58, 6.89) † 7.78 (5.76, 9.84) † 10.37 (8.04, 12.76) † Warm season 2.09 (0.07, 4.14) 3.16 (0.79, 5.59) 3.10 (0.44, 5.83) ≥ 65 years Full year 3.65 (0.79, 6.59) * 3.66 (0.25, 7.18) * 4.47 (0.61, 8.47) * Cold season 7.04 (3.41, 10.80) † 7.41 (3.01, 12.01) † 9.17 (4.14, 14.44) † Warm season 1.10 (6.42, 4.53) 2.41 (8.57, 4.18) 2.24 (9.24, 5.30) NO2 + SO2 All a Full year 4.74 (3.61, 5.87) * 6.78 (5.42, 8.15) * 8.38 (6.84, 9.94) * Cold season 6.31 (4.76, 7.89) † 8.71 (6.83, 10.62) † 11.05 (8.93, 13.22) † Warm season 1.39 (0.66, 3.47) 2.37 (0.05, 4.75) 2.77 (0.20, 5.40) Female Full year 4.77 (3.11, 6.45) * 6.05 (4.07, 8.08) * 7.63 (5.38, 9.93) * Cold season 6.53 (5.00, 8.07) † 8.95 (7.08, 10.85) † 11.31 (9.18, 13.48) † Warm season 1.48 (0.49, 3.49) 2.48 (0.20, 4.80) 2.87 (0.33, 5.47) Male Full year 4.73 (3.35, 6.12) * 7.29 (5.62, 8.98) * 8.91 (7.02, 10.83) * Cold season 6.30 (4.46, 8.18) † 8.93 (6.67, 11.23) † 11.09 (8.53, 13.72) † Warm season 1.71 (0.80, 4.27) 3.82 (0.90, 6.82) 4.93 (1.65, 8.30) < 65 years Full year 4.72 (3.51, 5.93) * 7.07 (5.61, 8.54) * 8.81 (7.16, 10.49) * Cold season 6.02 (4.39, 7.68) † 8.73 (6.72, 10.78) † 11.26 (8.97, 13.59) † Warm season 2.11 (0.00, 4.26) 3.34 (0.89, 5.84) 3.70 (0.98, 6.49) ≥ 65 years Full year 4.71 (1.90, 7.60) * 4.49 (1.18, 7.91) * 5.01 (1.32, 8.84) * Cold season 9.13 (5.56, 12.81) † 9.33 (5.07, 13.76) † 10.37 (5.62, 15.33) † Warm season 3.50 (8.83, 2.14) 4.02 (10.02, 2.37) 3.19 (9.92, 4.04) Note. NO2, nitrogen dioxide; SO2, sulfur dioxide; PM10, particulate matter with aerodynamic diameter equal to or less than 10μm; CI, confidence interval. a ”All” meant daily onset count, not stratified by sex and age. b Estimates were generated using distributed lag linear model, adjusted for calendar day [natural cubic spline with 5 df for full year and 3 df for seasonal analysis], day of the week, holiday, temperature (lag0, natural smooth function, 3df), humidity (lag0, natural smooth function, 3df). To examine the lag effect of NO2 on mortality, we used 7day lag distributed lag linear model. * Statistically positive significant results at the 5% level (P < 0.05). † Z test for the difference between the two relative risks of subgroup analysis results at the 5% level (P < 0.05). Table S4. Percentage increase (95% CI) of first aid volume of neurological diseases for each10 μg/m3 increment in NO2 with and without adjustment for copollutants
Pollution Group Temperature levels b Percentage increase in death (95% CI) Lag0–2 Lag0–4 Lag0–6 NO2 All a Low 5.21 (4.13, 6.31) † 6.25 (5.00, 7.51) † 7.05 (5.66, 8.46) † High 2.31 (0.72, 3.93) 3.69 (1.85, 5.56) 4.41 (2.41, 6.46) Females Low 5.51 (3.92, 7.13) † 6.32 (4.48, 8.19) † 7.16 (5.12, 9.25) † High 1.86 (−0.46, 4.24) 2.50 (−0.17, 5.25) 3.46 (0.53, 6.47) Males Low 5.02 (3.70, 6.36) † 6.20 (4.67, 7.75) 6.98 (5.28, 8.71) High 2.63 (0.68, 4.62) 4.51 (2.25, 6.81) 5.09 (2.63, 7.60) < 65 years Low 5.55 (4.39, 6.73) † 6.88 (5.54, 8.24) † 7.78 (6.28, 9.29) † High 2.63 (0.95, 4.34) 4.19 (2.25, 6.17) 4.72 (2.61, 6.88) ≥ 65 years Low 2.95 (0.33, 5.63) 1.92 (−1.08, 5.01) 2.12 (−1.19, 5.54) High −0.63 (−4.88, 3.80) −0.80 (−5.66, 4.31) 1.55 (−3.86, 7.26) NO2+PM10 All a Low 5.70 (4.47, 6.94) † 7.34 (5.89, 8.81) † 8.40 (6.78, 10.05) † High 2.77 (1.08, 4.49) 4.71 (2.74, 6.72) 5.72 (3.54, 7.93) Females Low 5.71 (3.91,7.55) † 6.78 (4.66, 8.94) † 7.66 (5.29, 10.08) † High 2.05 (−0.41,4.57) 2.92 (0.07, 5.85) 3.92 (0.78, 7.16) Males Low 5.70 (4.20,7.23) † 7.74 (5.96, 9.54) 8.92 (6.93, 10.94) High 3.29 (1.22,5.41) 5.97 (3.54, 8.45) 6.98 (4.31, 9.72) < 65 years Low 5.96 (4.64,7.29) † 7.93 (6.38, 9.50) † 9.08 (7.35, 10.85) † High 3.02 (1.23,4.83) 5.17 (3.09, 7.29) 5.98 (3.69, 8.32) ≥ 65 years Low 4.02 (0.97,7.16) 3.37 (−0.18, 7.04) 3.83 (−0.11, 7.91) High 0.37 (−4.14,5.10) 0.55 (−4.65, 6.04) 3.24 (−2.61, 9.44) NO2+PM2.5 Alla Low 5.71 (4.42, 7.01) † 7.48 (5.95, 9.04) † 8.66 (6.93, 10.41) † High 2.79 (1.06, 4.56) 4.87 (2.83, 6.94) 5.97 (3.72, 8.27) Females Low 6.35 (4.46, 8.28) † 7.54 (5.29, 9.84) † 8.45 (5.92, 11.05) † High 2.68 (0.14, 5.28) 3.65 (0.69, 6.69) 4.68 (1.41, 8.06) Males Low 5.29 (3.73, 6.88) † 7.46 (5.59, 9.36) 8.81 (6.70, 10.97) High 2.91 (0.79, 5.07) 5.73 (3.23, 8.28) 6.88 (4.11, 9.72) < 65 years Low 5.93 (4.56, 7.32) † 8.01 (6.37, 9.67) † 9.25 (7.4, 11.14) † High 3.00 (1.17, 4.87) 5.26 (3.12, 7.46) 6.15 (3.77, 8.57) ≥ 65 years Low 4.26 (1.10, 7.53) 3.93 (0.20, 7.80) 4.70 (0.52, 9.06) High 0.65 (−3.96, 5.49) 1.13 (−4.23, 6.78) 4.13 (−1.92, 10.57) NO2+SO2 All a Low 6.07 (4.81, 7.34) † 7.76 (6.26, 9.29) † 8.90 (7.20, 10.63) † High 3.24 (1.50, 5.01) 5.09 (3.08, 7.14) 6.14 (3.92, 8.41) Females Low 6.36 (4.51, 8.25) † 7.56 (5.34, 9.82) † 8.60 (6.11, 11.15) † High 2.78 (0.23, 5.39) 3.63 (0.71, 6.63) 4.77 (1.55, 8.10) Males Low 5.89 (4.35, 7.44) † 7.92 (6.07, 9.79) 9.12 (7.04, 11.25) High 3.58 (1.45, 5.76) 6.11 (3.64, 8.65) 7.10 (4.37, 9.91) < 65 years Low 6.25 (4.91, 7.62) † 8.31 (6.69, 9.95) † 9.55 (7.72, 11.41) † High 3.39 (1.55, 5.27) 5.50 (3.38, 7.68) 6.37 (4.02, 8.77) ≥ 65 years Low 5.01 (1.94, 8.16) 4.30 (0.70, 8.02) 4.67 (0.68, 8.83) High 1.56 (−3.07, 6.40) 1.34 (−3.90, 6.86) 3.92 (−1.96, 10.15) Note. NO2, nitrogen dioxide; SO2, sulfur dioxide; PM10, particulate matter with aerodynamic diameter equal to or less than 10 μm; CI, confidence interval. a“All” meant daily onset count, not stratified by sex and age. bUsing the median of temperature (24.70 °C) as the cut-off value. * Statistically significant results at the 5% level (P < 0.05). † Z test for the difference between the two relative risks of subgroup analysis results at the 5% level (P < 0.05). Table S5. Percentage increase (95% CI) of first aid volume of neurological diseases for each10 μg/m3 increment in NO2 with and without adjustment for co-pollutants across temperature levels
Group Season/Temperature Percentage increase in death (95% CI)b Lag0–2 Lag0–4 Lag0–6 Alla Full year 3.47 (2.53, 4.42) * 4.95 (3.84, 6.07) * 6.01 (4.78, 7.25) * Cold season 4.43 (3.15, 5.73) † 5.80 (4.27, 7.34) † 7.11 (5.42, 8.83) † Warm season 1.24 (0.35, 2.86) 2.54 (0.65, 4.47) 2.88 (0.72, 5.09) Low temperature 4.80 (3.72, 5.90) † 5.72 (4.46, 6.99) † 6.42 (5.02, 7.83) † High temperature 2.17 (0.59, 3.77) 3.47 (1.64, 5.33) 4.13 (2.13, 6.16) Female Full year 3.37 (1.99, 4.78) * 4.28 (2.65, 5.93) * 5.47 (3.66, 7.31) * Cold season 4.45 (2.58, 6.35) † 5.36 (3.15, 7.63) † 6.71 (4.25, 9.22) † Warm season 0.89 (1.51, 3.36) 1.35 (1.50,4.28) 1.58 (1.67, 4.94) Low temperature 5.14 (3.54, 6.76) † 5.83 (3.98, 7.71) † 6.57 (4.51, 8.67) † High temperature 1.74 (0.58, 4.11) 2.31 (0.36, 5.05) 3.20 (0.28, 6.21) Male Full year 3.53 (2.38, 4.70) * 5.40 (4.04, 6.78) * 6.38 (4.87, 7.91) * Cold season 4.41 (2.86, 5.99) † 6.07 (4.22, 7.96) † 7.36 (5.31, 9.45) † Warm season 1.51 (0.52, 3.58) 3.41(0.98, 5.89) 3.84 (1.08, 6.67) Low temperature 4.58 (3.26, 5.92) 5.64 (4.11, 7.20) 6.31 (4.60, 8.05) High temperature 2.48 (0.54, 4.45) 4.27 (2.03, 6.57) 4.78 (2.33, 7.28) < 65 years Full year 3.51 (2.51, 4.52) * 5.30 (4.12, 6.50) * 6.46 (5.15, 7.79) * Cold season 4.15 (2.78, 5.54) † 5.85 (4.21, 7.51) † 7.31 (5.49, 9.16) † Warm season 1.59 (0.11, 3.31) 3.12 (1.09, 5.18) 3.34 (1.04, 5.70) Low temperature 5.10 (3.94, 6.28) † 6.31 (4.96, 7.67) † 7.08 (5.58, 8.60) † High temperature 2.47 (0.80, 4.17) 3.95 (2.02, 5.91) 4.41 (2.30, 6.55) ≥ 65 years Full year 2.88 (0.51, 5.30) * 2.05 (0.70 ,4.87) 2.33 (0.71, 5.47) Cold season 5.59 (2.62, 8.66) † 4.57 (1.08 ,8.18) 4.79 (0.96, 8.77) Warm season 1.61 (6.13, 3.11) 1.92 (7.21, 3.67) 0.46 (6.6, 6.08) Low temperature 2.83 (0.20, 5.54) 1.75 (1.28, 4.86) 1.91 (1.44, 5.37) High temperature 0.66 (4.91, 3.77) 0.85 (5.71, 4.26) 1.46 (3.94, 7.18) Note. NO2, nitrogen dioxide; CI, confidence interval; Temp, temperature. a ”All” meant daily death count, not stratified by sex and age. bEstimates were generated using distributed lag linear model, adjusted for calendar day [natural cubic spline with 5 df for full year and 3 df for seasonal analysis], day of the week, holiday, temperature (lag0, natural smooth function, 3df), humidity (lag0, natural smooth function, 3df). To examine the lag effect of NO2 on mortality, we used 7day lag distributed lag linear model. *Statistically significant results at the 5% level (P < 0.05). †Z test for the difference between the two relative risks of subgroup analysis results at the 5% level (P < 0.05). Table S6. Percentage increase (95% CI) of first aid volume of neurological diseases for each 10 μg/m3 increment in NO2 with a binary variable in model to indicate whether the period was affected by the pandemic
This study has some limitations. First, we obtained only ambient pollutant data from environmental monitoring stations with information on first-aid on the day, lacking individual measurements. Moreover, air pollutant data were collected at different monitoring stations, potentially leading to variability in measurements. Spatial heterogeneity existed between air pollutant measurements and meteorological factors, highlighting the need to incorporate personal geographical information to obtain reliable results. Second, our study focused on Shenzhen, limiting its generalizability to other regions because of the differences in climatic conditions, geographic topography, and demographics. Third, our study was limited to a broad category of neurological disorders and did not break down the effects of these factors more specifically for subspecies of disorders. In future studies, we aim to improve the data collection methods to include individual-level exposure measurements. This would help provide a more precise assessment of the health effects of pollution and reduce potential bias. In addition, more detailed data and subgroup analyses are needed based on the severity, origin, and chronicity of the disorder. This information would provide a more comprehensive understanding of the specific impacts of air pollution on various neurological conditions.
Our study revealed that cold seasons and low temperatures significantly modified the effects of NO2 on neurological disorders, with women and young people exhibiting greater susceptibility to cold weather conditions than those in men and older individuals (≥ 65 years), respectively. Prioritizing the health effects of extreme weather on susceptible populations and implementing appropriate measures are crucial steps towards reducing the health burden caused by temperature and air pollution in synergy.
We thank the Shenzhen Center for Disease Control and Prevention for the data collection. Tongyu Yang: Conceptualization, methodology, data curation, formal analysis, and original draft preparation. Qingqing Wang: Data curation, validation, visualization, and critical revision of the manuscript. Yuchen Tian: Validation, visualization, and critical revision of the manuscript. Siyi Chen, Yilei Ma, Ning Liu, and Xiaoheng Li: Data curation. Peng Wang: Validation, supervision, reviewing, and editing. Jinquan Cheng and Ji Peng: Investigation, funding acquisition, and supervision. Ping Yin: Investigation, funding acquisition, supervision, reviewing, and editing. Jing Hu: Supervision, reviewing, and editing.
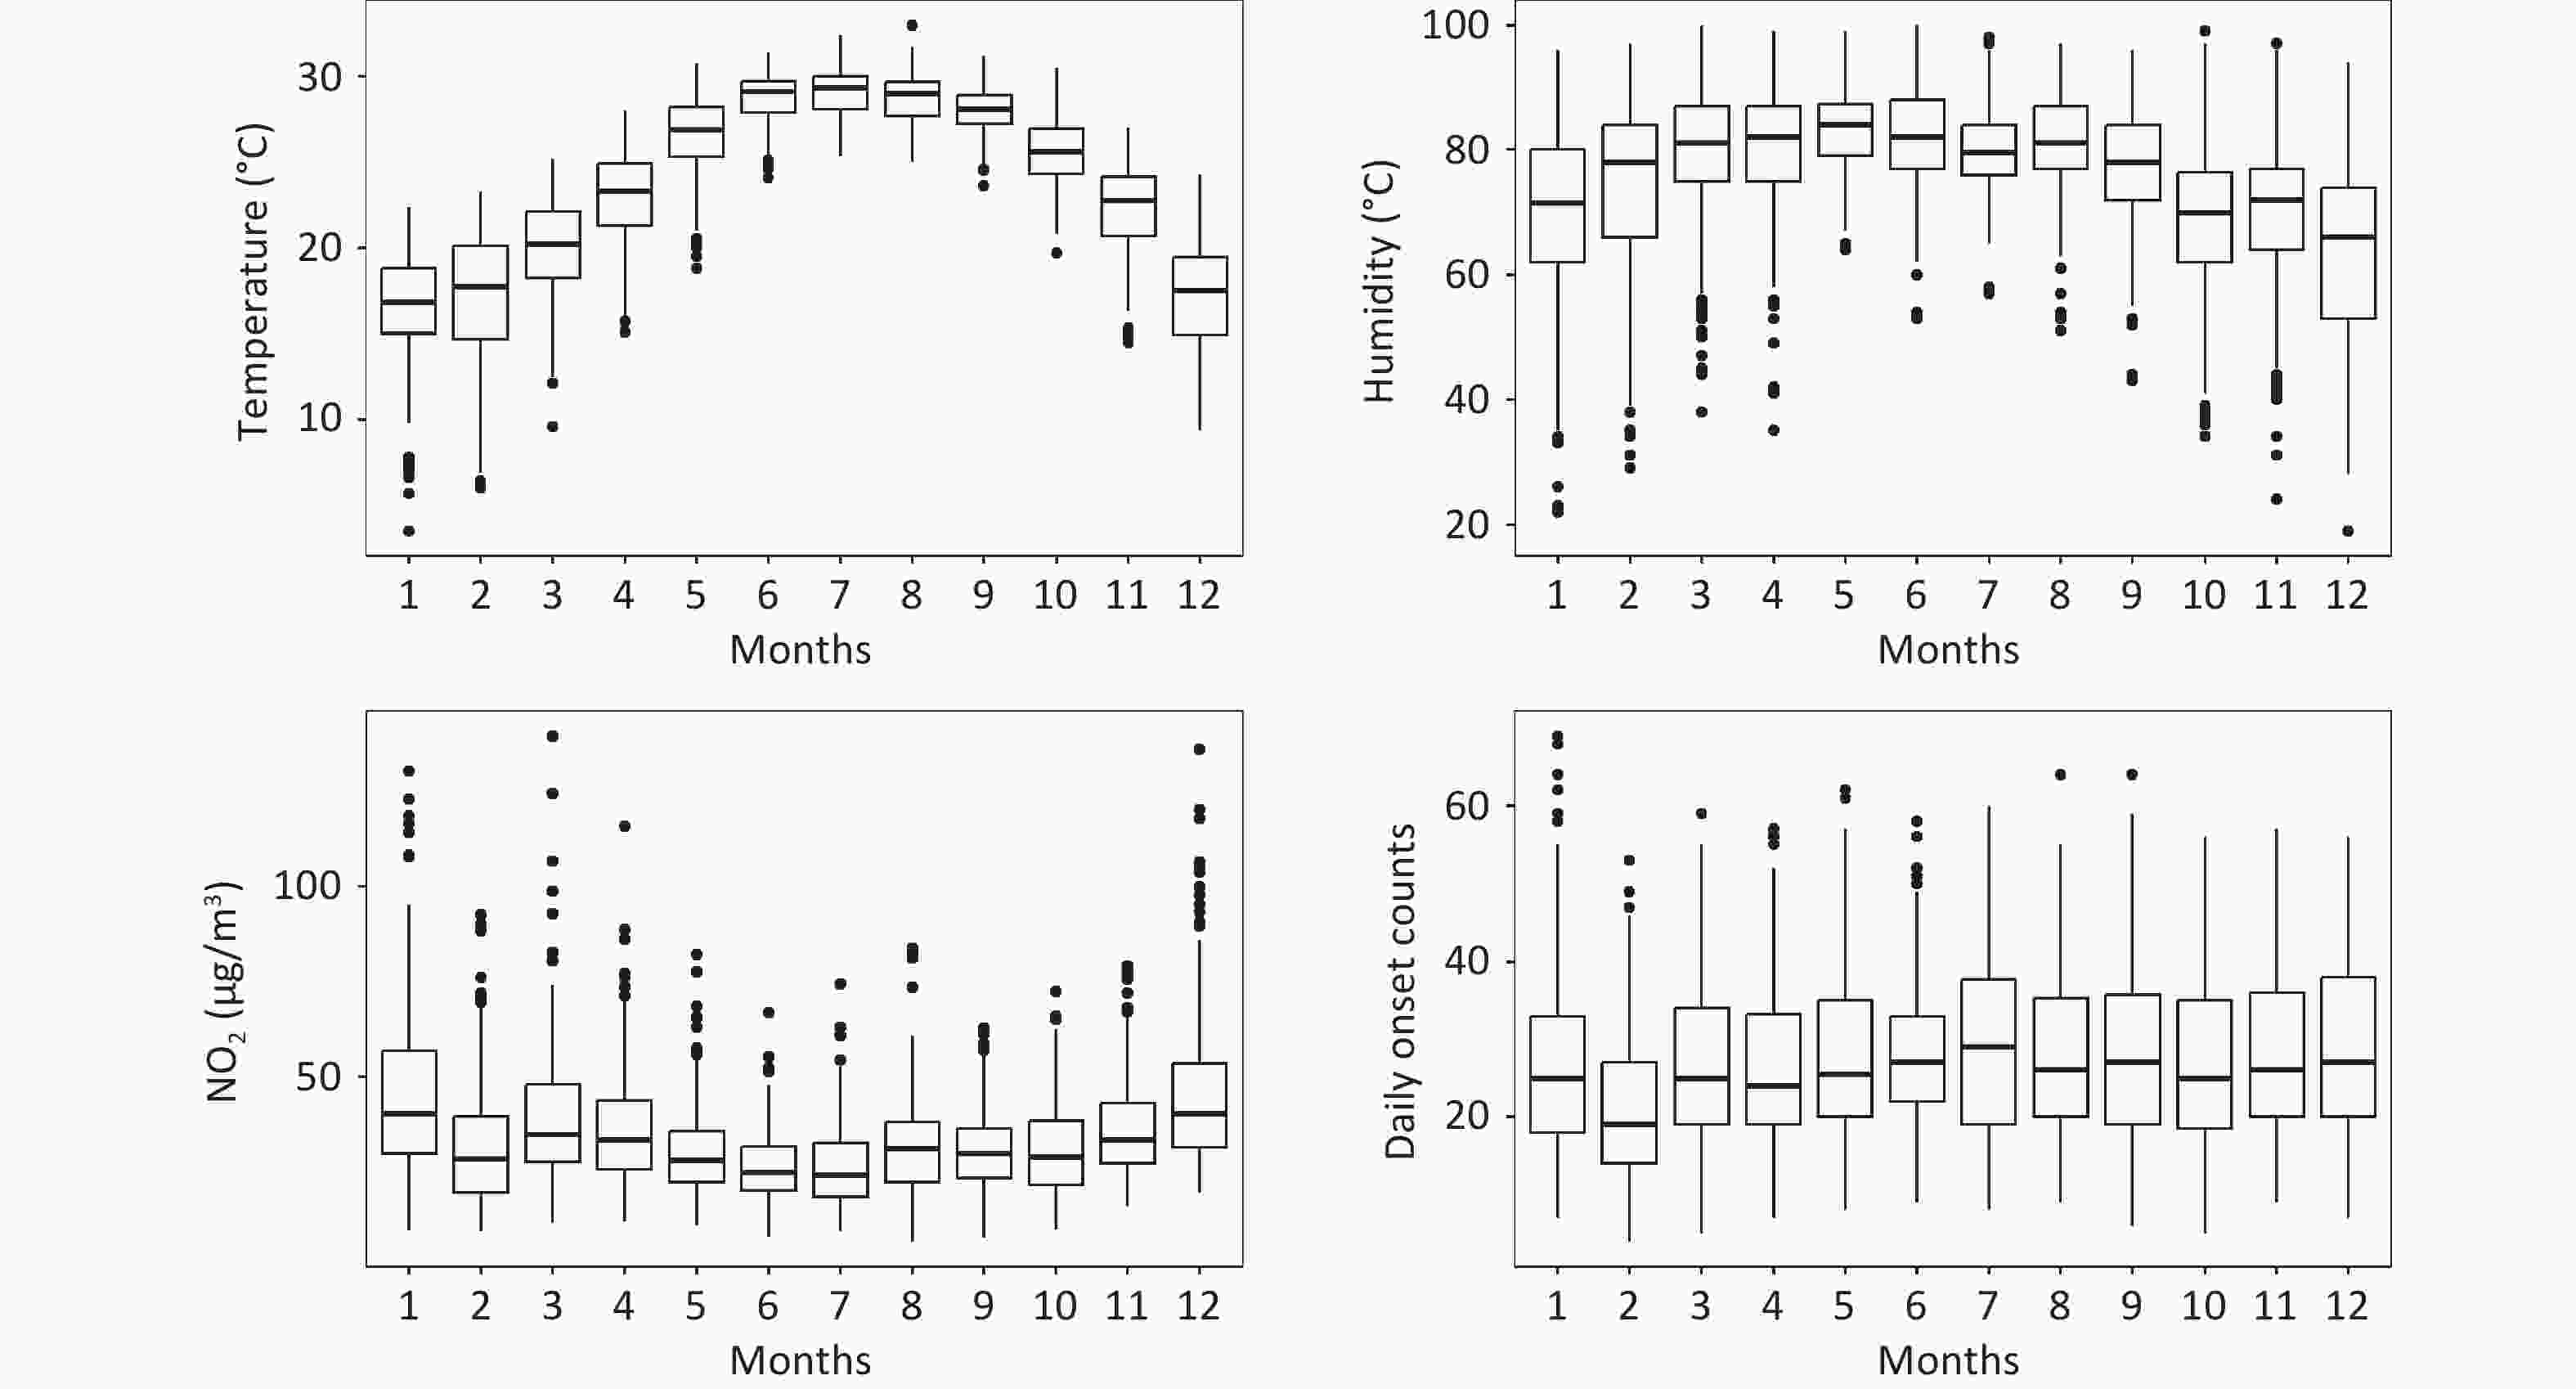
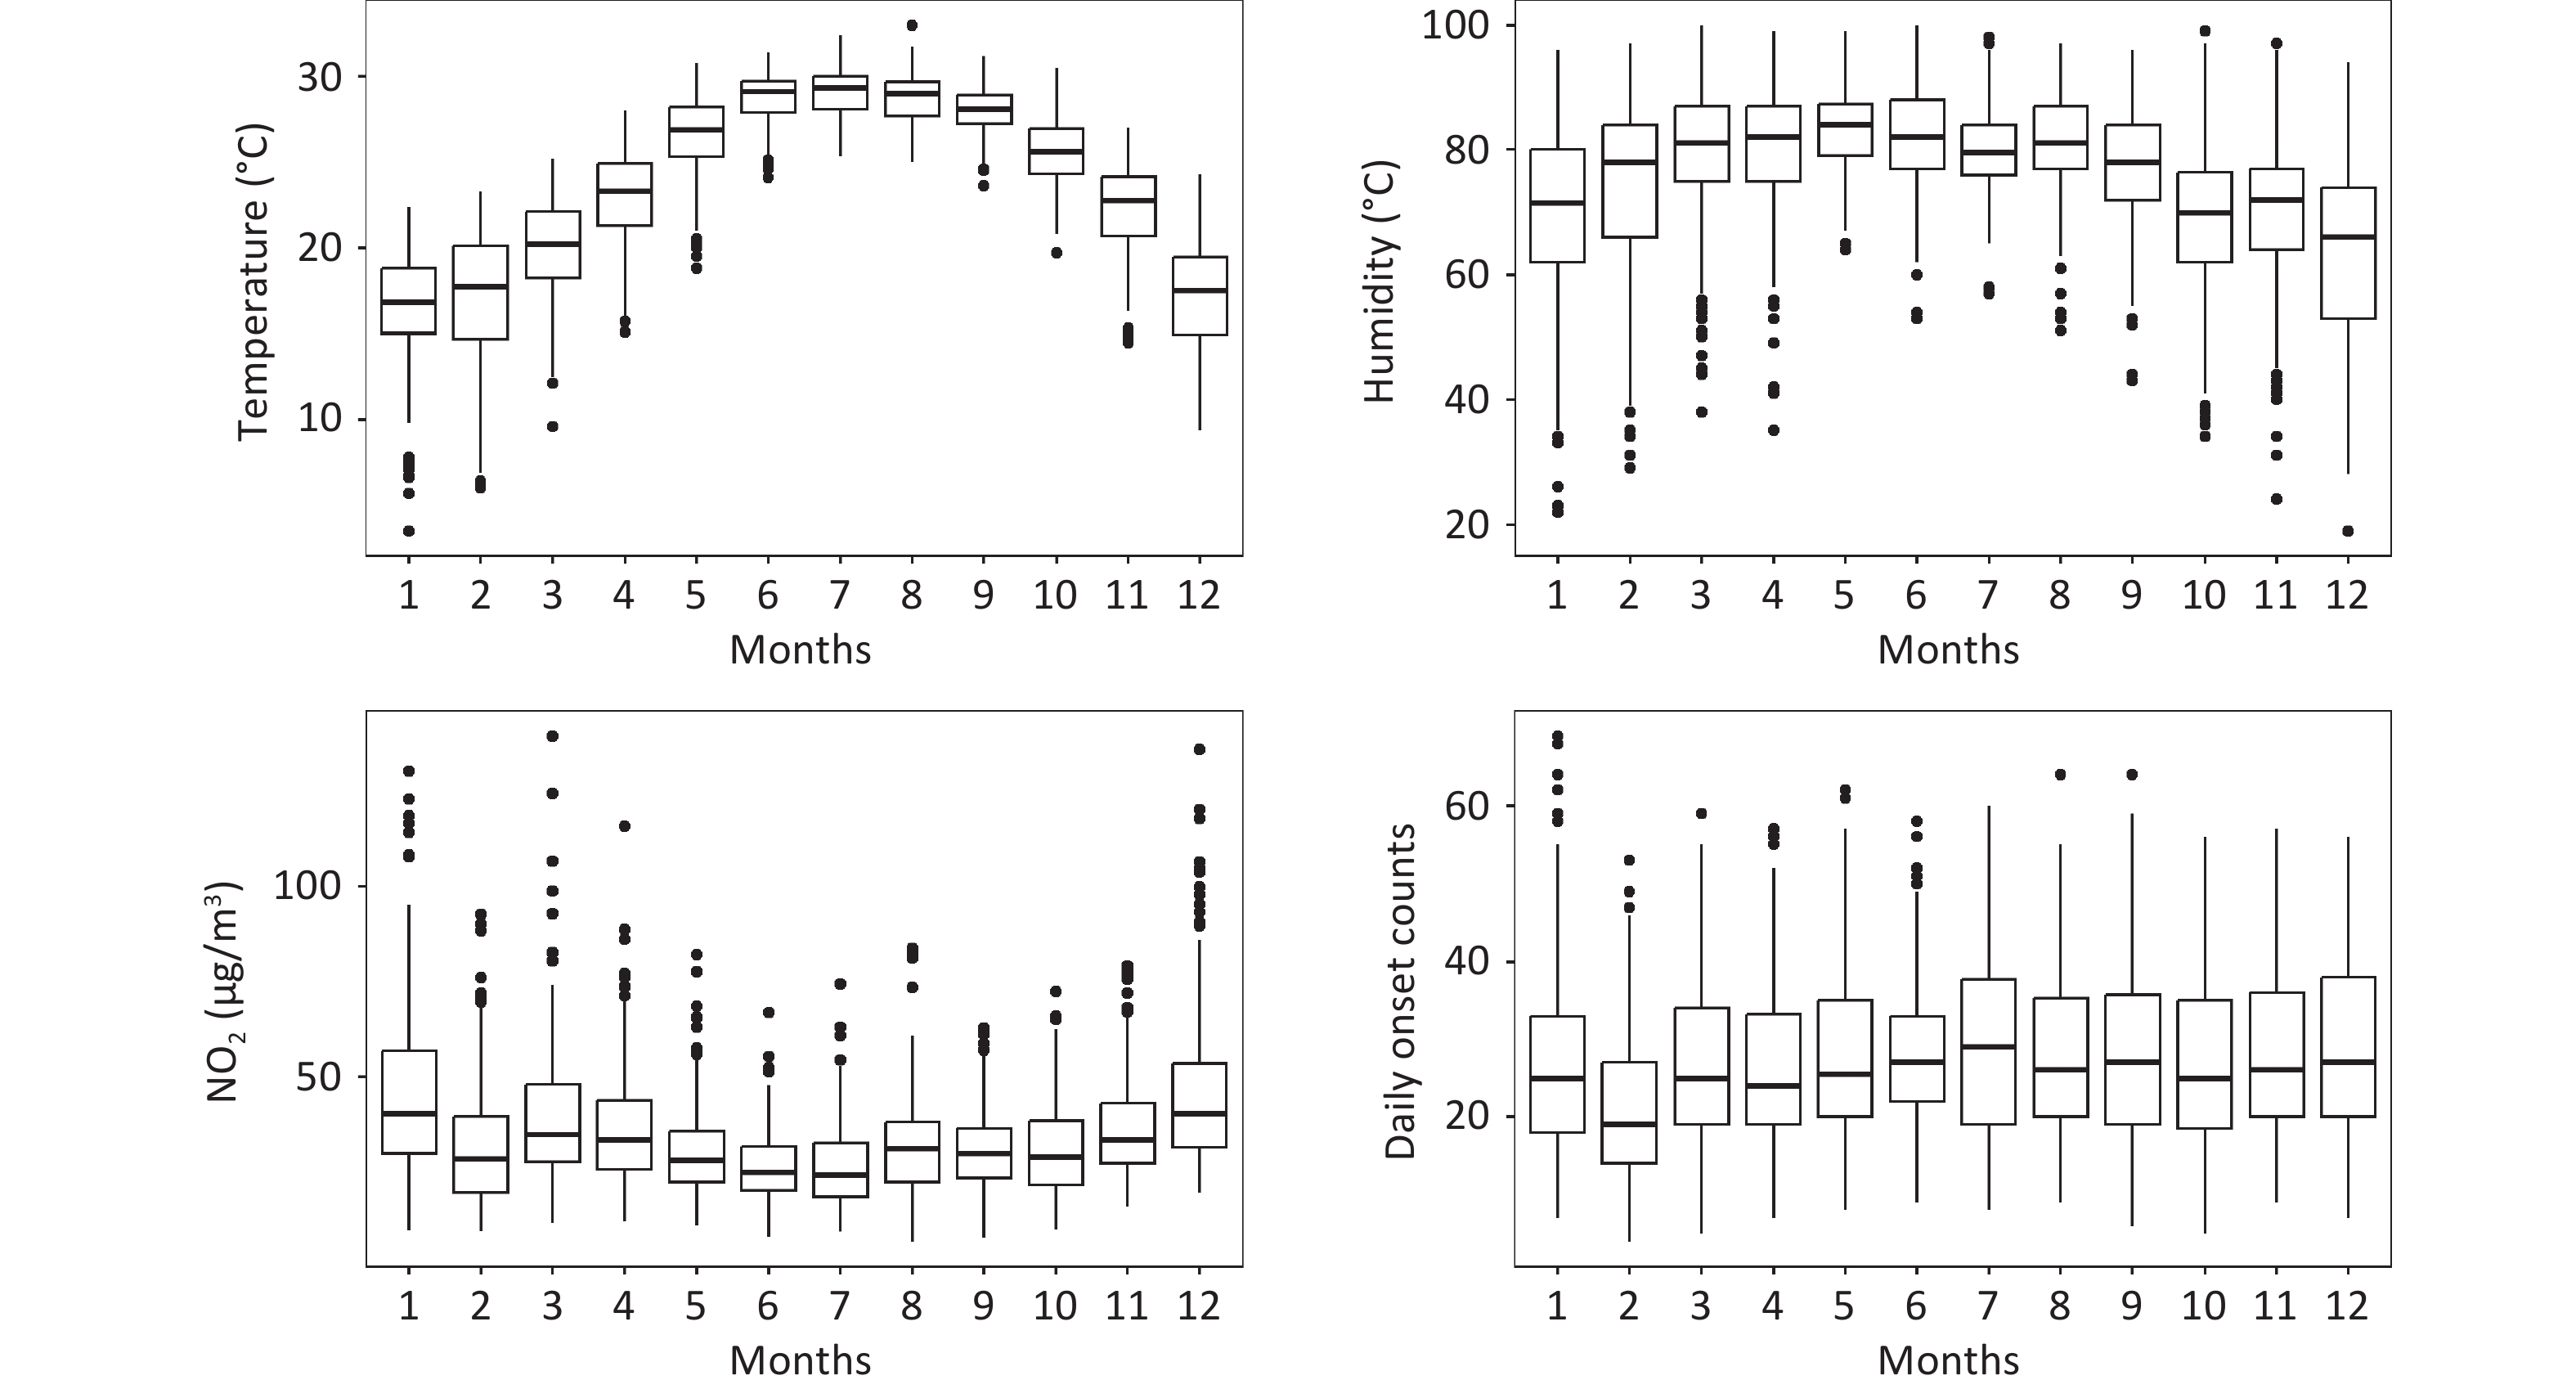
Figure S1. Monthly distributions of ambient temperature, humidity, NO2 concentrations, and first aid volume of neurological diseases in Shenzhen, 2013–2020.
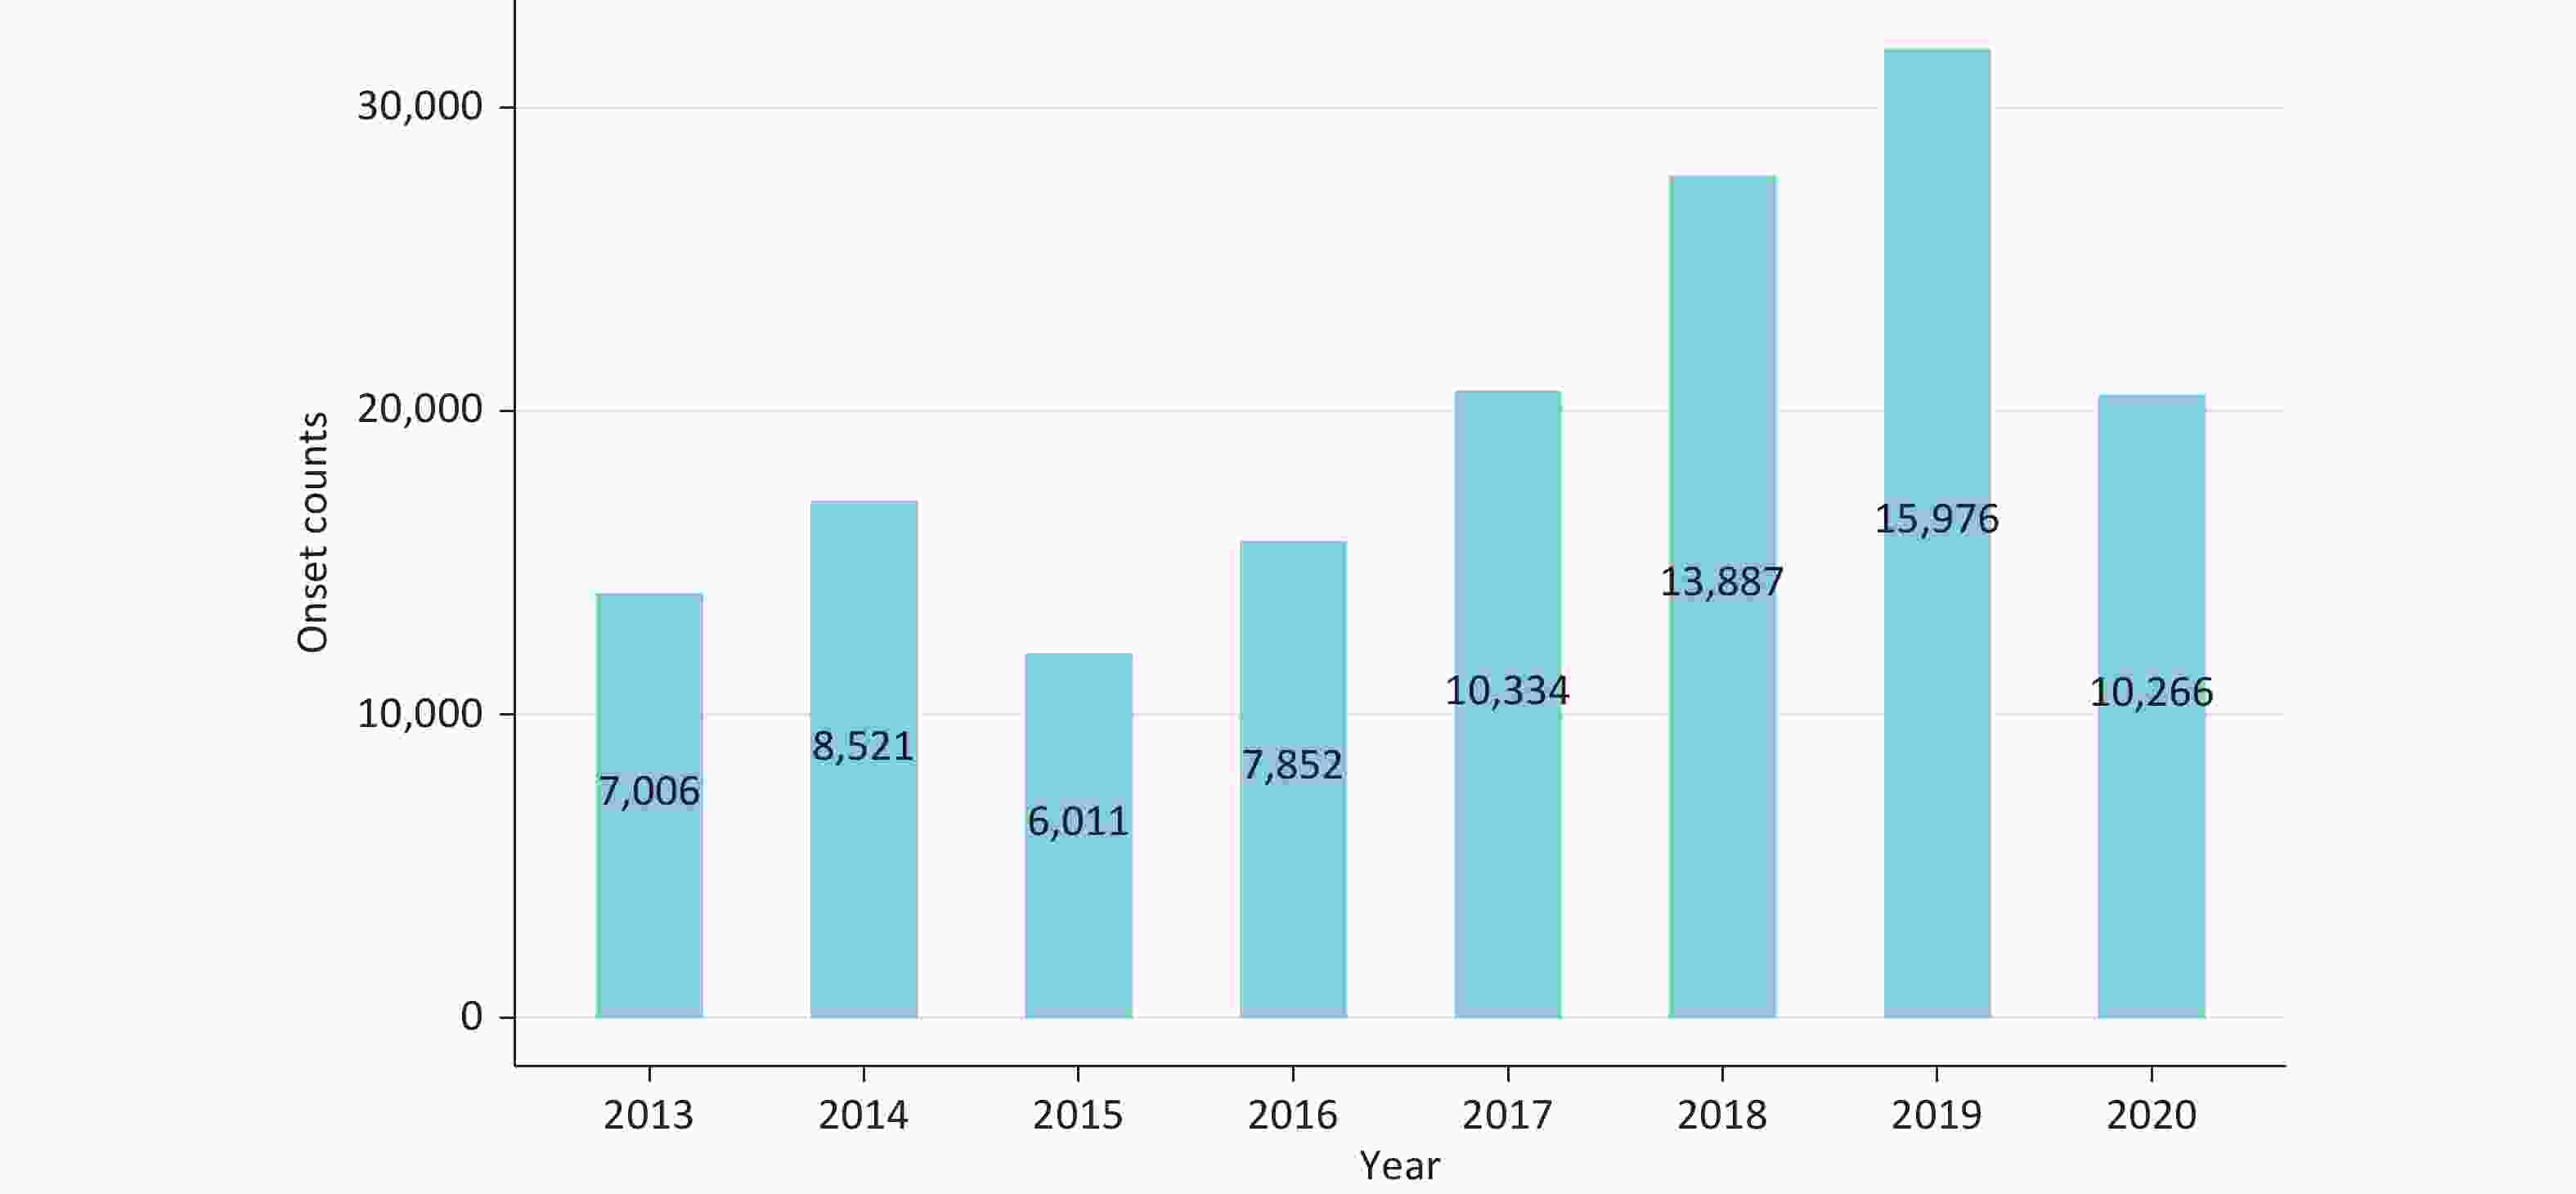
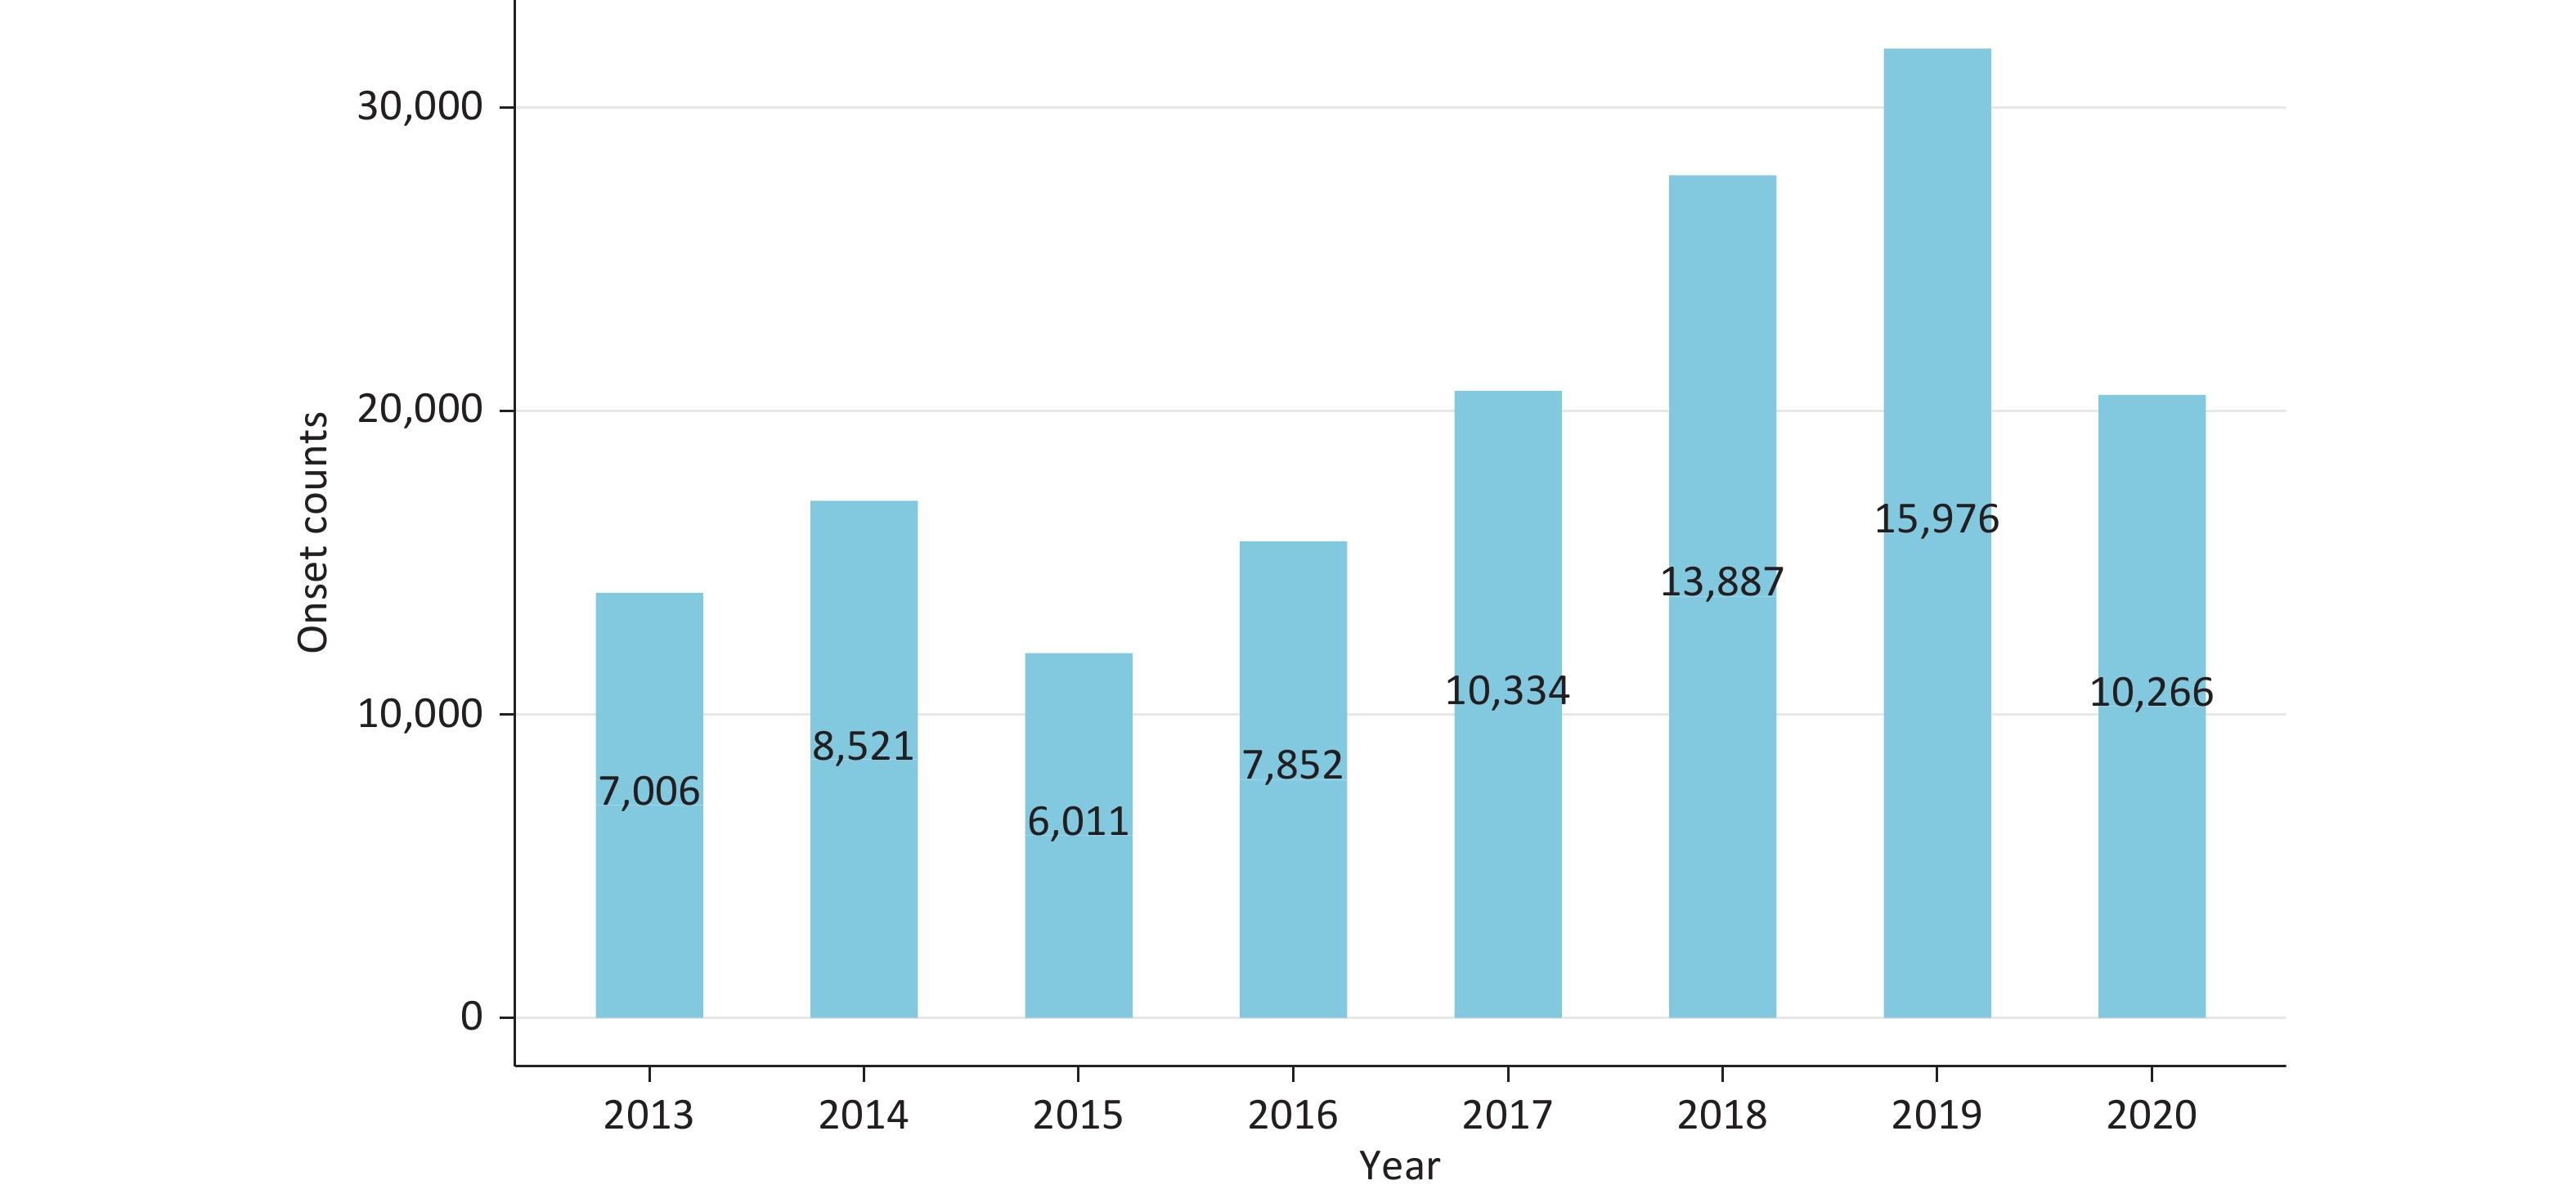
Figure S2. Annual counts of first aid volume of neurological diseases in Shenzhen, 2013–2020.
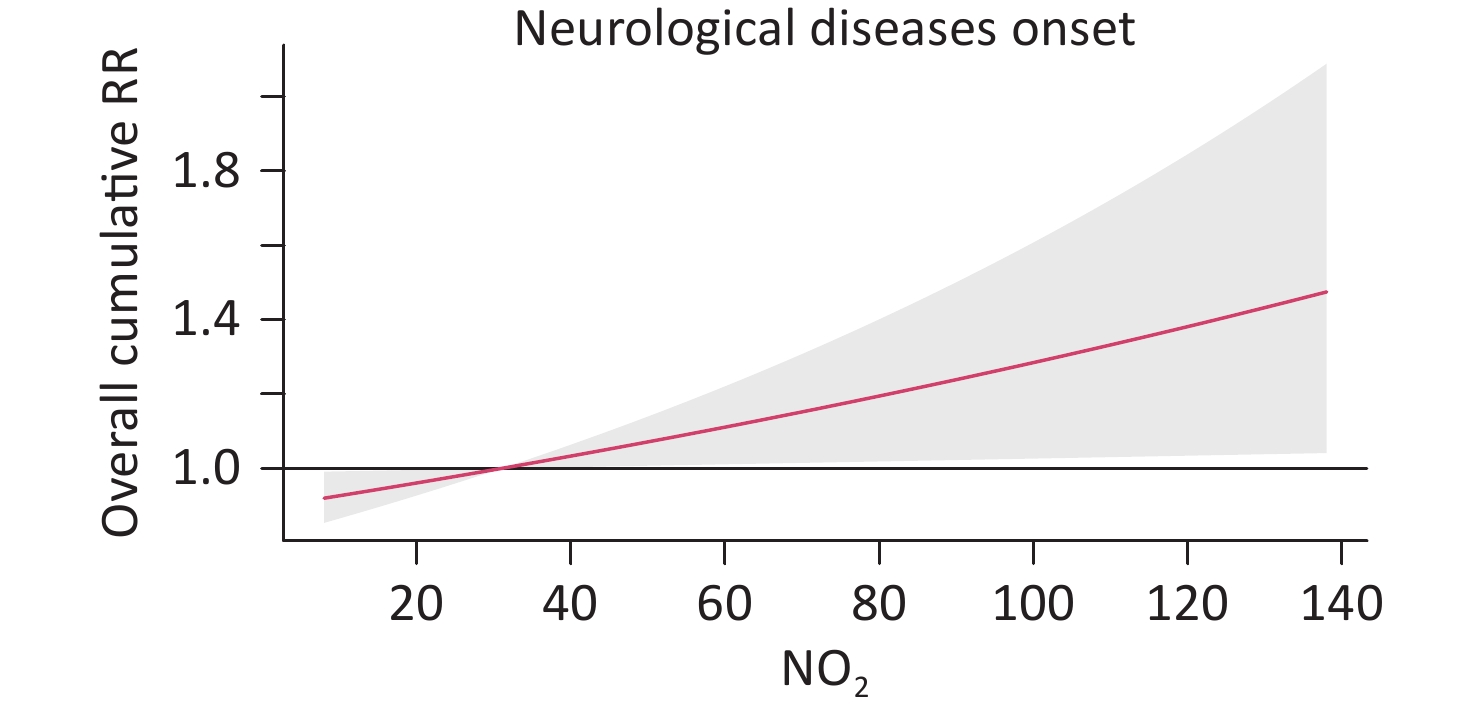
Figure S3. Overall cumulative exposure-response relationships between NO2 air pollutant and neurological diseases first aid onset with 95% CIs.
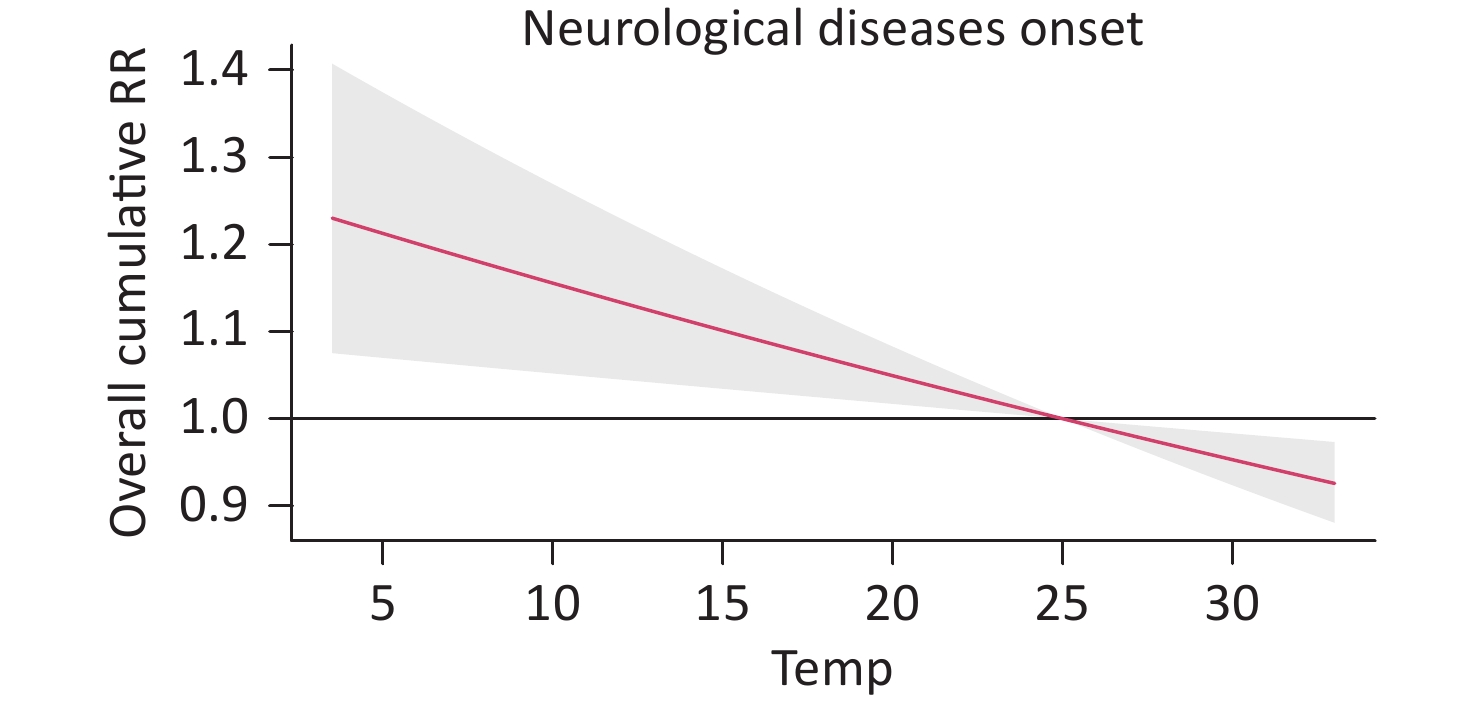
Figure S4. Overall cumulative exposure-response relationships between temperature and neurological diseases first aid onset with 95% CIs.
HTML
 24182+Supplementary Materials.pdf
|

|

 Quick Links
 DownLoad: