


-
Vitamin D plays a critical role in maintaining calcium (Ca) and phosphorus (P) homeostasis as well as bone development and maintenance[1]. Inadequate vitamin D causes osteomalacia, and contributes to and exacerbates osteoporosis in adults. However, universal agreements on methods and thresholds for determining vitamin D deficiency or sufficiency have not been reached[2], which may be associated with differences in race, sex, age, endpoints, and analytical methods. Notably, if we choose an inappropriate threshold, it is likely to overestimate or underestimate the prevalence of hypovitaminosis D.
Different from the women aged > 45 (have age-related changes in hormone levels, metabolism, and other physiological factors) or with pregnancy or lactating (pregnancy and lactation are physiological states that are known to profoundly affect a woman’s hormonal and metabolic profiles), the reproductive system of women of childbearing age is mature, and there is a complete feedback system and a fine and tight coordination function that carries out physiological regulation to keep hormones in balance. However, poor nutritional status increases the risk of adverse pregnancy and postmenopausal diseases. Therefore, during this period, women should pay attention to their nutritional status and physical health. In Chinese women of childbearing age, the prevalence of vitamin D deficiency in urban and rural areas is high, reaching 49.5%[3] and 38.7%[4], respectively, based on the widely used threshold of 20 ng/mL. Moreover, the rate was much higher in pregnant women, reaching 74.8%[5]. However, osteoporosis, clinical fractures, and low bone mass are not common in this population[6,7], and osteomalacia due to vitamin D deficiency in adults is relatively uncommon[8]. Therefore, the application of bone disease outcomes such as low bone mineral density, osteomalacia, and osteoporosis may not be appropriate for investigating the threshold of vitamin D deficiency. There is a need to investigate an optimal threshold for this population with some rational indices and methods.
Because vitamin D deficiency results in a decrease in the absorption of dietary Ca, an increase in parathyroid hormone (PTH) levels, a decrease in bone mineral density[9], and a variety of other health outcomes[10], these endpoints have been widely used to predict optimal 25-hydroxyvitamin D [25(OH)D] levels[11,12]. Several epidemiological studies have estimated the optimal serum concentrations of 25(OH)D for PTH[13], Ca absorption[14], asymptomatic uterine fibroids[15], and breast cancer[16] in premenopausal women. However, the results were inconclusive. Because bone turnover markers (BTMs), including bone formation markers [osteocalcin(OC) and procollagen type 1 N-terminal propeptide (P1NP)] and bone resorption markers [CrossLaps of type 1 collagen containing cross-linked C-telopeptide (CTX)], could reflect the metabolic activity of bone tissue[17], some studies also attempted to explore the optimal 25(OH)D concentrations for BTMs. However, such studies were mainly in the elderly or mixed-gender[18-22], and there are no studies describing the cutoffs for associations of vitamin D with BTMs balance just focusing on women of childbearing age.
Evidence indicates that genetic polymorphisms in cytochrome P450-2R1 (CYP2R1), cytochrome P450-27B1 (CYP27B1), vitamin binding protein (GC), and vitamin D receptor (VDR) genes are associated with lower serum 25(OH)D levels[23,24]. In our previous study, individuals carrying the GG genotype at rs2282679 presented a 2.466-fold higher risk of vitamin D deficiency than those carrying the TT genotype (odds ratio [OR] = 2.466 (1.690–3.598), P < 0.001)[25]. However, to our knowledge, no studies have reported the genetic differences in the threshold-effect associations between serum 25(OH)D and BTMs.
Therefore, we aimed to investigate whether serum 25(OH)D thresholds for BTMs could be determined by employing combined statistical models, in a representative sample of Chinese women of childbearing age. We further analyzed whether there would be differences in the inflection point values among the populations with different alleles. If so, this might provide a useful reference for investigating the thresholds of vitamin D deficiency or sufficiency in women of childbearing age as well as pregnant women.
-
This was a sub-study based on a nationally representative cross-sectional investigation, the 2015 Chinese Chronic Diseases and Nutrition Survey[26]. Women of childbearing age (18−45 years) were eligible for the study. Individuals who were pregnant or lactating were excluded. The minimum sample size of this study was calculated according to the reported vitamin D deficiency rate [approximately 44.1%, 25(OH)D < 20 ng/mL] of Chinese women of childbearing age[3,4] in 2010−2012. The formula was as follows:
$$ N=\frac{{\mu }^{2}p\;(1-p)}{{d}^{2}} $$ (1) N, sample size; p, deficiency rate; μ (confidence level), 1.96; d (allowance error), 3%. The power (1−β) was 0.8. The calculated sample size was 1,053. Subsequently, the population was divided into three age groups: 18−25, 25−35, and 35−45 years, and two participants were randomly selected from each age stratum at each monitoring site. A total of 1,674 samples were selected from 30 provincial administrative regions covering 279 monitoring sites. After excluding participants with missing anthropometric measurements or other pertinent covariates (n = 169), the data for 1,505 participants were included in the final analysis.
-
Fasting blood was drawn between 8:00 and 10:00 AM and serum samples were stored at −80 °C until analysis. All biological indicators were measured according to the manufacturers’ protocols and standard laboratory assay quality control procedures. Serum 25(OH)D2 and 25(OH)D3 were determined by liquid chromatography-tandem mass spectroscopy (AB Sciex Pte. Ltd., Framingham, MA, USA). The standard reference material SRM 972a from the National Institute for Standards and Technology was used to verify the calibration of the assay. Total 25(OH)D consisted of 25(OH)D2 and 25(OH)D3. PTH, OC, β-CTX, and P1NP were determined by electronic chemiluminescence immunoassay (Roche e601, F Hoffmann-La Roche Ltd., Basel, Switzerland). Serum Ca was detected by inductively coupled plasma mass spectrometry (NexION 350, PerkinElmer, Waltham, MA, USA). In addition, a Hitachi 7600-210 ISE automatic biochemistry analyzer (Hitachi 7600, Tokyo, Japan) was used to detect serum P, high sensitivity C-reactive protein (hsCRP), alanine aminotransferase (ALT), creatinine (CRE), and albumin (Alb). All inter- and intra-assay coefficients of variation were ≤ 4.78%. The normal reference ranges used for OC, β-CTX, and P1NP according to the Roche Kit were: 11−43, ≤ 0.573, and 15.13−58.59 ng/mL, respectively. The single nucleotide polymorphism in GC (rs2282679) was detected by the improved multiple ligase detection reactions and followed the Hardy-Weinberg equilibrium in this population, as mentioned in our previous report[25].
-
The basic information (including age, nationality, educational level, smoking and drinking status, physical activity, and disease status) was obtained by questionnaires. Districts were divided into three categories: Eastern, Center, and Western. Regional types were divided into urban and rural areas. China was divided into the Northern and Southern regions according to the Qinling Mountains and the Huaihe River (latitude 33 °N). The season was recorded as either spring (March to May), autumn (September to November), or winter (December to February), according to the month when blood was drawn. The education level was divided into primary (primary school and below), medium (junior/senior high school), and advanced (junior college and above). The intensity of activity was classed into High intensity activity, Medium intensity activity, and Low intensity activity. “High intensity activity” refers to activity that requires considerable physical strength or can cause a significant increase in respiration or heart rate. “Medium intensity activity” refers to activity that requires a moderate amount of physical strength or can cause a slight increase in respiration or heart rate. “Low intensity activity” refers to activity that involves mainly sitting or standing. Bone and joint diseases/conditions included arthritis, fracture, and other diseases associated with the bone or joint. Cigarette smoker refered to current or former smoker. Participants were categorized as alcohol consumers if they had a history of alcohol consumption in the past year. Height and body weight were measured using a uniform height meter and an electronic weight scale, respectively. Body weight was rounded to the nearest kg. Height was measured to the nearest cm. The body mass index (BMI) was calculated as weight (kg) divided by the square of height (m2). The BMI was classified as underweight, normal, overweight, and obese according to the cutoffs of 18.5, 24, and 28 kg/m2, respectively. The serum Ca, as Alb adjusted by the formula [serum Ca−0.02 × (Alb−40)], was termed “corrected Ca”.
-
Analyses were performed using IBM SPSS Statistics software (version 23.0, Chicago, IL) and R version 4.0.3 statistical software, with the mgcv, nlme, and segmented package (The Comprehensive R Archive Network: http://cran.rproject.org). Normal distribution was evaluated by Kolmogorov-Smirnov test. If variables were considered non-normally distributed, they were presented as medians and interquartile ranges (P25–P75). All data comparisons were analyzed with non-parametric statistics. A generalized linear model was used to analyze the relationship between different 25(OH)D levels and BTM concentrations. The above analyses were performed using IBM SPSS Statistics version 23.0 (IBM Corporation, Armonk, NY, USA). To predictthe thresholds of 25(OH)D, R version 4.1.1 statistical software (R Foundation for Statistical Computing, Vienna, Austria) was used. The analysis procedures followed the previous study[27-29]. First, the locally weighted regression and smoothing scatterplot (LOESS) was applied to describe the nonlinear relationship between 25(OH)D and BTMs, and to obtain the potential cutoffs of 25(OH)D, which would be used as the initial cutoffs value in the segmented regression (SR) analysis. Second, the exact cutoffs and the relationships between 25(OH)D and the BTMs before and after the cutoffs were determined by the SR, described as the β coefficient and P-value. Before the LOESS and SR analyses, a generalized additive model was performed to adjust the confounders for 25(OH)D and BTM, respectively. 25(OH)D and BTMs were adjusted for district, regional type, latitude, season, nationality, education, smoking, drinking, exercise, age, BMI, corrected Ca, P, CRE, ALT, hsCRP, PTH, and disease status. P < 0.05 was considered to be statistically significant.
-
As shown in Table 1, the median age was 30.0 (24.0−37.8) years old. The median BMI was 22.7 (20.3−25.1) kg/m2, the median Alb was 53.1 (50.7−55.1) g/L, the median corrected Ca was 2.3 (2.2−2.4) mmol/L, the median P concentration was 1.4 (1.2−1.5) mmol/L, the median ALT concentration was 12.5 (9.0−16.4) U/L, the median CRE concentration was 76.7 (71.0–82.0) nmol/L, the median PTH concentration was 34.2 (26.0−44.4) pg/mL, and the median hsCRP concentration was 0.7 (0.2−1.4) mg/L. Only 5.5% of women claimed to have bone or joint diseases. Additionally, the genetic variant in the GC gene (rs2282679) was not associated with bone or joint diseases (data not shown).
Parameters Median (P25−P75) or N (%) District Eastern 522 (34.7) Center 478 (31.8) Western 505 (33.6) Latitude, ◦N 32.3 (27.8−38.0) Urban 614 (40.8) Season Spring 118 (7.8) Autumn 774 (51.4) Winter 613 (40.7) Nationality Han 1,309 (87.0) Ethnic minorities 196 (13.0) Education Primary 375 (24.9) Medium 876 (58.2) Advanced 254 (16.9) Cigarette smoker 22 (1.5) Alcohol consumer 322 (21.4) High and medium intensity activity 228 (15.2) Bone and joint diseases/conditions 83 (5.5) GC rs2282679 GG 152 (10.1) GT 620 (41.2) TT 733 (48.7) Age, y 30.0 (24.0−37.8) BMI, kg/m2 22.7 (20.3−25.1) ALT, U/L 12.5 (9.0−16.4) CRE, nmol/L 76.7 (71.0–82.0) Alb, g/L 53.1 (50.7−55.1) Corrected Ca, mmol/L 2.3 (2.2−2.4) P, mmol/L 1.4 (1.2−1.5) PTH, pg/mL 34.2 (26.0−44.4) hsCRP, mg/L 0.7 (0.2−1.4) Note. BMI, body mass index; ALT, alanine aminotransferase; CRE, creatinine; Alb, albumin; Ca, calcium; P, phosphorus; PTH, parathyroid hormone; hsCRP, high sensitivity C-reactive protein. Spring, march to may; Autumn, september to november; Winter, december to february. Primary education, primary school and below; Medium education, junior/senior high school; Advanced education, junior college and above. High intensity activity, activity that requires considerable physical strength or can cause a significant increase in respiration or heart rate; Medium intensity activity, activity that requires a moderate amount of physical strength or can cause a slight increase in respiration or heart rate; Low intensity activity, activity that involves mainly sitting or standing. Cigarette smoker, current or former smoker; Alcohol consumers, have a history of alcohol consumption in the past year. Table 1. Characteristics of the study population (n = 1,505)
-
The median 25(OH)D was 16.63 (11.96–22.55) ng/mL, and significant differences were observed between the subgroups, including district, latitude, regional type, season, age, and genotypes. A lower 25(OH)D concentration was found in the western, northern, and urban areas. Women aged 18–25 years or examined in winter had significantly lower 25(OH)D concentrations than the other age or season groups. In addition, the 25(OH)D concentration in individuals carrying the GG genotype at rs2282679 was much lower than that in individuals carrying the TT genotype. By contrast, no statistical differences were found between the nationality, education, BMI, lifestyle subgroups. The serum 25(OH)D concentration was also found to be unassociated with bone and joint diseases/ conditions. The median OC, β-CTX, and P1NP concentrations were 17.23 (13.82–21.36), 0.40 (0.29–0.52), and 52.82 (40.08–68.40) ng/mL, respectively. All these three BTMs were found to be significantly different between the age and BMI groups. OC, and P1NP concentrations were much higher in participants with bone or joint diseases (Table 2).
Parameters N (%) 25(OH)D (ng/mL) OC (ng/mL) β−CTX (ng/mL) P1NP (ng/mL) Median (P25−P75) P1 Median (P25−P75) P2 Median (P25−P75) P3 Median (P25−P75) P4 District Eastern 522
(34.7)18.07
(12.94−24.20)*< 0.001 16.96
(13.76−20.70)0.412 0.39
(0.29−0.50)0.431 51.74
(39.71−65.57)0.198 Central 478
(31.8)15.84
(11.58−21.75)17.39
(13.85−21.47)0.40
(0.29−0.53)52.67
(39.84−68.64)Western 505
(33.6)15.86
(11.33−21.19)17.34
(13.90−21.98)0.40
(0.30−0.53)53.13
(40.58−71.94)Latitude ≥ 33 °N 710
(47.2)12.75
(9.89−16.67)< 0.001 17.02
(13.77−21.18)0.179 0.40
(0.30−0.51)0.656 52.08
(39.86−66.22)0.076 < 33 °N 795
(52.8)20.63
(15.92−25.42)17.64
(13.94−21.62)0.40
(0.29−0.53)53.56
(40.41−70.21)Regional type Urban 614
(40.8)15.24
(11.40−20.88)< 0.001 17.47
(14.17−20.81)0.536 0.41
(0.30−0.50)0.878 54.34
(41.92−66.93)0.455 Rural 891
(59.2)17.61
(12.55−23.87)17.15
(13.65−22.10)0.39
(0.29−0.54)51.70
(39.22−70.18)Season Spring 118
(7.8)16.16
(11.83−21.83)< 0.001 17.65
(14.30−21.90)0.410 0.41
(0.28−0.54)0.165 55.11
(39.40−70.61)0.560 Autumn 774
(51.4)17.60
(12.79−23.39)17.28
(13.73−21.00)0.39
(0.29−0.51)52.59
(39.88−67.72)Winter 613
(40.7)15.42
(11.17−21.63)a17.19
(13.88−21.56)0.40
(0.30−0.54)52.31
(40.53−68.96)Nationality Han 1,309
(87.0)16.63
(12.24−22.29)0.542 17.32
(13.89−21.18)0.876 0.40
(0.30−0.52)0.688 53.00
(40.54−68.04)0.319 Ethnic minorities 196
(13.0)16.72
(10.60−24.03)16.82
(13.26−23.40)0.39
(0.28−0.54)51.15
(36.50−72.20)Education Primary 375
(24.9)16.46
(11.68−22.27)0.286 17.21
(13.91−21.24)0.791 0.40
(0.30−0.52)0.967 52.82
(40.58−68.86)0.930 Medium 876
(58.2)16.88
(12.27−23.04)17.26
(13.74−21.31)0.40
(0.29−0.52)53.03
(39.90−68.27)Advanced 254
(16.9)16.39
(11.99−21.89)17.25
(14.06−21.80)0.40
(0.29−0.52)52.02
(39.24−68.52)Age (years) 18−25 492
(32.7)15.78
(11.65−20.90)b0.016 20.08
(16.72−23.32)*< 0.001 0.48
(0.39−0.58)*< 0.001 63.91
(51.74−77.31)*< 0.001 25−35 519
(34.5)16.66
(12.11−22.81)16.74
(13.94−20.52)*0.39
(0.29−0.50)*50.93
(39.01−65.61)*35−45 494
(32.8)17.31
(12.40−23.44)15.21
(12.30−18.53)*0.33
(0.25−0.42)*44.71
(35.57−55.65)*BMI (kg/m2) < 18.5 136
(9.0)16.18
(11.94−22.09)0.799 19.62
(15.58−23.52)*< 0.001 0.47
(0.33−0.56)< 0.001 60.84
(44.25−74.46)< 0.001 18.5−24 837
(55.6)16.75
(12.07−22.96)17.69
(14.26−21.76)*0.41
(0.30−0.52)54.15
(40.57−69.80)24−28 379
(25.2)16.26
(11.96−22.95)16.25
(13.36−20.37)c,d0.37
(0.28−0.50)c,d49.54
(36.93−63.03)c,d≥ 28 153
(10.2)16.81
(11.79−20.85)16.13
(12.88−18.88)e,f0.37
(0.27−0.48)e,f48.55
(39.46−63.04)eCigarette smoker Yes 22
(1.5)15.93
(11.78−21.12)0.853 17.68
(15.29−26.48)0.298 0.44
(0.32−0.58)0.479 58.15
(43.25−71.77)0.279 No 1483
(98.5)16.64
(11.96−22.60)17.23
(13.80−21.33)0.40
(0.29−0.52)52.66
(39.94−68.37)Alcohol consumer Yes 322
(21.4)16.73
(12.01−22.41)0.895 17.22
(13.84−21.25)0.775 0.40
(0.29−0.52)0.932 52.86
(40.77−68.90)0.690 No 1183
(78.6)16.59
(11.93−22.61)17.24
(13.80−21.43)0.40
(0.29−0.52)52.79
(39.82−68.34)Exercise Yes 228
(15.2)15.48
(11.85−20.83)0.091 17.18
(14.66−21.10)0.983 0.42
(0.3−0.51)0.720 55.77
(42.04−68.02)0.253 No 1277
(84.8)16.77
(12.00−22.85)17.27
(13.76−21.48)0.40
(0.29−0.52)52.00
(39.77−68.67)Bone and joint diseases 0.679 0.026 0.068 0.040 Yes 83
(5.5)16.47
(12.57−23.28)15.24
(13.21−19.33)0.36
(0.28−0.47)48.81
(36.48−60.58)No 1422
(94.5)16.65
(11.90−22.54)17.34
(13.90−21.39)0.40
(0.29−0.52)53.16
(40.10−68.74)GC rs2282679 GG 152
(10.1)14.11
(10.68−18.91)*< 0.001 16.69
(13.48−21.03)0.478 0.38
(0.29−0.48)0.193 51.68
(38.22−68.36)0.356 GT 620
(41.2)16.15
(11.87−21.15)*17.49
(13.92−21.83)0.41
(0.29−0.54)53.34
(40.78−69.10)TT 733
(48.7)17.73
(12.54−23.89)*17.17
(13.77−21.35)0.40
(0.29−0.52)52.40
(39.85−67.59)All 1505
(100.00)16.63
(11.96−22.55)17.23
(13.82−21.36)0.40
(0.29−0.52)52.82
(40.08−68.40)Note. *Compared with other groups; a: autumn vs. winter; b: 18−25 years vs. 35−45 years; c and d: 24−28 kg/m2 vs. < 18.5 and 18.5−24 kg/m2; e and f: ≥ 28 kg/m2 vs. < 18.5 and 18.5−24 kg/m2, P < 0.05. 25(OH)D, 25−hydroxyvitamin D; OC, osteocalcin; β−CTX, β−CrossLaps of type 1 collagen containing cross−linked C−telopeptide; P1NP, procollagen type 1 N−terminal propeptide; BMI, body mass index. Spring, March to May; Autumn, September to November; Winter, December to February. Primary education, primary school and below; Medium education, junior/senior high school; Advanced education, junior college and above. Exercise, high intensity activity plus medium intensity activity. High intensity activity, activity that requires considerable physical strength or can cause a significant increase in respiration or heart rate; Medium intensity activity, activity that requires a moderate amount of physical strength or can cause a slight increase in respiration or heart rate. Table 2. Serum 25(OH)D, OC, β−CTX, and P1NP levels of the study population (medians [P25−P75])
-
In this study, we stratified the 25(OH)D status according to the existing domestic vitamin D deficiency screening standards[30]. As shown in Table 3, 25.18% of the women displayed low serum 25(OH)D (< 12 ng/mL). After adjusting for district, latitude, regional type, season, nationality, education, smoking, drinking, exercise, bone and joint disease/conditions, age, BMI, corrected Ca, P, PTH, CRE, ALT, and hsCRP, β-CTX was much higher in the < 12 ng/mL group compared with the ≥ 30 ng/mL group (P = 0.048). However, no OC and P1NP differences were found between between different 25(OH)D concentrations (P > 0.05).
25(OH)D concentrations
(ng/mL)N (%) OC (ng/mL) β−CTX (ng/mL) P1NP (ng/mL) β (95% CI) P β (95% CI) P β (95% CI) P < 12 379 (25.18) 1.510 (−0.280, 3.301) 0.098 0.055 (0.0004, 0.109) 0.048 4.720 (−2.059, 11.500) 0.172 12−20 601 (39.93) 1.111 (−0.540, 2.762) 0.187 0.044 (−0.006, 0.094) 0.086 6.081 (−1.170, 12.332) 0.057 20−30 437 (29.04) 1.148 (−0.449, 2.746) 0.159 0.045 (−0.003, 0.094) 0.067 5.223 (−0.827, 11.272) 0.091 ≥ 30 88 (5.85) 0 0 0 Note. Vitamin D deficiency: 25(OH)D < 12 ng/mL; Vitamin D insufficiency: 25(OH)D 12−20 ng/mL; Vitamin D sufficiency (recommended by the Institute of Medicine): 25(OH)D ≥ 20 ng/mL; Vitamin D sufficiency(recommended by the Endocrine Society): 25(OH)D ≥ 30 ng/mL. 25(OH)D, 25−hydroxyvitamin D; OC, osteocalcin; β−CTX, β−CrossLaps of type 1 collagen containing cross−linked C−telopeptide; P1NP, procollagen type 1 N−terminal propeptide; OC, β−CTX and P1NP was adjusted for district, latitude, regional type, season, nationality, education, smoking, drinking, exercise, bone and joint disease/conditions, age, BMI, corrected Ca, P, PTH, CRE, ALT, and hsCRP. BMI, body mass index; Ca, calcium; P, phosphorus; PTH, parathyroid hormone; CRE, creatinine; ALT, alanine aminotransferase; hsCRP, high sensitivity C−reactive protein. Table 3. Relationship with bone turnover markers and different 25(OH)D concentrations by generalized linear model
-
Figure 1 shows the unadjusted and adjusted LOESS scatter plots of the non-linear relationships of serum 25(OH)D with BTMs. These non-linear relationships were more pronounced after adjusting for confounding factors.
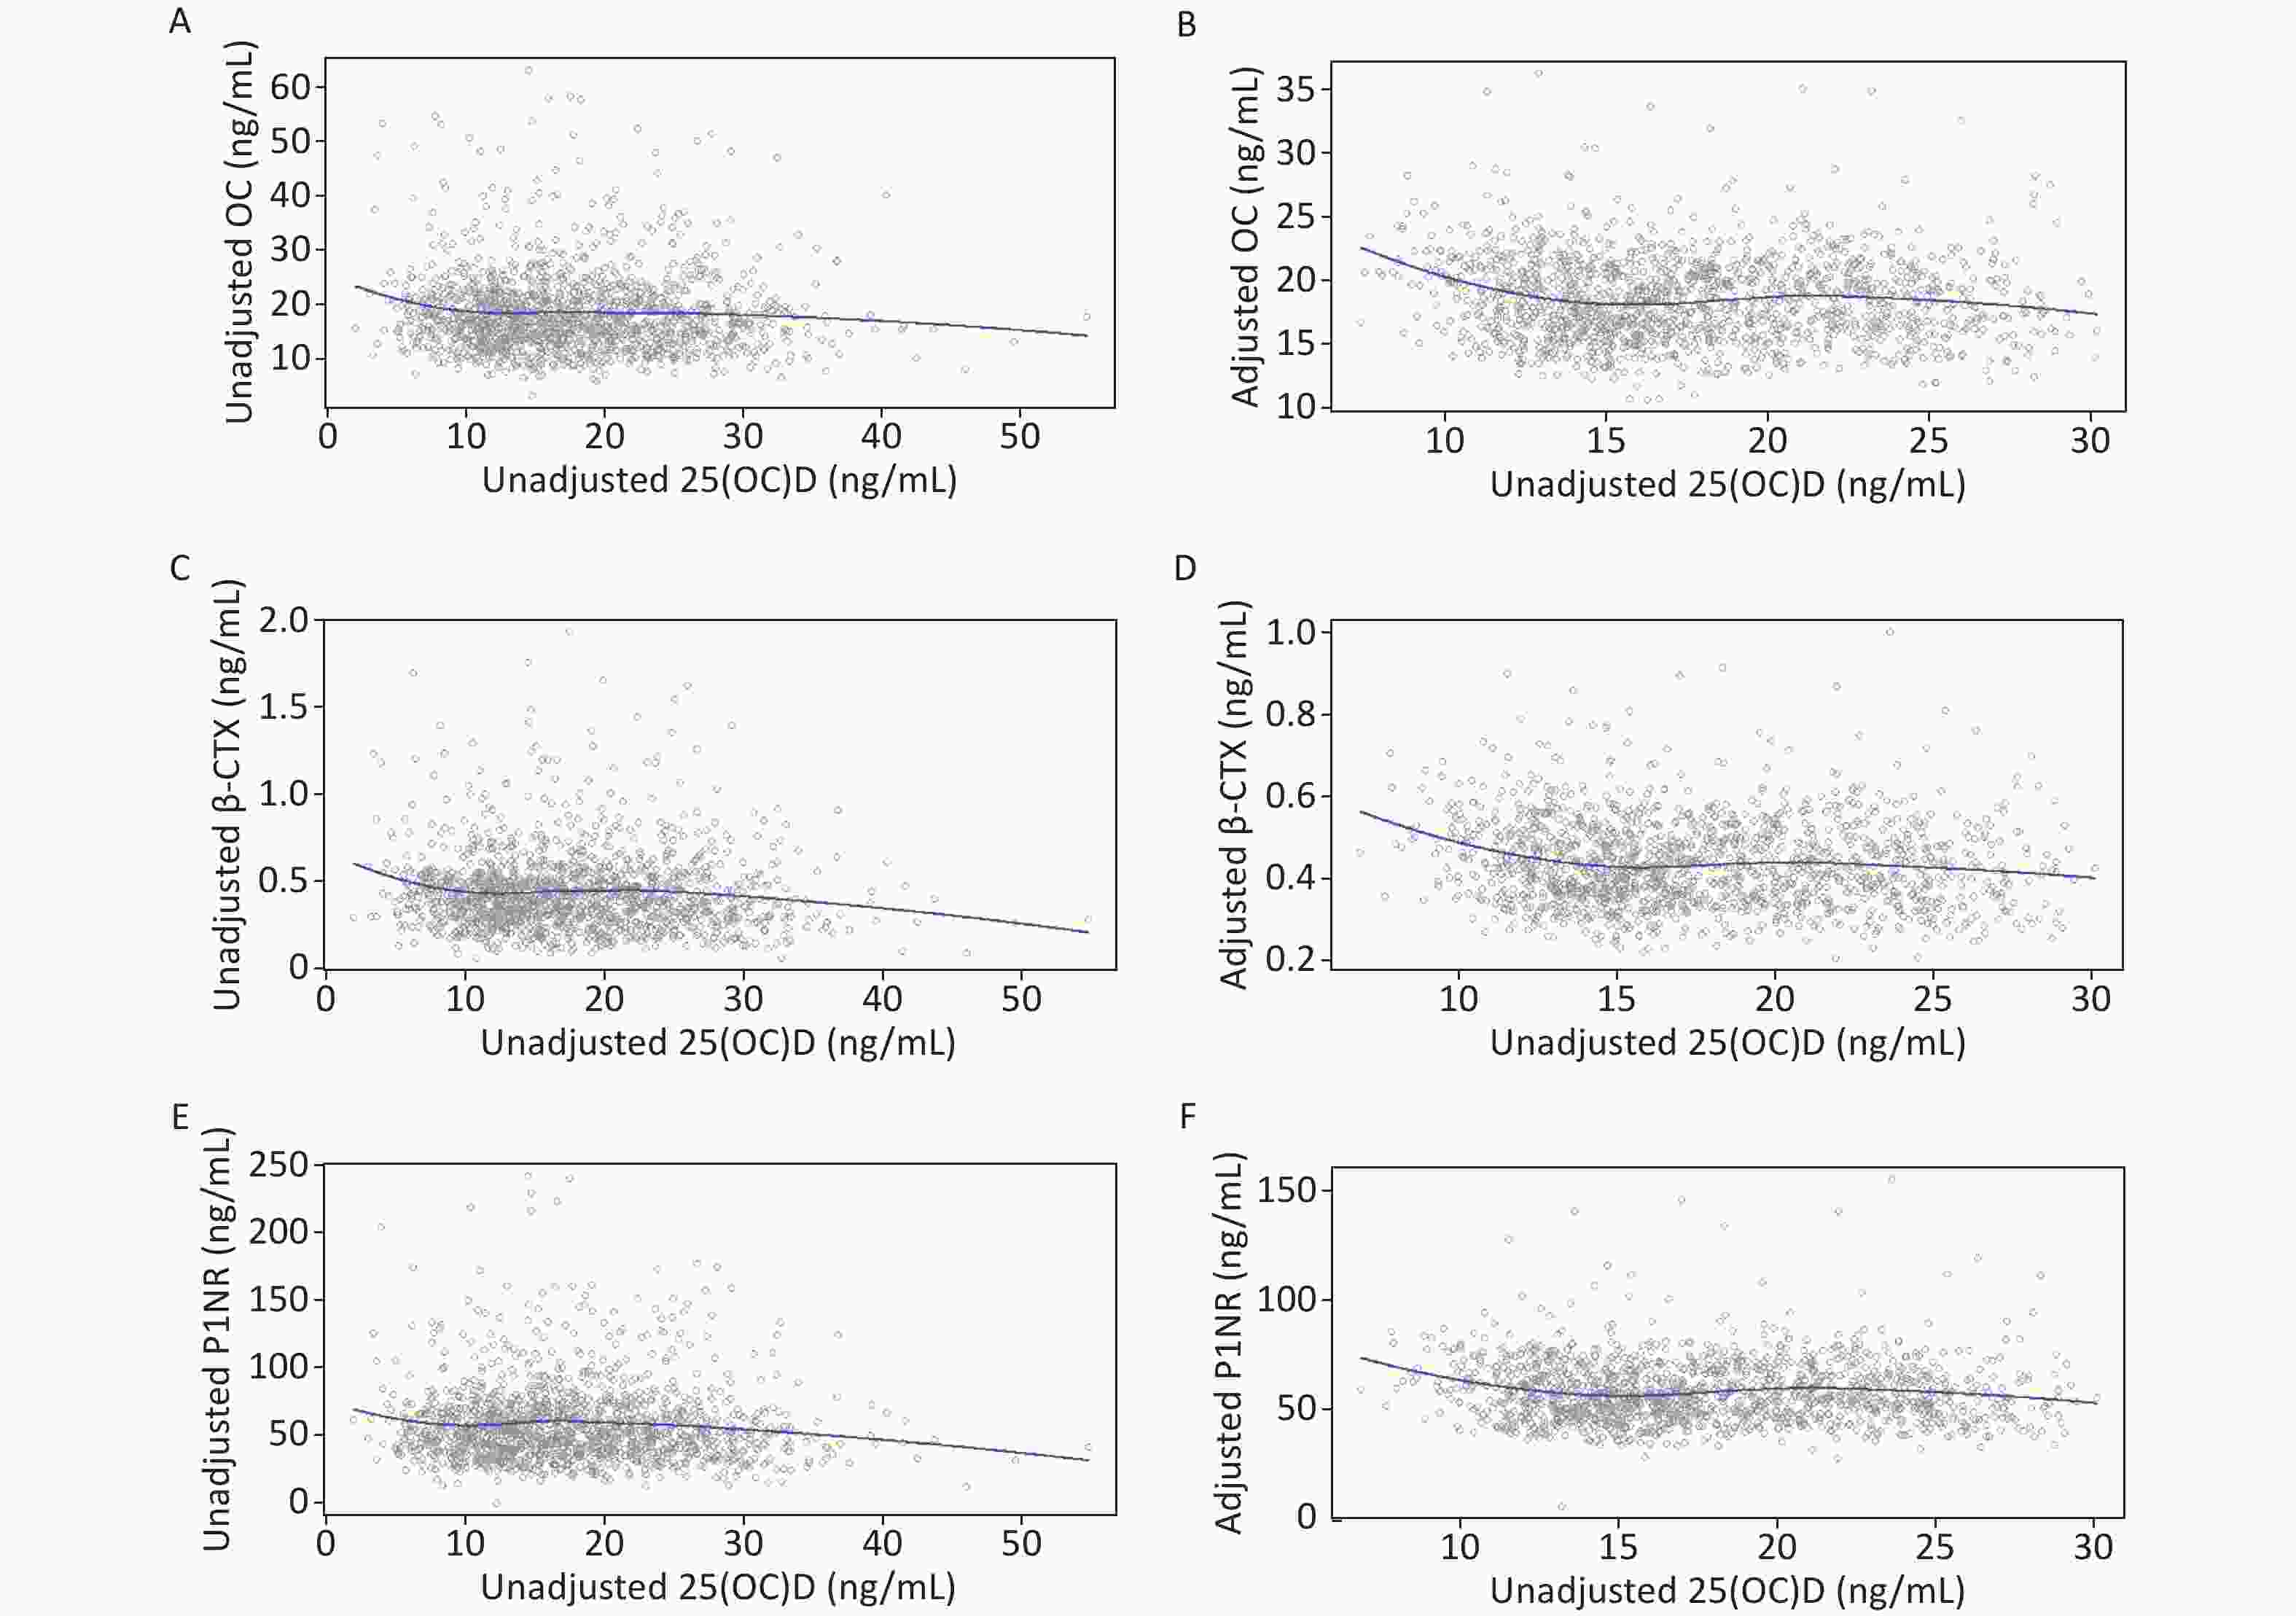
Figure 1. LOESS of unadjusted and adjusted relationships between 25(OH)D and BTMs: y–OC, β-CTX or P1NP, x–unadjusted or adjusted 25(OH)D. (A), (C), and (E): serum 25(OH)D was unadjusted. (B), (D), and (F): serum 25(OH)D and BTMs were adjusted for district, latitude, regional type, season, nationality, education, smoking, drinking, exercise, bone and joint disease status, age, BMI, corrected Ca, P, PTH, CRE, ALT, and hsCRP. 25(OH)D, 25-hydroxyvitamin D; BTMs, bone turnover markers; OC, osteocalcin; β-CTX, β-CrossLaps of type 1 collagen containing cross-linked C-telopeptide; P1NP, procollagen type 1 N-terminal propeptide; BMI, body mass index; Ca, calcium; P, phosphorus; PTH, parathyroid hormone; CRE, creatinine; ALT, alanine aminotransferase; hsCRP, high sensitivity C-reactive protein.
-
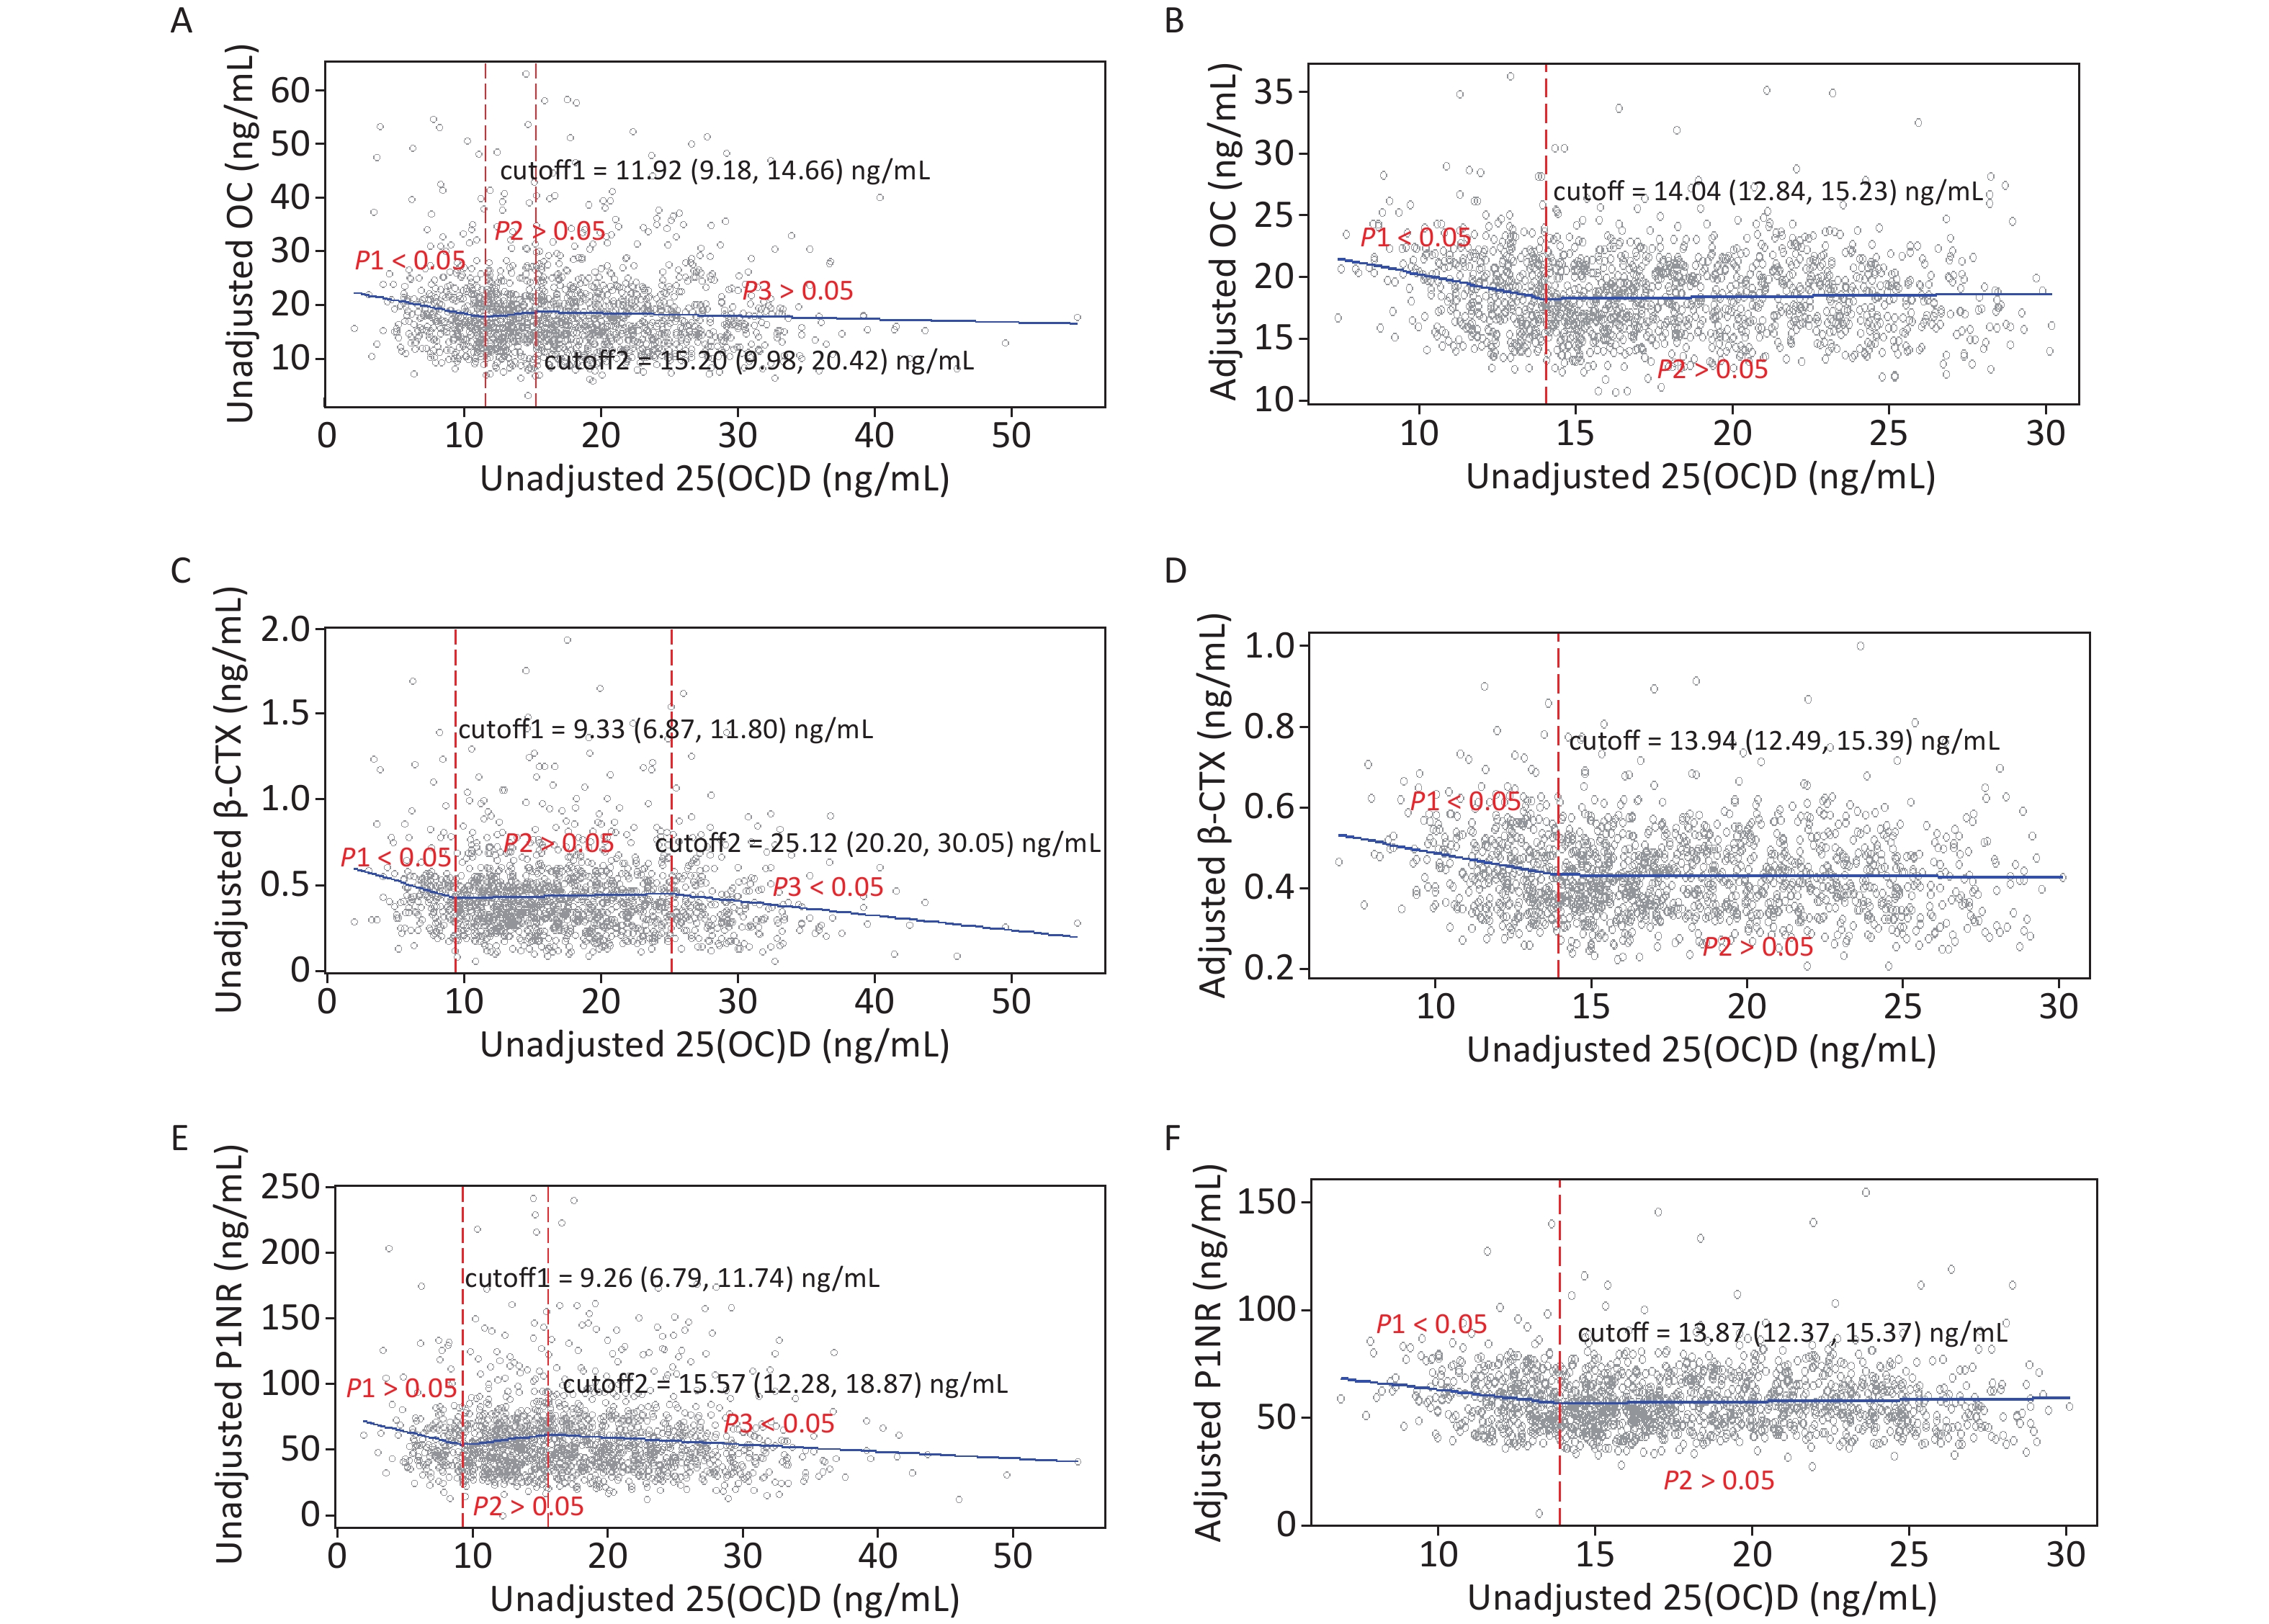
Figure 2 gives the exact cutoffs by the SR model. In the unadjusted models, the first cutoff for all endpoints ranged from 9.26 to 11.92 ng/mL and the second cutoff was from 15.20 to 25.12 ng/mL. In the adjusted models, one optimal 25(OH)D inflection point was estimated for each BTM. The adjusted 25(OH)D cutoffs for OC, β-CTX, and P1NP were 14.04 (12.84–15.23), 13.94 (12.49–15.39), and 13.87 (12.37–15.37) ng/mL, respectively.
Figure 2. Cutoffs of unadjusted and adjusted 25(OH)D in view of BTMs: y–OC, β-CTX or P1NP, x–unadjusted or adjusted 25(OH)D; (A), (C), and (E): serum 25(OH)D was unadjusted. (B), (D), and (F): serum 25(OH)D and BTMs were adjusted for district, latitude, regional type, season, nationality, education, smoking, drinking, exercise, bone and joint disease status, age, BMI, corrected Ca, P, PTH, CRE, ALT, and hsCRP. 25(OH)D, 25-hydroxyvitamin D; BTMs, bone turnover markers; OC, osteocalcin; β-CTX, β-CrossLaps of type 1 collagen containing cross-linked C-telopeptide; P1NP, procollagen type 1 N-terminal propeptide; BMI, body mass index; Ca, calcium; P, phosphorus; PTH, parathyroid hormone; CRE, creatinine; ALT, alanine aminotransferase; hsCRP, high sensitivity C-reactive protein.
-
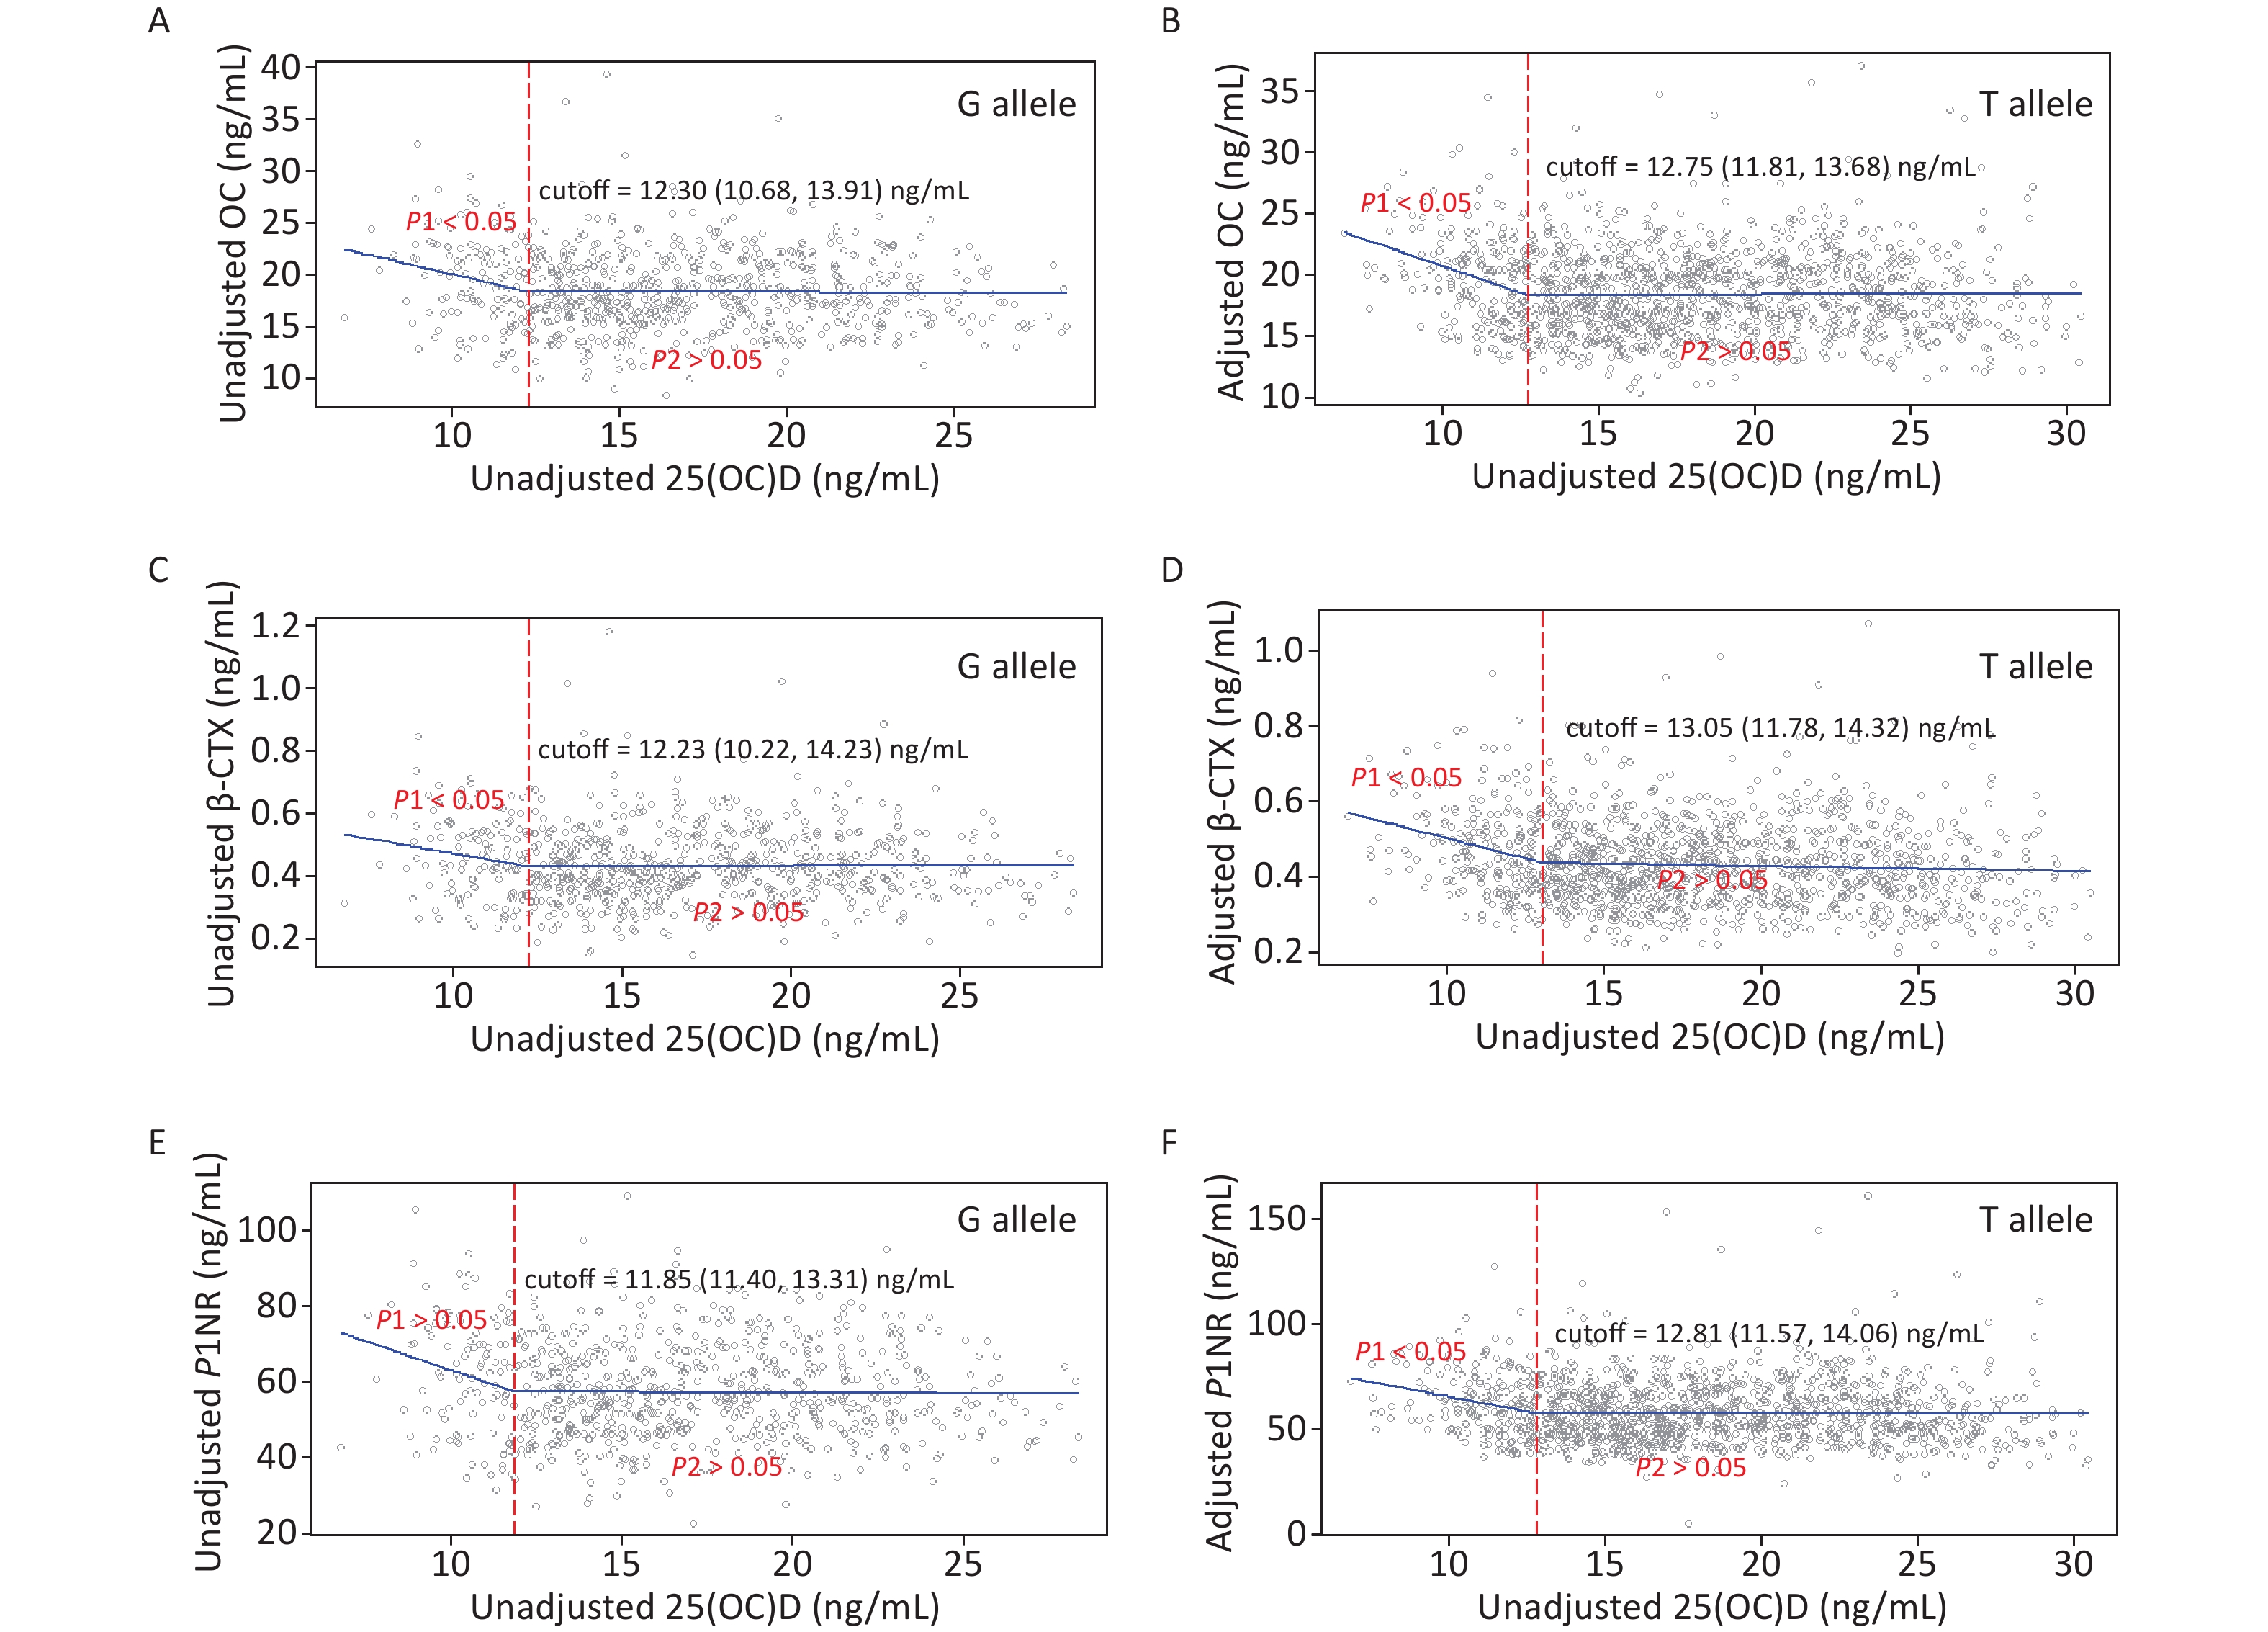
Figure 3 gives the exact 25(OH)D cutoffs after adjustment by the SR model for different allele carriers. The cutoff in women with the G allele for all endpoints ranged from 11.85–12.30 ng/mL. In women with the T allele, the cutoffs were also observed, ranging from 12.75 to 13.05 ng/mL.
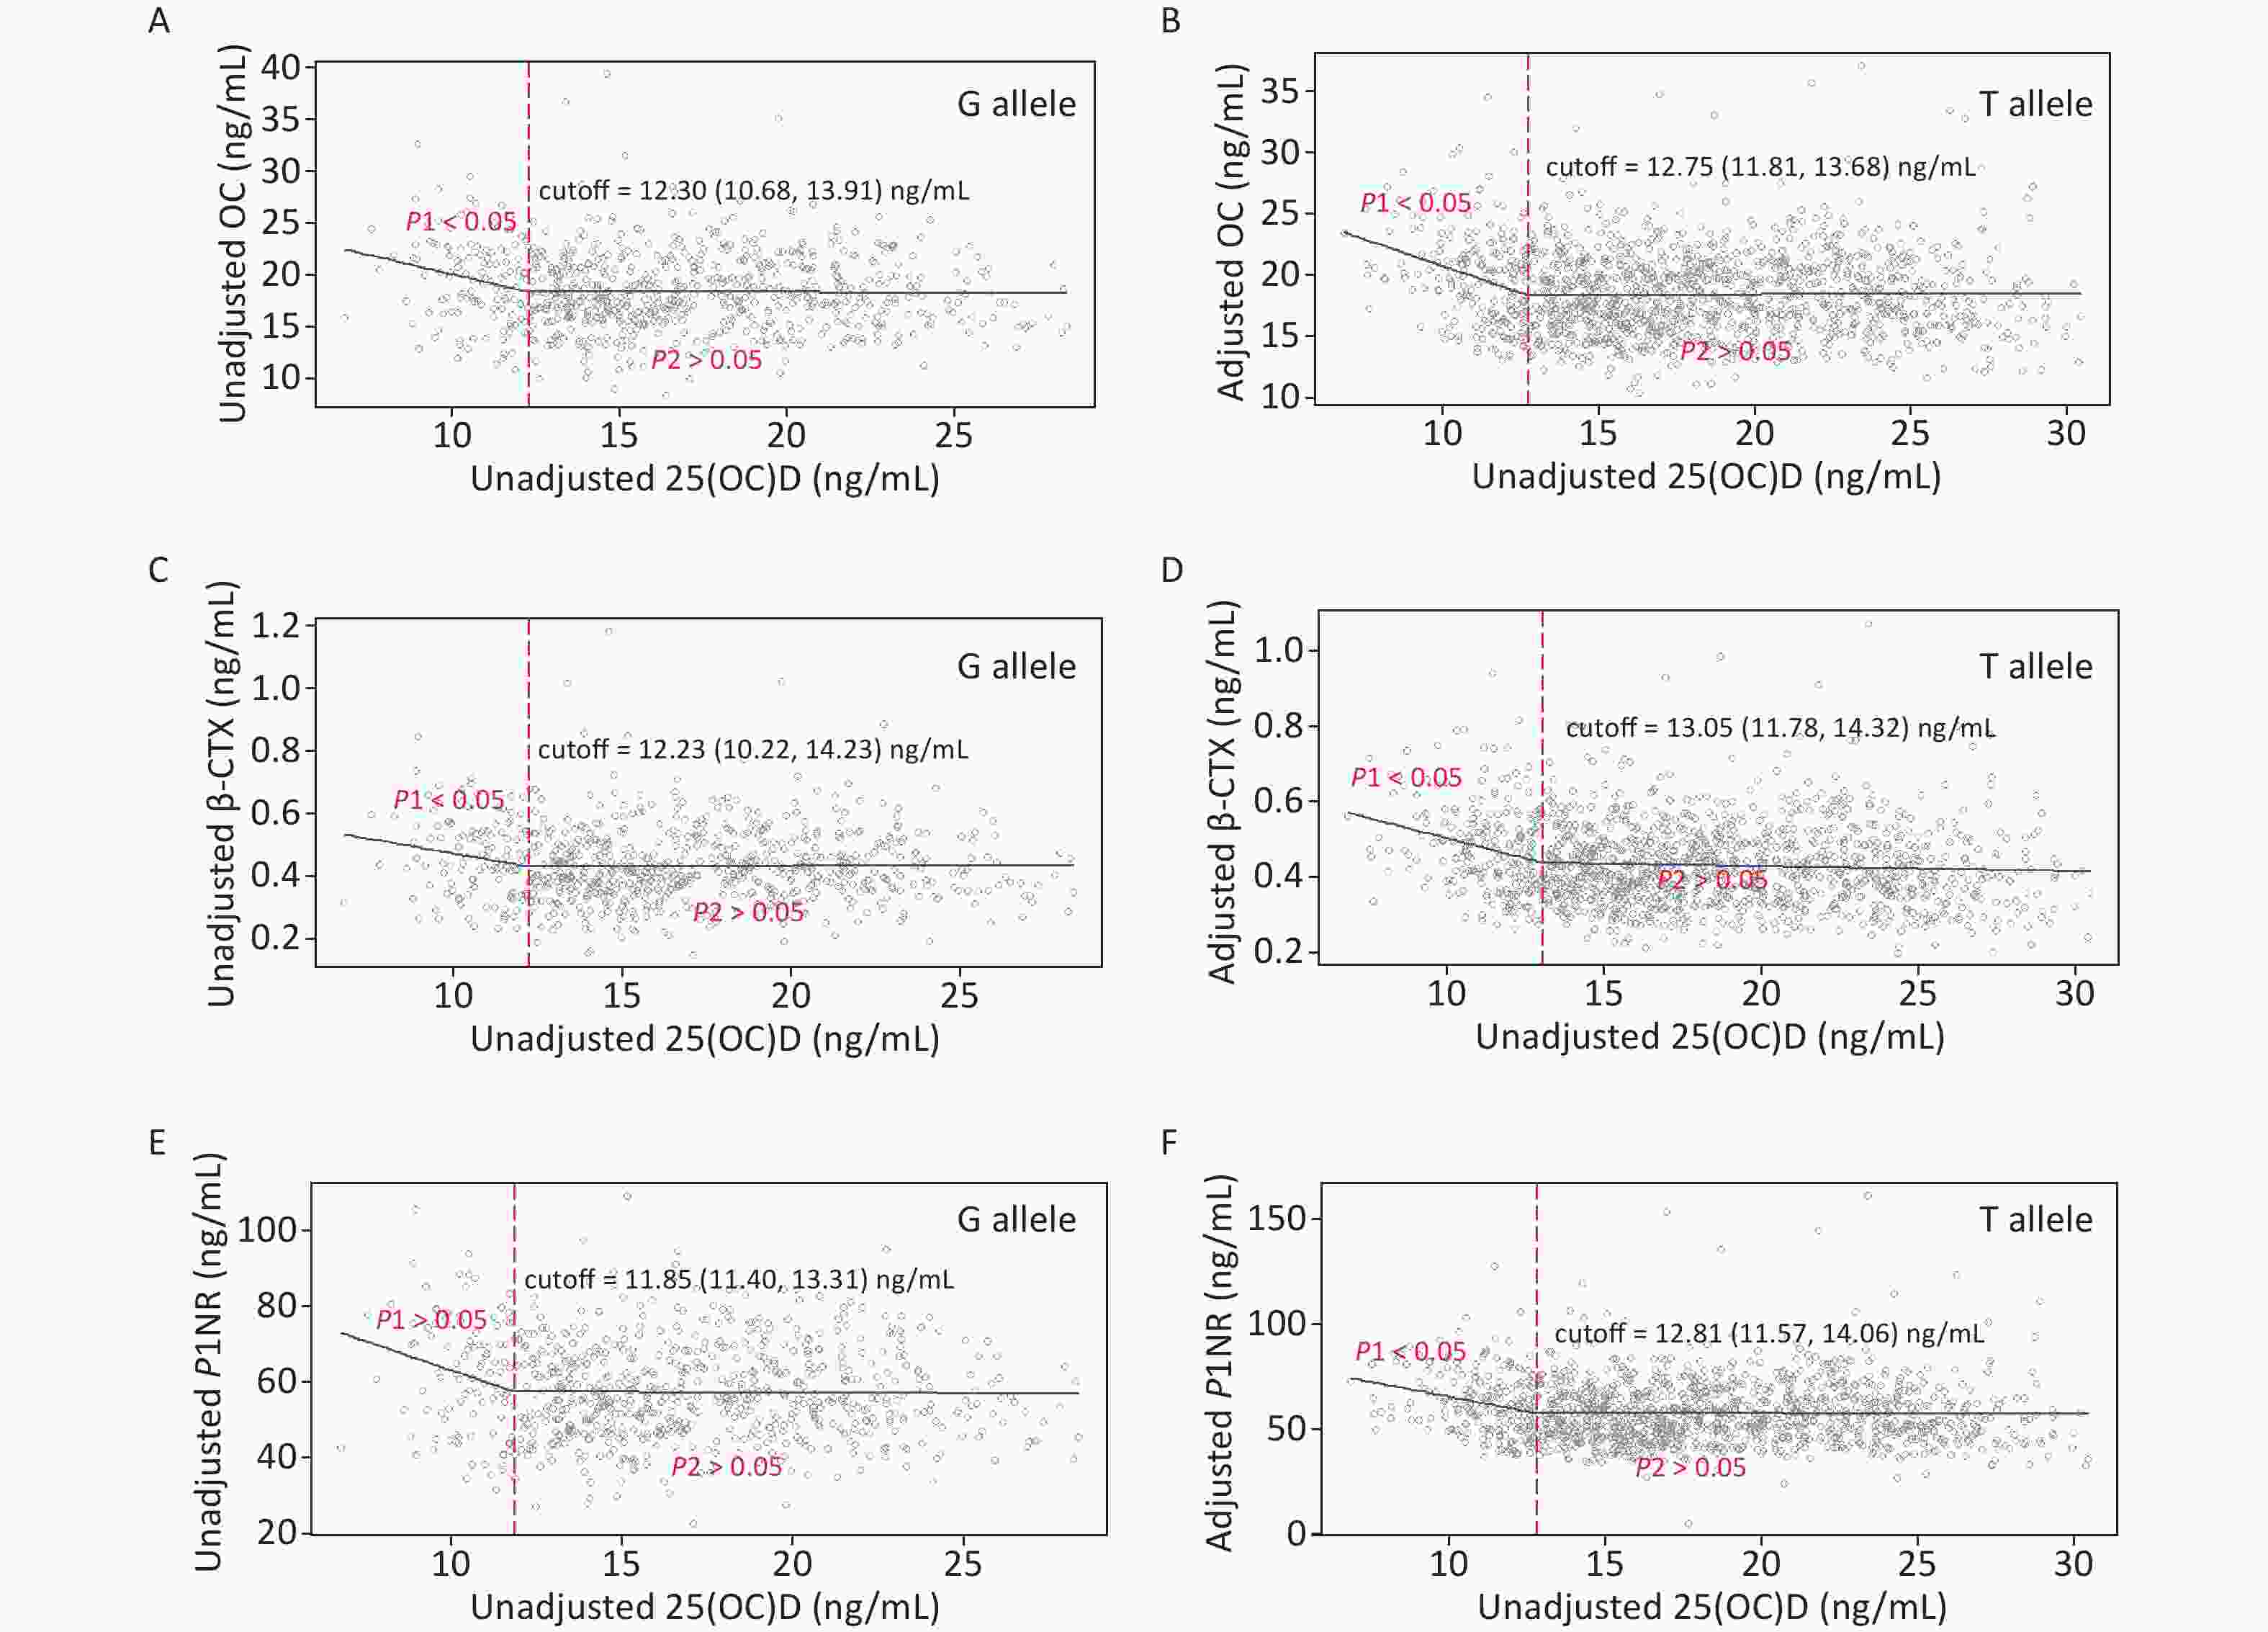
Figure 3. Cutoffs of unadjusted and adjusted 25(OH)D in view of BTMs: y–OC, β-CTX or P1NP, x–unadjusted or adjusted 25(OH)D; (A), (C), and (E): serum 25(OH)D was unadjusted. (B), (D), and (F): serum 25(OH)D was adjusted for district, latitude, regional type, season, nationality, education, smoking, drinking, exercise, bone and joint disease status, age, BMI, corrected Ca, P, PTH, and hsCRP. Each BTM was adjusted for district, latitude, regional type, season, bone and joint disease/conditions, age, BMI, corrected Ca, P, PTH, CRE, ALT, and hsCRP. 25(OH)D, 25-hydroxyvitamin D; BTMs, bone turnover markers; OC, osteocalcin; β-CTX, β-CrossLaps of type 1 collagen containing cross-linked C-telopeptide; P1NP, procollagen type 1 N-terminal propeptide; BMI, body mass index; Ca, calcium; P, phosphorus; PTH, parathyroid hormone; CRE, creatinine; ALT, alanine aminotransferase; hsCRP, high sensitivity C-reactive protein.
-
Unadjusted and adjusted analyses by the SR models for associations between 25(OH)D concentration and BTMs in participants with 25(OH)D concentration below and above the cutoffs are presented in Table 4. In the unadjusted models, OC and β-CTX were negatively associated with 25(OH)D below the first cutoffs, while statistically significant associations were also observed for β-CTX and P1NP above the second cutoffs. After adjustment, lower 25(OH)D concentrations were associated with increased BTMs below the cutoffs. Above the 25(OH)D cutoffs, BTMs plateaued. Carriers of the G allele and T allele showed similar results. In addition, the cutoff values of G allele carriers, where BTMs began to plateau, were slightly lower than that of T allele carriers.
Unadjusted and adjusted BTMs Below cutoff 1 β (95% CI) Cutoff 1 Above cutoff 1 β (95% CI) Cutoff 2 Above cutoff 2 β (95% CI) Total−unadjusted OC −0.45 (−0.80, −0.10) 11.92 0.32 (−0.61, 1.26) 15.20 −0.06 (−0.15, 0.03) β−CTX −0.02 (−0.05,−0.002) 9.33 0.0016 (−0.0014, 0.0047) 25.12 −0.009 (−0.015, −0.002) P1NP −2.44 (−5.32,0.42) 9.26 1.24 (−0.15, 2.64) 15.57 −0.53 (−0.88, −0.18) Total−adjusted OC −0.50 (−0.72, −0.28) 14.04 0.03 (−0.02, 0.07) − − β−CTX −0.01 (−0.02, −0.007) 13.94 −0.0003 (−0.002, 0.001) − − P1NP −31.69 (−2.711, −0.660) 13. 87 0.142 (−0.060, 0.345) − − G allele−adjusted OC −0.74 (−1.30, −0.18) 12.30 −0.005 (−0.08, 0.07) − − β−CTX −0.02 (−0.04, −0.0005) 12.23 0.0003 (−0.002, 0.003) − − P1NP −3.07 (−5.41, −20.74) 11.85 −0.03 (−0.28, 0.21) − − T allele−adjusted OC −0.87 (−1.13, −0.51) 12.75 0.007 (−0.04, 0.05) − − β−CTX −0.02 (−0.03, −0.011) 13.05 0.001 (−0.003, 0.0002) − − P1NP −2.80 (−4.29, −1.32) 12.81 −0.02 (−0.21, 0.18) − − Note. Serum 25(OH)D and BTMs were adjusted for district, latitude, regional type, season, nationality, education, smoking, drinking, exercise, bone and joint disease status, age, BMI, corrected Ca, P, PTH, CRE, ALT, and hsCRP. 25(OH)D, 25−hydroxyvitamin D; BTMs, bone turnover markers; OC, osteocalcin; β−CTX, β−CrossLaps of type 1 collagen containing cross−linked C−telopeptide; P1NP, procollagen type 1 N−terminal propeptide; BMI, body mass index; Ca, calcium; P, phosphorus; PTH, parathyroid hormone; CRE, creatinine; ALT, alanine aminotransferase; hsCRP, high sensitivity C−reactive protein. Table 4. Associations between serum 25(OH)D concentration and BTMs below and above the unadjusted and adjusted cutoffs of 25(OH)D
-
To further validate the clinical significance of the above thresholds, we also analyzed the associations between BTMs, PTH and calcium phosphorus ratio at different vitamin D levels (based on 13.87 ng/mL) by generalized linear model. Table 5 showed that when 25(OH)D ≥ 13.87 ng/mL, P1NP was negatively associated with calcium phosphorus ratio (P = 0.045).
BTMs for different 25(OH)D status Calcium phosphorus ratio β (95% CI) P OC 25(OH)D < 13.87 ng/mL −0.284 (−0.916, 0.348) 0.378 25(OH)D ≥ 13.87 ng/mL −0.010 (−0.022, 0.002) 0.090 β−CTX 25(OH)D < 13.87 ng/mL −0.016 (−0.034, 0.002) 0.075 25(OH)D ≥ 13.87 ng/mL −0.302 (−0.674, 0.070) 0.111 P1NP 25(OH)D < 13.87 ng/mL −1.660 (−3.896, 0.575) 0.146 25(OH)D ≥ 13.87 ng/mL −1.496 (−2.960, −0.032) 0.045 PTH 25(OH)D < 13.87 ng/mL 1.148 (−0.462, 2.758) 0.162 25(OH)D ≥ 13.87 ng/mL 0.448 (−0.364, 1.259) 0.280 Note. BTMs were adjusted for district, latitude, regional type, season, nationality, education, smoking, drinking, exercise, bone and joint disease status, age, BMI, 25(OH)D, PTH, CRE, ALT, and hsCRP. PTH was adjusted for district, latitude, regional type, season, nationality, education, smoking, drinking, exercise, bone and joint disease status, age, BMI, 25(OH)D, OC, β-CTX, P1NP, CRE, ALT, and hsCRP. 25(OH)D, 25-hydroxyvitamin D; BTMs, bone turnover markers; OC, osteocalcin; β-CTX, β-CrossLaps of type 1 collagen containing cross-linked C-telopeptide; P1NP, procollagen type 1 N-terminal propeptide; BMI, body mass index; PTH, parathyroid hormone; CRE, creatinine; ALT, alanine aminotransferase; hsCRP, high sensitivity C-reactive protein. Table 5. Associations between serum calcium phosphorus ratio and BTMs below and above the 25(OH)D cutoff by generalized linear model
-
Accumulating evidence has defined vitamin D deficiency or insufficiency based on changes in indicators associated with bone metabolism and increased risk of numerous diseases, but the optimal 25(OH)D concentration remains a considerably debated topic. Our previous research has applied PTH to investigate the sufficient threshold of serum 25(OH)D for women of childbearing age[31]. Because PTH may fluctuate with dietary Ca intake[32,33], renal function[34], or physical activity[35], the thresholds of 25(OH)D obtained from the existing researches varied widely (from 10 to 50 ng/mL)[20] and some studies even did not find such thresholds[18,36,37]. Given that BTMs respond rapidly to changes in skeletal physiology[17], when vitamin D is insufficient, it is possible for BTMs to react quickly to serum 25(OH)D changes. Therefore, in this study, we also analyzed the nonlinear relationship between 25(OH)D and BTMs, and the Threshold of Serum 25(OH)D in Terms of BTMs.
In our study, the prevalence of bone and joint diseases/conditions (including arthritis, fracture, and other diseases associated with the bone or joint) was low (5.5%) and the prevalence of osteomalacia was not known. Therefore, we did not apply such outcome indicators to investigate the appropriate threshold of vitamin D. To our knowledge, this is the first study to analyze the threshold-effect associations of serum 25(OH)D on BTMs (including OC, β-CTX, and P1NP) in Chinese women of childbearing age. After adjustment, significant cutoffs of serum 25(OH)D concentrations for BTMs were observed, ranging from 13.87 to 14.04 ng/mL. Below these cutoffs, lower 25(OH)D concentrations were associated with increased BTMs, while above them, BTMs plateaued. Moreover, when 25(OH)D ≥ 13.87 ng/mL, P1NP was negatively associated with calcium phosphorus ratio. These results suggested that serum 25(OH)D concentrations < 13.35 ng/mL were insufficient to maintain bone remodeling. The results of this cross-sectional study confirmed those of other studies. For example, a study of Chinese men (20–89 years) reported that LOESS plots between serum 25(OH)D and BTMs (including β-CTX, OC, and P1NP) showed plateau concentrations of BTMs and these plateaus began when 25(OH)D approached 30 ng/mL[22]. Similarly, the BTMs also showed plateauing results in healthy Malaysian adults (18–50 years) at a 25(OH)D concentration of 35 nmol/L (14 ng/mL) for CTX and 20 nmol/L (8 ng/mL) for P1NP[21]. In addition, a 25(OH)D threshold of approximately 40 nmol/L (16 ng/mL) for OC in the old population in the Netherlands was also found[18]. From these results, it can be assumed that appropriate 25(OH)D concentrations are capable of maintaining bone remodeling. Naturally, there are some differences in the cutoff values in these studies, and even some studies of women (including postmenopausal women) have not found similar results[19,22]. We proposed that this might be associated with race, age, sex, and BTMs differences.
To date, the statistical methods to estimate the 25(OH)D cutoff value were mainly based on the LOESS. Therefore, we investigated the potential thresholds of serum 25(OH)D in terms of BTMs first by this typical method at the beginning. Because the serum 25(OH)D concentration was significantly different between the district, regional type, latitude, season, and age groups in this study. BMI was proved to have an independent influence on 25(OH)D concentrations in our previous study for the same population[38]. Additionally, studies reported that age[39], season[40], blood Ca[41], and the inflammatory processes[42] were involved in bone remodeling and supplementation with vitamin D appeared to suppress bone turnover possibly mediated by PTH reduction[43]. Subsequently, we performed the LOESS for the visual assessment of the associations of serum 25(OH)D with BTMs after adjusting for district, regional type, latitude, season, age, BMI, hsCRP, PTH, and Alb-corrected Ca, among others for both 25(OH)D and BTM. A potential cutoff for each BTM was observed after adjustment. Because the LOESS method could not accurately obtain the cutoff, we applied another method, the SR approach combined with NLS, which could not only provide an excellent approximation of the LOESS curve, but also estimate the exact thresholds and assess the degree of the change in slope before and after the thresholds simultaneously[29,44]. Therefore, in our study, the three two methods of LOESS, NLS, and SR were applied in combination with or without adjustment.
Consequently, the SR model results showed that BTMs decreased significantly and then entered plateau with the increase of 25(OH)D. The cutoff of the adjusted serum 25(OH)D in relation to the adjusted OC, β-CTX, and P1NP by NLS was 14.04, 13.94, and 13. 87 ng/mL, respectively. This indicated that all the three BTMs plateaued when serum 25(OH)D concentration was > 14.04 ng/mL. This threshold was lower than the sufficient range (14.22–18.06 ng/mL) of 25(OH)D to maintain PTH at a plateau, which was obtained from our previous study[31]. Additionally, the cut-point was similar to two other studies for middle-aged women (36–57 years) in Australia and healthy adults (18–50 years) in Malaysia, which showed that serum 25(OH)D concentrations of 13.2[44] and 14[21] ng/mL, respectively, were required for optimal musculoskeletal health. Though the cutoff was much lower than the threshold for vitamin D sufficiency (20 ng/mL), as recommended by the Institute of Medicine[45], we believed that this result was quite reasonable. Because the median 25(OH)D concentration (16.63 ng/mL) of the study population, which was close to the result of a meta-analysis on adult 25(OH)D status (mean: 17.72 ng/mL) in mainland China[46], was much lower than that in South America and the Middle East (≥ 24 ng/mL)[47]. However, because studies on the 25(OH)D threshold are limited in Chinese women of childbearing women, whether these values are the thresholds for determining vitamin D deficiency or sufficiency needs to be further studied by combining other outcomes. Vitamin D binding protein, encoded by the GC gene, is the main carrier of vitamin D. Furthermore, GC gene polymorphism is closely associated with vitamin D status[48,49]. In our previous study for the same population, serum 25(OH)D concentration was reported to be strongly associated with GC rs2282679 genotypes. As a preliminary study, we also found that the cutoff values of G allele carriers, where BTMs began to level off, were slightly lower than that of T allele carriers. The result indicated that individuals carrying the G allele were able to maintain normal bone remodeling at a lower serum 25(OH)D level for this study population with a low prevalence of bone diseases.
The strengths of our study are that, we measured serum 25(OH)D based on the gold standard reference measurement procedures and certified reference materials from the National Institute for Standards and Technology, and we analyzed the nonlinear relationships between serum BTMs and 25(OH)D by adjusting the possible confounders in women of childbearing age based on a national representative database. Furthermore, we used a combination of LOESS and SR to estimate the cutoffs for the whole population and different allele carriers. The limitations are as follows: 1) Due to the lack of both general vitamin D data in our food composition table and complete sunlight exposure information, the effects of vitamin D intake and sunlight exposure on serum 25(OH)D and bone markers could not be accessed in this study; 2) We only analyzed the cutoffs for one gene locus, and further genetic factors should be considered; 3) Because this study is cross-sectional, it is insufficient to be able to draw a conclusion about the threshold of serum 25(OH)D.
-
For Chinese women of childbearing age in this study, low serum 25(OH)D concentrations were associated with increased BTMs. Through the nonlinear regression, the cutoffs of serum 25(OH)D were observed when the BTMs entered the plateau stage, which implicated that serum 25(OH)D concentrations < 13.35 ng/mL in women of childbearing age had adverse influences on maintaining bone remodeling. Additionally, women with the GC rs2282679 G allele had a lower cutoff than those with the T allele. These results provided useful references for investigating the thresholds of vitamin D deficiency or sufficiency in women of childbearing age as well as pregnant women. However, further studies including cohort studies and randomized controlled trials with more endpoints are still needed to verify the threshold-effect associations of 25(OH)D on BTMs.
HTML
Study Population and Sampling
Measurements
Covariates
Statistical Analyses
General Characteristics of the Study Population
Serum 25(OH)D and BTMs Status
BTMs Concentrations at Different 25(OH)D Concentrations
Non-linear Associations between Serum 25(OH)D and BTMs in Women of Childbearing Age
Cutoffs for Associations between Serum 25(OH)D and BTMs in Women of Childbearing Age
Cutoffs for Associations between Serum 25(OH)D and BTMs in Women of Childbearing Age with Different Allele Carriers
Associations between Serum 25(OH)D and BTMs with 25(OH)D below and above the cutoffs in Women of Childbearing Age
Associations between BTMs and Calcium Phosphorus Ratio in Different 25(OH)D Status
Competing Interests The authors declare that they have no conflict of interest.
Ethics The study was approved by the Ethical Review Committee of the Center for Disease Control and Prevention (No.201519−B). Ethichs Written informed consent was obtained from each participant and all procedures performed in the studies involving human participants were in accordance with the committee’s ethical standards.
&These authors contributed equally to this work.

 Quick Links
 DownLoad: