


-
Homocysteine (Hcy) is a non-protein amino acid produced by the demethylation of methionine[1]. Elevated plasma Hcy levels or hyperhomocysteinemia, can result from either mutation genes coding for enzymes of Hcy metabolism[2], or deficiencies of B vitamins[3]. Hyperhomocysteinemia might lead to thrombosis, endothelial injury[4] and even cardiovascular disease[5]. Hyperhomocysteinemia in pregnant and postpartum women might be detrimental to maternal and offspring health, possibly related to compromised maternal vascular function. In pregnant women, hyperhomocysteinemia has been reported to be associated with increased risks of preeclampsia[6], placental abruption[7], neural tube defects[8], and low birth weight[9]; and in postpartum women, it was associated with postpartum depression[10]. Given these adverse effects, it is essential to comprehensively investigate the Hcy levels in women during pregnancy and postpartum.
Previous studies have shown a considerable fluctuation of Hcy levels from pre-pregnancy to mid-pregnancy women[11-14]. However, only three studies, conducted in as early as 1990s, have reported maternal Hcy levels for late-pregnant and postpartum women[15-17]. Given the increasing popularity of B-vitamin supplementation during pregnancy in the past decades, updated data on Hcy levels in pregnant and postpartum women are needed. Additionally, the aforementioned studies were conducted in non-Asian populations (Danish, Brazilian and Seychellois), whereas related data from Asian population are lacking. Compared with western populations, Asian population generally possess relatively lower levels of B vitamins such as folate and B12[18] and distinct gene polymorphisms of the Hcy metabolism[19], suggesting that data from western countries might not be applicable to Asian populations. Therefore, it is necessary to explore the current Hcy status in pregnant and postpartum Asian women.
Using data from a cross-sectional study among women residing in southern, central and northern regions of China, we aimed to assess the Hcy levels in mid-pregnancy, late-pregnancy and postpartum women, and to explore the potential determinants such as geographic region and maternal age.
-
This cross-sectional study was carried out between May and July 2014 with the primary aim of evaluating docosahexaenoic acid (DHA) status among pregnant and lactating women in China. As detailed in elsewhere[20,21], women at mid-pregnancy, late pregnancy, and postpartum were equally recruited in three cities of China: Yueyang, Weihai, and Baotou. Yueyang, a city located in latitude of 29°37′ N, represents southern region of China; Weihai, a city located in a latitude of 37°25′N, represents central region; Baotou, a city located in latitude of 40°15′ N, represents northern region.
The participants were recruited at local maternal and child health centers during their routine prenatal or postpartum clinic visits. Women at mid-pregnancy were enrolled during 15–19 gestational weeks, women at late-pregnancy were enrolled during 37–41 gestational weeks, and women at postpartum were enrolled at 42 ± 7 days postpartum. Healthy women aged 18 to 35 years who had a singleton pregnancy or delivered a single healthy neonate were included in this study. For postpartum women, only those exclusive or partial breastfeeding their infants were included. Among 1,254 women initially enrolled, 23 were excluded for age > 35 years, 20 for not being in the predetermined gestational weeks or postpartum days, and 21 for having no sufficient blood samples. Finally, 1,190 women were remained in the present study.
-
Information on maternal socio-demographic characteristics including maternal age, ethnicity, education status, annual family income per capita, height and weight before pregnancy, parity, and gestational age at enrollment or delivery was collected by trained obstetricians or nurses using a structured questionnaire. Pre-pregnancy weight in kilograms and the height in meters was used to calculate the pre-pregnancy body mass index (BMI), which was categorized as follows: < 18.5 kg/m2 (underweight), 18.5 to < 25 kg/m2 (normal weight), and ≥ 25 kg/m2 (overweight/obesity). Information about delivery mode and feeding practice was additionally collected for postpartum women.
About 5 mL of fasting venous blood was collected from each woman into ethylenediaminetetraacetic acid (EDTA)-containing tubes. The blood samples were then kept at 4 °C until they were processed for plasma aliquots within 4 hours. The plasma aliquots were stored at −20 °C at local hospitals for about 10 days, and then transported on dry ice to the National Health Commission Key Laboratory of Reproductive Health at Peking University Health Science Center in China, and stored at −80 °C until analysis.
-
Plasma Hcy concentration was analyzed by high-performance liquid chromatography (HPLC, Waters Alliance 2690) with a fluorescence detector (Waters Alliance 2475)[22], a preferential method for analyzing Hcy[23]. In brief, 10 μL of an internal standard, N-Acety-L-Cysteine (NAC) was added to 90 μL plasma. Then, 10 μL of 10% trichloroethyl phosphate (TCEP), was added to each sample, followed by incubation at 4 °C for 30 minutes. Subsequently, 100 µL of 10% trichloroacetic acid (TCAA) containing 1 mmol/L ethylene diamine tetraacetic acid (EDTA) was added and the mixture was centrifuged for 6 min at 15,000 ×g. 100 μL clear supernatant was extracted and transferred to a new tube. Then, after adding 20 μL of 1.55 mol/L NaOH, 250 μL of 0.125 mol/L borate buffer (pH = 9.5) containing 4 mmol/L EDTA and 10 μL of the fluorescent marker, 7-Fluorobenzofurazan-4-sulfonic acid ammonium salt (SBD-F) (10 mg/mL solution in 0.125 mol/L borate buffer), the sample was incubated at 60 °C for 60 minutes and then cooled on ice for subsequent HPLC analysis. The column temperature for HPLC analysis was set at 25 °C. Two buffers were used as the mobile phase: 0.1 mol/L potassium dihydrogen phosphate buffer, pH 2.1 (buffer A); a mixture of buffer A and acetonitrile at the ratio of 1:1 (buffer B). The flow rate was 1.0 mL/min, and the gradient elution procedure was as follows: a 12% buffer B phase lasting for 6 minutes, followed by a 9-minute linear gradient to reach 30% buffer B, subsequently a 1-minute linear gradient to return to 12% buffer B, and a final 4-minute phase at 12% buffer B. The fluorescence detection was performed with excitation and emission wavelengths of 385 nm and 515 nm, respectively.
To ensure the accuracy of the analysis, a quality control (QC) with a mean concentration of 15.58 (standard deviation, SD, 0.62) μmol/L was used for each 20 samples. The 20 samples would be retested if the corresponding QC result was over the mean ± 2SD limit (i.e., < 14.25 or > 16.81 μmol/L). The intra- and inter-assay coefficient of variations (CV) were < 10%. All the analyses were performed by trained staff who were qualified to perform the assay in a biosafety level II laboratory under yellow light. Hyperhomocysteinemia was defined as the concentration of > 10 μmol/L, according to an international recommendation for pregnant women[24].
-
Medians and interquartile ranges (IQRs) were calculated for Hcy concentration due to its skewed distribution (P value by Kolmogorov-Smirnov D test < 0.001). The adjusted medians and IQRs of Hcy concentration were estimated for each participants using multivariable quantile regression models. Then, the adjusted medians among phases of pregnancy and postpartum or other characteristics were compared using the Mann-Whitney U test, or Kruskal-Wallis test following by Dwass-Steel-Crichtlow-Fligner tests, as appropriate.
The potential determinants of plasma hyperhomocysteinemia status were further explored using univariable and multivariable logistic regression models. The factors included in the models were phases of pregnancy and postpartum (mid-pregnancy, late pregnancy, and postpartum), geographic region (south, central and north), maternal age (≤ 25, 26 to 30, and 31 to 35 years), parity (nulliparous, and multiparous), ethnicity (Han, and others), education status (middle school or less, high school, and college or higher), annual family income per capita (≤ 30,000, 30,000 to 49,999, 50,000 to 99,999, and ≥ 100,000 Yuan), pre-pregnancy BMI (underweight, normal weight, and overweight/obese). For the postpartum group, models additionally included delivery mode (vaginal delivery, and caesarean delivery) and feeding practice (exclusive breastfeeding, and partial breastfeeding). To ensure the robustness of the result, a sensitivity analysis was performed using the hyperhomocysteinemia defined as ≥ 15.0 μmol/L, a commonly-used threshold in general population.
All statistical analyses were performed using SAS 9.4 software (SAS Institute, Cary, NC, USA). P values were two-sided, and statistical significance was set at < 0.05.
-
Among the 1,190 participants included in this study, the mean maternal age was 27.3 ± 3.0 years and the mean pre-pregnancy BMI was 20.9 ± 2.9 kg/m2. There were 33.7% (n = 401) of women in mid-pregnancy, 32.6% (n = 388) in late-pregnancy, and 33.7% (n = 401) in postpartum. The proportions of women residing in southern, central and northern regions of China were 32.9% (n = 392), 33.0% (n = 393) and 34.0% (n = 405), respectively. Of the 401 postpartum women, 40.4% (n = 162) underwent a vaginal delivery and 59.6% (n = 239) were exclusive breastfeeding. Detailed characteristics of the participants are shown in Table 1.
Characteristics Phases of pregnancy and postpartum P value Total
(n = 1,190)Mid-pregnancy
(n = 401)Late-pregnancy
(n = 388)Postpartum
(n = 401)Geographic region 0.943 South 392 (32.9) 130 (32.4) 133 (34.3) 129 (32.2) Central 393 (33.0) 135 (33.7) 122 (31.4) 136 (33.9) North 405 (34.0) 136 (33.9) 133 (34.3) 136 (33.9) Age group (years) 0.243 ≤ 25 328 (27.6) 122 (30.4) 106 (27.3) 100 (24.9) 26–30 675 (56.7) 223 (55.6) 212 (54.6) 240 (59.9) > 30 187 (15.7) 56 (14.0) 70 (18.0) 61 (15.2) Pre-pregnancy BMI 0.325 Underweight 223 (18.7) 73 (18.2) 73 (18.8) 77 (19.2) Normal weight 864 (72.6) 288 (71.8) 291 (75.0) 285 (71.1) Overweight/obese 103 (8.7) 40 (10.0) 24 (6.2) 39 (9.7) Parity 0.360 Primiparous 992 (83.4) 337 (84.0) 315 (81.2) 340 (84.8) Multiparous 198 (16.6) 64 (16.0) 73 (18.8) 61 (15.2) Ethnicity 0.047 Han 1,134 (95.3) 374 (93.3) 376 (96.9) 384 (95.8) Others 56 (4.7) 27 (6.7) 12 (3.1) 17 (4.2) Education 0.703 Middle school or less 148 (12.4) 54 (13.5) 52 (13.4) 42 (10.5) High school 261 (21.9) 88 (21.9) 83 (21.4) 90 (22.4) College or higher 781 (65.6) 259 (64.6) 253 (65.2) 269 (67.1) Annual family income per capita (Yuan) < 0.001 ≤ 30,000 609 (51.2) 184 (45.9) 164 (42.3) 261 (65.1) 30,000 to < 50,000 324 (27.2) 122 (30.4) 103 (26.5) 99 (24.7) 50,000 to < 100,000 225 (18.9) 85 (21.2) 104 (26.8) 36 (9.0) ≥ 100,000 32 (2.7) 10 (2.5) 17 (4.4) 5 (1.2) Postpartum women (n = 401) Delivery mode – Vaginal delivery – – – 239 (59.6) Cesarean delivery – – – 162 (40.4) Breastfeed – Partial breastfeeding – – – 162 (40.4) Exclusive breastfeeding – – – 239 (59.6) Note. BMI, body mass index. “–” denotes that the data were unavailable here. Table 1. Characteristics of pregnant and postpartum women in China [n (%)]
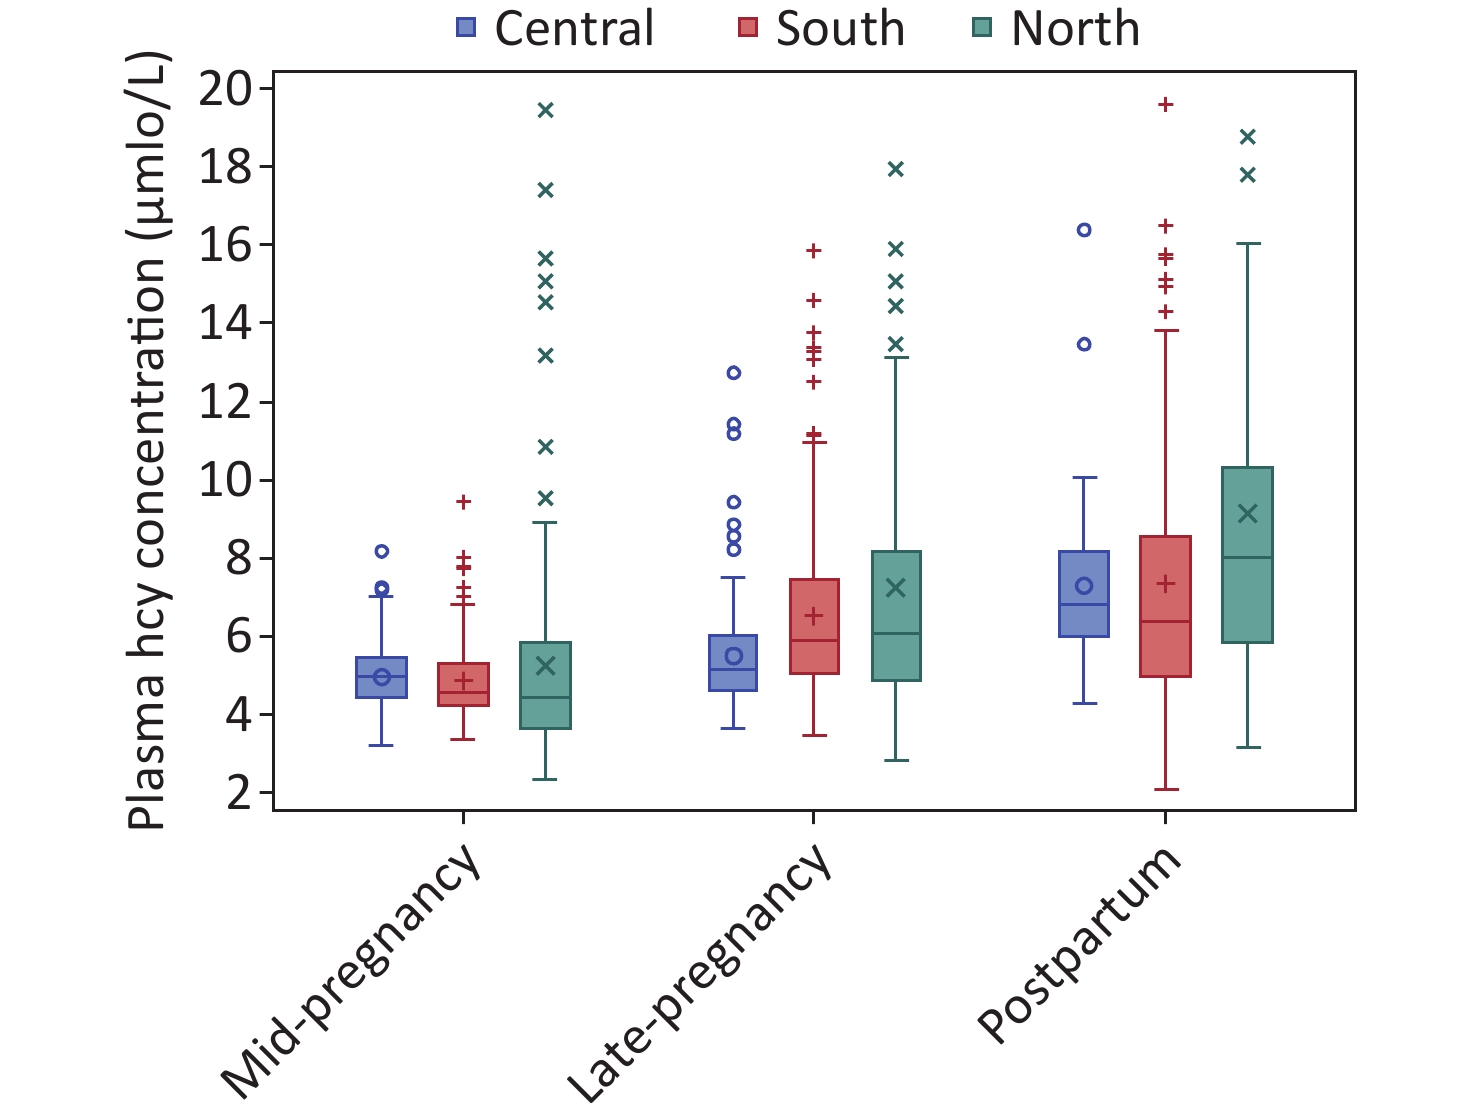
The median (IQR) of plasma Hcy concentration was 5.66 (4.62–7.37) μmol/L for overall participants. When stratified by periods of pregnancy and postpartum, the adjusted Hcy concentration was lowest in women at mid-pregnancy (4.75, 4.13–5.54 μmol/L), and increased in women at late-pregnancy (5.72, 4.81–6.85 μmol/L) and postpartum (7.09, 5.65–8.75 μmol/L) (P value for trend of < 0.001) (Table 2). When stratified by regions of residence, the adjusted Hcy concentration was significantly higher in women in northern region (6.08, 4.70–7.82 μmol/L) than those in central (5.56, 5.00–6.60 μmol/L) or southern regions (5.61, 4.80–6.81 μmol/L) (P < 0.001). The trends by phases of pregnancy and postpartum were consistent in each region of residence (Figure 1). Additionally, higher plasma Hcy levels were observed in women who were younger in age, underweight, had Han ethnicity and lower annual family income. Among postpartum women, Hcy concentrations were also higher in those who had a vaginal delivery and those who breastfed partially.
Characteristics n (%) Overall women
(n = 1,190)Pregnant women Postpartum women (n = 789) (n = 401) Crude
concentrationaAdjusted
concentrationbAdjusted
concentrationAdjusted
concentrationPhases of pregnancy and postpartum Mid-pregnancy 401 (33.7) 4.68 (4.14, 5.51)1 4.75 (4.13, 5.54)1 4.74 (4.16, 5.56)1 – Late-pregnancy 388 (32.6) 5.75 (4.79, 7.12)2 5.72 (4.81, 6.85)2 5.76 (4.91, 6.96)2 – Postpartum 401 (33.7) 7.16 (5.69, 9.07)3 7.09 (5.65, 8.75)3 –c – Geographic region South 392 (32.9) 5.47 (4.54, 7.10)1 5.61 (4.80, 6.81)1 4.96 (4.57, 5.89)1 6.48 (5.17, 8.90)1 Central 393 (33.0) 5.52 (4.75, 6.64)1 5.56 (5.00, 6.60)1 4.88 (4.39, 5.49)1 7.13 (5.77, 8.19)2 North 405 (34.0) 5.98 (4.47, 8.58)2 6.08 (4.70, 7.82)2 5.11 (4.26, 6.79)2 8.07 (6.26, 10.42)3 Age group (years) ≤ 25 328 (27.6) 5.79 (4.68, 7.76) 5.80 (5.07, 6.92)2 5.09 (4.52, 6.66)3 7.28 (6.37, 9.45)2 26–30 675 (56.7) 5.61 (4.63, 7.23) 5.63 (4.80, 6.80)1 4.88 (4.33, 6.49)2 7.13 (5.66, 8.88)1 > 30 187 (15.7) 5.46 (4.45, 7.48) 5.83 (4.63, 7.67)1 5.45 (4.45, 6.25)1 7.41 (5.70, 10.13) Pre-pregnancy BMI Underweight 223 (18.7) 5.89 (4.67, 7.53) 5.82 (4.95, 6.91)2 5.13 (4.57, 6.60)3 7.22 (5.91, 9.67)1 Normal weight 864 (72.6) 5.60 (4.62, 7.23) 5.67 (4.80, 6.80)1 4.97 (4.46, 6.49)2 7.13 (5.66, 8.90)1 Overweight/obesity 103 (8.7) 5.66 (4.53, 8.10) 6.01 (4.77, 7.90) 4.64 (4.15, 6.22)1 8.20 (6.60, 9.89)2 Parity Primiparous 992 (83.4) 5.66 (4.65, 7.23) 5.68 (4.88, 6.78) 4.98 (4.44, 6.49) 7.13 (5.73, 8.88)1 Multiparous 198 (16.6) 5.70 (4.50, 7.87) 5.92 (4.72, 7.33) 5.53 (4.45, 6.55) 7.52 (5.83, 10.85)2 Ethnicity Han 1,134 (95.3) 5.67 (4.63, 7.41) 5.74 (4.81, 6.90)2 5.07 (4.45, 6.50)2 7.15 (5.72, 9.18) Other 56 (4.7) 5.39 (4.39, 6.97) 5.07 (4.77, 6.48)1 4.70 (4.11, 5.81)1 7.05 (6.43, 9.68) Education Middle school or less 148 (12.4) 5.55 (4.63, 7.06) 5.66 (4.90, 7.06)1 5.11 (4.53, 6.31) 7.34 (5.78, 11.13) High school 261 (21.9) 5.72 (4.66, 7.84) 5.82 (5.00, 6.96)2 4.98 (4.52, 6.68) 7.24 (5.83, 9.28) College or higher 781 (65.6) 5.66 (4.57, 7.25) 5.68 (4.78, 6.79)1 4.98 (4.36, 6.49) 7.13 (5.72, 8.90) Annual family income per capita (Yuan) ≤ 30,000 609 (51.2) 5.86 (4.67, 7.98)2 6.03 (4.99, 7.82)3 4.97 (4.39, 6.59)2 7.15 (5.70, 9.58)2 30,000 to < 50,000 324 (27.2) 5.63 (4.68, 7.02)1 5.63 (4.93, 6.63)2 4.97 (4.49, 6.40)2 7.26 (6.13, 8.83)2 50,000 to < 100,000 225 (18.9) 5.33 (4.48, 6.43)1 5.45 (4.60, 6.60)1 5.56 (4.67, 6.44)3 6.07 (5.34, 8.74)1 ≥ 100,000 32 (2.7) 4.91 (4.39, 6.06)1 5.15 (4.53, 5.48)1 4.87 (4.34, 5.67)1 7.88 (7.28, 9.16)2 Delivery mode Vaginal delivery – – – – 7.15 (5.83, 8.90)2 Caesarean delivery – – – – 6.81 (5.70, 9.59)1 Feeding practice Partial breastfeeding – – – – 7.24 (5.72, 9.41)2 Exclusive breastfeeding – – – – 6.76 (5.82, 8.96)1 Note. BMI, body mass index; IQR, interquartile range. aThe crude or adjusted median Hcy concentrations were compared through Mann-Whitney U test or Kruskal-Wallis test followed by Dwass-Steel-Crichtlow-Fligner test for multiple comparisons. The different numerical superscripts indicate significant differences in medians (1 < 2 < 3), P < 0.05. bThe adjusted medians (IQRs) were estimated by multivariate quantile regression model, which adjusted for phases of pregnancy and postpartum, geographic region, maternal age, pre-pregnancy BMI, parity, educational level, ethnicity, educational level and average annual family income; delivery mode and feeding practice were further included in models for postpartum women. c“–” denotes that the data were unavailable here. Table 2. The crude and adjusted plasma Hcy median (IQRs) concentrations (μmol/L) in pregnant and postpartum women in China
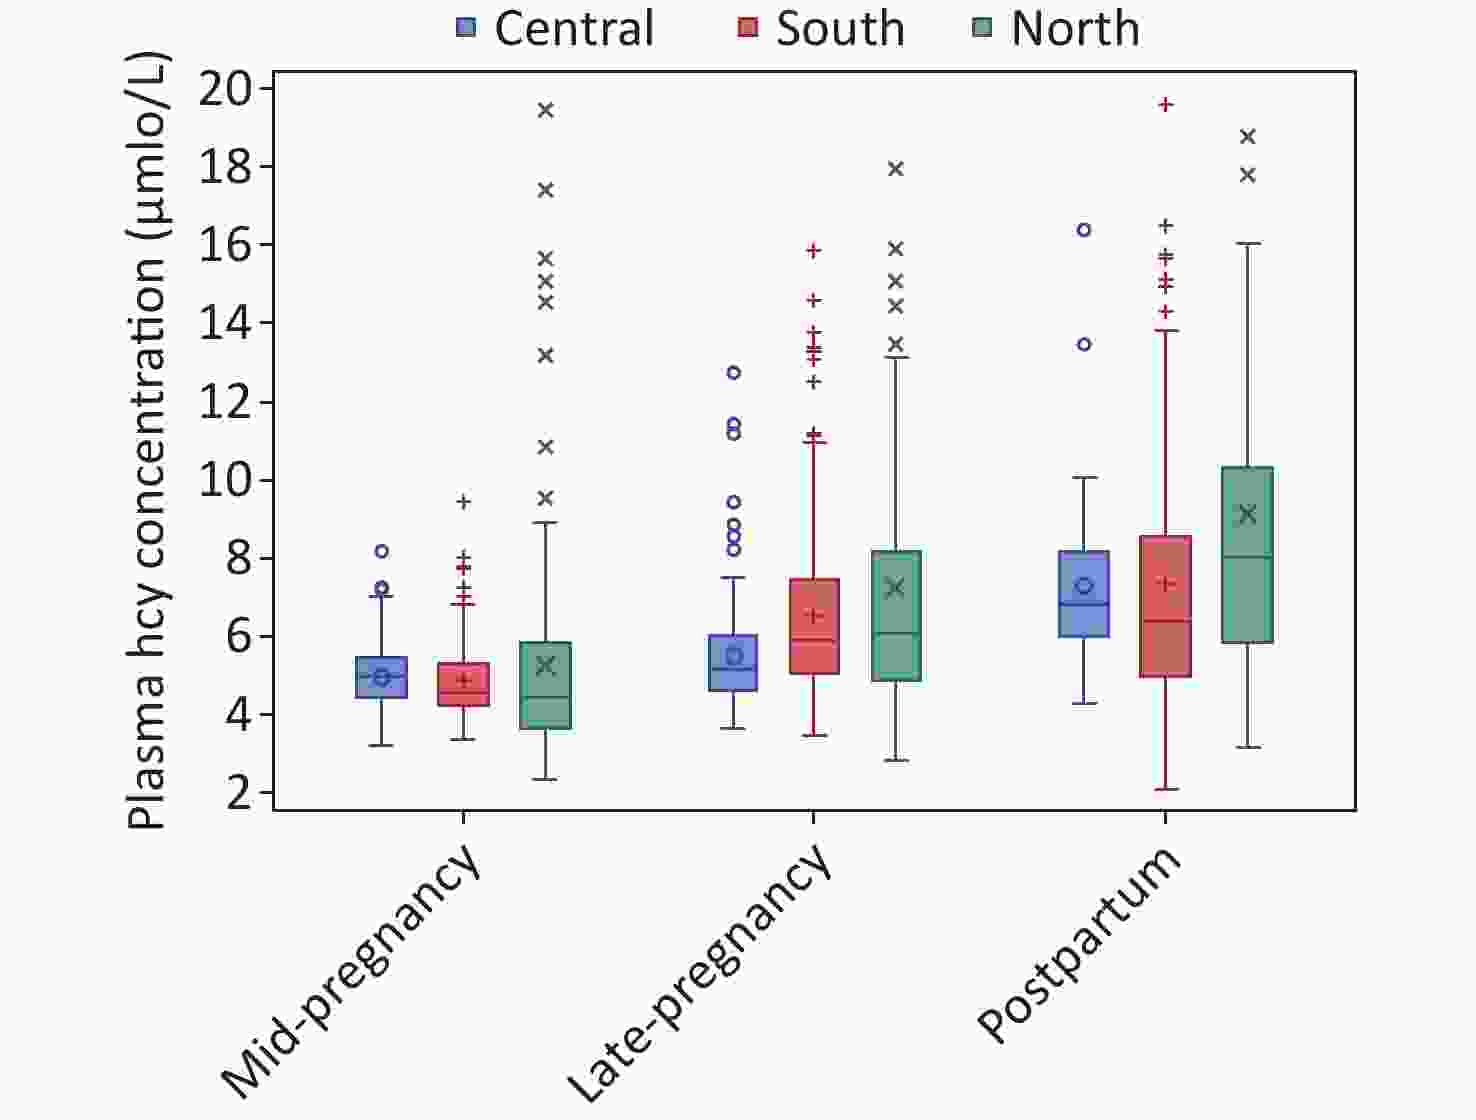
Figure 1. Plasma Hcy concentrations in mid-pregnant, late pregnant, and postpartum women, by geographic regions in China. Data are presented as box plots; on each box, medians (central mark), interquartile range (bottom and top edges of the box), and minimum/maximum values (whiskers) are shown, n = 1,190.
Of the 1,190 participants, 106 (8.9%) were categorized as hyperhomocysteinemia. Compared with women at mid-pregnancy, those at late pregnancy (adjusted OR = 5.09, 95% CI 2.18–11.86) and postpartum (adjusted OR = 12.11, 95% CI 5.39–27.21) had a higher risk of hyperhomocysteinemia. Women residing in the northern region had higher risk of hyperhomocysteinemia (adjusted OR = 2.30, 95% CI 1.42–3.72), while women residing in central region had a lower risk (adjusted OR = 0.18, 95% CI 0.08–0.44), as compared with those in southern region. No statistically significant differences were observed in the risks of other maternal characteristics based on the multivariate logistic model. The associations persisted in subgroups stratified by pregnant and postpartum women (Table 3). The sensitivity analysis by employing 15.0 μmol/L as the threshold of hyperhomocysteinemia yielded concordant results (Supplemental Table S1).
Characteristics Case of
hyperhomocysteinemiaOverall women Pregnant women Postpartum women n (%) Crude OR
(95% CI)Adjusted OR
(95% CI)aAdjusted OR
(95% CI)aAdjusted OR
(95% CI)aPhases of pregnancy and postpartum Mid-pregnancy 7 (1.7) Ref Ref –b – Late-pregnancy 33 (8.5) 5.23 (2.29–11.97) 5.09 (2.18–11.86) – – Postpartum 66 (16.5) 11.09 (5.02–24.49) 12.11 (5.39–27.21) – – Geographic region South 34 (8.7) Ref Ref Ref Ref Central 7 (1.8) 0.19 (0.08–0.44) 0.18 (0.08–0.44) 0.31 (0.08–1.19) 0.12 (0.04–0.38) North 65 (16.0) 2.01 (1.30–3.13) 2.30 (1.42–3.72) 2.69 (1.24–5.83) 2.55 (1.33–4.90) Age group (years) ≤ 25 30 (9.1) 1.18 (0.74–1.89) 0.98 (0.57–1.69) 0.95 (0.42–2.15) 0.84 (0.40–1.77) 26–30 53 (7.9) Ref Ref Ref Ref > 30 23 (12.3) 1.65 (0.98–2.76) 1.15 (0.63–2.09) 1.20 (0.49–2.95) 1.30 (0.57–2.96) Pre-pregnancy BMI Underweight 18 (8.1) 0.88 (0.52–1.51) 0.75 (0.42–1.32) 0.77 (0.30–1.93) 0.75 (0.36–1.56) Normal weight 78 (9.0) Ref Ref Ref Ref Overweight/obesity 10 (9.7) 1.08 (0.54–2.17) 1.02 (0.47–2.21) 0.68 (0.19–2.36) 1.18 (0.42–3.30) Parity Primiparous 74 (7.5) Ref Ref Ref Ref Multiparous 32 (16.2) 2.39 (1.53–3.74) 1.68 (0.94–3.00) 1.50 (0.63–3.59) 1.93 (0.88–4.25) Ethnicity Han 101 (8.9) Ref Ref Ref Ref Other 5 (8.9) 1.00 (0.39–2.57) 0.89 (0.32–2.46) 0.96 (0.27–3.39) 0.59 (0.12–2.96) Education Middle school or less 21 (14.2) Ref Ref Ref Ref High school 26 (10.0) 0.67 (0.36–1.24) 0.77 (0.38–1.53) 0.95 (0.34–2.63) 0.57 (0.21–1.50) College or higher 59 (7.6) 0.49 (0.29–0.84) 0.54 (0.28–1.04) 0.64 (0.25–1.65) 0.39 (0.15–1.02) Annual family income per capita (Yuan) ≤ 30,000 72 (11.8) Ref Ref Ref Ref 30,000 to < 50,000 22 (6.8) 0.54 (0.33–0.89) 0.70 (0.41–1.19) 0.82 (0.37–1.79) 0.59 (0.28–1.24) 50,000 to < 100,000 11 (4.9) 0.38 (0.20–0.74) 0.53 (0.26–1.08) 0.49 (0.18–1.34) 0.68 (0.25–1.85) ≥ 100,000 1 (3.1) 0.24 (0.03–1.79) 0.35 (0.04–2.74) 0.66 (0.08–5.33) ×c Delivery mode Vaginal delivery – – – Ref Caesarean delivery – – – 0.70 (0.38–1.30) Feeding Practice Partial breastfeeding – – – Ref Exclusive breastfeeding – – – 1.32 (0.71–2.45) Note. 95% CI, 95% confidence interval; OR, odds ratio; Ref, reference; BMI, body mass index. aAdjusted ORs and 95% CIs were estimated by multivariable logistic regression models by including phases of pregnancy and postpartum, geographic region, maternal age, pre–pregnancy BMI, parity, ethnicity, education level and income; delivery mode and feeding practice were further included in models for postpartum women. b“–” denotes that the data were unavailable here. c“×” denotes that it was not applicable since no case of hyperhomocysteinemia in this subgroup of postpartum women. Table 3. Association of hyperhomocysteinemia with characteristics of pregnant and postpartum women in China
-
From this large cross-sectional study among Chinese women at pregnancy and postpartum, we observed that the plasma Hcy concentrations were increased from mid-pregnancy to late-pregnancy and postpartum. We also found a higher Hcy level in women residing in northern region, having younger age or lower economic status, and in postpartum women underwent vaginal delivery or partially breastfeeding. Consistently, hyperhomocysteinemia was more likely occurred in women at late pregnancy and postpartum as compared with those at mid-pregnancy, and in women residing in the northern region as compared with those in southern region.
Our study found that women at mid-pregnancy had a lower Hcy concentration (4.75 μmol/L) compared to women at late-pregnancy (5.72 μmol/L), independent of other maternal characteristics, indicating an upward trend of maternal Hcy concentration from mid-pregnancy to late-pregnancy. This pattern was consistently observed in pregnant women from western countries, such as Canada (4.3 μmol/L in mid-pregnancy and 5.6 μmol/L in late-pregnancy)[11], Spain (4.2 μmol/L and 4.4 μmol/L)[12], and Denmark (6.1 μmol/L and 6.6 μmol/L)[15], as well as in those from other Asian countries, such as Japan (5.0 μmol/L and 5.9 μmol/L)[25]. A previous study conducted in women in Changsha city of China also showed the similar result (8.3 μmol/L and 9.5 μmol/L)[26]. However, it’s worth noting that the Hcy concentration values in the Changsha study were notably higher than those in our study and other previous studies. This discrepancy may be attributed to the different Hcy assay methods used. The Changsha study employed the enzyme cycling method, which tends to yield higher values compared to the HPLC method[27].
To our knowledge, this is the first study to reveal a significant increase in Hcy concentration from late-pregnancy to postpartum among Chinese women. Our data showed that the Hcy concentration reached 7.09 μmol/L for women at 42 ± 7 days postpartum, significantly higher than that for women at late-pregnancy. Only three studies to date, respectively conducted in Denmark, Brazil and Seychelles, have reported changes in Hcy concentration from late-pregnancy to postpartum. Remarkably, two of them revealed a consistent pattern of findings with the current study: in the Denmark study, Hcy concentrations increased from a median of 7.7 μmol/L at 39 weeks of gestation to 10.8 μmol/L at 8 weeks postpartum[15]; and in the Brazil study, from 5.0 μmol/L at late-pregnancy to 7.0 μmol/L 28 to 50 days postpartum[16].
The upward trend of Hcy concentrations from mid-pregnancy to late-pregnancy and postpartum was possibly attributed to a decrease in maternal folate level, as shown in our previous study[28]. By using folate as an enzyme co-factor or 5-methyltetrahydrofolate as the methyl donor, the Hcy can be trans-sulfuration or remethylated to methionine[29]. When plasma folate was deficient, Hcy cannot be efficiently recycled and therefore accumulates in the blood. Thus, the low folate status could hinder Hcy metabolism, leading to the increasing of plasma Hcy concentration. Previous population-based studies also demonstrated the inverse association between plasma folate status and Hcy level[30-32]. Additionally, an alternative mechanism for the upward trend in Hcy concentration from mid-pregnancy to postpartum might be endocrine-based[12]. Pregnancy and postpartum involve complex changes in female hormones, many of which have been reported to affect Hcy concentrations[33,34].
Our study showed a geographic variation in Hcy status of pregnant and postpartum women, with the highest Hcy concentration and a higher risk of hyperhomocysteinemia in women residing in the northern than in the central and southern regions of China. The geographic variation has been observed in general population in China. A meta-analysis consisting 60,754 Chinese subjects consistently showed the highest prevalence of hyperhomocysteinemia in northern and the lowest in southern region[35]. The geographic variation could be partly due to the distinct differences in dietary patterns across regions. A national survey in China showed that the dietary folate intake for women of reproductive age was significantly lower in northern versus southern region[36]. A lower folate intake was relevant to a deficient plasma folate status and consequently, as mentioned above, lead to elevated Hcy levels. Gene polymorphism of methylenetetrahydrofolate reductase (MTHFR) 677C–>T could contribute to the geographic variation in Hcy status. Studies have reported that women of reproductive age in northern versus southern China had higher proportion of MTHFR 677 TT genotype[37,38], which has been proved to be associated with higher risk of hyperhomocysteinemia[39]. Our study also showed higher Hcy levels in women with younger age or lower economic status, consistent with previous studies[40].
This study has several strengths. To our best knowledge, this is the first one to comprehensively report patterns of plasma Hcy levels for pregnant and postpartum women in China. A wide range of potential determinants such as geographic region and maternal social-demographic characteristics were analyzed in this study. Hcy concentration was determined using HPLC method, an internationally standardized and accurate assay[41], making direct international comparison possible.
This study also has limitations. Firstly, the participants were general healthy women residing in urban city, restricting the extrapolation of our findings. Secondly, our study was a cross-sectional study in different women at mid-pregnancy, late-pregnancy, and postpartum, preventing us from directly investigating the temporal trends of Hcy levels in a cohort of women. The trends of Hcy concentrations across mid-pregnancy, late-pregnancy, and postpartum were investigated by comparison of adjusted medians, effectively eliminating the potential bias related to geographic region or maternal characteristics. Thirdly, the samples have been stored for nearly nine years before they were assayed, potentially leading to bias. However, the samples were kept at –80 °C until analysis, so the bias should be minimized[42]. Fourthly, the sample size might be limited, especially in subgroup analysis, which could affect the generalizability of our results. Finally, we failed to include data on folate and vitamin B12 status of the participants in our analysis, which may influence the association with maternal social-demographic characteristics.
-
In summary, this large cross-sectional study involving Chinese pregnant and postpartum women showed that maternal plasma Hcy levels increased markedly from mid-pregnancy to late-pregnancy and postpartum, suggesting an upward trend of Hcy levels from mid-pregnancy to postpartum. Maternal Hcy levels were also varied by geographic regions and maternal characteristics such as maternal age and economic status. Additionally, delivery mode and breastfeeding might be influencing factors for postpartum women. These findings highlighted the necessity to develop systematic monitoring programs for women through pregnancy to postpartum to lower levels of Hcy, even in the post folic acid fortification era. Prospective studies with longitudinal design are warranted to confirm our findings. Furthermore, future investigations should delve into the interrelationships among Hcy, folate, Vitamin B12, and genetic mutations in pregnant and postpartum women.
-
Characteristics Case of hyperhomocysteinemia
(Defined as > 15.0 μmol/L)Overall women n (%) Crude OR (95% CI) Adjusted OR (95% CI)a Phases of pregnancy and postpartum Mid–pregnancy 4 (1.0) Ref Ref Late–pregnancy 6 (1.5) 1.56 (0.44–5.57) 1.28 (0.35–4.74) Postpartum 25 (6.2) 6.60 (2.28–19.14) 6.46 (2.17–19.18) Geographic region South 8 (2.0) Ref Ref Central 2 (0.5) 0.25 (0.05–1.16) 0.22 (0.04–1.11) North 25 (6.2) 3.16 (1.41–7.09) 3.56 (1.52–8.38) Age group ≤ 25 11 (3.4) 1.64 (0.74–3.65) 1.42 (0.58–3.49) 26–30 14 (2.1) Ref Ref > 30 10 (5.3) 2.67 (1.17–6.11) 2.17 (0.86–5.48) Pre-pregnancy BMI Underweight 6 (2.7) 1.01 (0.41–2.51) 0.84 (0.32–2.20) Normal weight 23 (2.7) Ref Ref Overweight/obesity 6 (5.8) 2.26 (0.90–5.69) 1.95 (0.71–5.34) Parity Primiparous 24 (2.4) Ref Ref Multiparous 11 (5.6) 2.37 (1.14–4.93) 1.60 (0.62–4.12) Ethnicity Han 35 (3.1) Ref Ref Other 0 (0.0) –b –b Education Middle school or less 7 (4.7) Ref Ref High school 9 (3.4) 0.67 (0.36–1.24) 0.81 (0.26–2.49) College or higher 19 (2.4) 0.50 (0.21–1.22) 0.61 (0.21–1.79) Annual family income per capita (Yuan) ≤ 30,000 24 (3.9) Ref Ref 30,000 to < 50,000 9 (2.8) 0.70 (0.32–1.52) 0.88 (0.38–2.03) 50,000 to < 100,000 2 (0.9) 0.22 (0.05–0.93) 0.37 (0.08–1.64) ≥ 100,000 0 (0.0) ×c ×c Note. 95% CI, 95% confidence interval; BMI, body mass index; OR, odds ratio; Ref, reference. aAdjusted ORs and 95% CIs were estimated by multivariable logistic regression models by including phases of pregnancy and postpartum, geographic region, maternal age, pre-pregnancy BMI, parity, ethnicity, education level and income; delivery mode and feeding practice were further included in models for postpartum women. b“–” denotes that the data were unavailable here. c“×” denotes that it was not applicable since no case of hyperhomocysteinemia in the specific groups. Table S1. Association of hyperhomocysteinemia (defined as > 15.0 μmol/L) with characteristics of pregnant and postpartum women in China
HTML
Study Population
Data and Sample Collection
Homocysteine Analysis
Statistical Analysis
Ethics The research protocol was reviewed and approved by the Institutional Review Board /Human Subjects Committee (IRB00001052-14012; date of approval: 22 April 2014). Informed consent was obtained from all participants before their enrollment.
Authors’ Contributions Study design and supervision: Jianmeng Liu, Yubo Zhou and Hongtian Li. Study design, data analysis, and manuscript drafting: Zhenyu Guo. Sample testing: Zhenyu Guo, Yirui Ma and Ying Meng. Jianmeng Liu and Yubo Zhou took responsibility for the integrity of the data and had full access to all of the data in the study. All authors have read and approved the final manuscript.
Consent for Publication All authors have read and agreed to the published version of the manuscript.
 24176+Supplementary Materials.pdf
|

|

 Quick Links
 DownLoad: