


-
Headache disorders, particularly migraine and tension-type headache (TTH), constitute a significant global health burden[1]. Approximately half of the adult population experiences headache disorders[2]. These disorders cause substantial health losses, diminished quality of life, and economic burdens[1,3,4]. In 2019, headache disorders were the second leading cause of years lived with disability (YLDs) worldwide, comprising 5.4% of the total global YLDs. Furthermore, headache disorders are the primary contributor to YLDs[3]. Disability-adjusted life years (DALYs) attributed to headache disorders have increased gradually from 1990 to 2019[5], and age-standardized DALY rates for these disorders are also increasing. East Asia demonstrated the highest increase in the prevalence of both migraine and TTH[5].
Headache disorders are a major public health concern in China. In 2017, they were the eighth leading cause of YLDs in China, affecting approximately 482.7 million people[6]. Previous studies have indicated a high prevalence of headache disorders, with incidence projected to increase[7]. However, the intermittent or occasional nature of headache disorders can affect patient understanding and lead to underestimation of their health impacts and overall burden. In addition, research on the burden of headache disorders in China using the most recent data is limited. Given the significant geographical and economic variations across different Chinese provinces, an accurate and timely understanding of the burden of headache disorders at both the national and provincial levels is crucial. This understanding will allow for assessment of epidemiological characteristics and inform the development of public health interventions and policies tailored to specific regions.
Therefore, this study used data from the Global Burden of Disease Study (GBD) 2021 to examine the prevalence and DALYs of headache disorders and their subtypes (migraine and TTH) in China and its provinces from 1990 to 2021[8].
-
Data were derived from the GBD 2021[8]. The GBD 2021 collected data from various sources, including household surveys, disease-specific registries, and medical system data, to estimate deaths and the burden of non-fatal conditions across 204 countries and territories. Prevalence data for headaches were processed using the Disease Modeling Meta-Regression modeling tool, which estimates the burden of disease by age, sex, geographic location, and year. The statistical methods and metrics used in GBD 2021 are described elsewhere[8,9]. This study used data on the prevalence and DALYs of headache disorders, including migraine and TTH, for China and its mainland provinces, municipalities, and autonomous regions from 1990 to 2021.
-
Headache disorders are classified as Level 3 in the GBD-cause hierarchy, with further categorization into migraine and TTH groups. Medication overuse headaches (secondary headaches), previously identified in earlier studies, have been incorporated into existing disease classifications. Because headaches are non-fatal, DALYs for headaches are equivalent to YLDs, which are calculated by multiplying prevalence by disability weight[8].
-
The number of prevalent cases, age-standardized prevalence rates, DALYs, and age-standardized DALY rates by sex were determined for headache disorders and subtypes. Percentage changes in these measures during the study period were calculated. Additionally, age-standardized DALY rates for headache disorders in each province were calculated for 1990 and 2021, and the percentage change from 1990 to 2021 was estimated. Age groups were established using 5-year intervals, from 0–4 years to > 80 years, to show the age distribution of the DALY rates of headache disorders by sex in 2021. DALYs for the headache disorder subtypes (migraine and TTH) were calculated from 1990 to 2021. Rates were standardized according to the GBD World Standard Population. The 95% uncertainty intervals were presented for each indicator.
All analyses were performed using SAS version 9.4 (SAS Institute Inc, Cary, NC, USA) and R version 4.3.3 (The R Foundation for Statistical Computing).
-
Table 1 shows the number of prevalent cases, age-standardized prevalence rates, DALYs, and age-standardized DALY rates for all headache disorders, migraine, and TTH in China for 1990 and 2021. In 2021, an estimated 426 million people in China experienced headaches, including 186 million men and 240 million women. The number of prevalent cases increased by 37.78% between 1990 and 2021. The age-standardized prevalence rate in 2021 was 27,582.61/100,000, with men (23,825.72/100,000) having a lower prevalence than women (31,549.02/100,000). From 1990 to 2021, the age-standardized prevalence rates for all headache disorders, migraine, and TTH increased by 6.92%, 7.57%, and 7.86%, respectively; 8.68%, 8.72%, and 9.89% in men; and 5.60%, 6.91%, and 6.20% in women, respectively. In 2021, the age-standardized DALY rates for headache disorders were 487.15/100,000 overall, 382.94/100,000 for men, and 598.12/100,000 for women. From 1990 to 2021, the age-standardized DALY rates for all headache disorders, migraine, and TTH increased by 7.12%, 7.43%, and 4.08%, respectively. Increases in age-standardized DALY rates for all headache disorders, migraine, and TTH were more pronounced in men than in women. Specifically, the rates increased by 7.42%, 7.82%, and 4.28%, respectively, in men and by 6.99%, 7.24%, and 4.01%, respectively, in women.
Variables Both Men Women 1990 2021 Percent change (%) 1990 2021 Percent change (%) 1990 2021 Percent change (%) All headache disorders Number of prevalent cases
(thousands)309,197.88
(283,206.15, 337,800.28)426,012.55
(392,887.36, 461,775.93)37.78
(31.66, 44.47)135,256.76
(123,112.45, 148,349.28)186,092.87
(169,878.67, 203,555.35)37.58
(30.93, 44.75)173,941.12
(159,508.02, 189,576.81)239,919.68
(222,532.36, 258,926.54)37.93
(30.61, 45.60)Age-standardized prevalence rate
(/100,000)25,797.46
(23,744.17, 2,7933.31)27,582.61
(25,492.64, 29,985.80)6.92
(4.44, 9.74)21,922.81
(20,094.42, 23,981.23)23,825.72
(21,788.64, 26,050.74)8.68
(5.12, 12.69)29,875.55
(27,605.03, 32,369.89)31,549.02
(29,286.91, 34,023.01)5.60
(1.98, 8.99)Number of DALYs
(thousands)5,518.25
(1,088.13, 11,790.02)7,704.36
(1,631.69, 16,157.99)39.62
(29.28, 55.57)2,227.93
(562.08, 4,623.76)3,094.23
(832.97, 6,274.83)38.88
(28.32, 54.06)3,290.32
(523.75, 7,158.03)4,610.14
(809.06, 9,786.31)40.11
(27.93, 58.04)Age-standardized DALY rate
(/100,000)454.76
(93.92, 960.90)487.15
(95.38, 1,036.76)7.12
(−0.20, 11.61)356.48
(95.01, 724.98)382.94
(95.21, 776.80)7.42
(−0.48, 13.03)559.06
(94.27, 1,214.51)598.12
(94.38, 1,288.74)6.99
(−1.11, 12.72)Migraine Number of prevalent cases
(thousands)133,474.54
(114,199.44, 153,482.60)184,752.28
(160,836.52, 213,633.96)38.42
(29.87, 48.03)50,887.36
(43,387.43, 59,129.69)70,036.22
(60,652.05, 81,324.23)37.63
(27.83, 46.88)82,587.18
(70,478.90, 94,673.00)114,716.06
(98,856.23, 132,076.64)38.90
(27.92, 50.06)Age-standardized prevalence rate
(/100,000)10,948.52
(9,428.76, 12,586.13)11,777.51
(10,137.56, 13,538.56)7.57
(3.53, 11.42)8,077.76
(6,940.56, 9,333.35)8,781.96
(7,497.40, 10,129.33)8.72
(2.74, 14.25)13,992.18 (12,040.43, 16,050.32) 14,959.04
(12,857.78, 17,190.35)6.91
(1.61, 12.53)Number of DALYs
(thousands)5,028.79
(767.67, 11,262.27)6,988.20
(1,133.32, 15,186.29)38.96
(28.64, 53.32)1,987.26
(394.50, 4,365.13)2,745.32
(581.68, 5,851.44)38.15
(27.93, 52.70)3,041.52
(360.24, 6,866.45)4,242.88
(548.62, 9,335.92)39.50
(27.05, 57.21)Age-standardized DALY rate
(/100,000)412.97
(66.16, 911.02)443.65
(66.93, 971.68)7.43
(−0.24, 11.47)316.56
(65.91, 692.31)341.31
(67.72, 739.24)7.82
(−0.97, 13.47)515.35
(64.62, 1,157.38)552.65
(64.68, 1,221.52)7.24
(−1.27, 13.10)TTH Number of prevalent cases
(thousands)204,064.31
(176,898.60, 233,568.23)283,814.15
(251,438.66, 320,431.56)39.08
(30.20, 49.33)93,696.75
(81,301.11, 107,220.27)130,205.17
(113,609.95, 148,215.07)38.96
(29.12, 50.12)110,367.56
(95,575.14, 126,490.49)153,608.98
(135,965.65, 173,917.94)39.18
(29.50, 50.08)Age-standardized prevalence rate
(/100,000)17,174.48
(15,086.74, 19,379.66)18,525.07
(16,380.87, 20,958.70)7.86
(3.99, 12.15)15,321.49
(13,462.78, 17,389.81)16,837.13
(14,750.15, 19,169.77)9.89
(4.59, 15.21)19,107.02
(16,708.49, 21,546.14)20,292.27
(18,007.36, 22,987.63)6.20
(0.68, 11.24)Number of DALYs
(thousands)489.46
(151.74, 1,687.08)716.16
(224.40, 2,174.72)46.32
(20.26, 70.80)240.67
(78.46, 873.20)348.91
(115.34, 1,113.50)44.97
(21.33, 73.92)248.79
(72.19, 842.24)367.26
(108.11, 1,130.64)47.62
(18.76, 71.34)Age-standardized DALY rate
(/100,000)41.79
(13.09, 141.41)43.50
(13.07, 141.34)4.08
(−3.25, 19.16)39.92
(13.17, 140.40)41.63
(13.33, 143.34)4.28
(−3.59, 21.24)43.72
(12.86, 144.46)45.47
(13.03, 152.73)4.01
(−5.94, 18.57)Note. The values in parentheses represent the uncertainty intervals; DALYs, disability-adjusted life years; TTH, tension-type headaches. Table 1. Burden of headache disorders by sex in China in 1990 and 2021
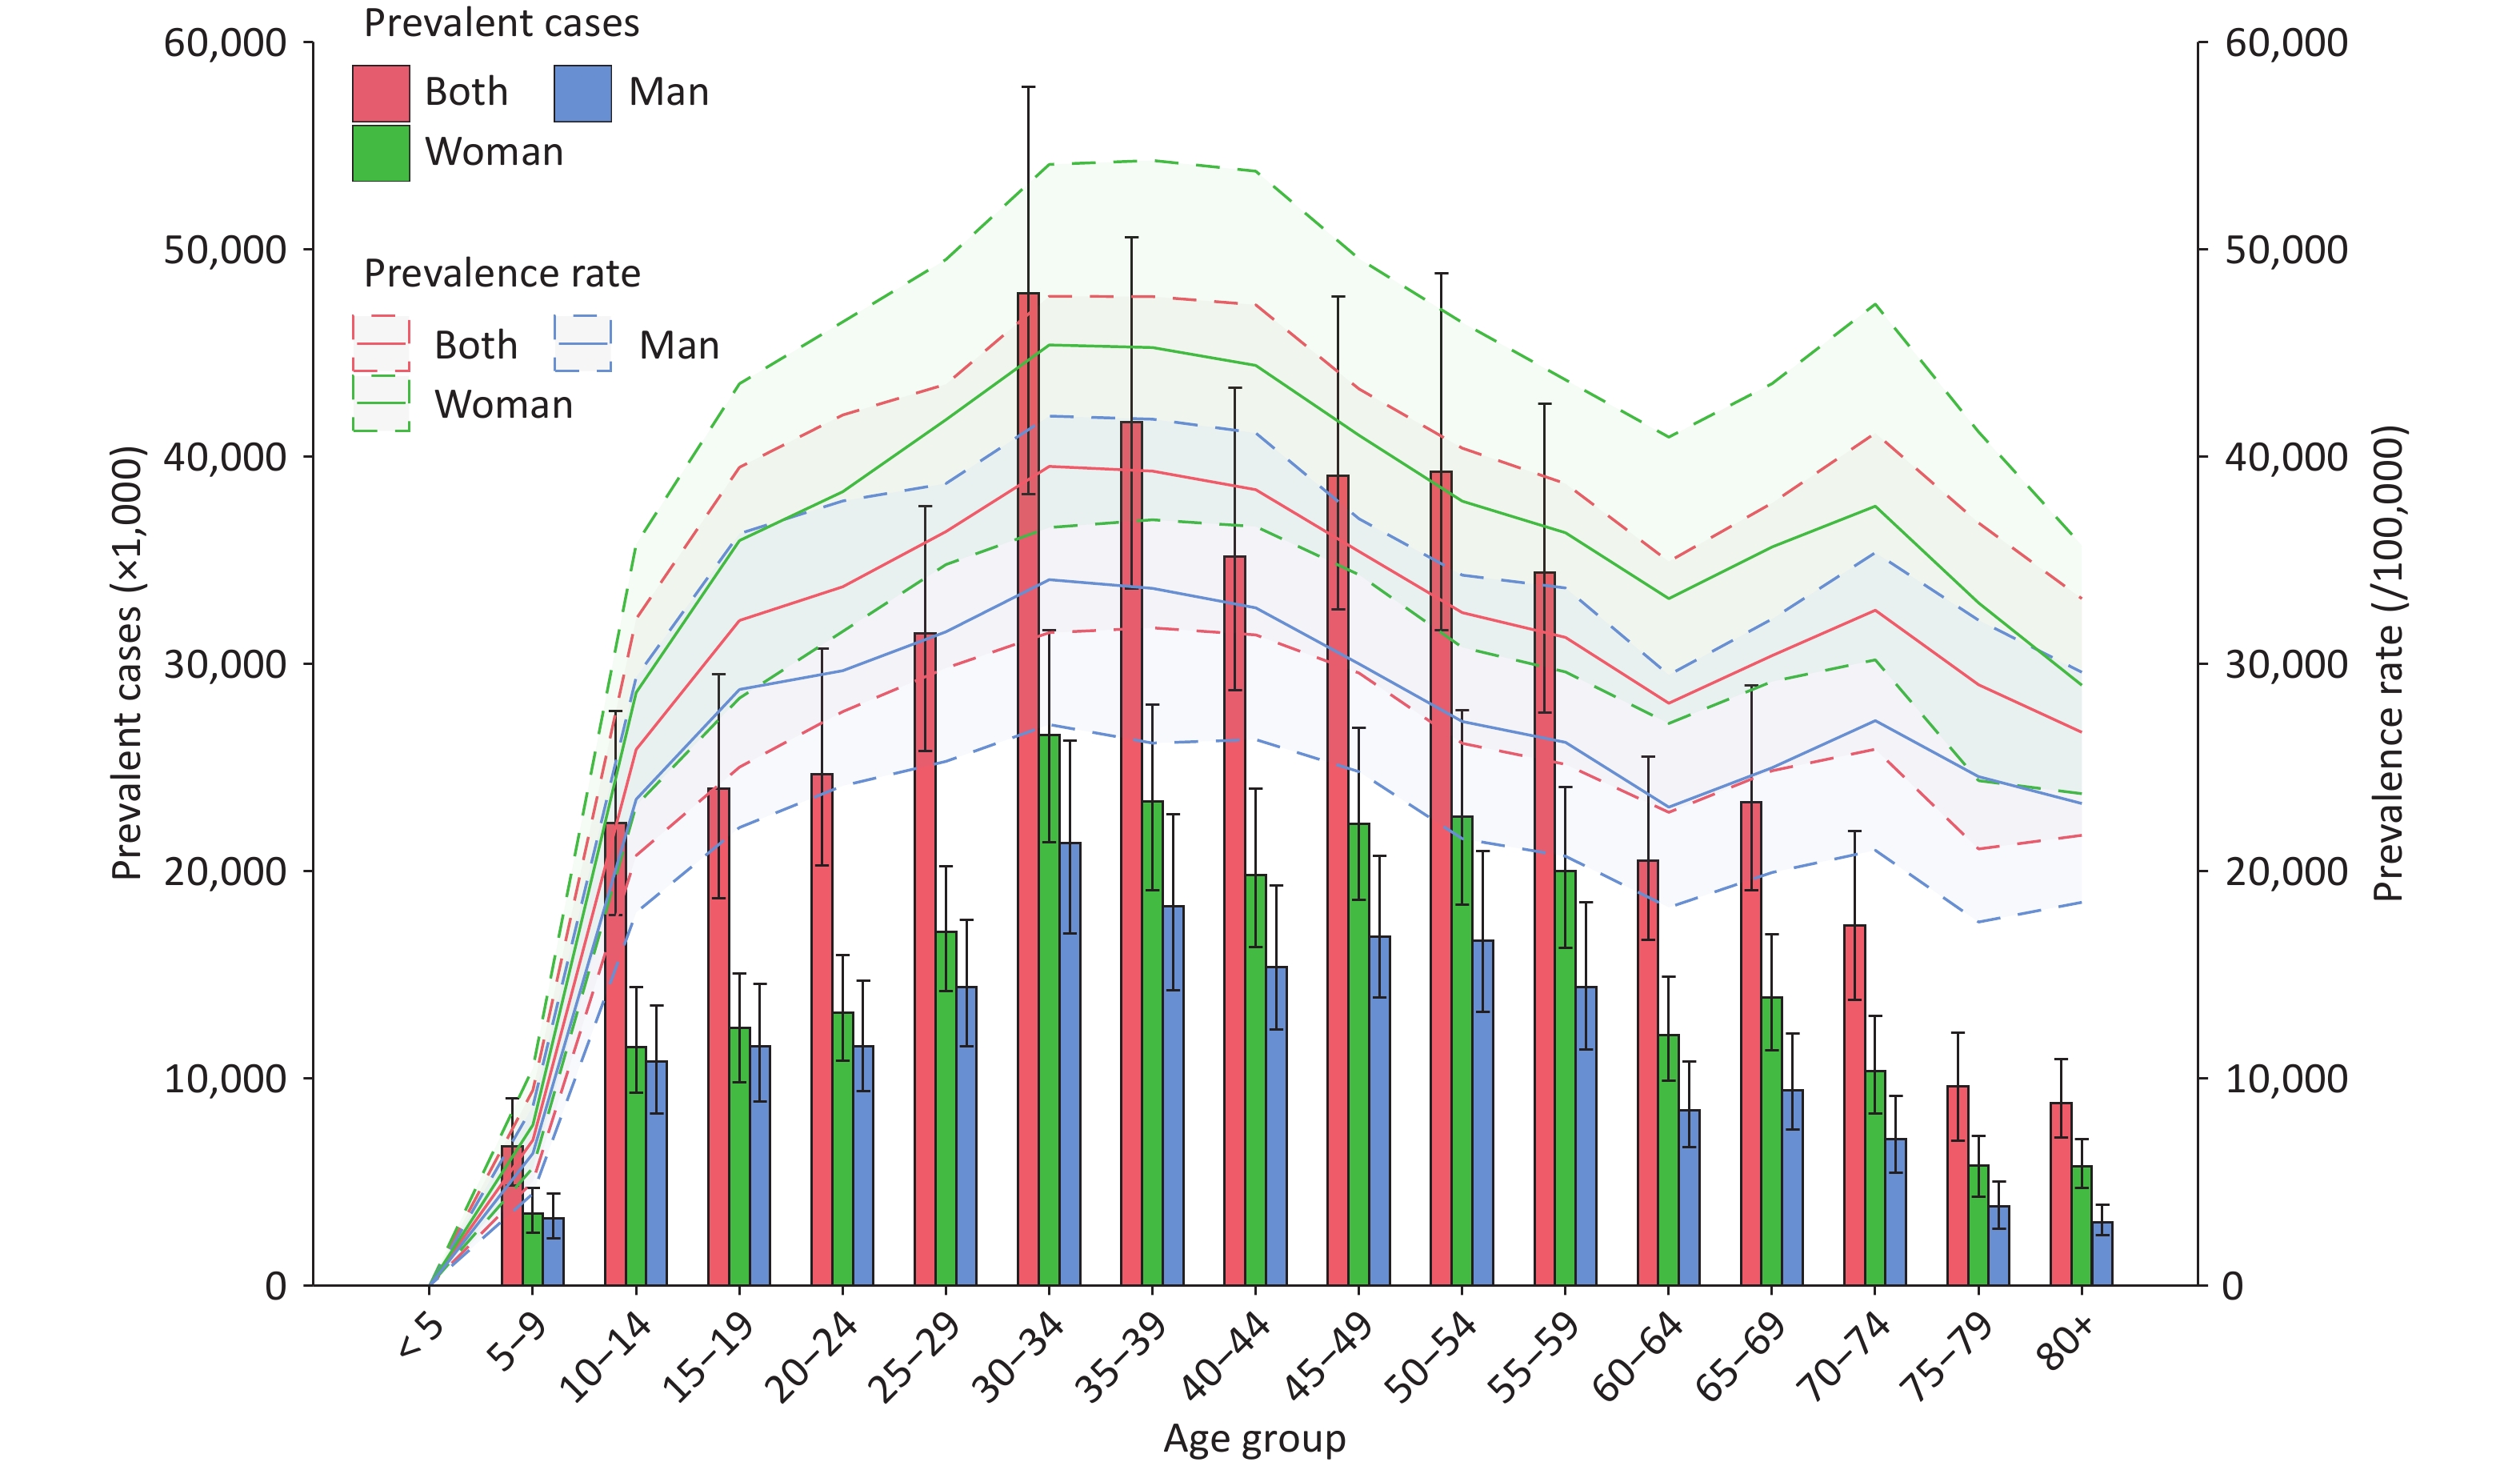
Figure 1 shows the age- and sex-specific prevalence rates of all headache disorders in 2021. The highest prevalence was observed in the 30–34 age group (39,520.60/100,000), followed by the 35–39 (39,293.61/100,000) and 40–44 (38,396.17/100,000) groups. Prevalence increased rapidly until age 30, then gradually declined, with a slight increase observed in those aged 60–74 years. The 30–34 age group had the highest number of prevalent cases (48 million), followed by the 35–39 age group (42 million). In 2021, the number of prevalent cases and prevalence rates were higher in women than in men across all age groups.
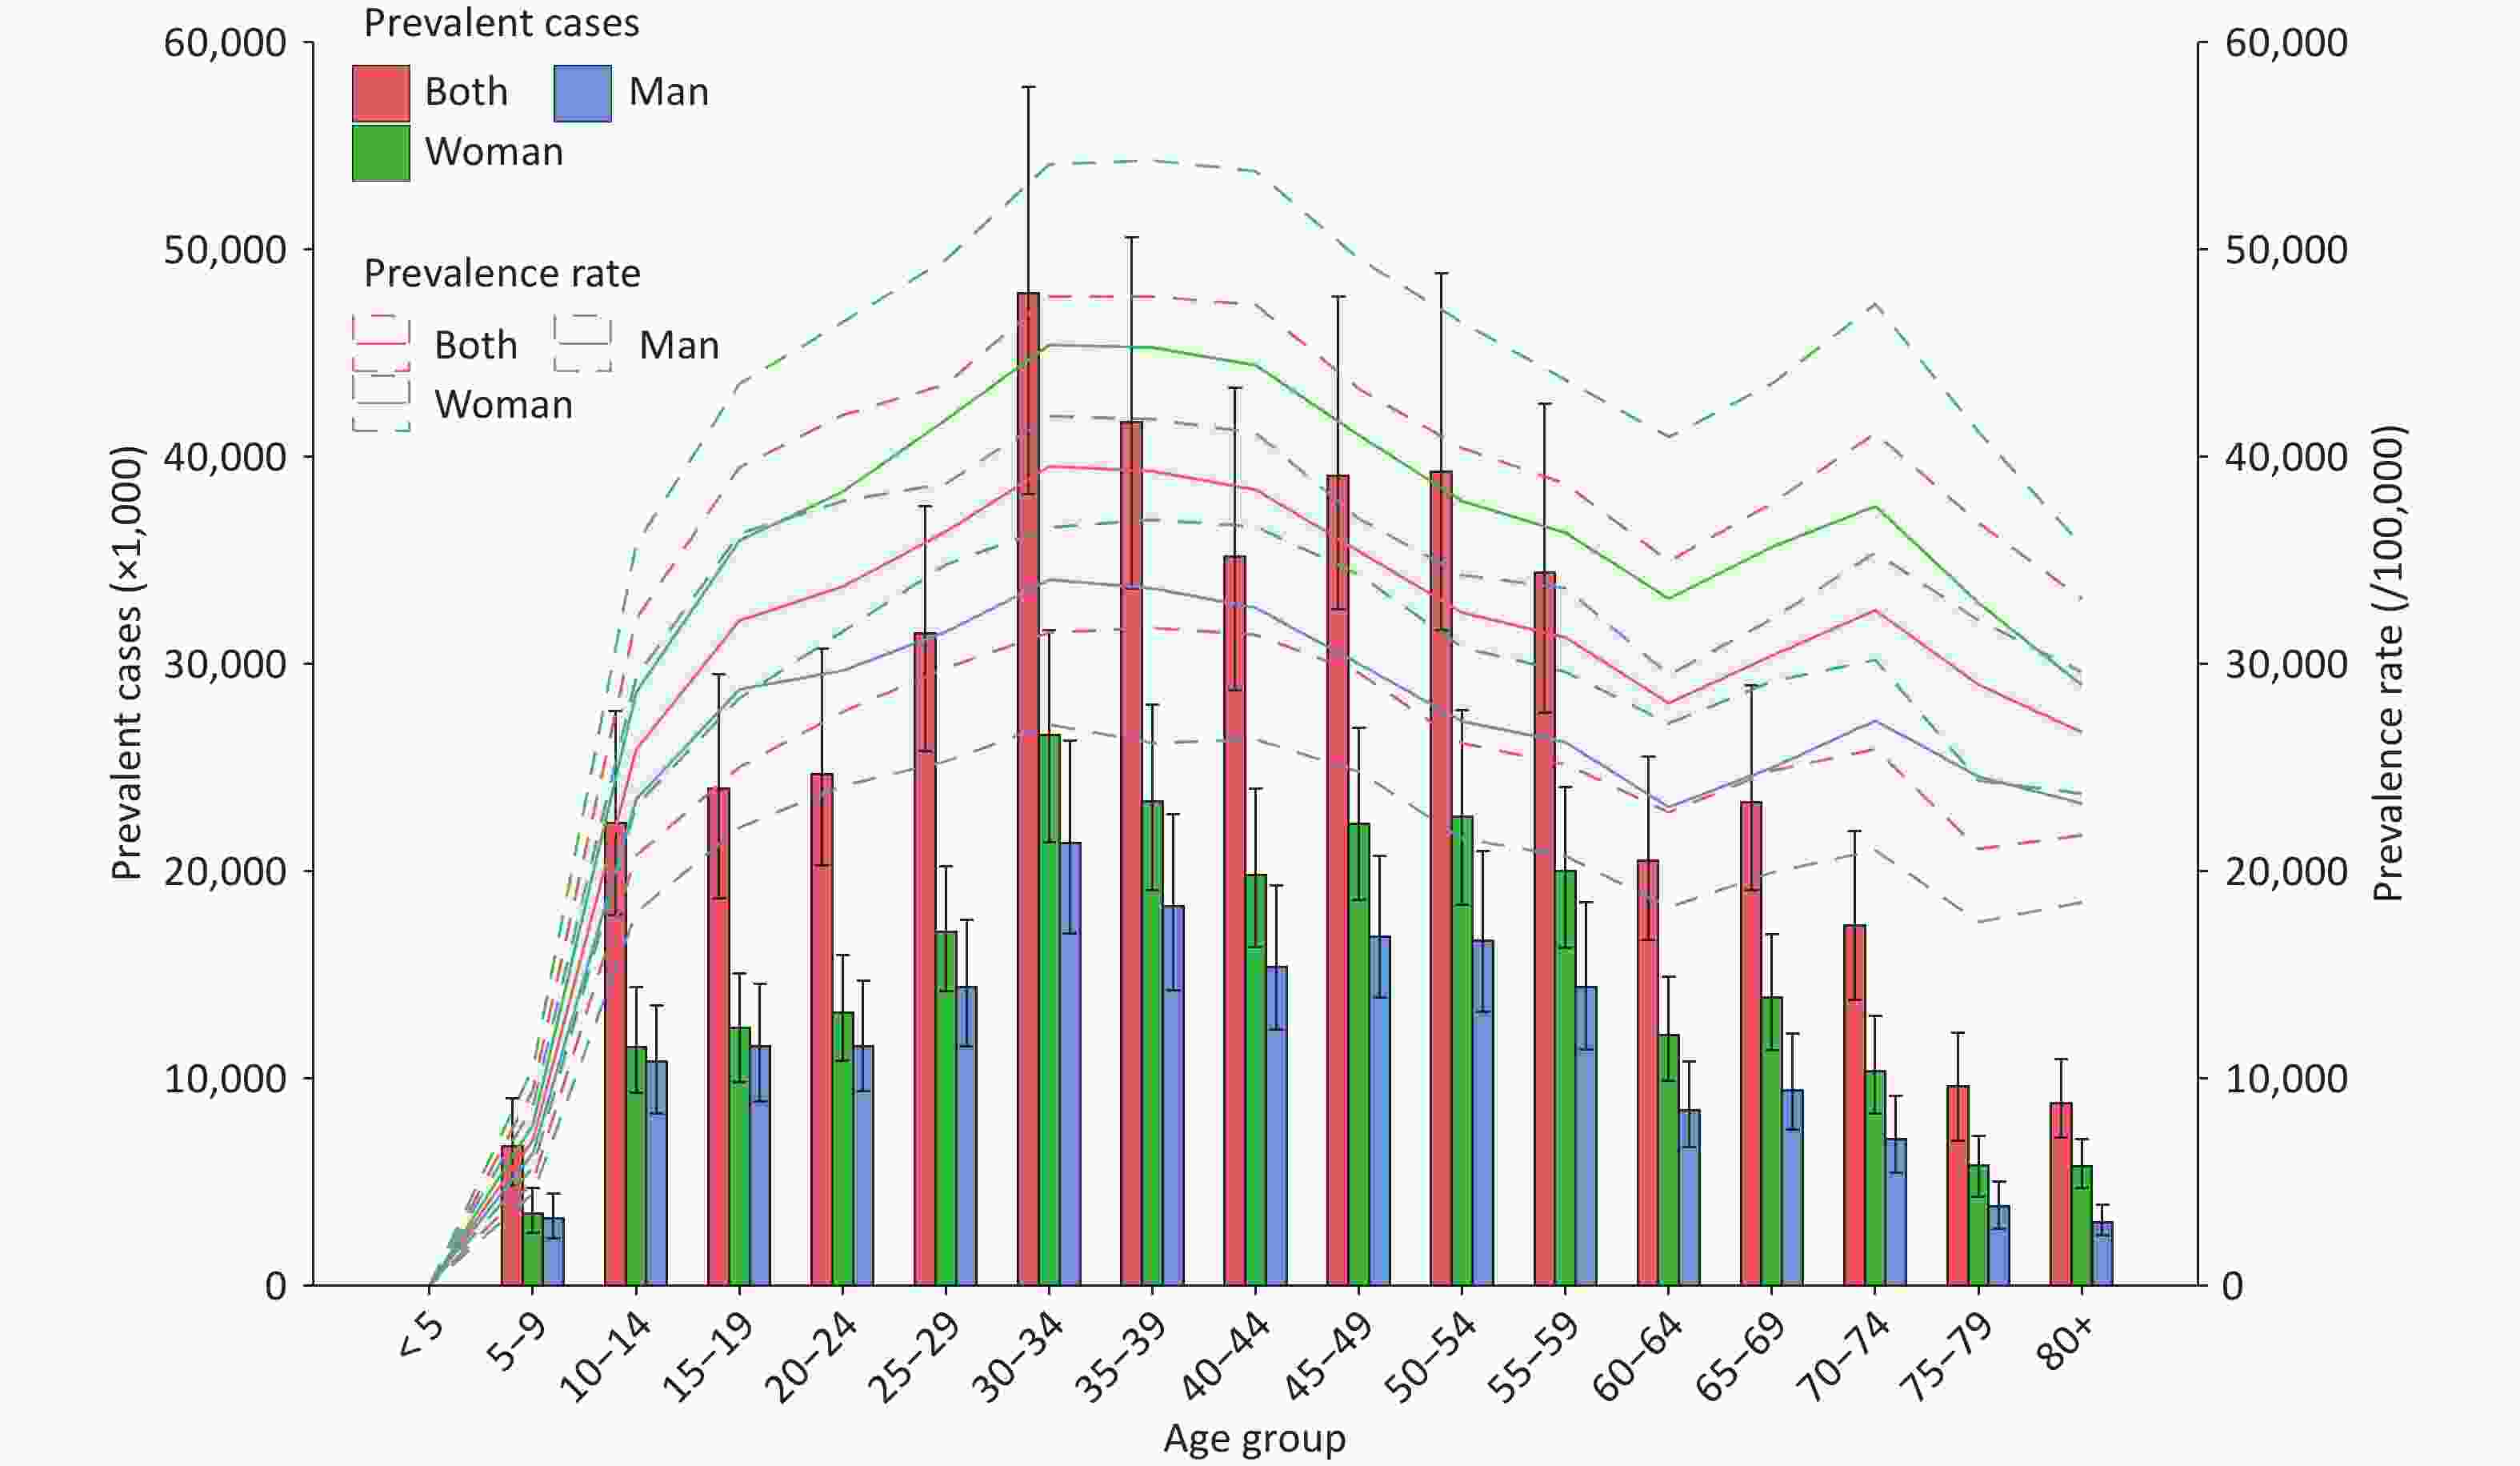
Figure 1. Age-sex-specific prevalence rate and prevalent cases of all headache disorders in China, 2021.
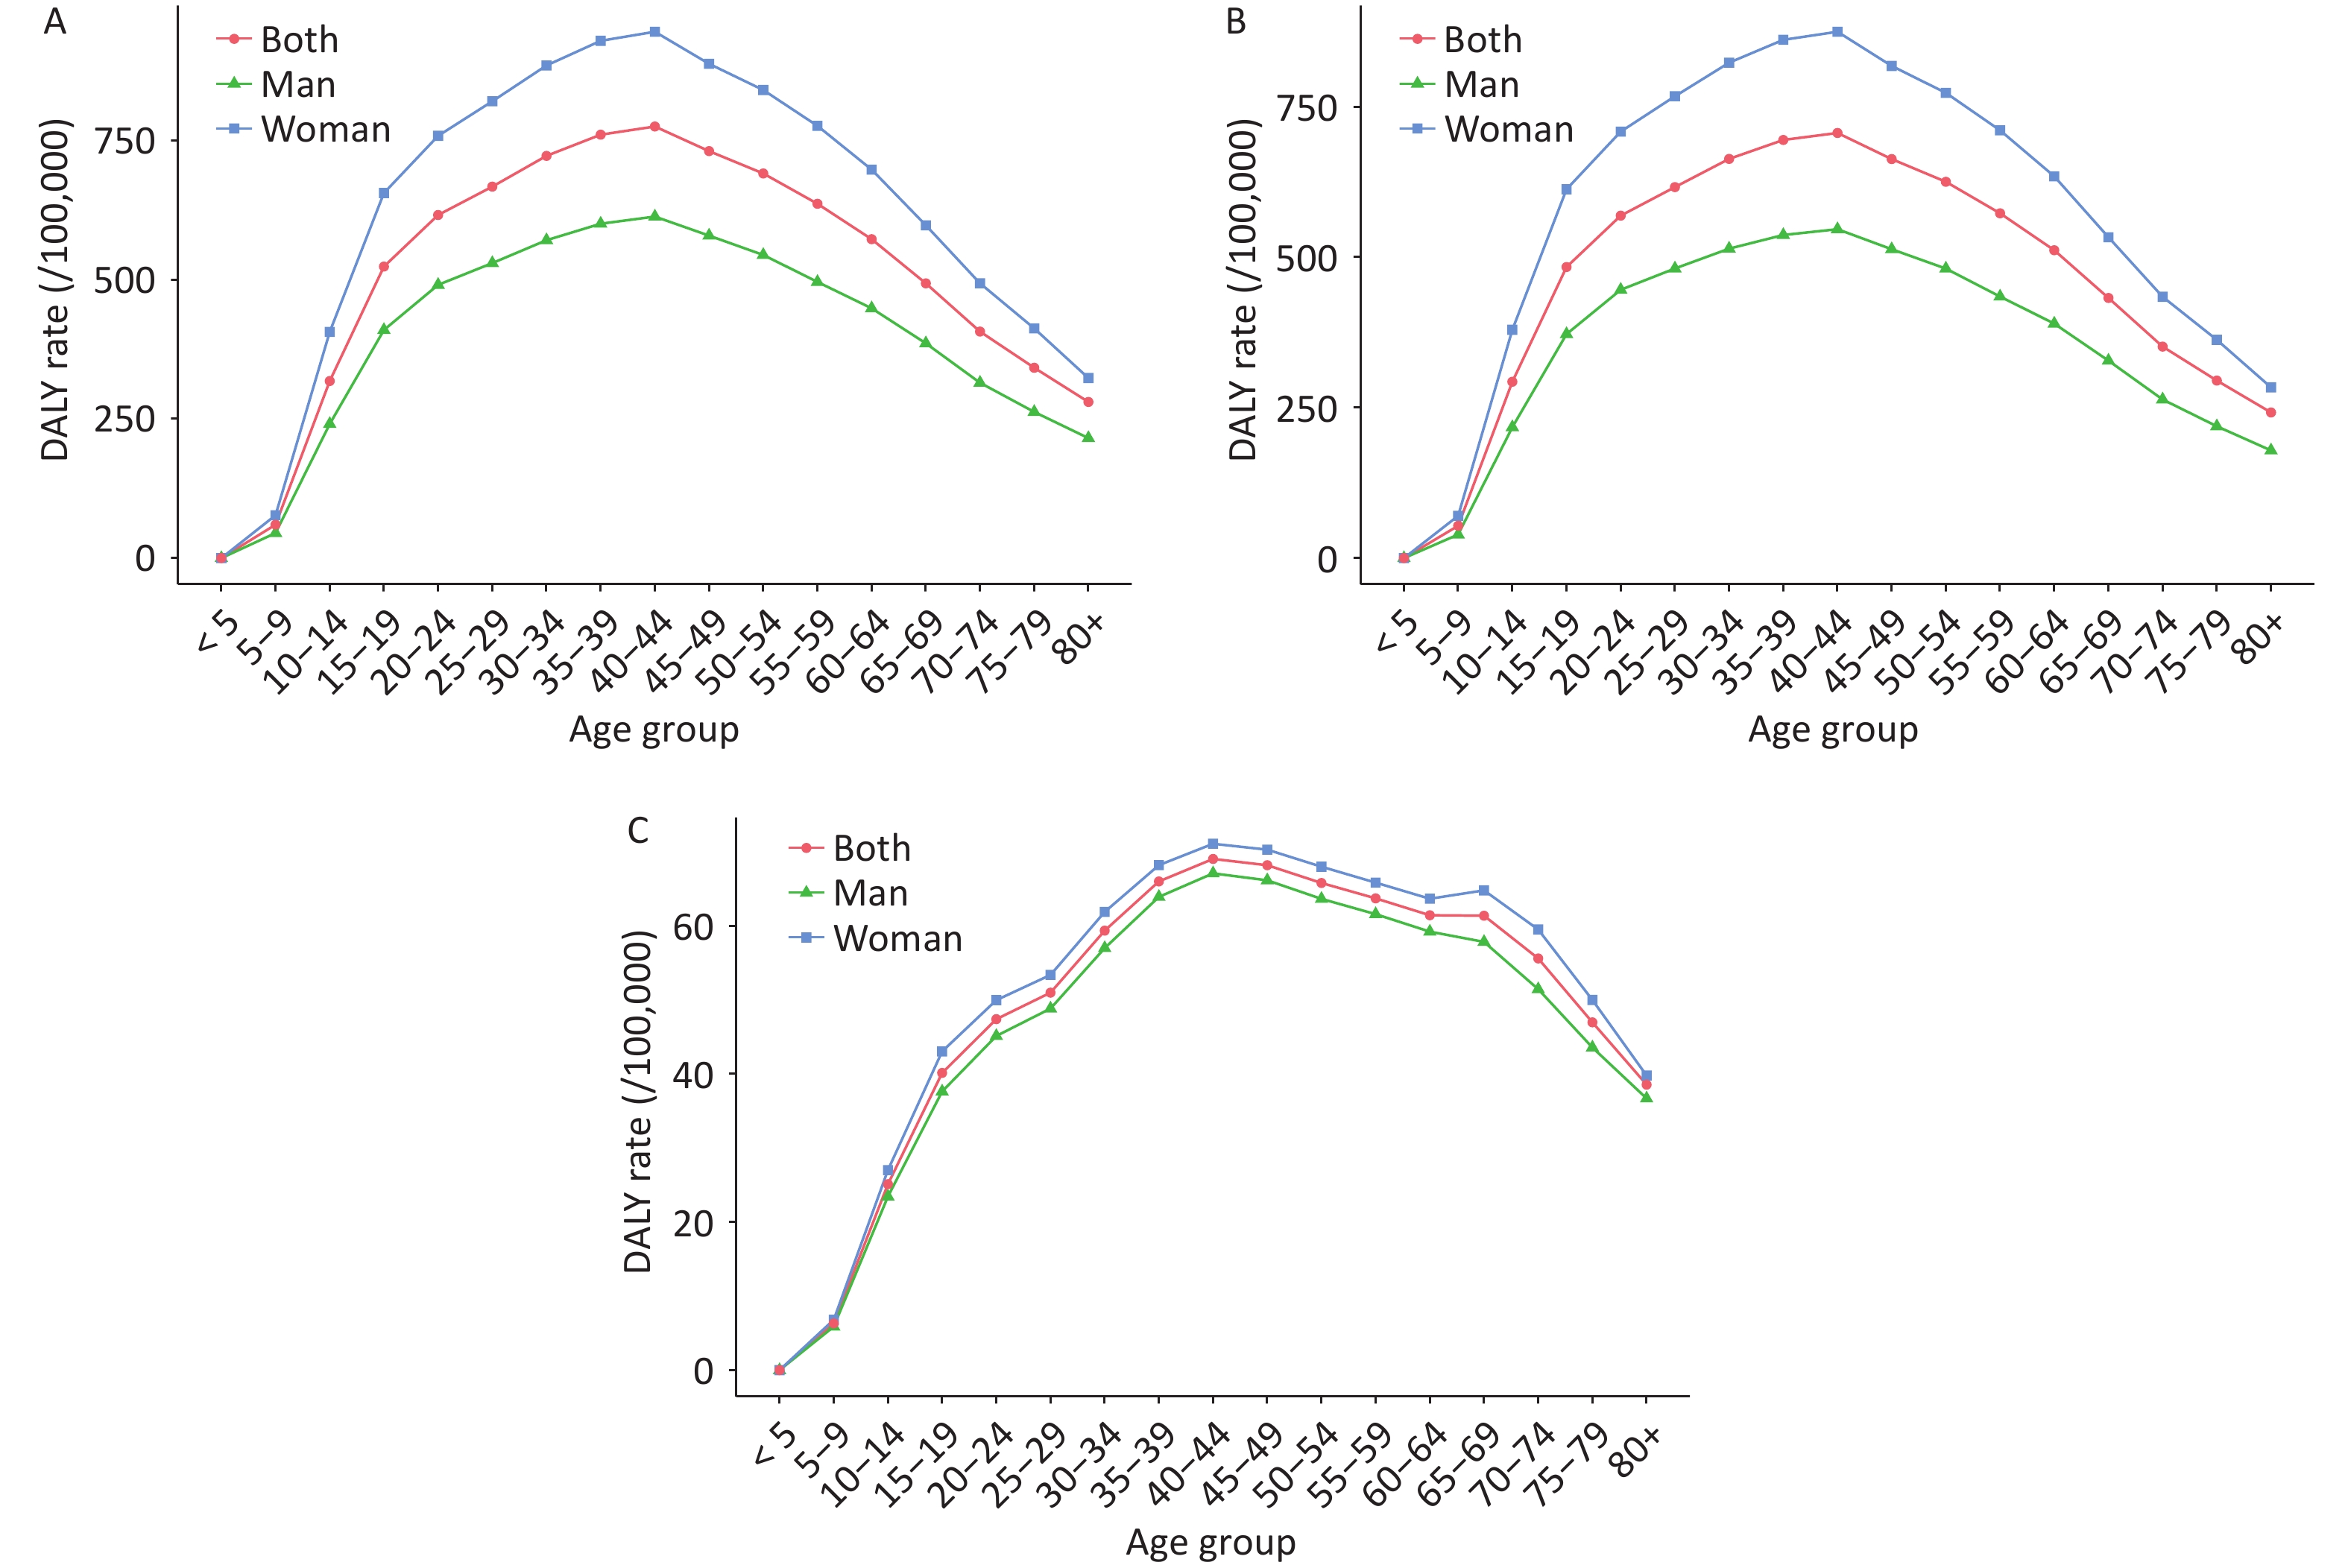
Figure 2 shows the age-specific DALY rates for all headache disorders, migraine, and TTH according to sex in 2021. DALY rates for all headache disorders, migraine, and TTH increased in younger age groups, peaked in 40–44 age groups, and then declined gradually. The DALY rates for all headache disorders, migraine, and TTH in the 40–44 age group were 775.50/100,000, 706.45/100,000, and 69.05/100,000, respectively. The DALY rates attributable to TTH were significantly lower than those attributable to migraine. In 2021, the DALY rates for all headache disorders, migraine, and TTH were higher in women than in men across all age groups.
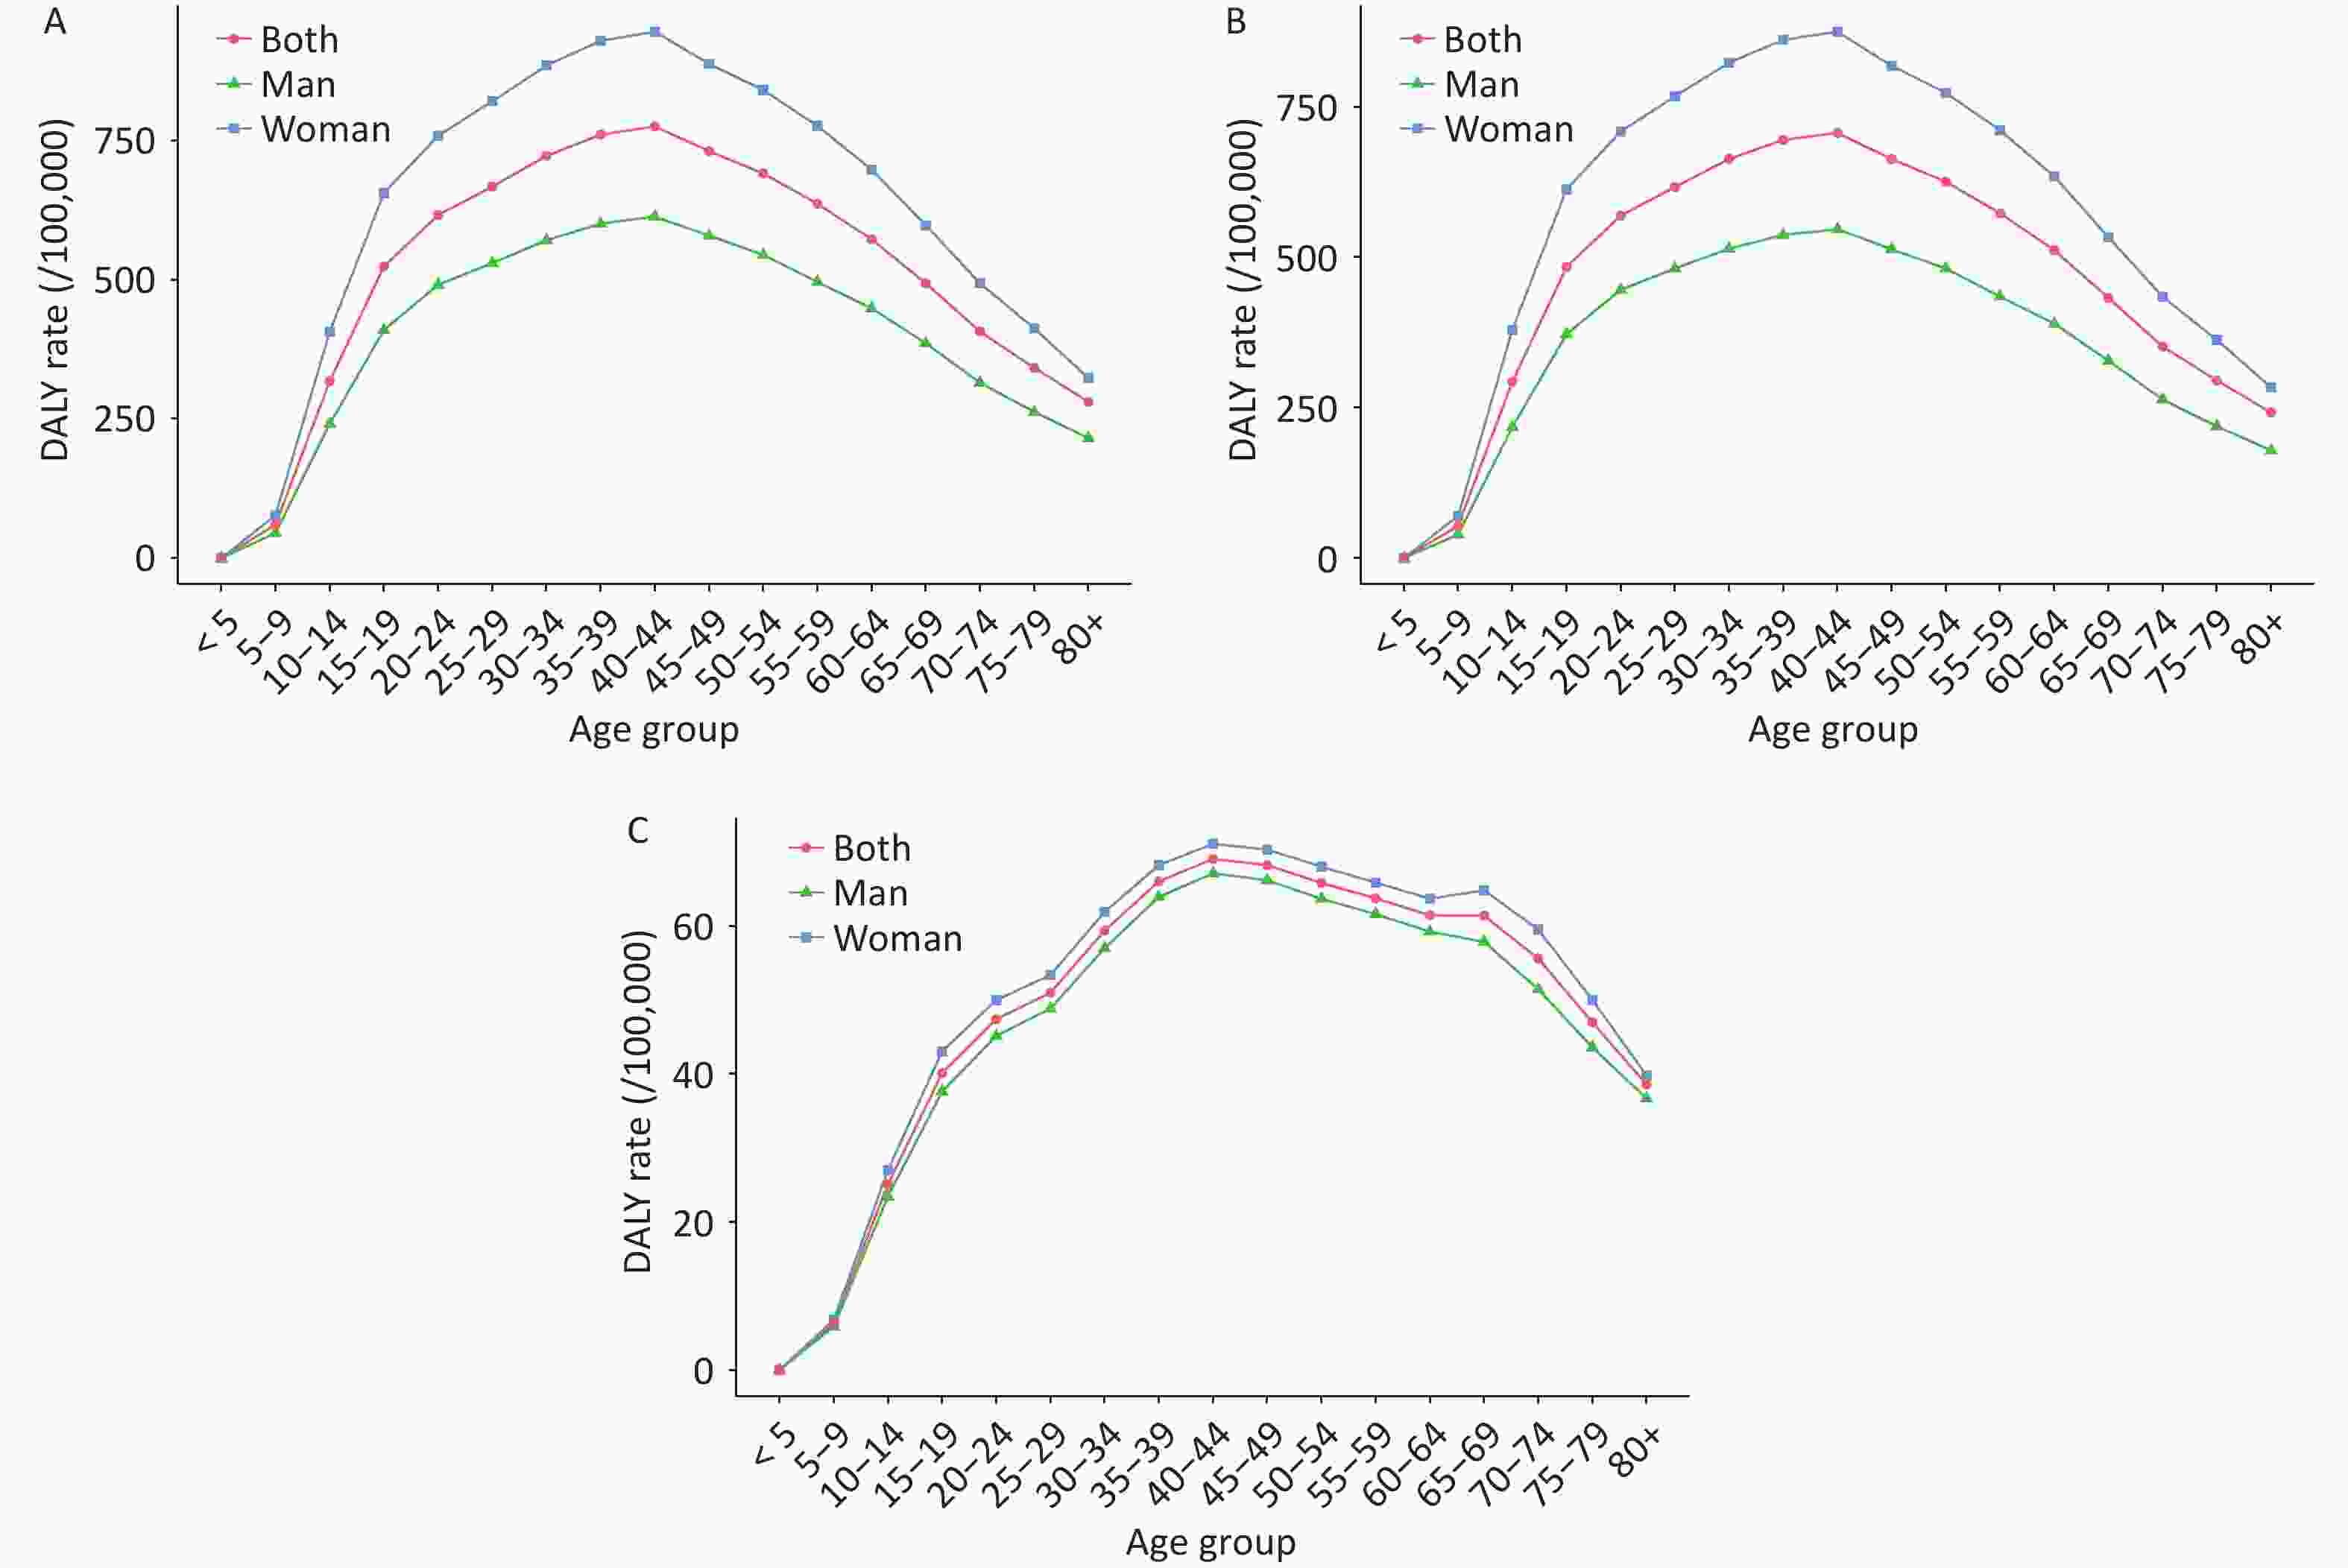
Figure 2. Age-sex-specific DALY rates for all headache disorders in China, 2021. (A) all headache disorders; (B) migraine; (C) tension-type headache.
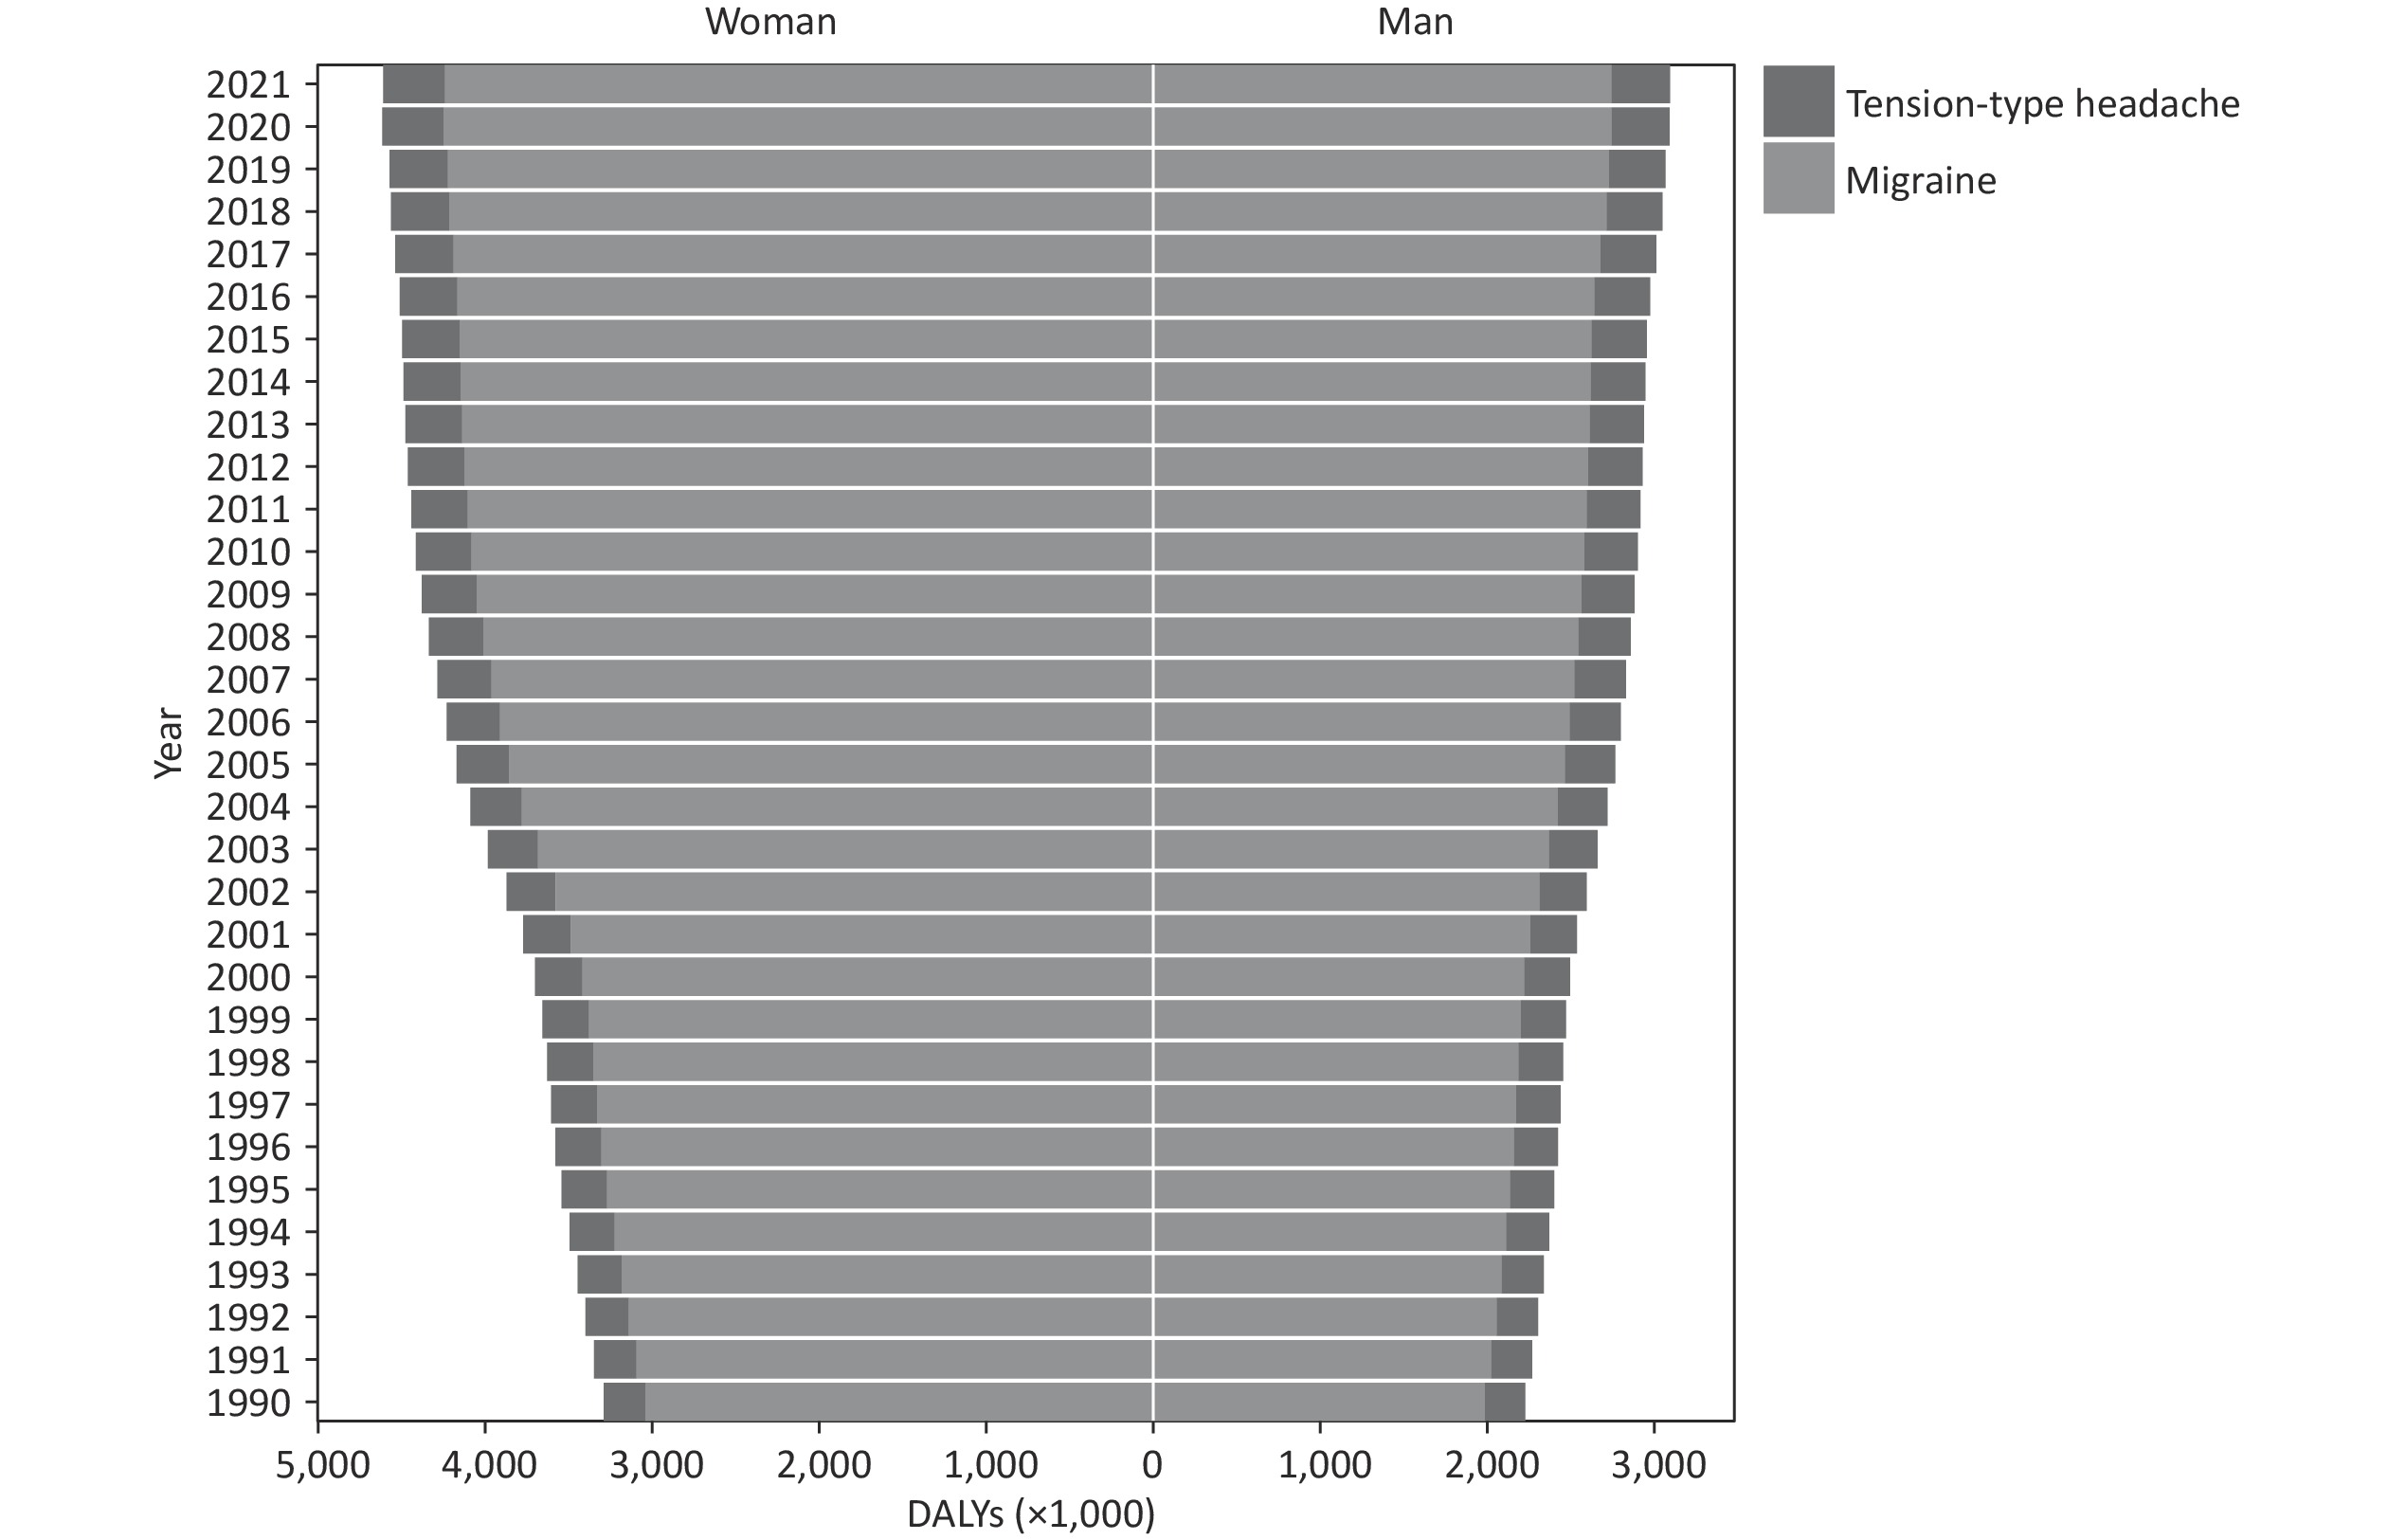
The DALYs for both migraine and TTH in China from 1990 to 2021 are shown in Figure 3. DALYs for both migraine and TTH gradually increased, with migraine contributing far more DALYs than TTH. In 1990, migraine accounted for 2 million DALYs in men (89.20% of the total DALYs) and 3 million DALYs in women (92.44% of the total DALYs). In 2021, migraine accounted for 3 million DALYs in men (88.72% of total men DALYs) and 4 million DALYs in women (92.03% of total women DALYs).
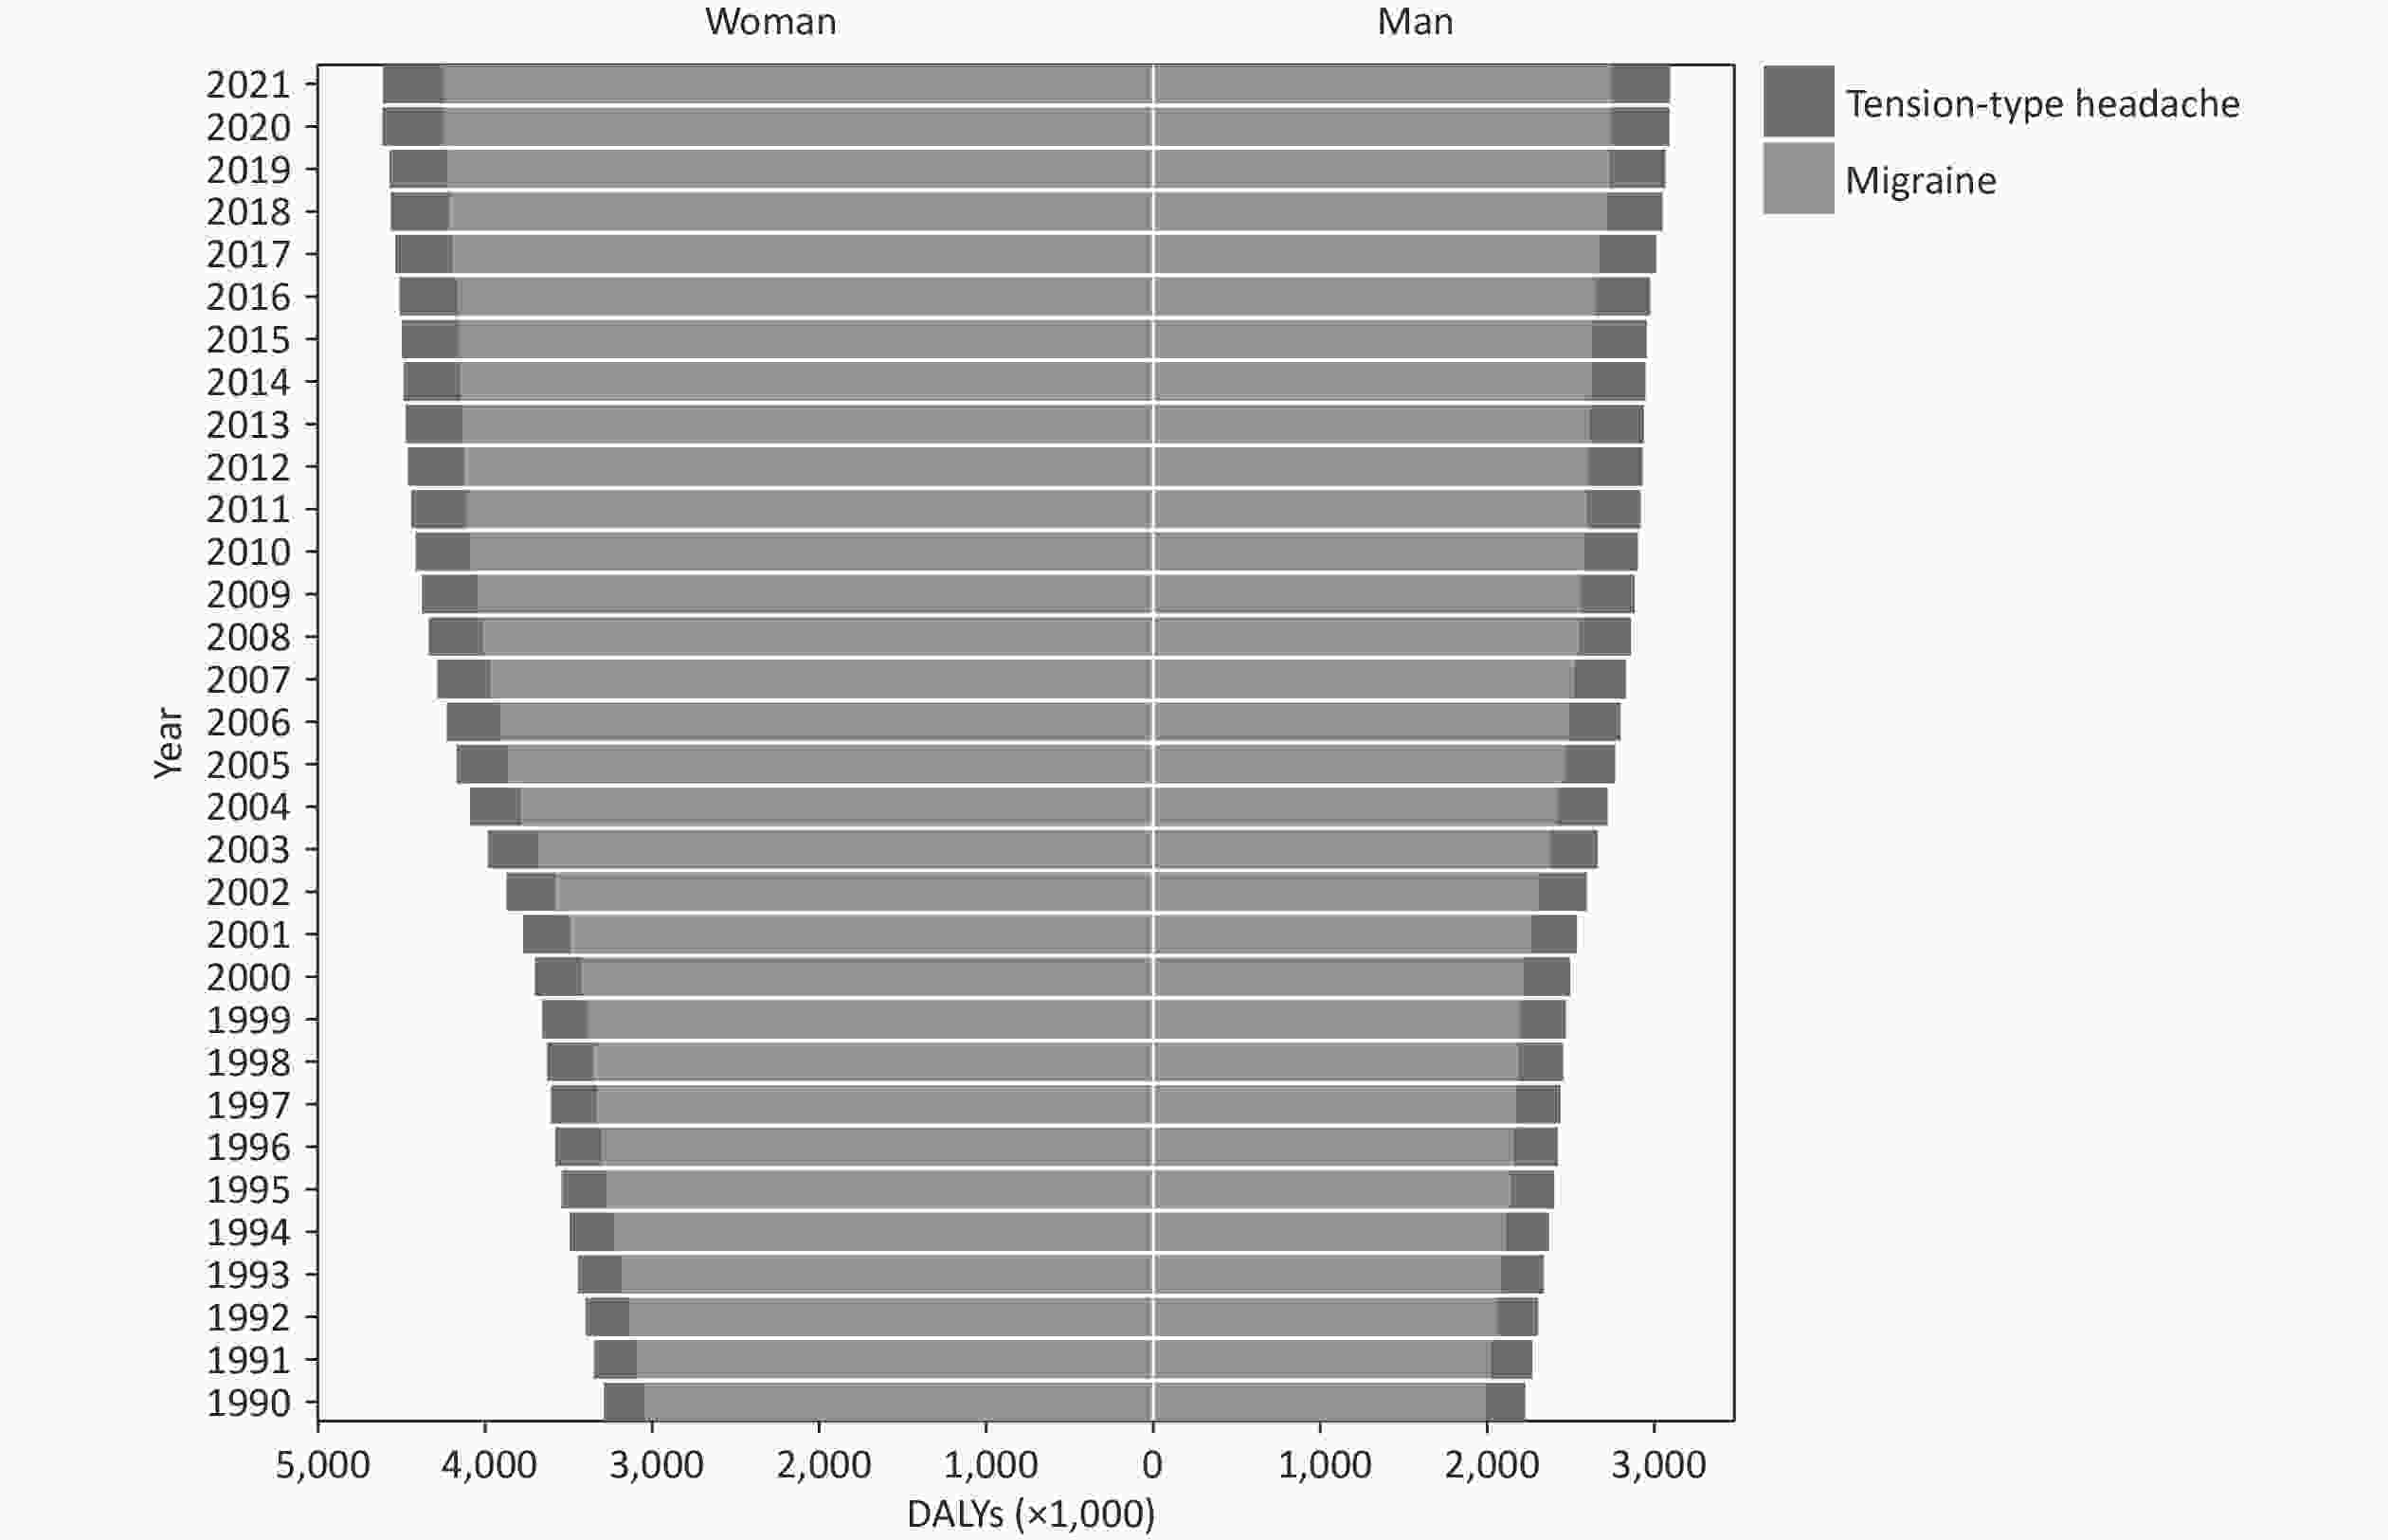
Figure 3. DALYs of migraine and TTH in China, 1990–2021. TTH, tension-type headache; DALYs, disability-adjusted life years.
Table 2 shows the age-standardized DALY rates for all headache disorders, migraine, and TTH for all the 31 mainland provinces in China in 1990 and 2021, along with percentage changes. In 2021, the highest age-standardized DALY rates for all headache disorders were observed in Heilongjiang (617.85/100,000) and Shanghai (542.86/100,000). These provinces also had the highest age-standardized DALY rates for migraine (574.45/100,000 in Heilongjiang and 499.66/100,000 in Shanghai). Fujian had the highest age-standardized DALY rates for TTH (48.00/100,000). From 1990 to 2021, the largest increases in age-standardized DALY rates for all headache disorders were observed in Gansu, Guizhou, and Chongqing at 8.22%, 8.15%, and 8.06%, respectively. The largest increases in age-standardized DALY rates for migraine were observed in Gansu, Guizhou, and Chongqing at 8.63%, 8.53%, and 8.45%, respectively. The largest increases in age-standardized DALY rates for TTH were observed in Fujian Province, Inner Mongolia, and Shaanxi at 6.27%, 4.56%, and 4.51%, respectively.
Regions All headache disorders Migraine TTH 1990 2021 Percent change (%) 1990 2021 Percent change (%) 1990 2021 Percent change (%) Anhui 449.93
(93.02, 948.23)484.73
(95.71, 1,031.60)7.73
(−1.07, 14.38)408.30
(67.02, 906.41)441.38
(66.33, 967.37)8.10
(−1.61, 14.48)41.63
(12.83, 140.46)43.35
(12.99, 141.39)4.12
(−10.00, 21.77)Beijing 451.22
(94.16, 958.44)483.80
(97.31, 1,028.29)7.22
(−0.56, 13.21)409.27
(64.53, 906.53)440.24
(66.95, 968.59)7.57
(−1.11, 13.65)41.95
(12.67, 135.79)43.56
(13.06, 138.49)3.83
(−11.18, 18.76)Chongqing 448.16
(94.05, 947.45)484.26
(96.01, 1,024.08)8.06
(−0.79, 14.15)406.51
(67.16, 898.57)440.84
(65.89, 962.55)8.45
(−2.05, 14.73)41.65
(12.83, 138.14)43.42
(12.94, 139.92)4.25
(−10.02, 21.07)Fujian 440.86
(95.20, 916.27)472.25
(94.65, 989.43)7.12
(−1.40, 13.30)395.69
(64.27, 874.51)424.25
(64.09, 929.42)7.22
(−1.91, 13.00)45.17
(12.67, 163.17)48.00
(12.64, 169.75)6.27
(−10.13, 23.61)Gansu 448.38
(93.85, 946.10)485.22
(95.71, 1,023.81)8.22
(−0.52, 14.10)406.75
(66.51, 890.05)441.86
(67.78, 969.06)8.63
(−1.93, 14.62)41.63
(12.51, 145.88)43.37
(12.88, 144.03)4.17
(−9.03, 21.27)Guangdong 450.65
(96.38, 955.15)478.87
(94.72, 1,017.62)6.26
(−2.10, 11.80)408.85
(66.33, 891.16)435.49
(66.35, 958.04)6.51
(−2.54, 11.96)41.80
(13.14, 139.48)43.39
(12.84, 139.86)3.79
(−9.58, 18.67)Guangxi 448.21
(92.67, 948.73)482.96
(95.15, 1,029.33)7.75
(−1.10, 13.66)406.63
(66.77, 901.82)439.63
(66.54, 964.60)8.11
(−1.31, 14.28)41.58
(12.78, 142.36)43.34
(12.88, 141.49)4.23
(−10.30, 20.41)Guizhou 447.27
(93.58, 947.16)483.73
(94.84, 1,027.44)8.15
(−0.87, 13.74)405.87
(65.76, 892.97)440.48
(66.38, 972.53)8.53
(−0.52, 14.16)41.40
(12.90, 145.20)43.25
(13.10, 145.03)4.48
(−8.32, 22.40)Hainan 449.28
(93.83, 941.99)479.19
(94.70, 1,019.16)6.66
(−1.49, 12.27)407.56
(66.42, 902.05)435.94
(68.18, 961.46)6.96
(−1.83, 12.80)41.71
(13.13, 140.62)43.25
(12.63, 140.84)3.69
(−9.10, 18.74)Hebei 451.95
(95.01, 955.22)485.64
(94.58, 1,032.14)7.45
(−1.61, 13.00)410.20
(66.39, 904.10)442.20
(67.31, 972.45)7.80
(−2.26, 13.56)41.75
(12.62, 140.26)43.45
(13.36, 140.91)4.06
(−9.78, 21.04)Heilongjiang 578.17
(95.22, 1,242.88)617.85
(95.52, 1,303.17)6.86
(−2.58, 13.85)536.37
(67.46, 1192.41)574.45
(65.99, 1265.87)7.10
(−2.12, 14.26)41.80
(13.11, 138.98)43.40
(13.48, 139.68)3.82
(−10.67, 19.85)Henan 452.22
(94.02, 956.34)486.99
(96.99, 1,037.32)7.69
(−1.26, 13.89)410.34
(65.37, 903.20)443.57
(66.89, 971.16)8.10
(−1.90, 14.70)41.88
(13.07, 141.78)43.43
(13.04, 141.01)3.70
(−9.81, 20.70)Hubei 450.22
(93.45, 964.98)482.46
(95.54, 1,018.27)7.16
(−1.82, 12.46)408.50
(65.63, 907.37)439.19
(66.85, 960.81)7.51
(−1.79, 13.37)41.72
(12.81, 142.34)43.27
(12.88, 139.66)3.71
(−9.44, 20.22)Hunan 446.98
(91.57, 940.42)482.72
(95.77, 1,022.59)8.00
(−1.26, 14.45)405.46
(64.13, 889.78)439.44
(65.72, 962.42)8.38
(−1.68, 14.31)41.51
(12.70, 140.02)43.27
(13.30, 140.78)4.23
(−9.37, 21.22)Inner Mongolia 449.11
(93.04, 946.04)484.46
(95.05, 1,022.83)7.87
(−0.92, 13.74)407.49
(65.82, 895.88)440.94
(66.82, 966.91)8.21
(−1.24, 14.12)41.62
(12.87, 139.75)43.52
(13.15, 140.54)4.56
(−8.58, 21.79)Jiangsu 452.55
(94.65, 952.59)484.18
(94.71, 1,036.35)6.99
(−1.75, 12.96)410.74
(66.90, 901.70)440.79
(67.76, 964.98)7.32
(−2.10, 13.57)41.82
(12.96, 141.61)43.39
(13.33, 138.99)3.77
(−10.17, 19.99)Jiangxi 449.17
(95.77, 950.94)484.38
(96.04, 1,030.76)7.84
(−0.49, 13.62)407.53
(66.62, 893.44)440.98
(65.55, 965.69)8.21
(−1.38, 14.48)41.64
(13.08, 142.26)43.40
(12.73, 142.10)4.24
(−9.46, 20.36)Jilin 451.33
(95.15, 947.02)486.07
(95.46, 1,036.86)7.70
(−1.31, 13.37)409.55
(65.22, 899.30)442.59
(66.86, 963.92)8.07
(−0.93, 13.97)41.78
(13.08, 140.33)43.48
(12.85, 139.90)4.06
(−9.92, 18.99)Liaoning 453.01
(94.77, 954.05)485.91
(94.20, 1,034.95)7.26
(−1.61, 13.28)411.21
(65.61, 905.10)442.45
(65.52, 970.29)7.60
(−2.43, 13.44)41.81
(13.02, 138.53)43.46
(12.73, 138.79)3.96
(−10.43, 18.98)Ningxia 450.58
(93.43, 950.80)485.21
(95.51, 1,031.86)7.69
(−0.84, 13.73)408.95
(65.12, 900.32)441.72
(65.79, 971.53)8.01
(−1.58, 13.81)41.62
(13.09, 142.59)43.49
(12.74, 143.07)4.49
(−9.55, 23.60)Qinghai 449.71
(93.03, 949.02)484.95
(95.58, 1,032.16)7.84
(−0.51, 13.45)408.07
(64.66, 901.80)441.55
(67.17, 965.10)8.20
(−1.16, 13.64)41.64
(12.69, 142.26)43.40
(13.22, 141.43)4.22
(−9.56, 21.67)Shaanxi 450.40
(94.31, 948.25)485.68
(97.52, 1,030.62)7.83
(−1.42, 13.88)408.71
(66.48, 901.24)442.12
(66.71, 971.99)8.17
(−1.28, 13.96)41.68
(12.93, 141.23)43.56
(13.18, 141.91)4.51
(−8.84, 22.01)Shandong 452.59
(94.50, 967.32)484.52
(94.74, 1,026.13)7.05
(−1.73, 13.03)410.73
(66.74, 909.14)441.10
(66.10, 973.12)7.39
(−1.87, 12.92)41.86
(13.12, 141.37)43.43
(12.82, 140.38)3.73
(−9.89, 20.87)Shanghai 517.63
(94.42, 1,118.25)542.86
(94.29, 1,176.54)4.87
(−2.36, 10.16)475.86
(67.20, 1069.61)499.66
(65.23, 1,115.32)5.00
(−2.86, 10.44)41.77
(13.13, 140.80)43.20
(12.77, 143.07)3.42
(−10.18, 16.33)Shanxi 449.08
(92.61, 954.11)484.70
(95.36, 1,024.86)7.93
(−0.17, 13.71)407.39
(64.56, 906.61)441.22
(67.06, 966.89)8.31
(−0.87, 14.07)41.69
(13.14, 141.59)43.48
(13.02, 139.93)4.27
(−11.09, 20.10)Sichuan 448.99
(93.82, 944.46)483.56
(94.91, 1,024.08)7.70
(−1.18, 13.41)407.36
(65.17, 903.37)440.31
(66.28, 963.85)8.09
(−1.60, 14.04)41.63
(12.99, 141.82)43.00.
(13.38, 142.99)3.90
(−10.03, 21.12)Tianjin 447.38
(94.13, 935.64)473.18
(96.21, 999.61)5.77
(−2.57, 11.25)405.46
(66.35, 888.41)430.18
(66.23, 937.67)6.10
(−2.78, 11.86)41.91
(13.20, 138.16)43.00
(13.30, 137.05)2.59
(−10.17, 17.96)Xizang 451.87
(92.18, 957.26)480.40
(94.79, 1,014.82)6.31
(−0.72, 11.88)410.46
(65.44, 901.62)437.34
(67.39, 944.66)6.55
(−1.29, 12.30)41.41
(13.05, 146.76)43.06
(13.15, 150.02)3.99
(−9.15, 18.96)Xinjiang 448.42
(93.66, 944.54)481.74
(94.61, 1,027.04)7.43
(−0.78, 12.88)406.80
(64.94, 894.08)438.38
(66.45, 955.92)7.76
(−1.53, 13.88)41.62
(12.80, 141.13)43.36
(13.06, 140.24)4.18
(−9.52, 19.84)Yunnan 449.17
(94.15, 941.70)481.11
(95.44, 1,016.65)7.11
(−2.15, 12.89)407.57
(64.95, 893.28)437.88
(65.99, 953.22)7.44
(−3.00, 13.53)41.60
(13.19, 142.71)43.24
(12.73, 142.27)3.93
(−10.22, 21.53)Zhejiang 450.35
(94.81, 950.98)481.07
(94.78, 1,024.70)6.82
(−1.85, 12.69)408.62
(67.40, 896.36)437.74
(66.97, 945.20)7.13
(−2.56, 13.27)41.74
(12.70, 139.14)43.33
(13.11, 138.46)3.82
(−8.86, 19.71)Note. Values in parentheses represent the uncertainty intervals. TTH, tension-type headache. Table 2. Age-standardized DALY rates (/100,000) for all headache disorders in China by province, 1990–2021
-
From 1990 to 2021, the age-standardized prevalence of all headache disorders and DALY rates in China showed an increasing trend. These rates were higher in women than in men, indicating a greater burden of headache disorders in women. Migraine accounted for a larger proportion of DALYs, while TTH had a greater impact on the headache disorders. The 40–44 and 30–39 age groups had the highest age-standardized DALY rates and prevalence of headache disorders, respectively. Two provinces (Heilongjiang and Shanghai) had the highest age-standardized DALY rates.
The Pain Branch of the Chinese Medical Association conducted an epidemiological survey, reporting the prevalence rates of all headache disorders, migraine, and TTH in China as 23.8%, 9.0%, and 10.8%, respectively. It estimated that nearly 200 million individuals aged 18–65 years experienced headaches in 2009[10]. Our study reported higher estimates, which may be attributed to several factors. First, the survey had a small sample size (5,041 respondents from 35 cities across China), and may not represent the nation, unlike the GBD, which comprehensively collated all data sources and systematically analyzed the burden using a well-recognized standardized method. Second, the different age groups used in these two studies are not directly comparable. Third, the survey data may suffer from recall and social susceptibility biases, thus underestimating the burden of headache disorders.
The burden of headache disorders in China increased between 1990 and 2021. Previous studies have shown that sedentary lifestyles, obesity, mental stress, increased use of electronic devices, and sleep deprivation contribute to an increase in the burden of headache disorders[11-14]. In addition to personal factors, external factors, such as air pollution, noise, side effects of medication, and social responsibilities, contribute to the increased burden of headache disorders[12]. Residents of economically developed regions, such as Shanghai, may experience elevated levels of mental stress, diminished sleep quality, heightened exposure to pollution, and a proclivity towards unhealthy lifestyles. In previous studies[15], a possible correlation has been demonstrated between the onset of migraine in cold regions and regions with air pollution. This may have contributed to the elevated age-standardized DALY rates of headache disorders in Heilongjiang Province, Northern China. The high prevalence of headache disorders in Chongqing and Guizhou may have been influenced by air humidity. A 26% increase in atmospheric humidity has been associated with a 28% increase in the onset of migraine[15]. A combination of risk factors, lifestyle habits, and the living environment may influence the varying burden of headache disorders across provinces.
The diagnosis and treatment of headache disorders are significant factors affecting their prevalence[16]. In China, the diagnostic rate of headache disorders is low. One study showed that the accurate diagnosis rate for patients with migraine was only 27.3%, and for patients with neuropathic headaches, it was 8.1%. Patients with mild symptoms are often reluctant to receive treatment. Only 16.5% of patients with migraine and 4.7% of patients with TTH received prophylactic treatment, with many seeking medical attention only after symptoms worsened[17,18]. This may have led to an underestimation of the actual disease burden in our study.
Migraine, a highly disabling neurological disorder, accounts for a substantial proportion of headache-related DALYs. Characterized by recurrent episodes or progression to chronic migraine, it often results in lifelong conditions with moderate-to-severe headaches and various neurological and systemic symptoms, including depression, high blood pressure, and stroke[19,20]. Migraine has numerous potential triggers, including alcohol and caffeine consumption, overexertion, and high stress[21]. In contrast, TTH is characterized by mild symptoms, typically involving mild or moderate headaches[22]. TTH can be managed effectively with adequate sleep, medication, and massage. However, a meta-analysis[23] indicated that, on average, 64% of patients with headaches had one or more comorbidities, potentially leading to increased treatment costs, greater financial burden, and reduced quality of life. This highlights the need for greater attention to headache disorders. It is recommended that future healthcare systems prioritize headache disorders to ensure the timely treatment and management of both the disorders and their comorbidities. Additionally, optimal clinical treatment and care strategies for migraine should be established to reduce the costs associated with headache disorders. It is crucial for the government to establish a comprehensive healthcare policy that protects the fundamental rights and interests of individuals affected by headache disorders. This will ensure access to effective treatment and facilitate the delivery of high-quality care.
This study found that age-standardized DALY rates for headache disorders were highest in middle-aged adults, consistent with previous research[6]. The prevalence rate of headache disorders increased in the younger age groups, peaked in the 40–44 age group, and then gradually declined. A recent study[24] indicated that the prevalence of migraine and TTH in children is increasing. Headache disorders were the second-largest contributor to DALYs in individuals aged 10–24 years. Adolescence-onset headache disorders often persist into adulthood, leading to chronic conditions affecting future development and overall health. The highest prevalence rate was observed in the 30–44 age group. Middle-aged adults constitute the primary driving force behind social development and face significant social and economic challenges. They are more susceptible to headaches because of anxiety and suboptimal mental health status. Furthermore, they are more likely to disregard the impact of headache disorders on their lives or persist in their occupational duties despite the illness, thereby exacerbating the risk of developing such disorders[5]. Women in the 30–44 age group, particularly those of childbearing age, showed higher susceptibility to headache disorders due to hormonal and physiological factors. This demographic also faces the dual pressures of career advancement and family responsibilities, which increase the risk of anxiety, depression, and other comorbidities. A previous study revealed a growing prevalence of migraine among women of childbearing age, with an estimated 12% increase by 2030[7]. This could contribute to the higher prevalence of headache disorders in people aged 30–44 compared with those in other age groups.
Our findings also revealed a greater burden of headache disorders in women compared with men. Most DALYs associated with headache disorders in women were attributed to migraine[3]. The prevalence of headache disorders is three times higher in women than in men[25]. These discrepancies may be attributed to physiological and structural differences. First, women’s brain is more susceptible to headaches than the men’s brain[26]. Second, sex hormones, influence migraine incidence, leading to longer recovery periods, and a higher likelihood of recurrence in women[7,26,27]. Estrogen is considered one of the most significant[28]. The prevalence of headache disorders in women increases after puberty, peaks during pregnancy, and continues through menopause, likely influenced by sex hormones[29]. It is crucial to address the burden of headache disorders in women and improve its diagnosis and treatment. Several headache centers and clinics have been established in China to provide targeted care to patients with headache disorders. Additionally, conferences and training courses on headache disorders have been held to raise awareness and improve the standard of care for patients with headaches to improve their quality of life.
This study has some limitations. First, as a descriptive study relying on GBD 2021 data, it is subject to the inherent limitations of the GBD. Second, the analysis did not consider urban-rural disparities in headache disorders. Finally, we were unable to explore the potential risk factors for headache disorders to explain the observed differences owing to data availability.
-
The burden of headache disorders in China is increasing. It is essential to increase the awareness of headache disorders among the general population, provide effective health education, and improve diagnosis and treatment, particularly in middle-aged working populations and women of childbearing age.
HTML
Data Source
Definition
Statistical Analysis
Competing Interests All the authors declare no conflict of interest.
Ethics The secondary data analysis was performed by using the publicly available and deidentified data without involving human subjects.

 Quick Links
 DownLoad: