


-
Chronotype is determined by circadian rhythms, influenced by polygenic variations and environmental factors. Typically, chronotypes are categorized into morning-, intermediate-, and evening-types[1]. Most cognitive functions follow daily and circadian rhythms, with the “synchronization effect” reflecting performance variations between optimal and non-optimal times based on an individual’s chronotype. Disruptions to this effect, such as sleep disturbance or circadian rhythm issues, can impair executive functions, including vigilance, attention, memory, response inhibition, and decision-making[2]. Gut microbial composition also varies according to the chronotype. Lachnospira, associated with butyrate synthesis, is a marker for nocturnal chronotypes, whereas Alistipes is more prevalent in morning type[3].
The gut–brain axis, a complex bidirectional system linking the gut and brain, plays a critical role in brain development, behavioral modulation, neuropsychiatric disorders, and neurodegenerative diseases, including Alzheimer’s disease (AD). The gut microbiota is crucial for behavioral deficits, microglial activation, and AD pathology. Colonization of microbiota from patients with AD in germ-free mice worsens pathology and is associated with cognitive dysfunction[4]. Emerging evidence suggests that gut microbiota dysbiosis can exacerbate neuroinflammation, amyloid-beta accumulation, and insulin resistance, all of which are critical factors in AD pathogenesis. Additionally, microbial metabolites, such as short-chain fatty acids influence brain health by regulating immune responses and neuronal functions[5].
Moreover, interactions between brain aging and gut microbiota affect sleep patterns, anxiety, and depressive disorders. However, the mechanism by which the gut–brain axis mediates the effect of sleep chronotypes on AD remains unclear.
Therefore, we leveraged Mendelian randomization (MR) studies with mediation typing using genome-wide association study (GWAS) data to mitigate bias and reverse causality, aiming to identify microbiota and brain phenotypes critical to the gut–brain axis’s effect on chronotype and AD risk.
This study adhered to the Strengthening the Reporting of Observational Studies in Epidemiology using Mendelian Randomization (STROBE-MR) guidelines (Supplementary Table S1).
Genetic associations with chronotypes were derived from the Neale lab analysis of UK Biobank phenotypes (round 1 UK Biobank — Neale lab). The study cohort comprised 301, 143 individuals of European ancestry. AD was selected as the outcome using genetic association data from a meta-analysis of GWAS, including cases (n = 111,326) and controls (n = 677,663) from the European Alzheimer & Dementia Biobank, Genomic Research Applied to AD, UK Biobank, and others. Genetic associations for gut microbiota abundance were obtained from a MiBioGen consortium meta-analysis of 18,340 participants (24 cohorts), including 13,266 individuals of European ancestry (https://mibiogen.gcc.rug.nl/). Genetic associations for brain imaging phenotypes were derived from a GWAS of 39,691 UK Biobank samples, comprising a discovery cohort (n = 22,138) and a replication cohort (n = 11,086) of unrelated British ancestry. This study analyzed 3,935 phenotypes across six MRI modalities: T1-weighted and T2-weighted fluid attenuation inversion recovery structural imaging, susceptibility-weighted magnetic resonance imaging, diffusion magnetic resonance imaging, task-functional magnetic resonance imaging, and resting-state functional magnetic resonance imaging. The details of the MRI modalities can be found in the UK Biobank Brain Imaging - Online Resources.
All the above data were stored in the IEU Open GWAS project (https://gwas.mrcieu.ac.uk/, Chronotype: ukb-a-11; AD: ebi-a-GCST90027158; Gut microbiota abundance: from ebi-a-GCST90016908 to ebi-a-GCST90017118; Brain Imaging Phenotype: from ubm-b-1 to ubm-b-999).
MR analyses were performed using R version 4.4.1, with the TwoSampleMR and MR-PRESSO packages, following the three-core instrumental variable (IV) assumptions for the main analysis (relevance, independence, and exclusion restrictions). Quality control steps were implemented to select the optimal IVs. For chronotype exposure, single nucleotide polymorphisms (SNPs) were selected as IVs with a strict criterion of P < 5.0 × 10⁻⁸. For gut microbiota IVs, the criterion was P < 1.0 × 10⁻⁵ to ensure sufficient SNPs. or brain imaging phenotypes, the initial criterion was P < 5.0 × 10⁻⁸, but when SNP counts were low, it was relaxed to P < 1.0 × 10⁻⁷, 1.0 × 10⁻⁶, or 1.0 × 10⁻⁵ to enhance statistical validity and avoid missing potential positive results. In the reverse MR analysis, AD IVs were selected using P < 5.0 × 10⁻⁸. To obtain site-independent IVs, a linkage disequilibrium (LD) threshold of R2 < 0.001 and a clustering distance of 10,000 kb were set in the 1,000 Genomes European reference panel. A two-sided statistical significance threshold of 0.05 were used. Genetic associations for exposure were harmonized with the outcome by aligning the same-effect alleles and removing palindromic variants with large allele frequencies. The Inverse Variance Weighting (IVW) method, widely used in MR analyses, provides robust causal effect estimates. We selected this approach to identify phenotypes with causal links in the candidate chain.
For key nodes that met the mediation effect definition and were identified using the coefficient product test, effect sizes from common MR methods (MR-Egger, weighted median, simple mode, and weighted mode) were included as references. The R2 of each SNP was estimated using the formula: $ {R}^{2}=2\times MAF\times \left(1-MAF\right)\times {\beta }^{2} $ and then summed up to assess the overall R2[6]. The F-statistics and power were calculated using: $ F=(N-2)\times \dfrac{{R}^{2}}{1-{R}^{2}} $. Additionally, when MAF or N data were missing, the F-value was determined using: $ F={\beta }^{2}/{se}^{2} $[7] (MAF: the minor allele frequency, β: the effect size of the SNP on exposure, se: the standard error, N: the sample size of the exposure GWAS dataset, k: the number of IVs.) Heterogeneity was evaluated using Cochran’s Q, Rucker’s Q, and I² tests. Horizontal pleiotropy was assessed using the MR Egger intercept test and MR-PRESSO Global Test[8].
First, MR was used to examine the association between genetically proxied chronotypes and AD risk. The genetically determined evening type was identified as a risk factor for AD (OR = 1.174 [1.015, 1.357], P = 0.031; Supplementary Table S2). Statistical heterogeneity was observed (Cochran's Q, P = 0.0006; Rucker’s Q, P = 0.0005). While the MR-PRESSO Global Test indicated horizontal pleiotropy (P = 0.002), no outliers were identified, and the MR-Egger intercept test did not support pleiotropic bias (P = 0.835). Reverse MR analysis revealed no effect of genetically determined AD on chronotypes.
Next, the associations between genetically proxied chronotypes and gut microbiota abundance or brain imaging phenotypes were analyzed, and their correlation with AD was assessed (Supplementary Table S3).
In 196 MR analyses, we initially established causal associations between sleep phenotypes and gut microbiota using the IVW approach. Genetically determined chronotype was associated with several microbial taxa, including Melainabacteria, family Prevotellaceae, Allisonella, Butyricicoccus, Erysipelotrichaceae UCG003, Intestinimonas, Lachnospiraceae, Ruminococcaceae UCG013, Ruminococcus gnavus, and order Gastranaerophilales. However, due to horizontal pleiotropy, significance was lost for the class Melainabacteria and the order Gastranaerophilales (Supplementary Figure S1, Supplementary Table S3). We identified 260 brain imaging phenotypes with nominal causal relationships with chronotypes across 3,935 MR analyses after filtering for horizontal pleiotropy and reverse MR positivity (Supplementary Figure S2, Supplementary Table S3). Potential mediators included diffusion tensor imaging indices, intracellular volume fractions, functional MRI connectivity edges, and brain region volumes.
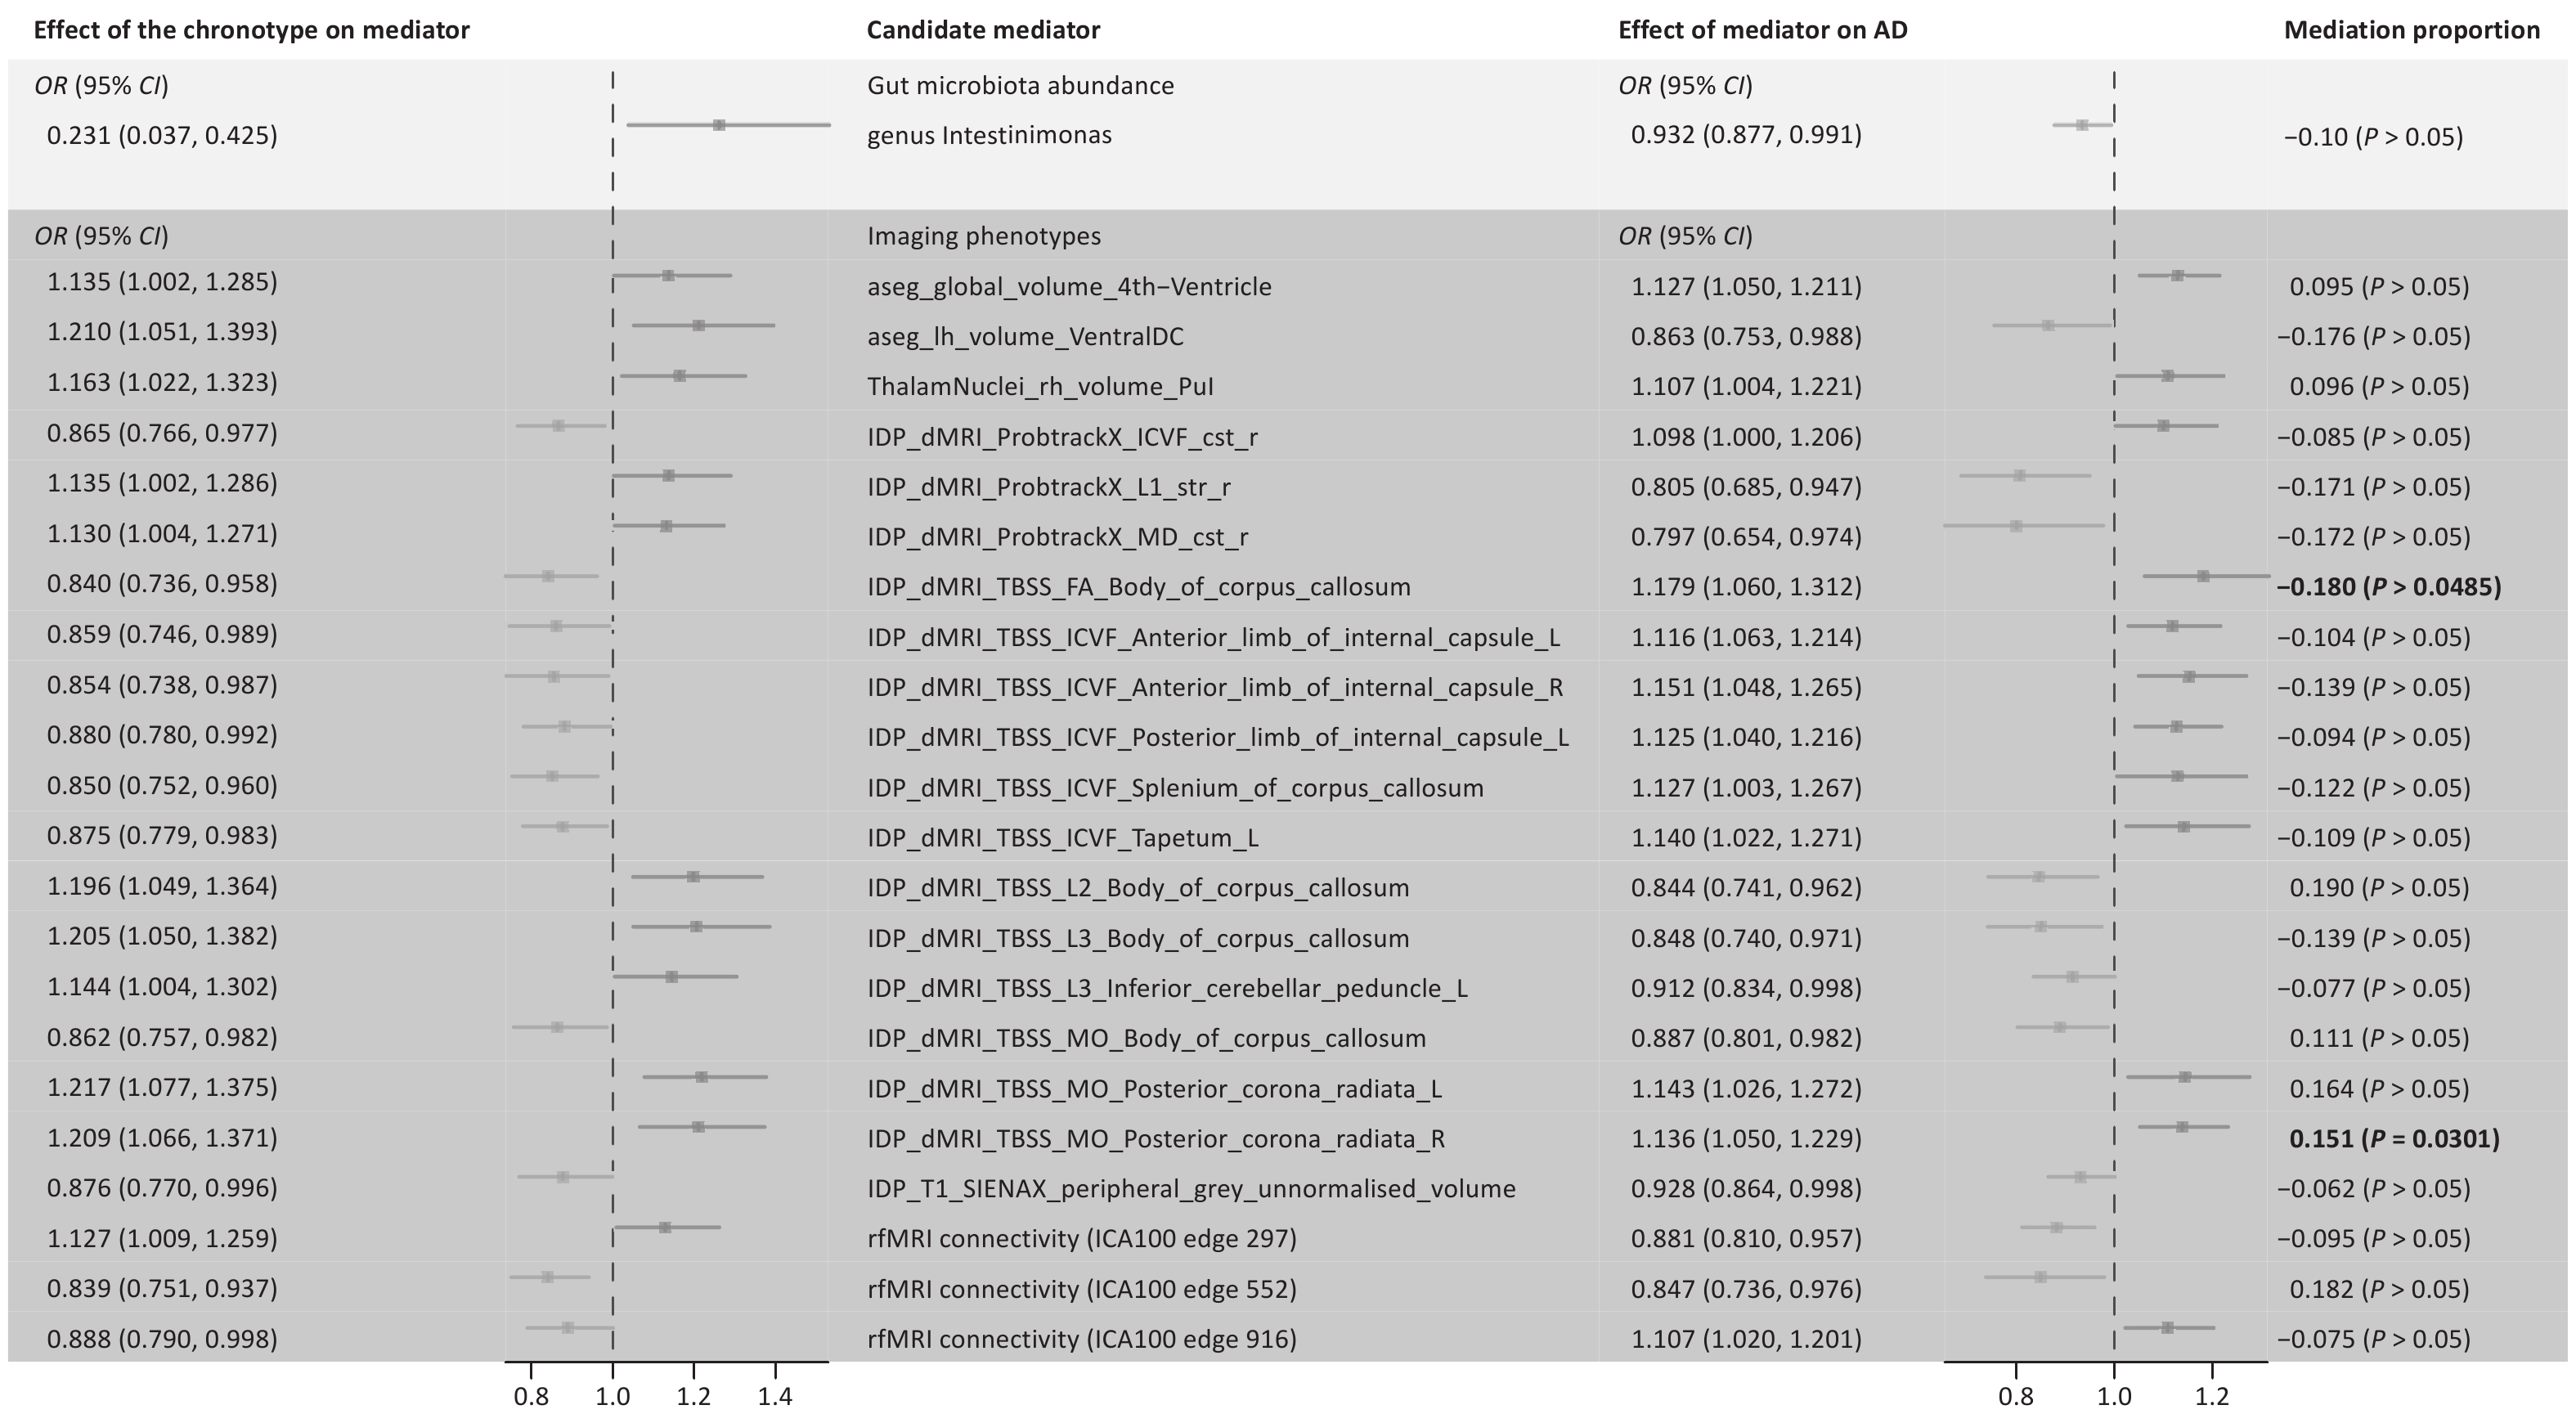
Among the identified gut microbiota and brain imaging phenotypes, only the genus Intestinimonas and 22 brain imaging phenotypes exhibited unidirectional causal links with AD (Figure 1, Supplementary Table S3). Finally, we calculated the proportions of mediating effects and performed product tests for these 23 phenotypes. Our analysis revealed incomplete mediation of the chronotype-AD association by fractional anisotropy (FA) in the body of the corpus callosum and mode of anisotropy (MO) in the right corona radiata (> 10%). FA reflects white matter integrity, whereas MO shape differences are orthogonal to FA. Particularly, the evening-type increased AD risk by reducing the white matter integrity of the right posterior corona radiata. Conversely, reduced white matter integrity in the corpus callosum appears to attenuate the increased AD risk associated with late sleep, suggesting complex compensation. Chronotypes affect AD through mechanisms beyond direct brain changes or gut microbiota. Given the popularity of the brain-gut axis theory, further analyses are required.
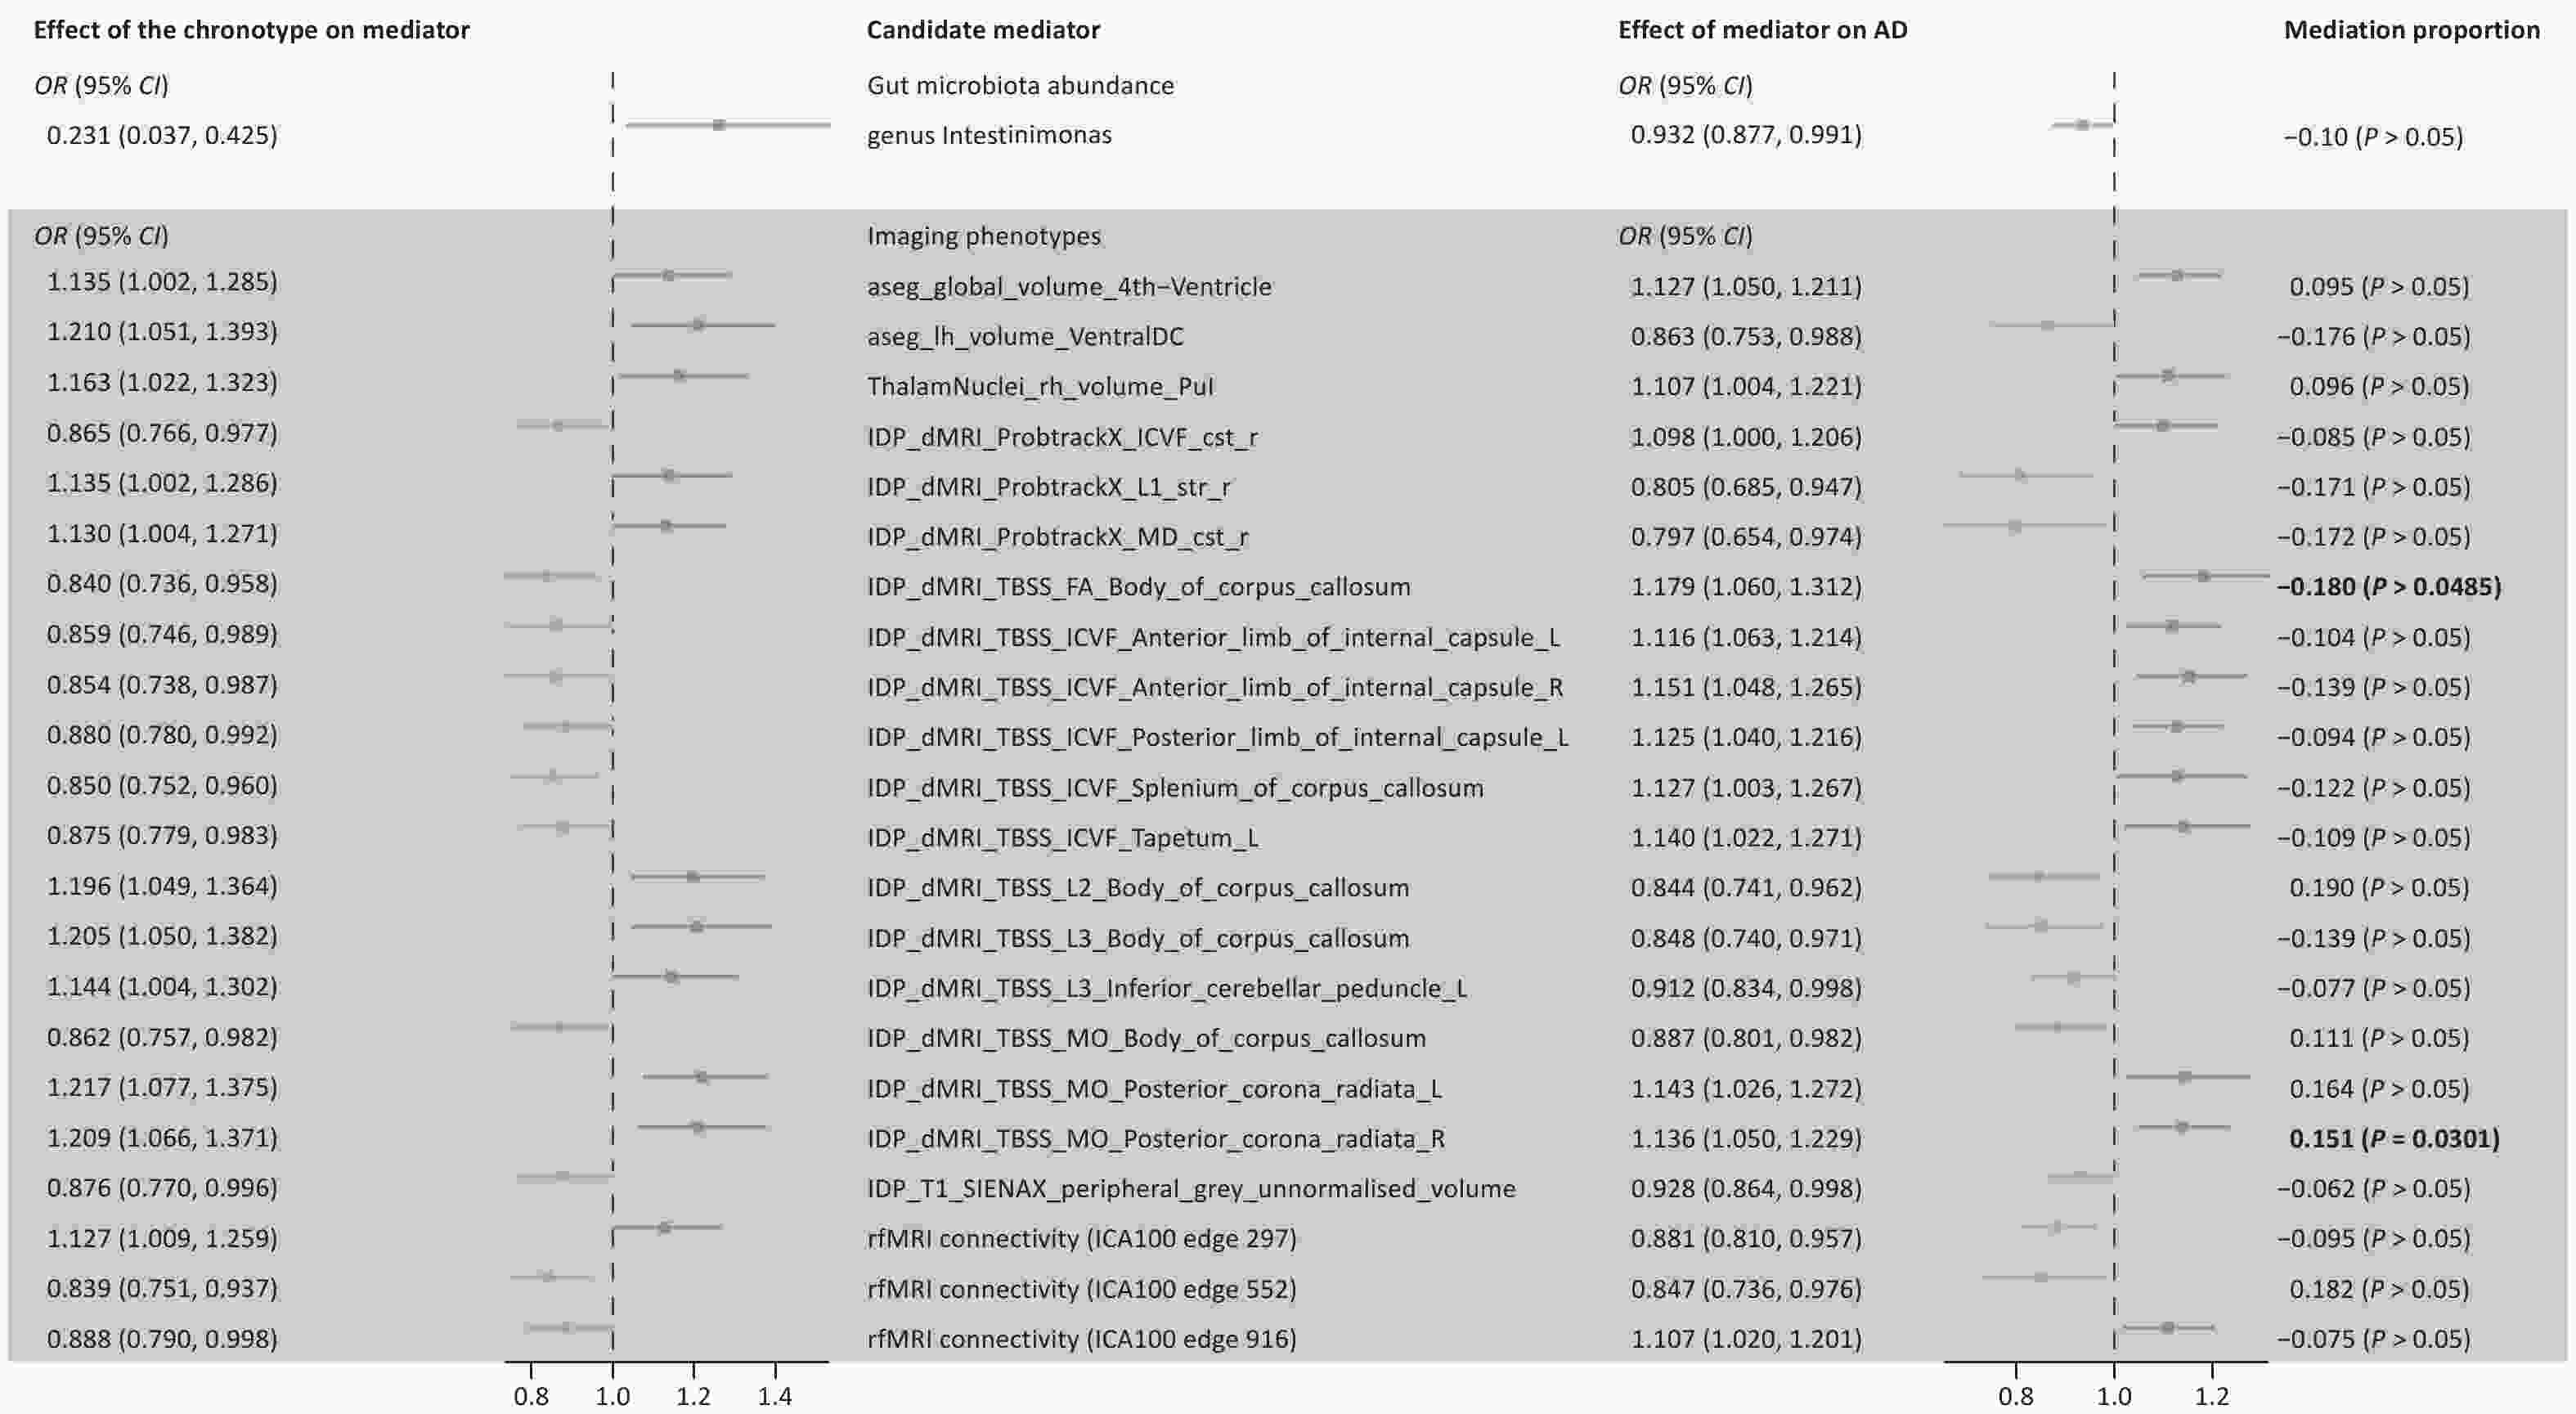
Figure 1. Results of screening gut microbiota and brain imaging phenotypes as candidate mediators. Candidate mediators meet the following requirements: 1. chronotype should be causally associated with the mediator, but not vice versa; 2. the candidate mediator should be causally associated with AD; 3. the results should be robust, Two-sample MR analysis was performed by testing for horizontal pleiotropy, and mediating effects by product testing. FA, fractional anisotropy; L1, L2, L3, three eigenvalues of FA; MD, mean diffusivity; MO, diffusion tensor mode; ICVF, intra-cellular volume fraction; ICA, Independent Component Analysis; Pul, pulvinar; VentralDC, ventral diencephalon.
Given that screening the gut or brain independently as mediators yielded unsatisfactory results, we further investigated nodes that function as mediators within the four-step mechanistic pathway: sleep-chronotype–gut–brain–AD. We performed MR Analysis of 3,935 brain imaging phenotypes and identified 268 potential genetically determined risk factors for AD (Supplementary Figure S3, Supplementary Table S3).
We analyzed eight gut microbiota influenced by chronotype (Supplementary Figure S1) and performed separate batch MR analyses for each, targeting 268 brain-imaging phenotypes. The Genus Erysipelotrichaceae UCG003 was excluded because of insufficient IVs for IVW.
The results revealed that gut–brain axis mediators primarily affect memory circuits within the inner and outer hippocampus, emotional and cognitive brain regions, and key fiber conduction tracts (Figure 2).
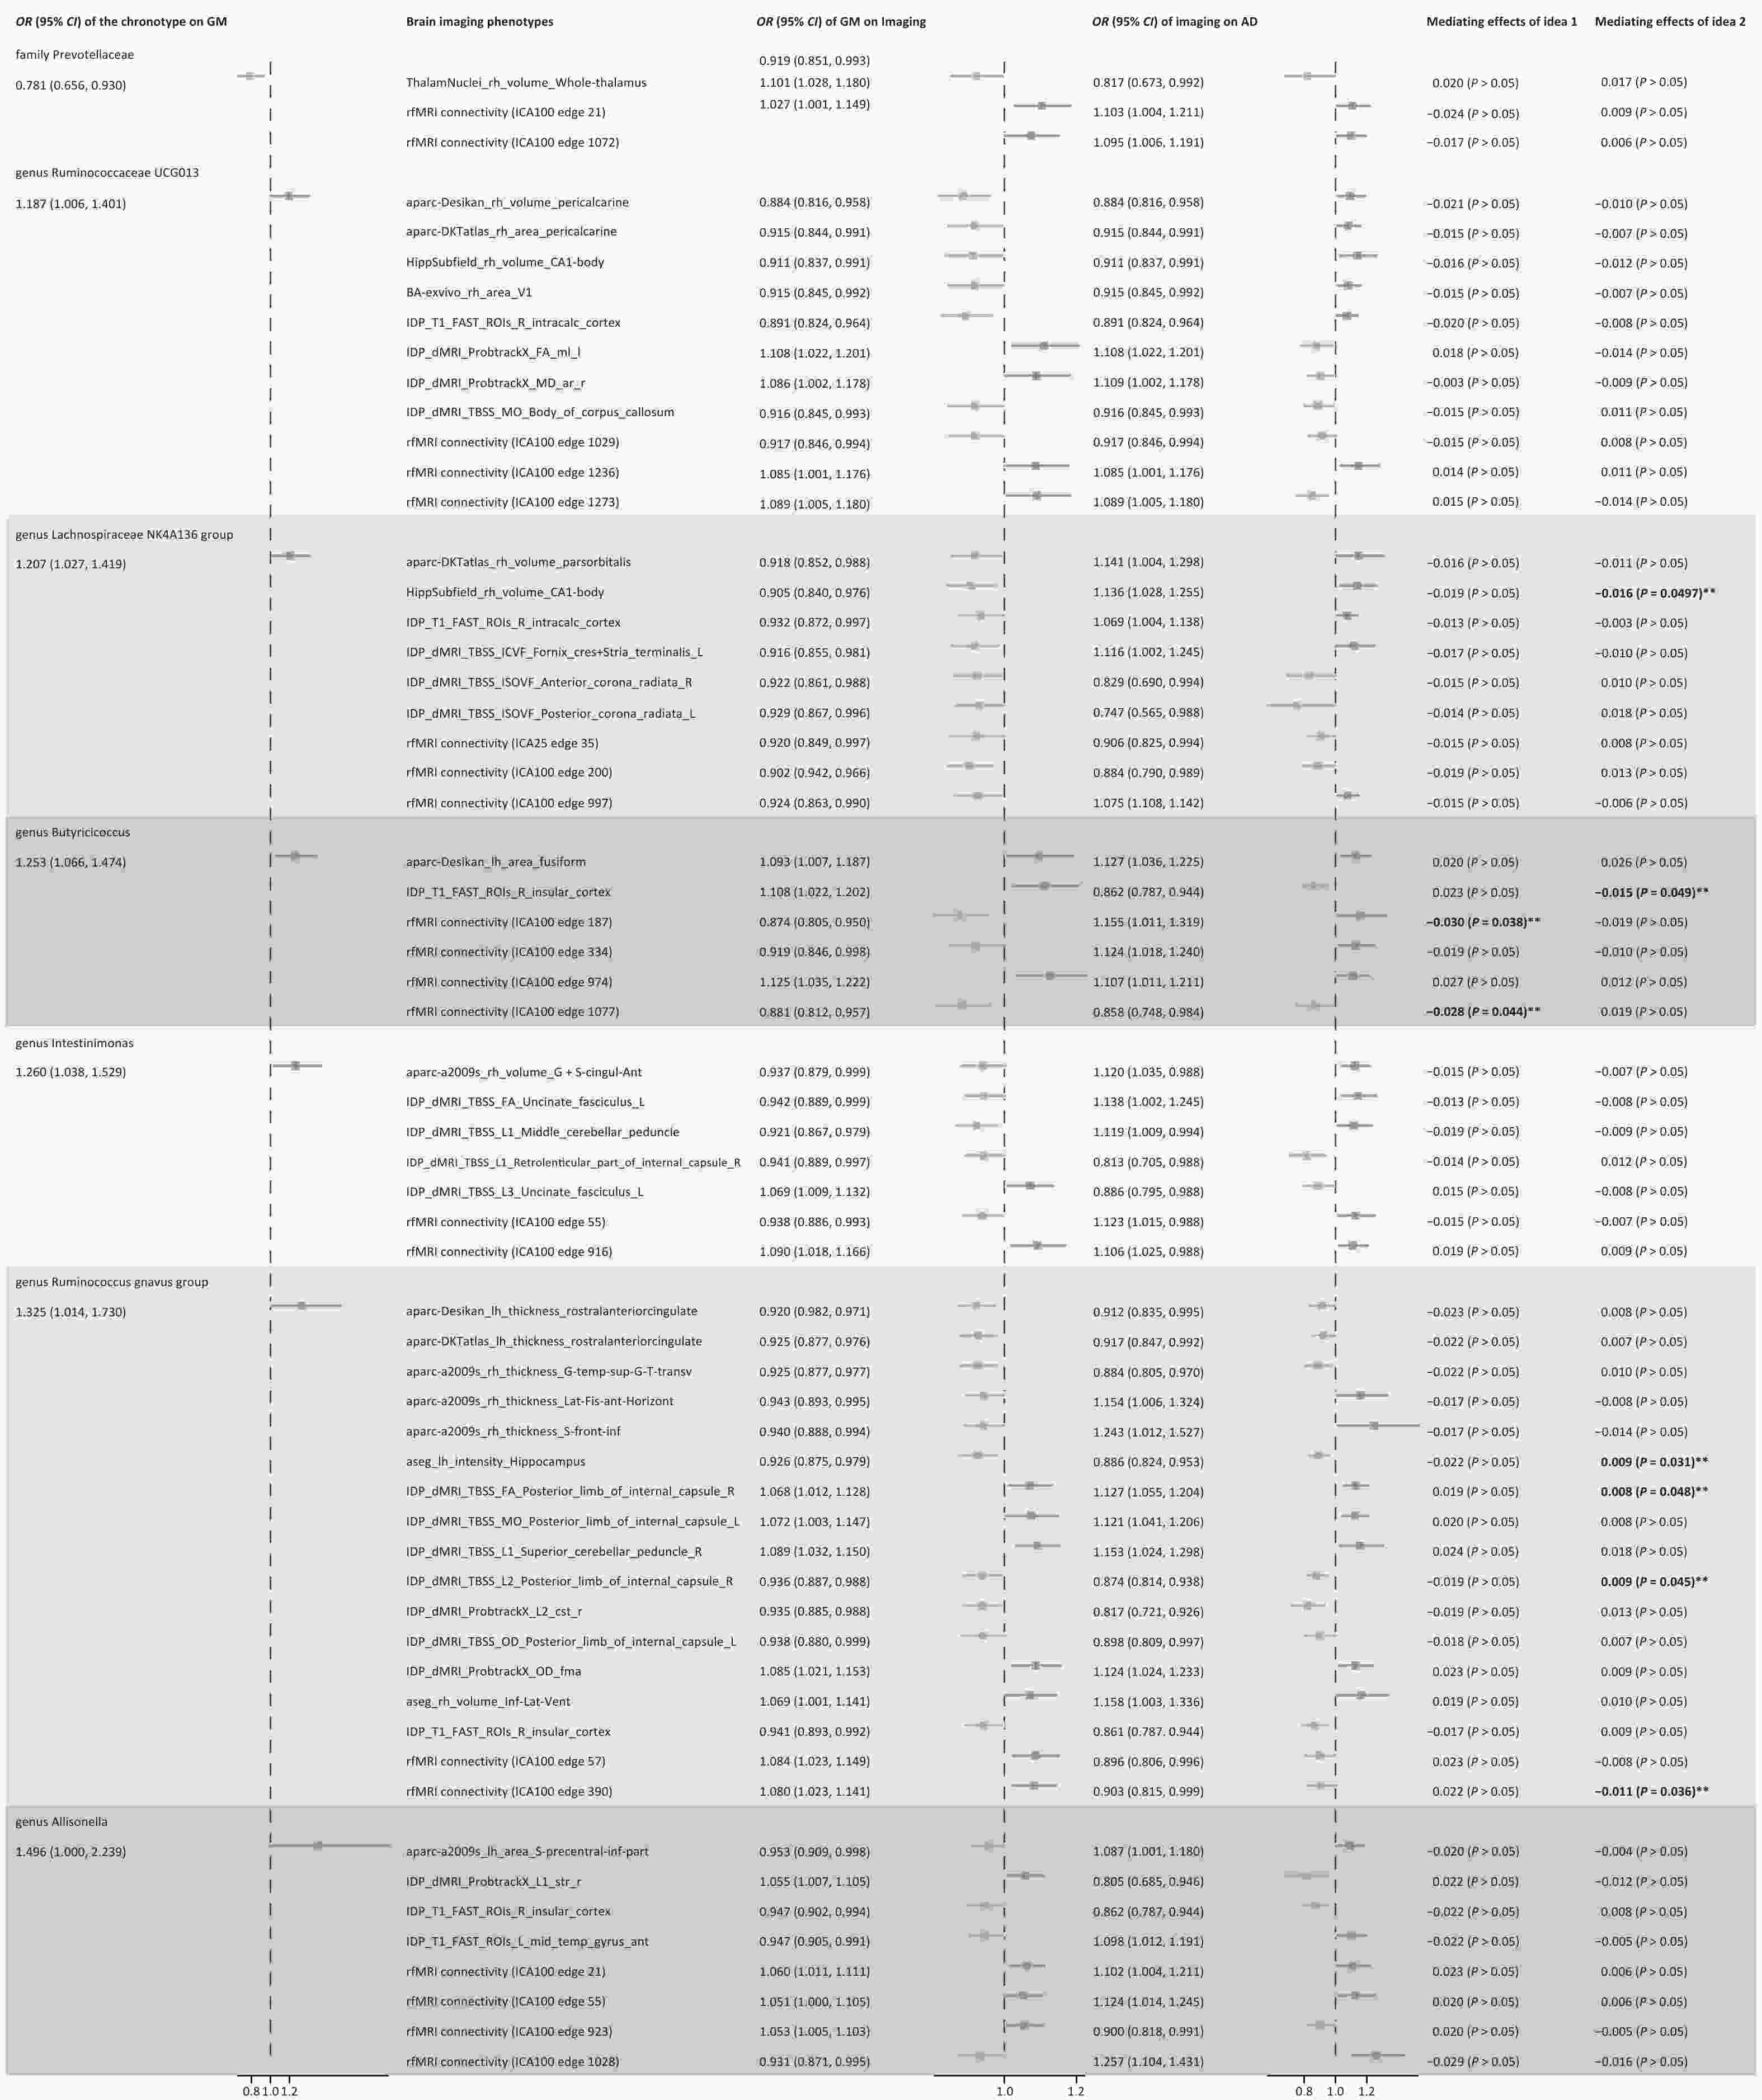
Figure 2. Potential causal relationship and mediating effect of the process of chronotype-gut microbiota abundance-imaging phenotype-AD. Mediating effects of idea 1: The gut microbiota as mediator, chronotype as exposure, brain imaging phenotype that potentially affected the risk of AD as outcome. Mediating effects of idea 2: Brain imaging phenotype as mediator, gut microbiota influenced by sleep chronotype as exposure, and AD as outcome. **Complete mediation, there is no genetically determined causal relationship between exposure and outcome.
Rather than attributing the findings to masking effects, we examined each mediation mechanism chain individually. Idea 1 suggests that Butyricicoccus abundance increased in the evening-type, fully mediating the absence of a direct chronotype-rfMRI link (rfMRI connectivity ICA100 edge 187 and edge 1,077). Idea 2 identified that the right insular cortex gray matter volume was similarly mediated, increasing with Butyricicoccus and lowering AD risk. The results of Idea 2 demonstrated that as the abundance of the Lachnospiraceae NK4A136 group increased, the right hippocampal CA1 volume decreased; however, AD risk was reduced, contradicting the theory of hippocampal atrophy affecting cognition and needing exclusion.
Our previous work, combined with other studies, indicates that the gut microbiome exacerbates cognitive impairment caused by chronic sleep deprivation[9]. Therefore, the chronotype–gut microbiota–brain–AD pathway warrants further investigation. Currently, five gut–brain communication pathways have been identified: the gut–brain neural network, intestinal immune system, neuroendocrine hypothalamic–pituitary–adrenal axis, neurotransmitters and neuromodulators synthesized by intestinal bacteria, and barrier pathways such as the intestinal mucosal barrier and blood–brain barrier[10]. These pathways are interconnected and influence one another
The key brain regions we identified appeared to be associated with poor cognitive performance. Although the corona radiata and internal capsule are most susceptible to microvascular injury, their microstructural integrity is believed to be related to cognitive function. Patients with AD exhibit reduced integrity in the corona radiata, internal capsule, and insular white matter. The anterior insula is highly susceptible to pathological aggregation and contains a range of pathological protein deposits. Our findings of ICA sites suggest an accelerated decline in brain connectivity and network integrity in AD, with the default mode network being the most affected. We causally linked these phenotypes to AD or sleep, thereby establishing a chain of causal mechanisms.
Beyond the key loci identified through mediation analysis, MR identified genetically causal but non-significant mediators distributed across hippocampal-thalamic memory-attention circuits, higher-order cortices, and interhemispheric fiber connections, suggesting that chronotype influences AD risk through brain phenotype remodeling.
This study leveraged MR and mediation analyses, but has limitations. The multifactorial nature of AD implies that MR results are influenced by environmental and behavioral factors, complicating SNP-confounding relationships. Confounders may obstruct mediation measurement, necessitating clinical or experimental validation of mediators that fail product tests. Replication across cohorts increased the risk of weak instruments and pleiotropic bias, although no outliers were detected. Unexplained negative mediating effects require real-world explanations to enhance credibility.
Preliminary findings highlight the gut–brain axis's role in chronotype-AD interactions via three pathways (Supplementary Figure S4): (1) chronotype directly increases AD risk by reducing white matter integrity in the right posterior corona radiata; (2) Butyricicoccus abundance fully mediates chronotype-induced rfMRI connectivity changes, differentially affecting AD risk; (3) Chronotype-altered microbiota (Butyricicoccus and Ruminococcus gnavus) influence AD risk by modifying structural and functional connectivity of specific brain regions. Furthermore, gut microbiota intervention studies in animal models, transgenic mouse MRI, and in vitro experiments co-culture experiments with gut microbiota and neuronal cells are feasible approaches.
Role of the Gut–Brain Axis in Chronotype-Driven Alzheimer’s Disease: A Mendelian Randomization Study
doi: 10.3967/bes2025.033
- Received Date: 2024-10-31
- Accepted Date: 2025-03-10
All authors report no conflict of interest.
For the publicly available data used in this study, the original research had already received the necessary ethical approval; therefore, additional ethical review was not needed.
&These authors contributed equally to this work.
| Citation: | Jingting Kong, Mengxue Wang, Xuezi Zhang, Zan Wang, Qingguo Ren. Role of the Gut–Brain Axis in Chronotype-Driven Alzheimer’s Disease: A Mendelian Randomization Study[J]. Biomedical and Environmental Sciences, 2025, 38(4): 519-524. doi: 10.3967/bes2025.033

|

 Quick Links
 DownLoad:
