

-
Lung cancer, the leading cause of cancer deaths worldwide and in China, has a 19.7% five-year survival rate due to terminal-stage diagnosis[1-3]. Although low-dose computed tomography (CT) screening can reduce mortality, high false positive rates can create economic and psychological burdens. Applying the model-based approach as the first stage in early detection to evaluate the probability of developing lung cancer within a 5-year period can improve the performance of discriminatory ability[4].
Recently, various lung cancer risk prediction models based on different populations have been developed, among which classical models such as the Mayo Clinic Model[5] and the Liverpool Lung Project (LLP) model[4] have demonstrated solid predictive efficiency. Lung cancer risk prediction models are typically established for patients with pulmonary nodules or for those undergoing low-dose CT. These models possess good discriminatory capacity but frequently consider few factors and rely on small sample sizes[4,5]. However, models based on combined factors, such as CT, medication information, and medical history, to predict lung cancer risk in high-risk populations are less well established, and few studies have used machine learning models. The development of a combined model based on CT imaging indices, medication information, and medical history may provide a reliable estimate of lung cancer risk in high-risk populations.
We conducted a retrospective study in the real world by collecting the registration information of all permanent residents from the residents’ health files of the CHinese Electronic health Records Research in Yinzhou (CHERRY) from 2006 to 2016. Least absolute shrinkage and selection operator (LASSO) regression was used for feature selection. Four machine learning (ML) algorithms were used to construct a prediction model for potentially high-risk populations (Supplementary Table S1). The difference in model performance was evaluated using the area under the curve (AUC), decision curve analysis (DCA), and calibration curves for both the training and validation cohorts. The optimal features for model development were explained by Shapley additive exPlanations (SHAP) values (Additional file 1: Methods).
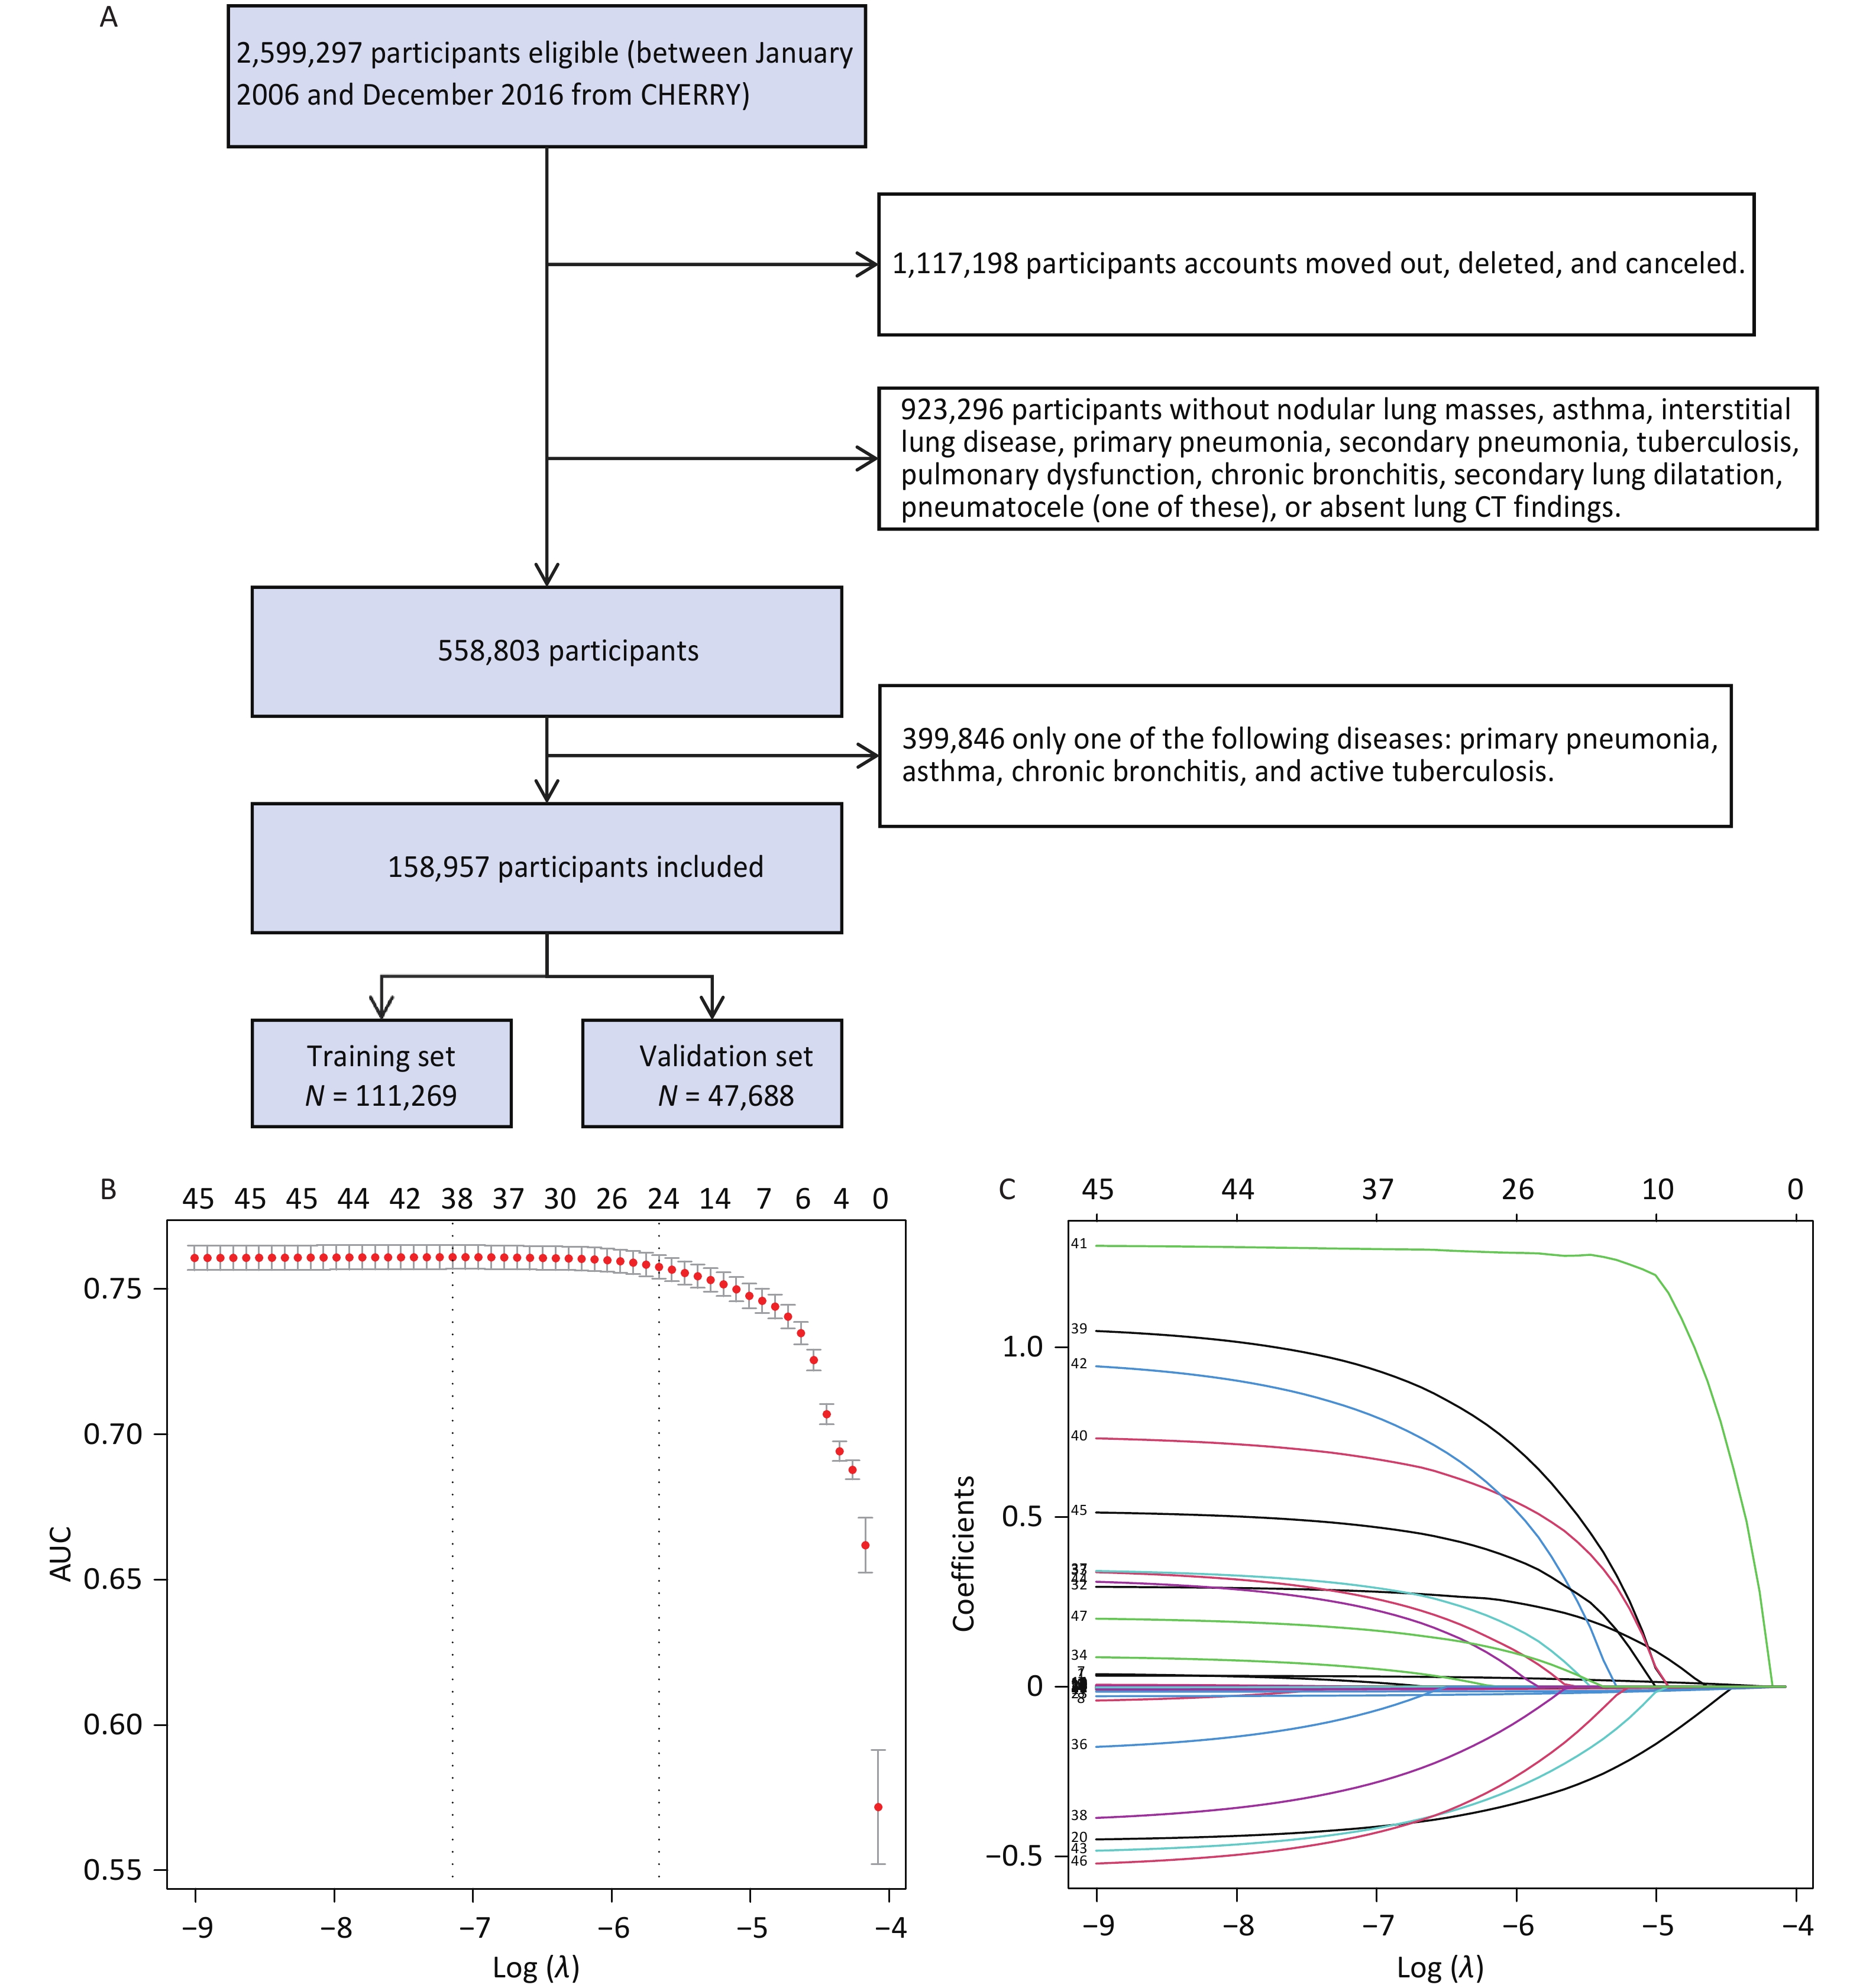
Based on the inclusion and exclusion criteria, 158,957 individuals were enrolled in the follow-up study (Figure 1A), among whom 7,680 patients with lung cancer were identified. Basic information about the individuals is shown in Supplementary Table S2. Characteristics of the training and validation cohorts were similar (Supplementary Table S3). Through univariate logistic analysis, 45 potentially relevant feature characteristics were considered for inclusion in the LASSO regression. A total of 24 variables were identified by analyzing 111,269 patients in the training cohort using the LASSO regression (Figure 1B, C, Supplementary Table S4). After adjusting for potential confounders (Supplementary Table S5), space-occupying lesions (odd ratio [OR]: 3.886; 95% confidence interval [CI]: 3.085–4.895), spiculated lesions (OR, 2.931; 95% CI, 2.047–4.199), lobulation (OR, 2.209; 95% CI, 1.417–3.445), and bronchial stenosis (OR, 2.725; 95% CI, 1.870–3.970) were observed to be associated with a higher risk of lung cancer.
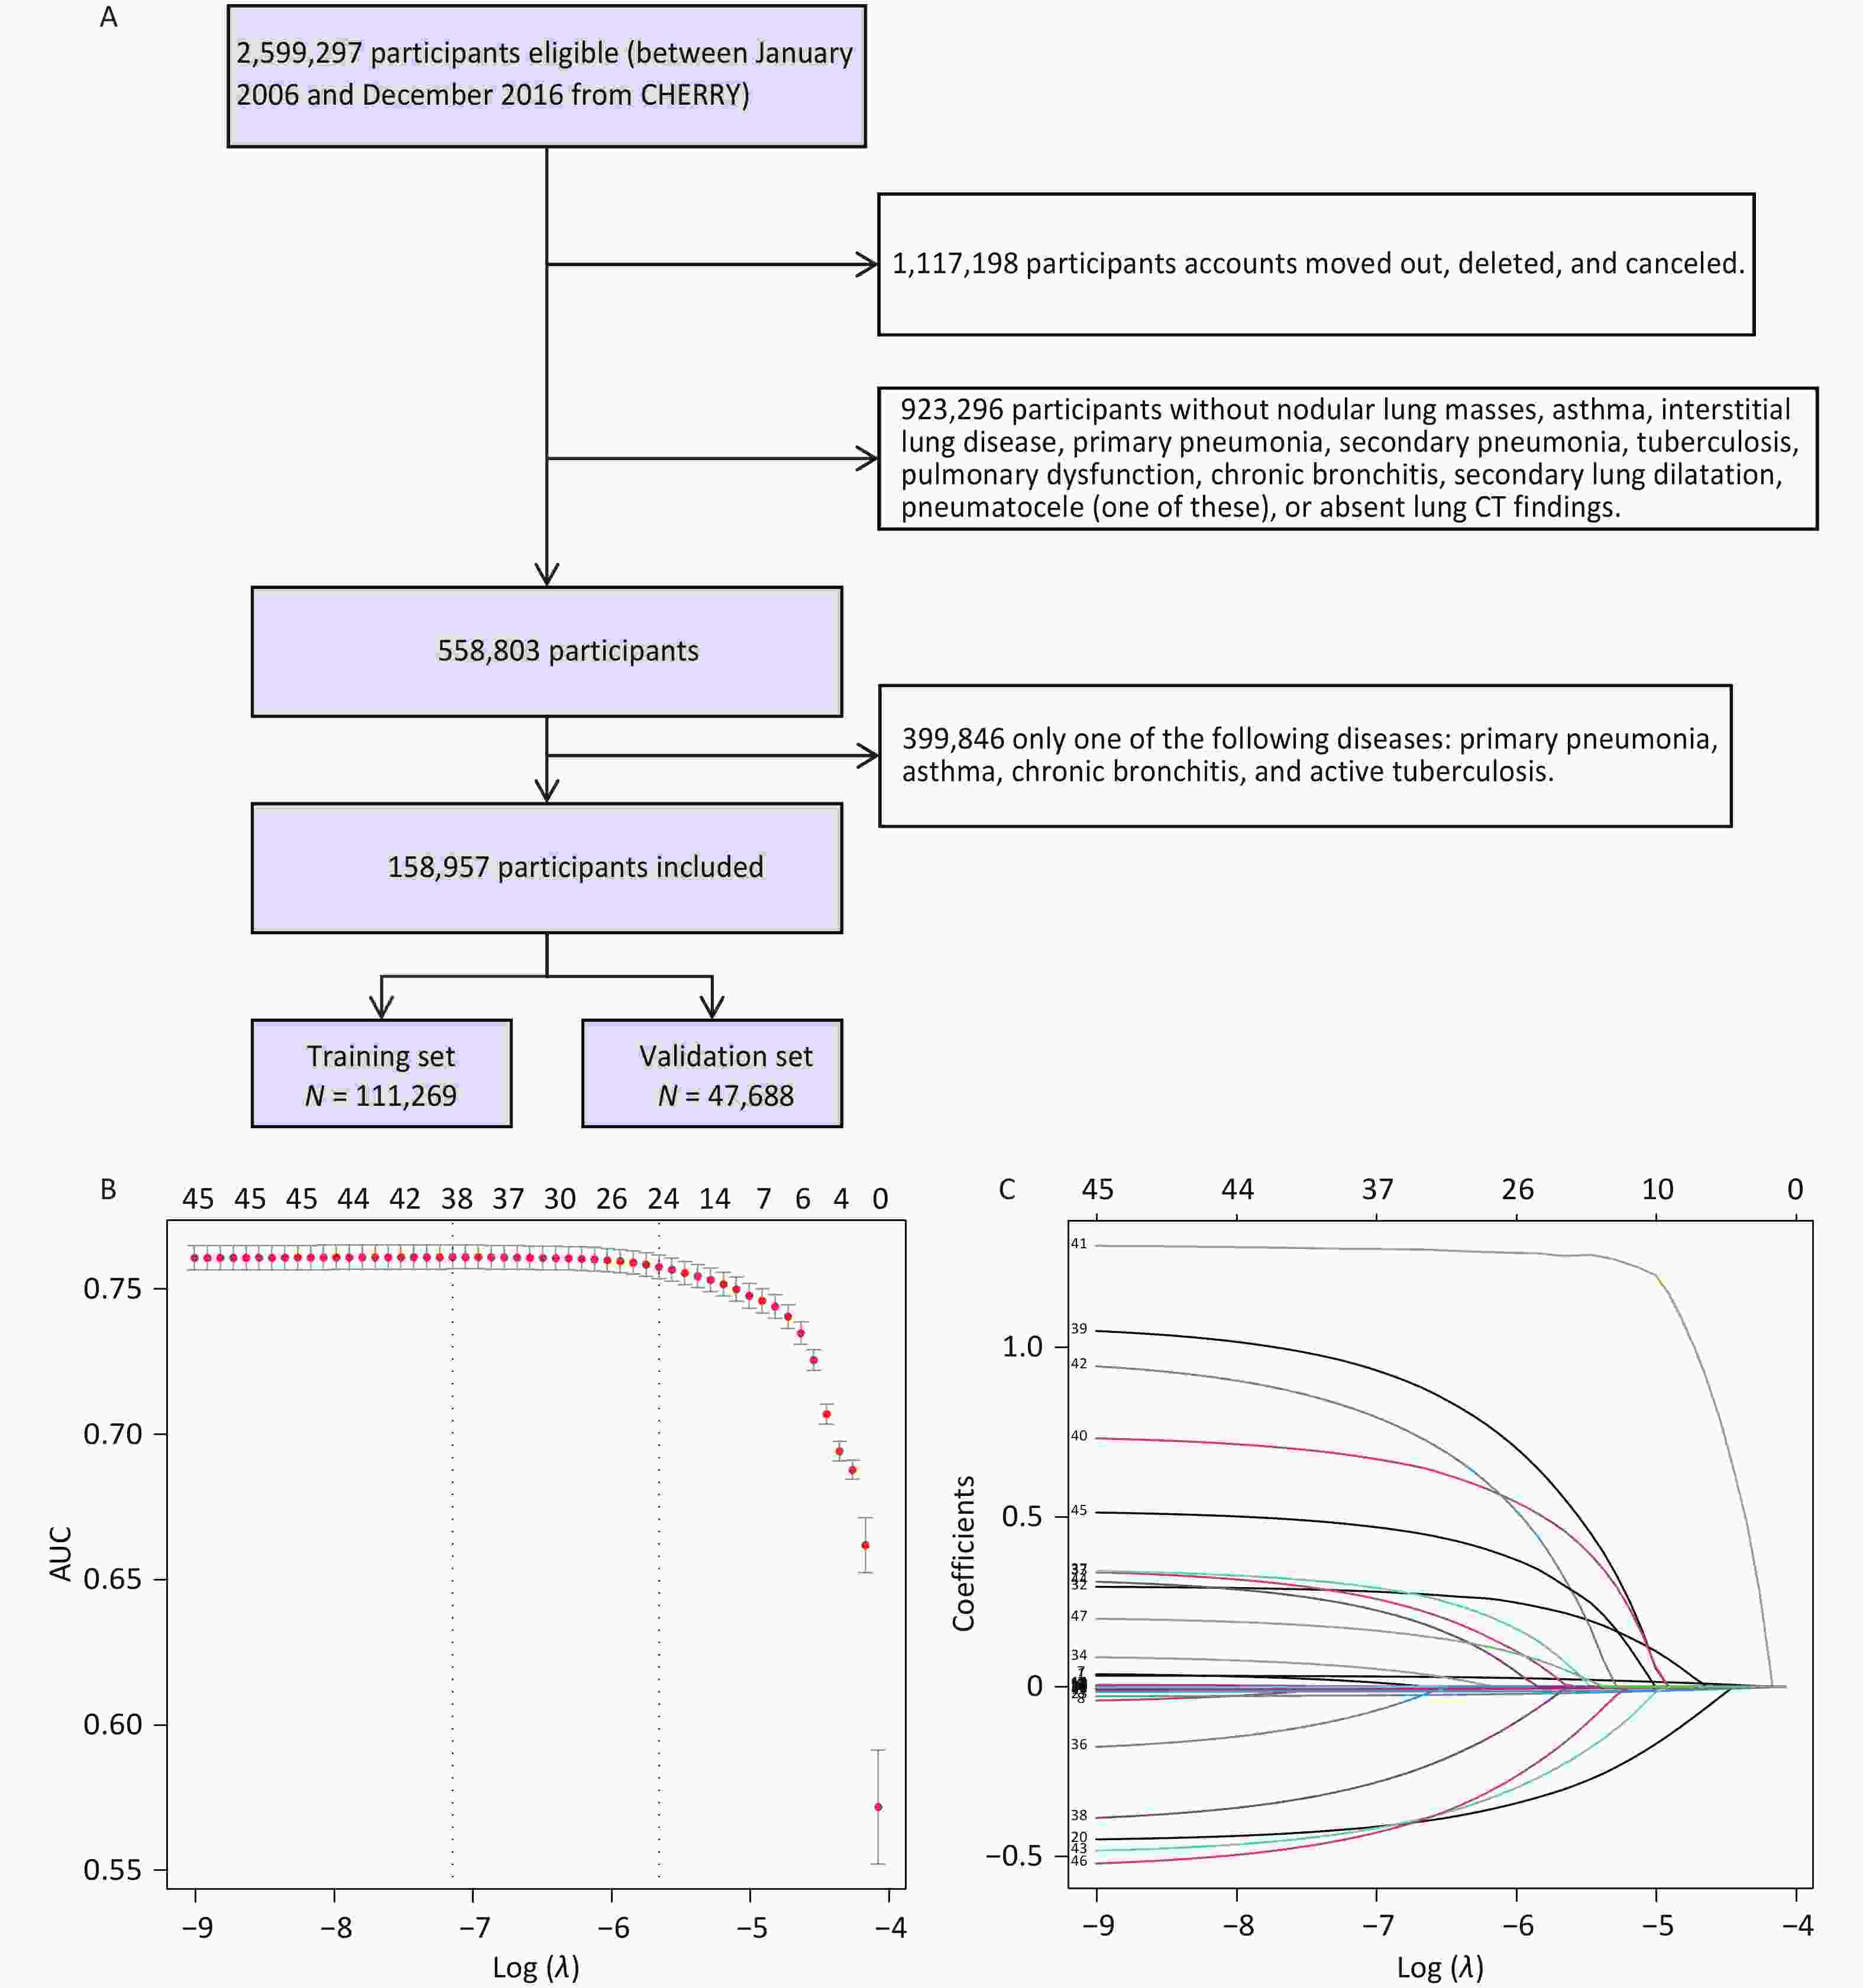
Figure 1. (A) Flow chart of the study population. Predictor selection using the LASSO regression analysis with ten-fold cross-validation. (B) Tuning parameter (lambda) selection of deviance in the LASSO regression based on the minimum criteria (left dotted line) and the 1-SE criteria (right dotted line). (C) Coefficient profile plot was created against the log (lambda) sequence. In the current study, the predictor’s selection was according to the 1-SE criteria (the right dotted line where non-zero coefficients were selected. LASSO, least absolute shrinkage and selection operator; SE, standard error.
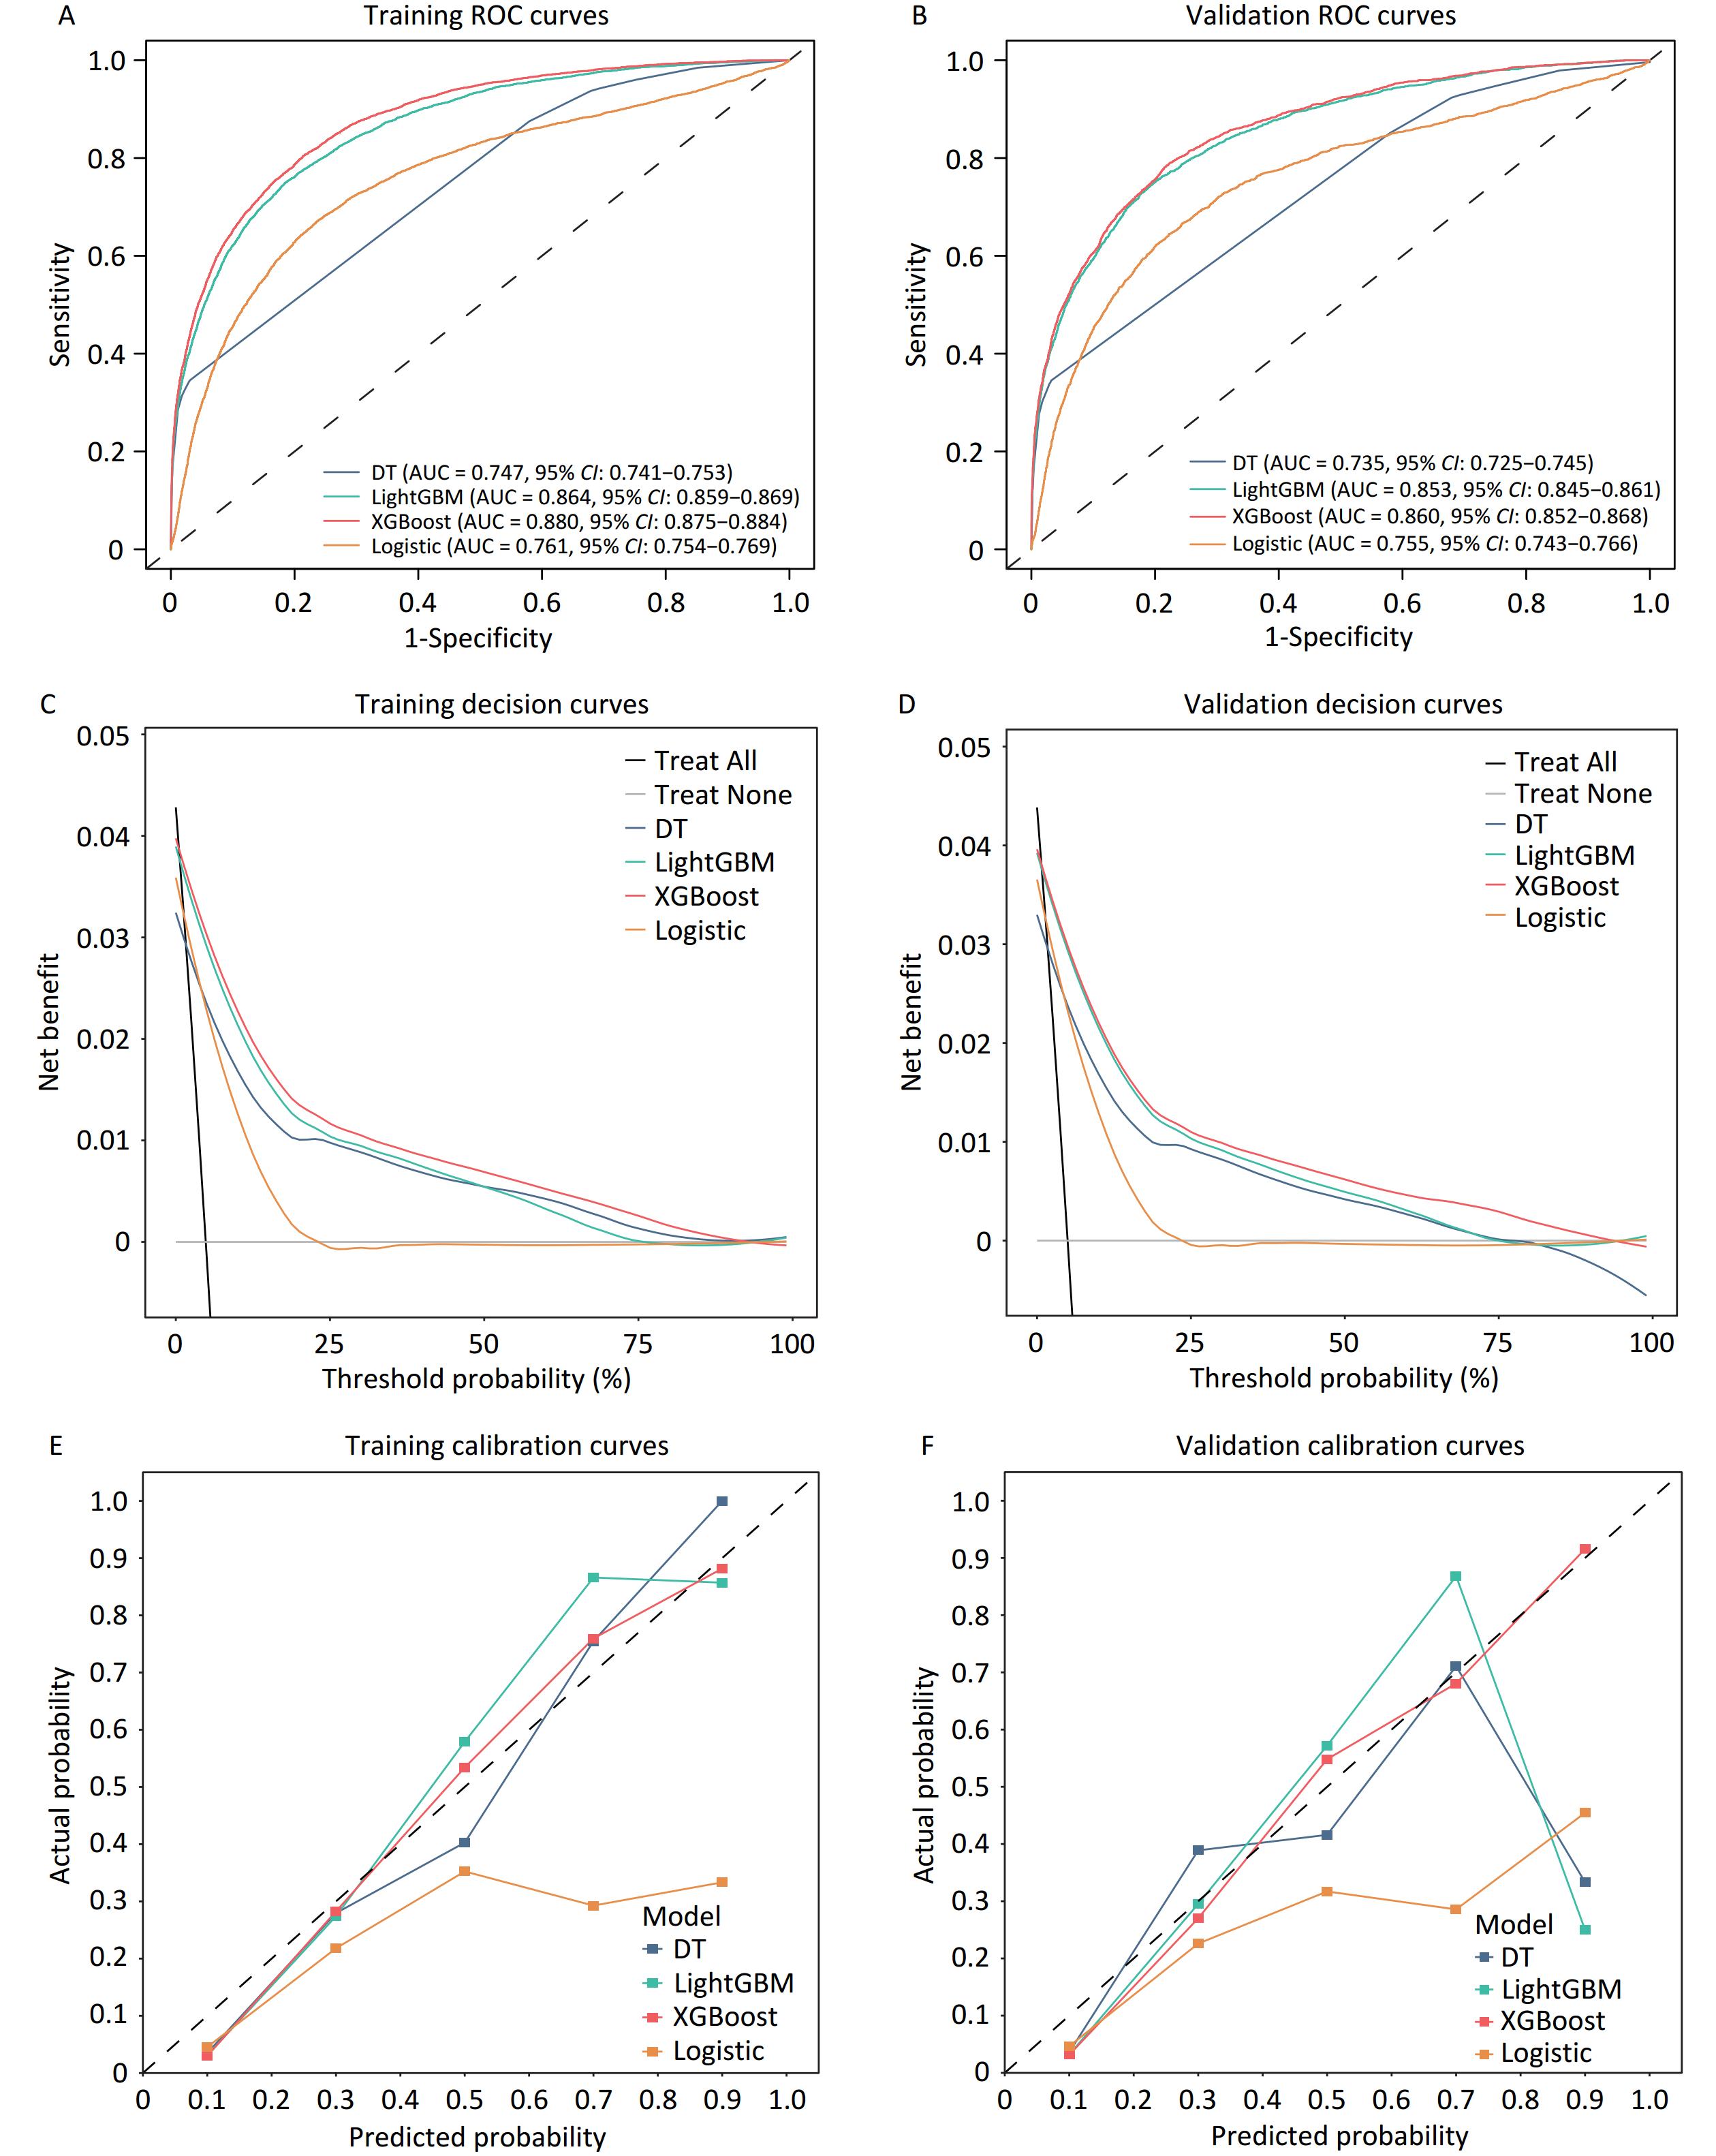
Four models were constructed to identify lung cancer risk in high-risk populations. Receiver operating characteristic (ROC) curve analyses revealed that the performance of the models in both the training and validation cohorts showed good predictive value, with the XGBoost model exhibiting the best performance (Figure 2A, B). The AUC value (XGBoost model) of the training cohort and validation cohort was 0.880 (95% CI, 0.875–0.884) (Figure 2A) and 0.860 (95% CI, 0.852–0.868), respectively, outperforming the other algorithms (Figure 2B). The remaining models showed significant predictive performance in the training cohort, ranked as follows: LightGBM (AUC = 0.864, 95% CI: 0.859–0.869), Logistic Regression (AUC = 0.761, 95% CI: 0.754–0.769), and Decision Tree (AUC = 0.747, 95% CI: 0.741–0.753). Supplementary Table S6 lists the detailed performance metrics of the four models. The XGBoost model demonstrated the highest sensitivity (0.808 and 0.790, respectively) among all the models evaluated in the training and validation datasets.
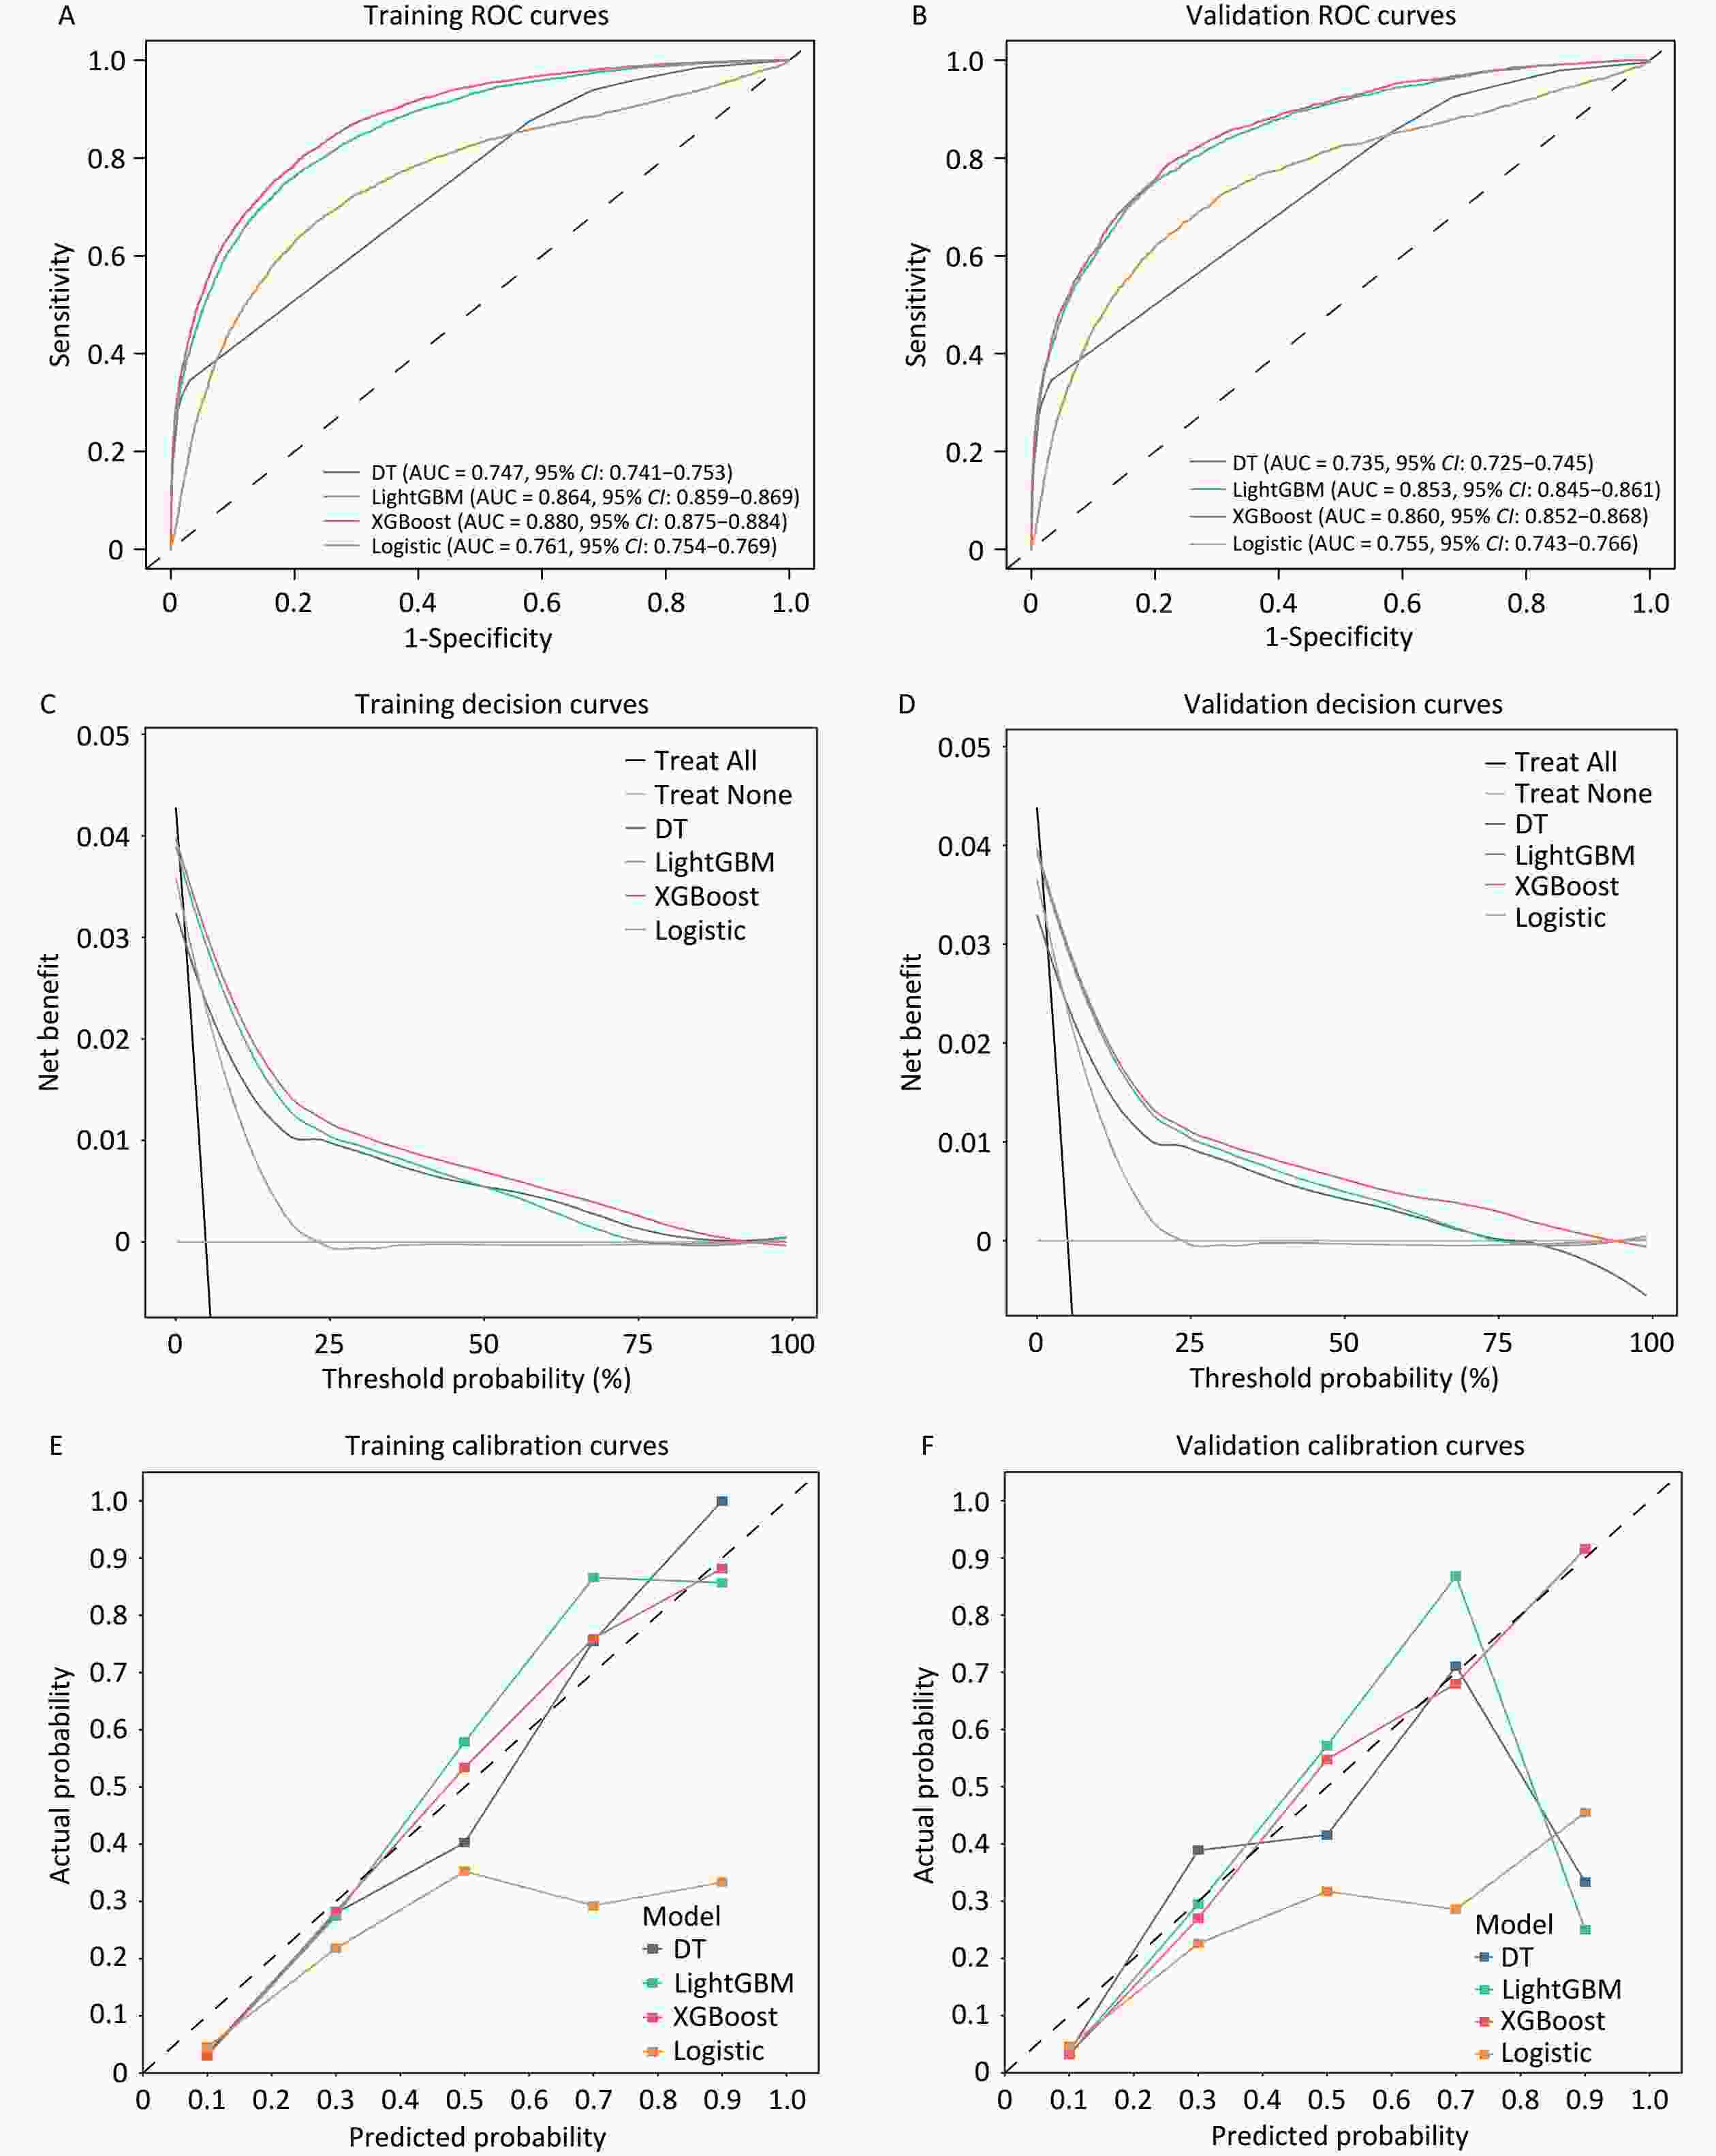
Figure 2. Receiver operating characteristic curve analysis for the training cohort (A) and validation cohort (B). Net benefits of the optimal discriminative model using decision curve analysis in C (Training cohort) and D (Validation cohort). Evaluating the diagnostic performance of the optimal discriminative model through calibration curves in E (Training cohort) and F (Validation cohort). AUC, the area under the curve.
The decision curves of the four models were constructed in our study (Figure 2C and 2D). The y-axis of the decision curve represents the net benefit, which is a decision-analytic measure used to judge whether clinical decisions have more benefits than harm. Each point on the x-axis represents the threshold probability differentiating patients with and without lung cancer. In both the training and validation cohorts, DCA for the XGBoost and logistic regression models demonstrated consistent net benefits across a range of threshold probabilities. The decision curve of XGBoost was greater than those of the other algorithms because the net benefit of XGBoost was observed to be higher for most thresholds than those of the other models. The XGBoost model outperformed the “treat none” strategy, indicating its practical utility in decision making. The calibration curve showed that the XGBoost model achieved good diagnostic performance in the training and validation cohorts, whereas the logistic regression model overestimated the risk of lung cancer in high-risk individuals in both sets (Figure 2E, 2F).
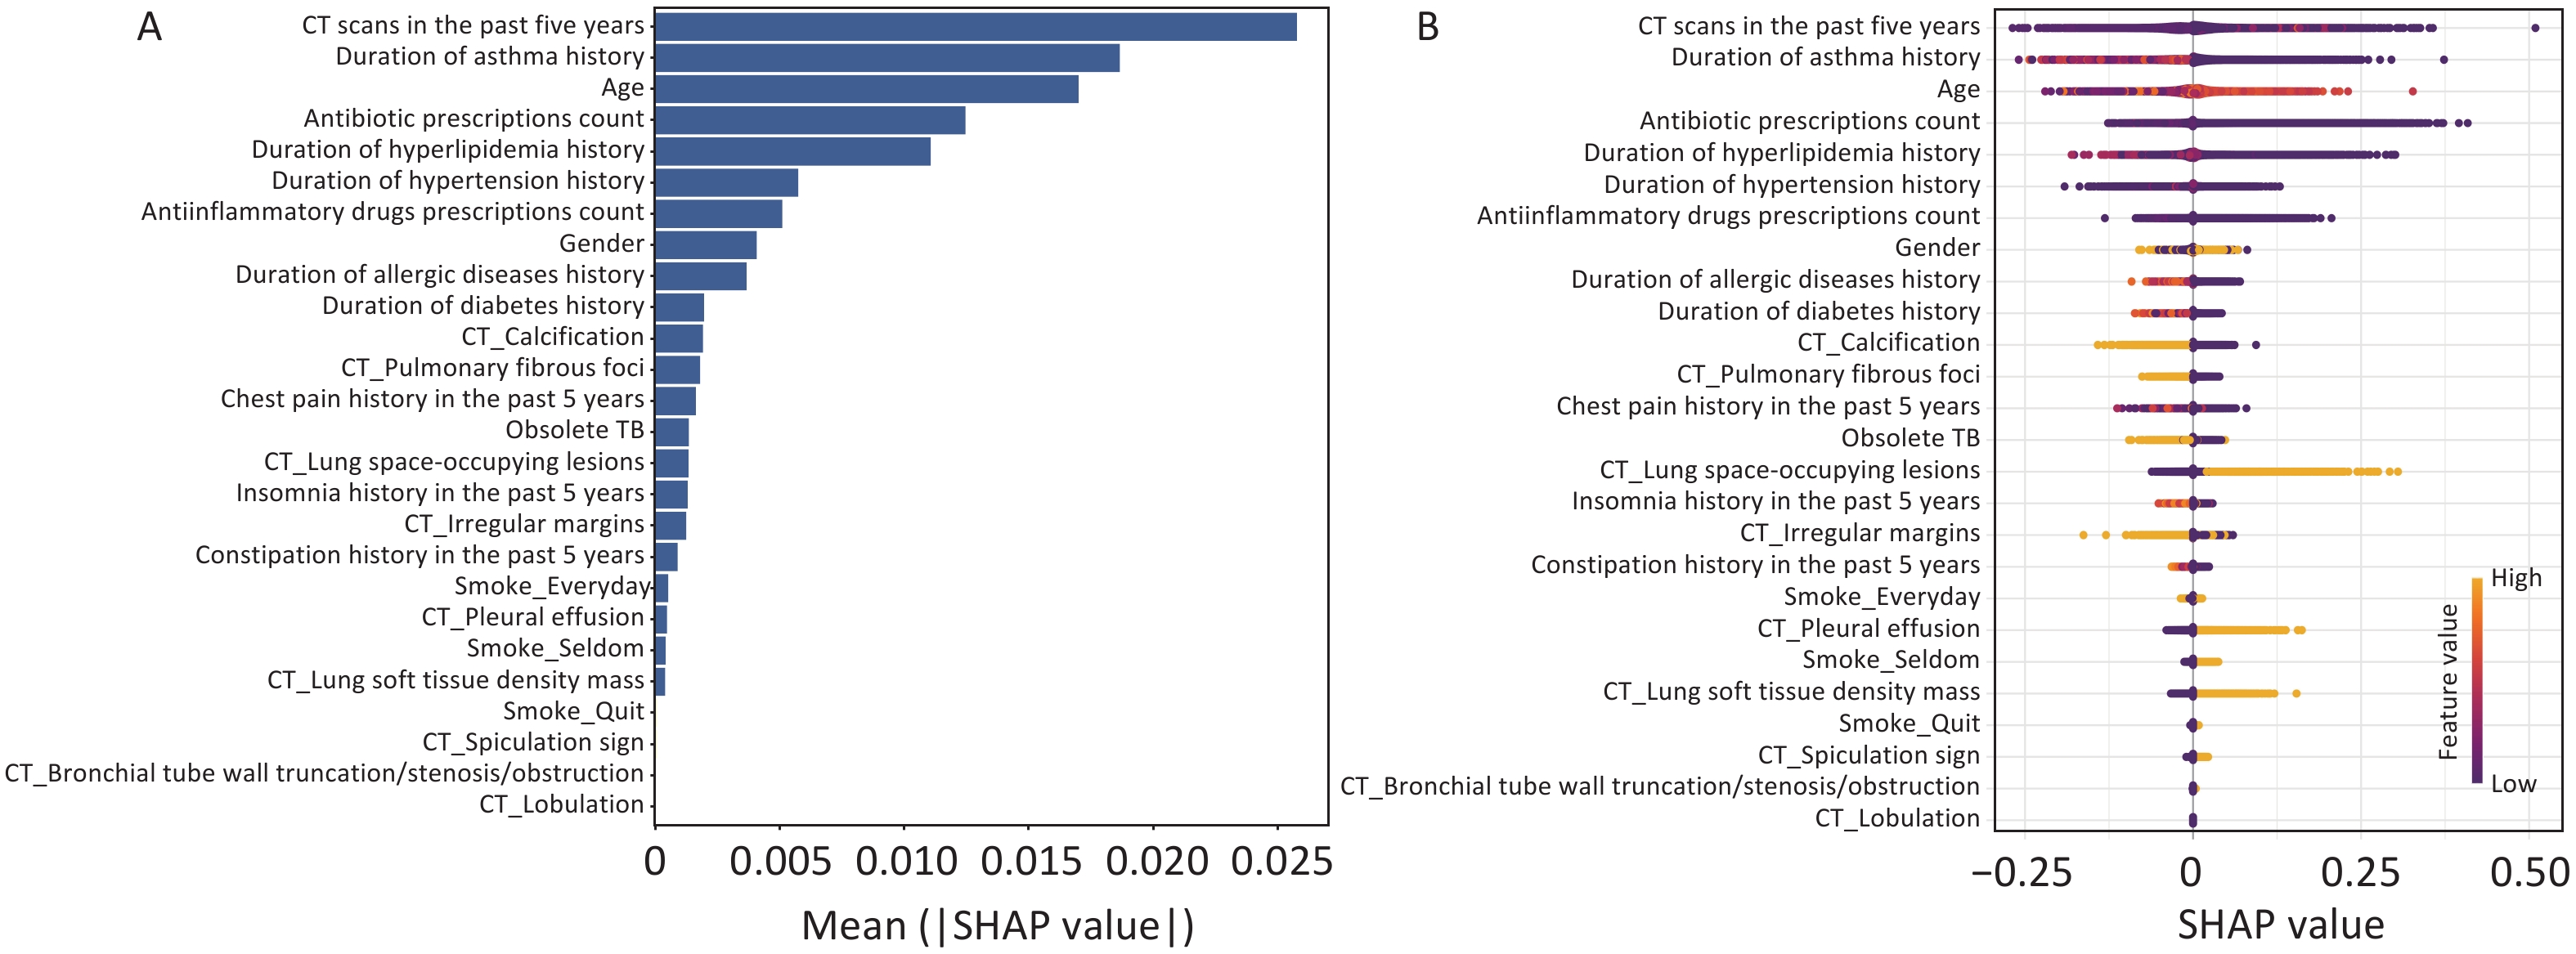
SHAP methodology was used to interpret the final XGBoost model by calculating the contribution of each variable to the prediction. Figure 3A and B showed a global explanation of the model at the feature level. The bar graph (Figure 3A) represents the effect of each feature on the prediction model evaluated by the mean absolute SHAP value, with CT scans in the past five years, duration of asthma history, and age contributing more to the prediction model. Figure 3B shows the XGBoost model-predicted values for the individual variables. The SHAP value distributions were clustered around the center. The direction of effects revealed that older age or the presence of lung space-occupying lesions with a long right tail led to a high risk of lung cancer, while a long history of asthma with a long left tail was significantly and inversely related to predicted lung cancer. As an interpretative method for ML model predictions, SHAP quantifies the contribution of model features to lung cancer risk.

Figure 3. Global model explanation using the SHAP method. (A) Feature importance ranking as indicated using SHAP. The bar plot depicts the significance of the variables and their overall contribution to the final model predictions. (B) Attributes of characteristics in SHAP, with yellow dots represent higher eigenvalues and purple dots represent lower eigenvalues. The importance of the variable is indicated by the size of its arrow, with a larger arrow signifying a more significant predictor.
Accordingly, our study observed that the number of CT scans in the last 5 years is considered the most critical factor in the development of lung cancer. The incidence of cancer has been observed to increase after CT scan exposure in previous studies, and there may be long-term carcinogenic effects after exposure to low-dose diagnostic radiation[6,7]. The duration of the asthma history emerged as an essential predictor of lung cancer in this study. A meta-analysis study showed that asthma was significantly associated with an increased risk of lung cancer (OR = 1.29, 95% CI 1.19–1.38), and Mendelian randomization analysis provided evidence supporting a causal relationship (OR = 1.11, 95% CI 1.04–1.17, P = 0.0008)[8]. Chronic inflammation caused by asthma may promote carcinogenic processes in lung tissue, potentially leading to malignant transformation and cancer development. We observed by SHAP analysis that a long asthma history was inversely related to the predicted lung cancer risk, which might be attributed to regular inhaled corticosteroid use, which might reduce the risk of lung cancer in patients with asthma[9]. Lung space-occupying lesions are more prominent in size and diameter than small lung nodules, and patients with larger lesions have a high risk of lung cancer; therefore, lung space-occupying lesions may be potentially associated with lung cancer. Spiculation was an important feature of lung cancer in our study and was consistently considered a risk indicator for malignant solitary pulmonary nodules in the Mayo model[5]. Moreover, malignant pleural effusion is a common indication in cancer patients, and most malignant pleural effusions are secondary to pleural metastases, most commonly from lung or breast cancer[10].
In conclusion, our results showed that the XGBoost prediction model was the most effective. A combination of risk factors for lung cancer malignancy (sociodemographic characteristics, CT imaging indices, disease history duration indicators, and medication information indicators) can accurately differentiate between lung and non-lung cancers. Multicenter studies are expected to confirm their excellent diagnostic efficacy in many patients; therefore, such noninvasive assessment methods could provide valuable guidance for the prevention and early diagnosis of lung cancer in high-risk individuals.
Development and Validation of Machine Learning Models for Lung Cancer Risk Prediction in High-Risk Population: A Retrospective Cohort Study
doi: 10.3967/bes2025.038
- Received Date: 2024-10-30
- Accepted Date: 2025-03-10
The authors declare no competing interests relevant to the contents of this article.
This study was reviewed and approved by the Institutional Review Board of Peking University (number: IRB00001052-22152). The requirement for patient consent was waived owing to the retrospective study design, and prior to analysis, all data in our study were anonymized.
| Citation: | Yu Su, Haoran Zhan, Shangyao Li, Yitong Lu, Ruhuan Ma, Hai Fang, Tingting Xu, Yu Tian. Development and Validation of Machine Learning Models for Lung Cancer Risk Prediction in High-Risk Population: A Retrospective Cohort Study[J]. Biomedical and Environmental Sciences, 2025, 38(4): 501-505. doi: 10.3967/bes2025.038

|

 Quick Links
 DownLoad: