


-
As climate change progresses, the entire population is threatened in a certain way by non-optimal temperatures[1,2]. Human activities further increase the frequency and intensity of extreme temperature-related events[3], while temperature-related exposures affect individuals throughout their life cycle, from fetal to old age[4,5]. Epidemiological studies have provided evidence for the association between exposure to non-optimum temperatures, heatwaves, or cold spells and the increased risks of various health outcomes, from morbidity to mortality[6], and outdoor workers are more prominently affected by ambient temperature[7].
Compared with heat, cold contributes more to the disease burden, and the latest Global Burden of Disease (GBD) study has identified low temperature as one of the top ten disease burden risks for older adults[8]. Globally, 9.43% of all deaths might have been related to non-optimal temperatures, with 8.52% of deaths explainable by cold exposure[9]. From 2013 to 2015, 14.3% of non-accidental deaths in China might be attributed to non-optimal temperatures, with cold-related deaths accounting for 11.6%[10]. Cold spell, as a type of extreme weather, compared to low-temperature weather, is characterized by lower temperatures and longer durations. Although the definitions of cold spells vary, almost all cold spells are associated with a number of health outcomes, such as cardiovascular system[10], respiratory system[11], and circulatory system diseases[12,13].
At the same time, climate change not only puts people's health and lives at greater risk, but also undermines the socioeconomic systems that underpin health[14]. Sun et al. [15] found that, in 2018, cold spells caused total economic losses of 229,195 million CNY in non-accidental deaths in China. Furthermore, a statewide study conducted in Italy discovered that from 2015 to 2019, unsuitable temperatures caused a tremendous $525.52 billion in economic burden as a result of premature deaths, primarily to moderately cold temperatures ($309.54 billion) [16].
Although studies have begun to focus on the socioeconomic impact of cold spells, current studies consistently select one of the cold spells (such as the one with the greatest impact) to examine its economic impact[15]. However, understanding the economic losses caused by cold spells of different intensities across locations and populations has important public health implications. Studies have concluded that, to some extent, the impact of different cold spells on disease burden increases with the intensity of the cold spell[6]. However, there is a need to explore further the contribution patterns of different cold spells to the economic burden of mortality. Therefore, it is essential to summarize the patterns of the economic burden of deaths caused by cold spells with varying intensities and determine populations and areas with high economic burden sensitivity for public health policy formulation and response to the economic threat caused by cold spells. This study aimed to determine the economic impact of mortality related to cold spells of varying severity to identify vulnerable populations and areas.
-
This study included 24 sites that cover all meteorological and geographical divisions in China and have relatively complete medical informationization, disease monitoring systems, and efficient and accurate public health prevention and control[20].
-
To date, there are no unified international criteria for defining cold spell[11,17]. In this study, we used temperature thresholds and corresponding durations, which were extensively used in extreme temperature-related event studies[18,19], as indicators to define the 12 cold spells. In addition, to facilitate the comparison of the performance of different cold spells, we classified the 12 cold spells into four categories based on temperature thresholds: low (L, 10th, lasting 2, 3, or 4 d), medium-low (L-M, 5th, lasting 2, 3, or 4 d), medium-high (H-M, 2.5th, lasting 2, 3, or 4 d), and high (H, 1st, lasting 2, 3, or 4 d) intensity, with each category containing three defined cold spells.
-
We collected daily mortality data as described in previous studies[20]. In order to compare the effects of cold spells on different subgroups, we sourced the data by sex and age (0–64 y and ≥ 65 y), climate zone (subtropical monsoon and temperate monsoon climate zone), north and south, urban and rural subgroups. We also grouped the disease types (circulatory (I00–I99) and respiratory (J00–J99) system diseases) as coded by the ICD-10 (International Classification of Diseases, 10th Revision).
Meteorological data, including relative humidity (%), daily mean temperature (°C), and atmospheric pressure (hpa), were gathered from the China Meteorological Administration. Additionally, we collected daily air quality, life expectancy, and municipal GDP data from the local Bureau of Ecology and Environment, World Population Prospects 2022, and Statistical Yearbooks.
-
We used the value of statistical life (VSL) as an indicator of the economic burden. The VSL indicator is essentially an economic method based on the willingness to pay (WTP) and is used to quantify society’s collective willingness to pay to reduce the risk of death, converting non-market life risks into comparable cost-benefit analysis parameters[21,22]. To precisely quantify the economic impact of cold spells-related mortality in several groups with varying characteristics, the VSL[21,23] was calculated using the value of a statistical life year (VSLY) [24,25], which was used to make a specific estimate of the VSL for each individual[26].
We computed the proper VSLY using the methodology introduced by OCED[22] and adjusted the VSL based on the GDP in the study year compared with the GDP in the base year for every study site[27].
Site-specific VSL for each year was computed as follows:
$$ {VSL}_{site,year}={VSL}_{base}\times {\left(\frac{{GDP}_{site,year}}{{GDP}_{site,2016}}\right)}^{0.5} $$ (1) where VSLsite,year and $ {GDP}_{site,year} $ are the value of statistical life and GDP, respectively, for a certain site in a given year; $ {VSL}_{base} $ is quoted from an empirical investigation in China (5.54 million CNY) [27]; $ {GDP}_{site,2016} $ is the site’s GDP in the 2016, the year of baseline VSL; and 0.5 is the income elasticity[24,28,29].
VSLY were computed using equation (2):
$$ {VSLY}_{site,year,sex}={VSL}_{site,year}\times r\times {\left[{1-\left(1+r\right)}^{{{-LE}_{year,40}}_{male/female}}\right]}^{-1} $$ (2) where $ {VSLY}_{site,year,sex} $ represents the VSLY for individuals of a particular sex group at a certain site in a given year and LEyear,40male/female indicates the life expectancy of an individual aged 40 y in a given year.
We used Equation (3) to calculate the VSL after considering different characteristics such as sex, age, and district.
$$ {VSL}_{age,site,year,sex}={VSLY}_{site,year,sex}\times {LE}_{age,year,sex} $$ (3) where $ {VSL}_{age,site,year,sex} $denotes the VSL of people in a given age-sex group at a certain site in a given year and $ {LE}_{age,year,sex} $ denotes the life expectancy of a specific age-sex group in a certain year.
The daily total economic losses at a site from the loss years were the aggregate of the $ {VSL}_{age,site,year,sex} $.
-
We assessed the association between cold spells of different intensities and daily economic burden using a two-stage time-series design in the cold season (November–March). First, in conjunction with the distributed lag nonlinear model (DLNM), we used a case crossover design.
We applied a case-crossover design combined with a distributed lag nonlinear model (DLNM) to derive site-specific estimates of cold spell-daily VSL association, reported as relative risk (RR).
We defined cold-spell days as the case period using methods described in previous studies to account for day-of-the-week and seasonality effects[30]. We introduced pollutants (such as PM2.5, O3, and NO2) and meteorological factors (such as mean temperature (T), relative humidity (H), and air pressure (P)) into the model with three degrees of freedom (df) [26,31,32]. The model is described as follows:
$$ \begin{aligned} {Log}[E\left(Y_i\right)]= & \alpha+cb(CS_i,lag=21)+ns(T,df)+ \\ & ns(PM_{2.5},df)+ns(NO_2,df)+ns(O_3,df)+ \\ & ns(P,df)+ns(H,df)+S+Holiday \end{aligned} $$ (4) where α is the intercept; Yi, is the VSL of day i in the site; cb is the cross-basis function, in which the cb takes a linear function (lin) for a cold spell and the natural cubic spline (ns) for the lagged effects; CSi is the cold spells (0, non-cold spells day; 1, cold spells day); and lag is the number of lag days. Utilizing the function ns with 3 df, the confounding influence of daily mean temperature (T), PM2.5, NO2, O3, P, and H[32] are managed. S is a time stratification, the same day of week (DOW) in the same month of the same year, to eliminate time-dependent confounding factors[30]; Holiday was included as a categorical variable.
In the subsequent stage, we pooled the association between cold spells and VSL at the area or national scale using a random-effects meta-analysis. Additionally, we performed stratified meta-analyses for the subgroups to examine the distribution of the effects in each subgroup[33]. Stratified analyses were performed according to sex, age, and area, including northern and southern areas, urban and rural areas, and temperate and subtropical monsoon zones. We assessed the association between cold spells and VSL using the pooled cumulative RR (lag 0-21).
Attributable Fraction and Attributable Economic Loss
We used Equations (5) and (6) to compute the attribution fraction (AF) and attributable economic loss (AEL) to estimate the fraction of VSL ascribed to cold spells[34].
$$ AF=\left(RR-1\right)/RR\times 100{\text{%}} $$ (5) $$ AEL=AF\times VSL $$ (6) where AF is the fraction of the economic burden attributable to cold spells, RR is the relative risk, AEL is the attributable economic loss, and VSL is the total VSL.
-
First, we chose the minimum temperature as the exposure factor and altered the df of the meteorological factors. We then evaluated the extent of the effect of the economic burden by changing the maximum lag days of cold spells. In addition, we altered the df of the air pollutants.
R (version 4.2.1) was used for statistical analysis, and the “dlnm” and “mvmeta” packages were used to construct DLNM and carry out the meta-analysis.
-
Table 1 shows the characteristics of the 24 study sites during the cold season (November to March) from 2014 to 2019. The meteorological factors, pollutants, and demographic information had great variation with geographic location, such as the average daily mean temperature ranging from –17.6 °C in Hailar to 18.5 °C in Shenzhen, PM2.5 ranging from 20 μg/m3 in Mengzi to 136 μg/m3 in Zhengding and the total VSL ranging from 4.11 billion CNY in Lhasa to 293.96 billion CNY in Ningbo. A total of 342,269 deaths were recorded at all study sites during the study period, including 195,791 males and 146,478 females, accompanied by an economic loss of 1,061.10 billion CNY. Details of the deaths according to sex and age are presented in Supplementary Table S1.
Sites Study Periods Mean TEMP (°C, x ± sd) Relative humidity (%, x ± sd) Average air pressure (hpa, x ± sd) PM2.5 (μg/m3, x ± sd) O3 (μg/m3, x ± sd) NO2 (μg/m3, x ± sd) Number of deaths Total VSL (billion, CNY) Latitude Climate zone Region Xining 2014−2019 −2.9 ± 4.9 50 ± 14 769 ± 10 63 ± 25 62 ± 20 48 ± 15 11107 38.14 North AC Urban Qingdao 2014−2019 4.8 ± 4.8 62 ± 16 1016 ± 6 63 ± 41 71 ± 24 43 ± 16 9638 29.81 North TMC Urban Yancheng 2014−2017, 2019 6.5 ± 4.7 74 ± 13 1025 ± 6 64 ± 41 63 ± 22 33 ± 16 15101 44.18 South SMC Urban Wuxi 2014−2019 8.5 ± 4.6 72 ± 14 1025 ± 6 68 ± 36 63 ± 28 54 ± 19 7324 19.20 South SMC Urban Feixi 2014−2019 7.4 ± 5.0 76 ± 13 1021 ± 8 70 ± 39 42 ± 30 33 ± 20 12516 40.92 South SMC Rural Xiangtan 2014−2019 9.8 ± 4.8 82 ± 15 1015 ± 8 63 ± 38 55 ± 33 29 ± 15 20306 62.89 South SMC Rural Ningbo 2014−2019 9.4 ± 4.6 79 ± 13 1024 ± 7 50 ± 30 72 ± 30 49 ± 17 109355 293.96 South SMC Urban Wuhan 2015−2017, 2019 8.2 ± 4.6 79 ± 11 1022 ± 6 81 ± 41 56 ± 30 57 ± 21 39461 118.33 South SMC Urban Yunxi 2014−2016,
2018−20197.0 ± 4.8 70 ± 15 991 ± 7 65 ± 43 68 ± 24 28 ± 9 8499 32.09 South SMC Rural Yichang 2014−2018 8.5 ± 4.4 74 ± 15 993 ± 6 101 ± 56 54 ± 27 40 ± 12 11117 33.78 South SMC Urban Shenzhen 2014−2019 18.5 ± 3.9 71 ± 14 1011 ± 6 37 ± 17 81 ± 30 41 ± 17 3635 16.75 South SMC Urban Korla 2014−2019 −0.5 ± 7.2 56 ± 17 918 ± 7 65 ± 40 68 ± 17 32 ± 12 3641 16.59 North TCC Urban Binyang 2014−2019 15.6 ± 4.7 79 ± 14 1004 ± 5 42 ± 27 79 ± 39 27 ± 15 15357 57.80 South SMC Rural Chengdu 2014−2019 9.2 ± 3.8 81 ± 8 957 ± 5 85 ± 50 61 ± 31 45 ± 23 9666 26.66 South SMC Urban Mengzi 2014−2019 15.4 ± 4.0 69 ± 13 871 ± 3 20 ± 14 82 ± 29 15 ± 10 6666 30.28 South SMC Urban Lhasa 2019 2.8 ± 3.8 25 ± 12 652 ± 4 − − − 770 4.11 South AC Urban Nyingchi 2018−2019 3.9 ± 3.1 51 ± 10 709 ± 3 − − − 784 5.30 South AC Urban Huairou 2014−2019 0.8 ± 5.7 45 ± 18 1017 ± 7 67 ± 67 53 ± 38 38 ± 21 5275 15.99 North TMC Rural Zhengding 2014−2019 4.2 ± 5.4 47 ± 20 1017 ± 7 136 ± 99 53 ± 36 67 ± 28 7338 25.98 North TMC Rural Horinger 2014−2018 −4.6 ± 7.1 51 ± 17 889 ± 7 49 ± 33 75 ± 26 29 ± 19 2049 6.54 North TMC Rural Hailar 2014−2019 −17.6 ± 8.9 68 ± 10 942 ± 7 29 ± 18 63 ± 19 21 ± 10 4981 15.84 North TMC Urban Liaoyang 2014−2019 −1.9 ± 7.0 50 ± 14 1020 ± 7 − − − 9463 32.92 North TMC Rural Harbin 2014−2019 −10.1 ± 8.5 63 ± 13 1007 ± 8 88 ± 67 56 ± 22 55 ± 21 15839 52.75 North TMC Urban Shanghe 2014−2019 3.3 ± 5.8 59 ± 18 1021 ± 10 93 ± 54 68 ± 30 47 ± 19 12381 40.28 North TMC Rural Total / / / / / / / 342269 1061.10 / / / Note. Mean TEMP denotes daily mean temperature; TMC denotes temperate monsoon climate zone; AC denotes alpine climate zone; SMC denotes subtropical monsoon climate zone; VSL represents values of statistical life. Table 1. Characteristics of the 24 study sites in the cold season (November–March), 2014–2019
Table 2 presents the daily VSL of different groups. The daily mean VSL was 55.55 million CNY, with 33.74 million CNY for males and 21.80 million CNY for females, respectively. And the daily mean VSL of the subset above 65 y (27.37 million CNY) was slightly lower than that of the aged 0–64 y (28.18 million CNY).
Category Mean±Sd Min Q1 Median Q3 Max Amount Daily VSL, million CNY Total 55.55 ± 72.76 0.30 20.15 34.90 56.06 509.37 1061101.3 Sex Male 33.74 ± 44.14 0.00 10.95 20.95 35.63 323.88 644623.7 Female 21.80 ± 30.81 0.00 5.90 12.85 23.16 234.79 416477.6 Age 0~64 28.18 ± 35.31 0.00 7.98 17.99 32.52 260.56 538232.9 ≥ 65 27.37 ± 40.36 0.00 8.47 16.18 26.57 315.37 522868.4 Region South 76.03 ± 92.21 0.49 25.57 42.81 71.22 509.37 786260.3 North 31.37 ± 20.63 0.30 15.47 27.72 43.71 180.00 274841.0 Urban and rural Urban 65.42 ± 89.92 0.30 20.57 34.44 56.00 509.37 745681.4 Rural 40.94 ± 28.39 0.49 19.60 35.59 56.15 279.65 315419.9 Climate zone Temperate monsoon climate 31.36 ± 20.78 0.50 15.39 27.52 43.71 180.00 220115.2 Subtropical monsoon climate 78.28 ± 93.41 0.49 26.63 44.11 73.21 509.37 776841.6 Disease Type Respiratory diseases 4.73 ± 8.31 0.00 0.00 1.80 5.38 88.14 90349.2 Circulatory diseases 19.78 ± 23.54 0.00 6.01 12.63 23.25 255.26 377765.0 Note. Q1 denotes lower quartile; Q3 denotes upper quartile. Table 2. Daily VSL of each group
-
The characteristics of the 12 cold spells, including the number of days and deaths, intensity level, and total VSL associated with each cold spell, are presented in Table 3. As the intensity of the cold spell increased, the number of cold spell days decreased; thus, the number of deaths and total VSL were lower. However, there was no clear trend in changes in the average daily number of deaths.
Definition Threshold (%)* Duration (d) Intensity Days Quantity of deaths Average daily death Total VSL (billion, CNY) C10P_2D 10 2 L 4476 85631 19 260.67 C10P_3D 10 3 L 3723 71035 19 217.34 C10P_4D 10 4 L 3109 59931 19 182.98 C5P_2D 5 2 L-M 2061 41411 20 125.97 C5P_3D 5 3 L-M 1594 32082 20 97.93 C5P_4D 5 4 L-M 1281 26549 21 81.24 C2.5P_2D 2.5 2 H-M 987 18688 19 56.77 C2.5P_3D 2.5 3 H-M 741 14997 20 45.27 C2.5P_4D 2.5 4 H-M 538 11390 21 34.13 C1P_2D 1 2 H 359 7193 20 21.71 C1P_3D 1 3 H 265 5340 20 16.12 C1P_4D 1 4 H 187 3468 19 10.75 Note. *represents the percentile of daily mean temperature; VSL represents the values of statistical life; L, L-M, H-M, and H represent low-, low-medium-, high-medium-, and high-intensity cold spells, respectively. Table 3. Definition and information of various cold spells.
-
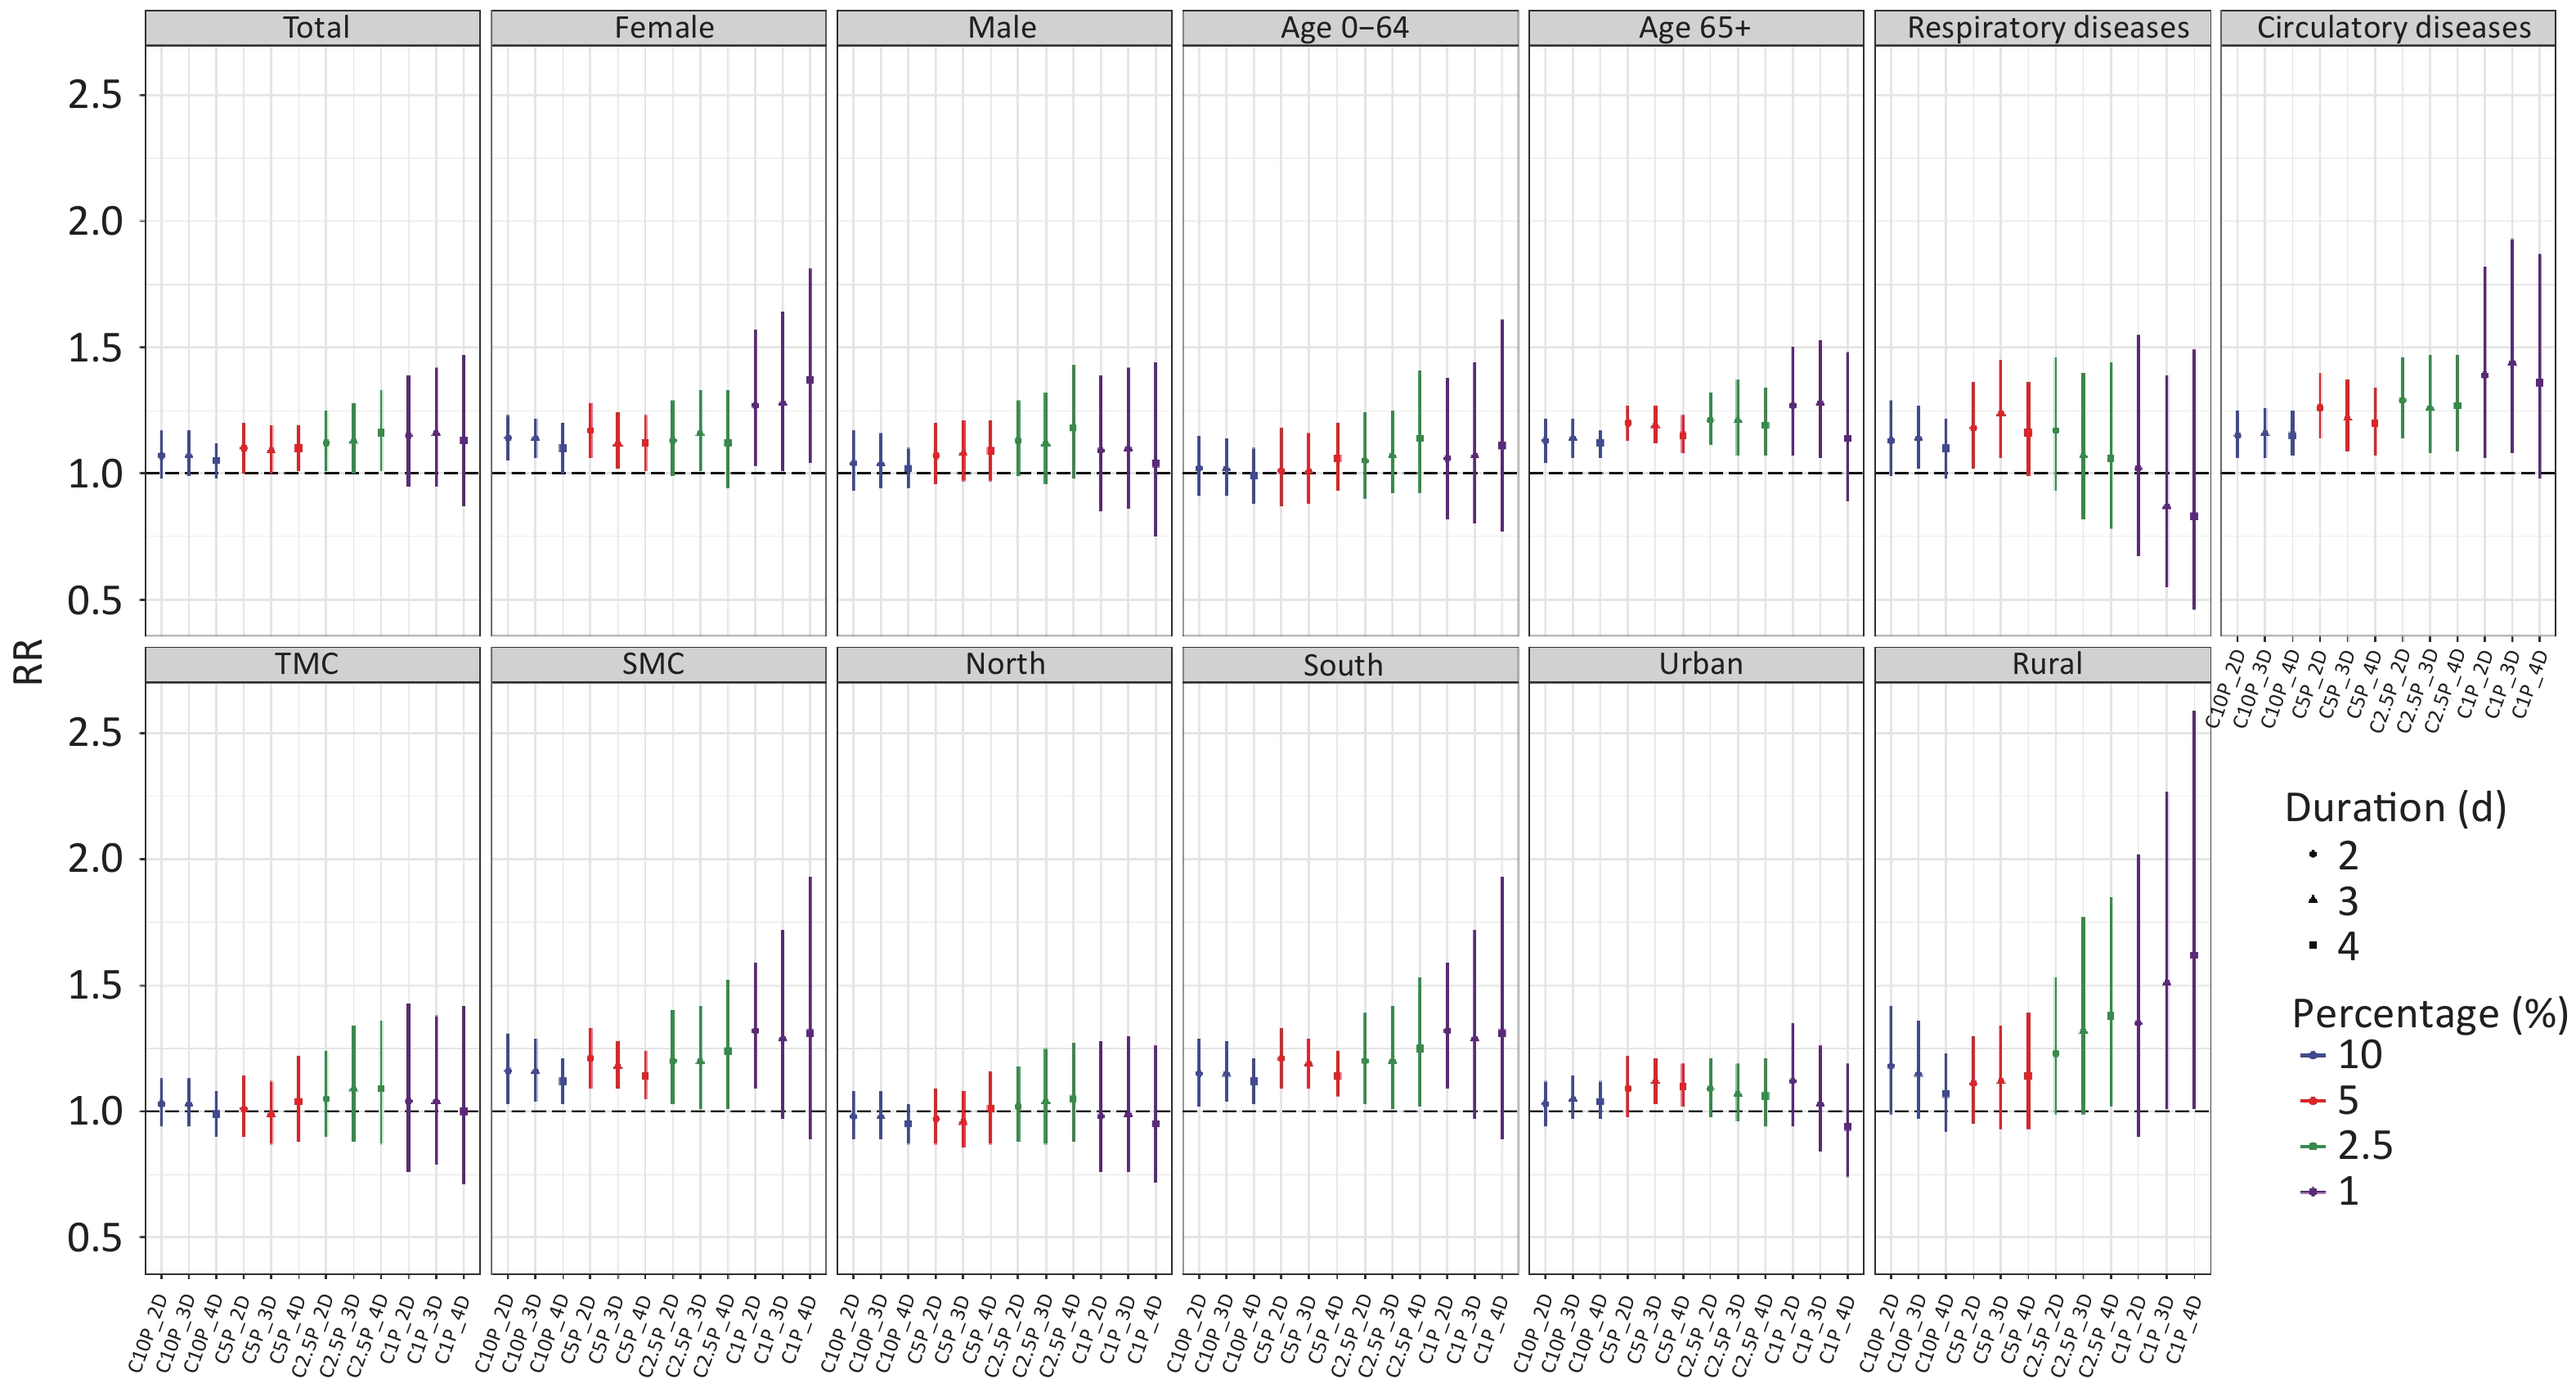
Figure 1 shows the RRs (detailed information is listed in Supplementary Table S2). For total VSL, significant effects of exposure to cold spells with moderate intensity were found, with a relative risk of 1.09 (95% CI: 1.00, 1.19) to 1.16 (95% CI: 1.01, 1.33). However, for cold spells with high or low intensity, we did not find a significant effect on VSL for the whole population.
Figure 1. Cumulative relative risk of different cold spells (lag0-21) on daily VSL of different populations.
No significant effects were observed in the subgroup analyses of males and people aged 0–64 y. In contrast, women (RR = 1.10 (95% CI: 1.00, 1.20) to 1.37 (95% CI: 1.04, 1.81)) and those aged ≥ 65 y (RR = 1.12 (95% CI: 1.06, 1.17) to 1.28 (95% CI: 1.06, 1.53)) were at higher risk of causing economic losses during cold spells of the defined intensity categories.
Regarding geographical differences, warmer areas (subtropical and southern regions) were associated with higher risks than colder areas (temperate and northern regions). The trends of the effects of cold spells on VSL in the subtropical and southern regions were similar (RR = 1.12 (95% CI: 1.03, 1.21) to 1.32 (95% CI: 1.09, 1.59)), and cold spells of multiple intensities could influence the economic burden, whereas there was no significant effect of the different cold spell types. However, we did not find a statistically significant risk increase of the economic burden during cold spell days in colder areas such as the temperate and northern regions, with a maximum RR of 1.09 (95% CI: 0.88, 1.34) during C2.5P_3D and 1.05 (95% CI: 0.88, 1.27) during C2.5P_4D.
For rural areas (RR = 1.38 (95% CI: 1.02, 1.85) to 1.62 (95% CI: 1.01, 2.59)), the effect on the economic burden of deaths showed statistical significance only when the intensity of the cold spell was relatively high. However, in urban areas (RR = 1.10 (95% CI: 1.02, 1.19) to 1.12 (95% CI: 1.03, 1.21)), the effect of only two cold spells on L–M intensity was significant. Among the disease subsets, there was a 15% (95% CI: 6%–25%) to 44% (95% CI: 8%–93%) increase in the economic risk of circulatory disease-related economic loss due to cold spells. For respiratory diseases, only three cold spells had statistically significant effects on VSL (RR = 1.14 (95% CI: 1.02, 1.27), 1.24 (95% CI: 1.06, 1.45)).
As shown in Table 4, from November to March over the study period, the overall AFs of total VSL due to cold spells were 8.3% (95% CI: 0.0%, 16.0%) to 13.8% (95% CI: 1.0%, 24.8%). Among the subgroups, the AF ranged from 9.1% (95% CI: 0.0%, 16.7%) to 27.0% (95% CI: 3.8%, 44.8%) for females and from 10.7% (95% CI: 5.7%, 14.5%) to 21.9% (95% CI: 5.7%, 34.6%) for people aged ≥ 65 y. Residents in warmer areas had higher AF (10.7% (95% CI: 2.9%–17.4%) to 24.2% (95% CI: 8.3%–37.1%). The proportion of the economic burden attributed to cold spells was higher in rural areas (AF = 27.5% (95% CI: 2.0%, 45.9%)–38.3% (95% CI: 1.0%, 61.4%)) than in urban areas (AF = 9.1% (95% CI: 2.0%, 16.0%)–10.7% (95% CI: 2.9%, 17.4%)), and there were differences in the types of cold spells that impacted the economic burden in the two geographic regions. The AFs of circulatory diseases ranged from 13.0% (95% CI: 5.7%–20.0%) during cold spell C10P_2D to 30.6% (95% CI: 7.4%–48.2%) during cold spell C1P_3D. For respiratory diseases, the AFs ranged from 12.3% (95% CI: 2.0%, 21.3%) during cold spell C10P_3D to 19.4% (95% CI: 5.7%, 31.0%) during cold spell C5P_3D.
Cold spells AF (95% CI, %) Total Male Female 0~64 ≥65 TMC SMC North South Urban Rural Respiratory diseases Circulatory diseases C10P_2D 6.5 (−2.0, 14.5) 3.8 (−7.5, 14.5) 12.3 (4.8, 18.7) 2.0 (−9.9, 13.0) 11.5 (3.8, 18.0) 2.9 (−6.4, 11.5) 13.8 (2.9, 23.7) −2.0 (−12.4, 7.4) 13.0 (2.0, 22.5) 2.9 (−6.4, 10.7) 15.3 (−1.0, 29.6) 11.5 (−1.0, 22.5) 13.0 (5.7, 20.0) C10P_3D 6.5 (−1.0, 14.5) 3.8 (−6.4, 13.8) 12.3 (5.7, 18.0) 2.0 (−9.9, 12.3) 12.3 (5.7, 18.0) 2.9 (−6.4, 11.5) 13.8 (3.8, 22.5) −2.0 (−12.4, 7.4) 13.0 (3.8, 21.9) 4.8 (−3.1, 12.3) 13.0 (−3.1, 26.5) 12.3 (2.0, 21.3) 13.8 (5.7, 20.6) C10P_4D 4.8 (−2.0, 10.7) 2.0 (−6.4, 9.1) 9.1 (0.0, 16.7) −1.0 (−13.6, 9.1) 10.7 (5.7, 14.5) −1.0 (−11.1, 7.4) 10.7 (2.9, 17.4) −5.3 (−14.9, 2.9) 10.7 (2.9, 17.4) 3.8 (−3.1, 10.7) 6.5 (−8.7, 18.7) 9.1 (−2.0, 18.0) 13.0 (6.5, 20.0) C5P_2D 9.1 (0.0, 16.7) 6.5 (−4.2, 16.7) 14.5 (5.7, 21.9) 1.0 (−14.9, 15.3) 16.7 (11.5, 21.3) 1.0 (−11.1, 12.3) 17.4 (8.3, 24.8) −3.1 (−14.9, 8.3) 17.4 (8.3, 24.8) 8.3 (−2.0, 18.0) 9.9 (−5.3, 23.1) 15.3 (2.0, 26.5) 20.6 (12.3, 28.6) C5P_3D 8.3 (0.0, 16.0) 7.4 (−3.1, 17.4) 10.7 (2.0, 19.4) 1.0 (−13.6, 13.8) 16.0 (10.7, 21.3) −1.0 (−14.9, 10.7) 15.3 (8.3, 21.9) −4.2 (−16.3, 7.4) 16.0 (8.3, 22.5) 10.7 (2.9, 17.4) 10.7 (−7.5, 25.4) 19.4 (5.7, 31.0) 18.0 (8.3, 27.0) C5P_4D 9.1 (1.0, 16.0) 8.3 (−3.1, 17.4) 10.7 (1.0, 18.7) 5.7 (−7.5, 16.7) 13.0 (7.4, 18.7) 3.8 (−13.6, 18.0) 12.3 (4.8, 19.4) 1.0 (−14.9, 13.8) 12.3 (5.7, 19.4) 9.1 (2.0, 16.0) 12.3 (−7.5, 28.1) 13.8 (−1.0, 26.5) 16.7 (6.5, 25.4) C2.5P_2D 10.7 (1.0, 20.0) 11.5 (−1.0, 22.5) 11.5 (−1.0, 22.5) 4.8 (−11.1, 19.4) 17.4 (9.9, 24.2) 4.8 (−11.1, 19.4) 16.7 (2.9, 28.6) 2.0 (−13.6, 15.3) 16.7 (2.9, 28.1) 8.3 (−2.0, 17.4) 18.7 (−1.0, 34.6) 14.5 (−7.5, 31.5) 22.5 (12.3, 31.5) C2.5P_3D 11.5 (0.0, 21.9) 10.7 (−4.2, 24.2) 13.8 (1.0, 24.8) 6.5 (−8.7, 20.0) 17.4 (6.5, 27.0) 8.3 (−13.6, 25.4) 16.7 (1.0, 29.6) 3.8 (−14.9, 20.0) 16.7 (1.0, 29.6) 6.5 (−4.2, 16.0) 24.2 (−1.0, 43.5) 6.5 (−22.0, 28.6) 20.6 (7.4, 32.0) C2.5P_4D 13.8 (1.0, 24.8) 15.3 (−2.0, 30.1) 10.7 (−6.4, 24.8) 12.3 (−8.7, 29.1) 16.0 (6.5, 25.4) 8.3 (−14.9, 26.5) 19.4 (1.0, 34.2) 4.8 (−13.6, 21.3) 20.0 (2.0, 34.6) 5.7 (−6.4, 17.4) 27.5 (2.0, 45.9) 5.7 (−28.2, 30.6) 21.3 (8.3, 32.0) C1P_2D 13.0 (−5.3, 28.1) 8.3 (−17.6, 28.1) 21.3 (2.9, 36.3) 5.7 (−22.0, 27.5) 21.3 (6.5, 33.3) 3.8 (−31.6, 30.1) 24.2 (8.3, 37.1) −2.0 (−31.6, 21.9) 24.2 (8.3, 37.1) 10.7 (−6.4, 25.9) 25.9 (−11.1, 50.5) 2.0 (−49.3, 35.5) 28.1 (5.7, 45.1) C1P_3D 13.8 (−5.3, 29.6) 9.1 (−16.3, 29.6) 21.9 (1.0, 39.0) 6.5 (−25.0, 30.6) 21.9 (5.7, 34.6) 3.8 (−26.6, 27.5) 22.5 (−3.1, 41.9) −1.0 (−31.6, 23.1) 22.5 (−3.1, 41.9) 2.9 (−19.0, 20.6) 33.8 (1.0, 55.9) −14.9 (−81.8, 28.1) 30.6 (7.4, 48.2) C1P_4D 11.5 (−14.9, 32.0) 3.8 (−33.3, 30.6) 27.0 (3.8, 44.8) 9.9 (−29.9, 37.9) 12.3 (−12.4, 32.4) 0.0 (−40.9, 29.6) 23.7 (−12.4, 48.2) −5.3 (−38.9, 20.6) 23.7 (−12.4, 48.2) −6.4 (−35.1, 16.0) 38.3 (1.0, 61.4) −20.5 (−117.4, 32.9) 26.5 (−2.0, 46.5) Note. AF denotes attribution fraction; TMC denotes temperate monsoon climate zone; SMC denotes for subtropical monsoon climate zone. Bold values of RR were statistically significant. Table 4. Attributable fraction associated with cold spells for each group
-
Table 5 shows the economic losses due to death attributable to different cold spells during the study period. Our analysis reveals that the highest attributable economic loss occurred for C5P_2D. The cold spells we defined increased the economic burden of 4.71 (95% CI: 0.34, 8.47) to 11.45 (95% CI: 0.00, 21.00) billion CNY for total mortality from November to March 2014–2019.
Cold spells AEL (95% CI, billion CNY) Total Male Female 0~64 ≥65 TMC SMC North South Urban Rural Respiratory diseases Circulatory diseases C10P_2D 17.05
(−5.32, 37.88)6.07
(−11.88, 22.93)12.63
(4.90, 19.23)2.56
(−12.90, 17.01)14.99
(5.01, 23.49)1.59
(−3.49, 6.28)26.29
(5.55, 45.11)−1.38
(−8.39, 5.03)25.15
(3.78, 43.34)5.28
(−11.56, 19.41)12.13
(−0.80, 23.51)2.77
(−0.24, 5.41)12.49
(5.42, 19.15)C10P_3D 14.22
(−2.20, 31.58)5.06
(−8.39, 18.13)10.55
(4.86, 15.49)2.14
(−10.77, 13.38)13.31
(6.14, 19.55)1.30
(−2.86, 5.15)21.83
(6.09, 35.58)−1.17
(−7.07, 4.24)20.89
(6.16, 35.04)7.12
(−4.62, 18.36)8.85
(−2.10, 17.97)2.48
(0.40, 4.29)11.11
(4.56, 16.62)C10P_4D 8.71
(−3.73, 19.60)2.17
(−7.06, 10.06)6.57
(0.00, 12.05)−0.92
(−12.43, 8.28)9.84
(5.20, 13.35)−0.38
(−4.16, 2.78)14.33
(3.90, 23.22)−2.53
(−7.17, 1.40)14.46
(3.93, 23.43)4.85
(−3.90, 13.52)3.72
(−4.94, 10.63)1.57
(−0.35, 3.11)8.94
(4.48, 13.70)C5P_2D 11.45
(0.00, 21.00)4.98
(−3.17, 12.68)7.25
(2.82, 10.92)0.61
(−9.27, 9.47)10.65
(7.35, 13.59)0.26
(−2.86, 3.16)16.12
(7.67, 23.05)−0.99
(−4.78, 2.64)16.31
(7.76, 23.32)7.30
(−1.80, 15.94)3.73
(−1.98, 8.68)1.84
(0.24, 3.19)9.68
(5.76, 13.40)C5P_3D 8.09
(0.00, 15.64)4.38
(−1.83, 10.26)4.16
(0.76, 7.51)0.48
(−6.55, 6.63)7.96
(5.34, 10.60)−0.19
(−2.76, 1.98)11.24
(6.09, 16.12)−0.97
(−3.81, 1.73)11.90
(6.16, 16.76)7.23
(1.96, 11.71)3.26
(−2.29, 7.73)1.87
(0.55, 3.00)6.64
(3.04, 9.94)C5P_4D 7.39
(0.80, 12.97)4.05
(−1.52, 8.52)3.45
(0.32, 6.02)2.24
(−2.98, 6.61)5.43
(3.08, 7.78)0.55
(−1.93, 2.56)7.65
(2.97, 12.05)0.18
(−2.71, 2.50)7.75
(3.57, 12.22)5.09
(1.10, 8.95)3.09
(−1.90, 7.07)1.12
(−0.08, 2.14)5.06
(1.99, 7.70)C2.5P_2D 6.08
(0.56, 11.35)3.96
(−0.35, 7.75)2.57
(−0.23, 5.02)1.32
(−3.09, 5.39)5.02
(2.87, 7.02)0.55
(−1.29, 2.24)6.88
(1.20, 11.79)0.29
(−2.03, 2.27)6.99
(1.22, 11.76)3.21
(−0.79, 6.75)3.34
(−0.18, 6.19)0.82
(−0.42, 1.77)4.81
(2.63, 6.74)C2.5P_3D 5.21
(0.00, 9.90)2.93
(−1.14, 6.62)2.48
(0.18, 4.46)1.42
(−1.89, 4.35)4.08
(1.54, 6.35)0.74
(−1.22, 2.28)5.57
(0.33, 9.89)0.45
(−1.74, 2.33)5.60
(0.33, 9.94)2.03
(−1.29, 4.94)3.47
(−0.14, 6.22)0.30
(−1.01, 1.31)3.52
(1.26, 5.46)C2.5P_4D 4.71
(0.34, 8.47)3.14
(−0.42, 6.20)1.45
(−0.86, 3.36)1.99
(−1.41, 4.71)2.86
(1.17, 4.55)0.49
(−0.89, 1.57)5.01
(0.26, 8.86)0.39
(−1.11, 1.72)5.20
(0.51, 9.01)1.32
(−1.49, 4.05)2.96
(0.21, 4.95)0.20
(−1.01, 1.09)2.77
(1.08, 4.17)C1P_2D 2.83
(−1.14, 6.09)1.06
(−2.27, 3.61)1.88
(0.26, 3.22)0.59
(−2.29, 2.87)2.40
(0.74, 3.76)0.16
(−1.31, 1.25)3.88
(1.32, 5.94)−0.11
(−1.74, 1.20)3.93
(1.34, 6.01)1.61
(−0.96, 3.89)1.74
(−0.75, 3.39)0.05
(−0.19, 0.86)2.30
(0.46, 3.70)C1P_3D 2.22
(−0.85, 4.77)0.85
(−1.53, 2.78)1.47
(0.07, 2.63)0.50
(−1.93, 2.35)1.84
(0.48, 2.92)0.11
(−0.76, 0.79)2.79
(−0.38, 5.19)−0.04
(−1.18, 0.86)2.79
(−0.38, 5.19)0.31
(−2.00, 2.17)1.89
(0.06, 3.13)−0.27
(−1.48, 0.51)1.80
(0.44, 2.85)C1P_4D 1.24
(−1.61, 3.44)0.25
(−2.15, 1.97)1.16
(0.17, 1.93)0.52
(−1.57, 1.99)0.67
(−0.68, 1.78)0.00
(−0.87, 0.63)1.85
(−0.97, 3.77)−0.15
(−1.13, 0.60)1.85
(−0.97, 3.77)−0.40
(−2.19, 1.00)1.72
(0.04, 2.76)−0.23
(−1.32, 0.37)1.07
(−0.08, 1.89)Note. AEL denotes attributable economic loss; TMC denotes temperate monsoon climate zone; SMC denotes subtropical monsoon climate zone. Table 5. Economic losses attributable to cold spells for each group (billion, CNY)
The highest economic losses were observed for C10P_2D. The overall economic loss was 17.05 billion CNY, which was not statistically significant. Regarding the subgroups, the death of females brings about 1.16 (95% CI: 0.17, 1.93) to 12.63 (95% CI: 4.90, 19.23) billion CNY in excess losses. Compared with females, the AEL was lower and insignificant in males, ranging from 0.25 (95% CI: –2.15, 1.97) to 6.07 (95% CI: –11.88, 22.93) billion CNY. The excess economic loss related to elders aged ≥65 y was multiple times higher than that of those aged 0–64 y, ranging from 1.84 (95% CI: 0.48, 2.92) to 14.99 (95% CI: 5.01, 23.49) billion CNY. And the death of those aged 0–64 y led to 0.52 (95% CI: –1.57, 1.99) to 2.56 (95% CI: –12.90, 17.01) billion CNY in excess losses; nevertheless, this result was not statistically significant.
With respect to different regions, similar to the RR pattern, which showed that bitter regions had higher economic losses than colder regions, the AEL of the subtropical and southern regions were higher than those of the temperate and northern regions. The AELs of the subtropical and southern regions were 3.88 (95% CI: 1.32, 5.94) to 26.29 (95% CI: 5.55, 45.11) billion CNY and 3.93 (95% CI: 1.34, 6.01) to 25.15 (95% CI: 3.78, 43.34) billion CNY, respectively, and the temperate and northern regions were low and insignificant. The AELs in urban and rural areas were statistically significant for limited cold spells, with economic losses of 5.09 (95% CI: 1.10, 8.95) to 7.23 (95% CI: 1.96, 11.71) billion CNY and 1.72 (95% CI: 0.04, 2.76) to 2.96 (95% CI: 0.21, 4.95) billion CNY, respectively.
Compared to respiratory diseases (AEL= 1.87 (0.55, 3.00) to 2.48 (0.40, 4.29) billion CNY), circulatory diseases were more susceptible to cold spells and had a higher AEL of 1.80 (0.44, 2.85) to 12.49 (5.42, 19.15) billion CNY.
-
First (Supplementary Tables S3 and S4), the association remained similar when the exposure factor was changed to the daily minimum temperature or when the lag day was altered. All the results remained almost unchanged when the df of the meteorological factors and pollutants were adjusted (Supplementary Tables S3 and S5). Meanwhile, the effect fluctuated slightly when the air pollutant was changed to PM10 or other air pollutants (Supplementary Table S6).
-
Our study assessed the impact of different cold spells on the economic burden of mortality in a multi-site setting in China. These results indicate that cold spells are a considerable economic burden in China. Overall, the effects of multiple cold spell intensities on the economic burden of mortality were statistically significant. Older people ≥ 65 y, females, and people living in relatively warmer areas were more vulnerable to cold spells.
There is sufficient evidence that adverse health effects, especially cardiovascular disease outcomes, increase during cold spells[17,35,36], especially for cardiovascular disease outcomes[37]. The effects of cold stress on the cardiovascular system include increased heart rate, blood pressure, blood hypercoagulation, and vasoconstriction[38]. The heart muscle has a higher metabolic level, even at rest, and therefore has a higher demand for oxygen than other organs[39,40]. In addition, cold stress may induce myocardial infarction through various pathways, such as myocardial ischemia, coronary spasm, disturbances in myocardial energy metabolism, and apoptosis of myocardial cells[41]. In the context of air pollution, the combined and interactive effects of cold spells and air pollutants increase the impact of cold spells to some extent[42].
We found that 8.3% (95% CI: 0.0%, 16.0%)–13.8% (95% CI: 1.0%, 24.8%) of VSL in the cold season were attributable to cold spells of different intensities, appearing in C5P_3D and C2.5P_4D—approximately 0.04%–0.11% of the total GDP. However, AEL exhibited asynchrony with AF. AELs ranged from 4.71 (95% CI: 0.34, 8.47) to 11.45 (95% CI: 0.00, 21.00) billion CNY, with the largest AEL occurring in C5P_2D and the smallest AEL in C2.5P_4D. This may be caused by differences in the number of cold spell days involved in different cold spells. Although the associations between all-cause or cause-specific mortality and cold spells were more robust for more intense or longer cold spells[6,43], they involved relatively fewer cold spell days, an interaction that resulted in heterogeneity in AF and AEL.
Many studies on temperature and health outcomes have found that non-optimum or extreme temperature-related events, such as cold spells or heatwaves, have a more significant impact on females than that on males[10,44]. Consistent with previous research findings, our study found that cold spells in the four major intensity categories had more significant effects on females and produced higher AELs. This may be due to differences in biological factors and economic statuses of females and males[16,45]. Older adults are receiving more attention in the context of climate change and aging, and their protection plays an indispensable role in public health. For age groups, in line with previous studies on cold spells and the burden of disease[46], our study found that people aged ≥ 65 y were more vulnerable to cold spells, and the effects of the four types of cold spells on their economic burden were statistically significant. More than one-fifth of the economic burden can be attributed to the effects of cold spells during C1P_3D. Therefore, the development of appropriate protection measures for the elderly plays a significant role in reducing the economic burden on society.
Geography is a crucial factor influencing the economic burden due to cold spells, and a study by Sun et al. [15] found that the southern regions of China face higher health risks from cold spells and should receive more attention. Our study found that people in warmer regions, such as the southern and subtropical zones, were more affected by cold spells and generated higher economic burdens, even at lower cold spell intensities. However, we did not observe a significant increase in the economic burden of mortality in the colder regions. This phenomenon may be due to different adaptations to cold in different regions. A study conducted by Wang et al. [47] on the adaptation of 21st-century residents to cold spells revealed adaptation to cold spells in cold and temperate climatic zones.
However, a study by Lei et al. [6] on the mortality burden due to cold spells found that the risk was higher in temperate continental and temperate monsoon regions than in subtropical monsoon regions. Therefore, it is essential to conduct more studies to identify the role of geographical factors in assessing the impact of cold spells on economic losses using more extensive and representative data.
Similar to the finding in Italy[16], our research on the economic burden of cold spells in urban and rural areas found that people living in urban areas were more vulnerable to cold spells, with higher AELs for moderate cold spells compared with rural areas, which only received high-intensity cold spells. In addition, studies have shown that a large proportion of temperature-related deaths from circulatory diseases can be attributed to cold temperatures[6,48]. This study also found a significant increase in economic losses owing to circulatory mortality from cold spells, with up to one-third of the losses attributable to cold spells.
To our knowledge, this is the first national study to assess the differences in the magnitude of the impact of different cold spells on the region-wise economic impacts, such as economic burden of death, in China. Furthermore, we directly assessed the association between cold spells of varying intensities and VSL calculated based on VSLY, which accounted for regional, sex, and age differences, rather than first establishing associations with cause-specific mortality and then converting these results into VSL estimates. This approach enabled a more accurate assessment of the economic burden of death by accounting for individual differences in region, sex, and age. This study has several limitations. First, due to data availability, we used national-level life expectancy data when calculating the VSL, which might have masked some geographical differences. Second, for some diseases, using death as the outcome to calculate economic burden may result in reduced sensitivity. Future studies could explore this using more sensitive indicators such as morbidity.
-
This nationwide multi-site study found that different cold spells have an enormous impact on the economic burden of mortality in the context of climate change and aging. Moreover, the extent to which cold spells of different intensities affected each population varied. Overall, females and older adults aged ≥ 65 y were vulnerable to almost all cold spells, and people in relatively warmer regions were more susceptible to cold spells, which resulted in a higher economic burden of mortality. Therefore, it is vital to develop appropriate strategies to respond to cold spells for these populations or regions and a more robust cold spell forecasting system to reduce the economic burden on society.
A multi-site Analysis for the Economic Burden of Mortality Attributable to Cold Spells of Different Intensities in China, 2014–2019
doi: 10.3967/bes2025.122
- Received Date: 2025-01-22
- Accepted Date: 2025-09-08
-
Key words:
- Mortality /
- Cold spell /
- Economic loss
Abstract:
The authors declare that there are no conflicts of interest.
| Citation: | Cheng Zhao, Yu Wang, Rui Zhang, Shilu Tong, Jiang He, Yonghong Li, Xiaoyuan Yao. A multi-site Analysis for the Economic Burden of Mortality Attributable to Cold Spells of Different Intensities in China, 2014–2019[J]. Biomedical and Environmental Sciences. doi: 10.3967/bes2025.122

|

 Quick Links
 DownLoad: