

 下载:
下载:

-
Silica (silicon dioxide, SiO2) has been widely applied in food products for many years[1, 2]. Synthetic amorphous silica (SAS) has been approved as a food additive in many countries and regions, including Europe, the USA, and China. It is primarily used for clearing of beers and wines and as an anticaking agent in powder products to maintain flow properties[2, 3]. The Food and Agriculture Organization of the United Nations/the World Health Organization (FAO/WHO) evaluated the toxicological effects of silica in 1985, and an acceptable daily intake of 'not specified' was assigned[4].
As nanotechnology has developed rapidly in recent years, engineered nanoparticles (NPs) have been widely applied in a variety of fields, such as textiles, electrical, cosmetics, biomedicine and pharmaceuticals, for their unique physical, chemical, and biological properties[5]. Silica NPs are widely used in the nanotechnology consumer products listed in the Woodrow Wilson International Center for Scholars[6]. In commercial food-related products, silica particles with exterior dimensions smaller than 100 nm were indeed found[2, 5]. Silica and titanium dioxide nanostructures were detected in 11 of 12 dietary supplements[7]. Therefore, silica NPs potentially enter the human body through dietary exposure; furthermore, people can swallow inhaled silica NPs due to mucociliary clearance from the respiratory tract[8, 9].
Due to their special physicochemical characteristics, NPs are raising increasing concerns over the risk they pose to human health in both scientific areas and governmental agencies. The health effects of NPs and their safety evaluation have been extensively studied; however, the issue has not yet been fully addressed[10-13]. According to the Guidance for Industry from U.S. Food and Drug Administration (FDA), a food substance manufactured for the purpose of creating very small particle sizes with new functional properties likely would not be covered by an existing generally recognized as safe determination for a related food substance manufactured without using nanotechnology[12]. According to the Scientific Opinion by the European Food Safety Authority (EFSA) Scientific Committee, it is essential to identify the differences between NPs and the corresponding non-nanoform substance[10].
In this study, we investigated the subchronic oral toxicity of silica NPs and silica microparticles (MPs) in rats in a 90-day repeated-dose study, and silica MPs were set as the non-nanoform compounds. Groups of rats were administered silica NPs or silica MPs by gavage at doses of 166.7, 500, and 1, 500 mg/(kg·bw·day). At the end of the study, blood samples were collected for hematological and clinical biochemical analyses. After a detailed necropsy, selected organs were weighed, and the designated organs were fixed in 10% neutral-buffered formalin for histopathological examination. Blood, liver, kidneys, and testis were preserved for silicon (Si) determination.
-
Silica NPs were purchased from ST-NANO Co. Ltd (Shanghai, China), and silica MPs were purchased from Aladdin Industrial Inc. (Shanghai, China). Both are hydrophilic precipitated silica without surface modification and stored at room temperature. Silica NPs and MPs were white in color and powdered in appearance. Silica particles suspensions were prepared by dispersing the particles in deionized water, followed by sonication at 400 W for 2 min (Ningbo Scientz Biotechnology Co. Ltd, China, 3 s on and 3 s off) in an ice-water bath to keep the suspensions from overheating.
-
The size and shape of the particles were observed by transmission electron microscopy (TEM) with an accelerating voltage of 100 kV (H-7700, Hitachi, Ltd., Japan). One hundred particles were measured in random fields of view to calculate particle sizes. The hydrodynamic sizes of particles in deionized water were determined by dynamic light scattering using a Horiba SZ-100 series particle size analyzer, the zeta potential was measured using a zeta potential measuring device (SZ-100, Horiba, Ltd., Japan), and the pH value of silica suspensions was measured with a pH meter. Particle purity was analyzed by the X-ray fluorescence technique (XRF-1600, Shimadzu Co., Ltd., Japan). The crystal status was investigated by X-ray diffraction (XRD) (D8 Advance, Bruker Corporation, Germany). The specific surface area of silica NPs and silica MPs was determined by Brunauer-Emmett-Teller analysis with a TriStar Ⅱ 3020 instrument (Micromeritics Instrument Corporation, USA).
-
In order to evaluate the dissolution of silica particles in gastric and intestinal fluids, dissolution studies of silica NPs and silica MPs in vitro were carried out in simulated gastric and intestinal fluids. The in vitro gastrointestinal digestion method used was based on Ruby et al.[14] and Cave et al.[15]. The simulated digestion was conducted at 37 ℃ with constant shaking. The gastric solution was prepared by adding 1.25 g pepsin, 500 mg of malate, 500 mg of citrate, 500 μL of acetic acid, and 420 μL of lactic acid to 1 L of ultrapure water and adjusting the pH to 2.0 with hydrochloric acid. The silica particles were incubated at a concentration of 10 mg/mL for 2 h in 30 mL gastric solution. Subsequently, a 2 mL sample was taken, then 52.5 mg of bile salts and 15 mg of pancreatin were placed into the remaining suspension, and a saturated sodium bicarbonate solution was added to neutralize the pH to 7.0. The sample was incubated for a further 1 h, and another 2 mL sample of the solution was taken. Supernatants were collected by double ultracentrifugation (12, 000 rpm) for 20 min. Finally, analysis of Si in the supernatants was performed by inductively coupled plasma – atomic emission spectrometry (ICP-AES) (VISTA-MPX, Varian, USA).
-
Weanling Sprague-Dawley rats of a specific pathogen-free grade were purchased from Beijing HFK Bioscience Co. Ltd (Beijing, China). Body weights of male and female rats on receipt were 60-80 g. All animals were examined for clinical signs of ill health on receipt and observed within 5 days of arrival. Rats were housed in an environmentally controlled room with the room air temperature at 23 ± 2 ℃ and the relative humidity within the range of 40%-70%. Air was changed 10-15 times per hour. The lights were set to a 12-hour light/dark cycle. Rats were individually housed in suspended stainless steel, open-mesh cages and allowed free access to irradiation-sterilized pellet feed and tap water during the experiments.
-
One hundred forty healthy weanling Sprague-Dawley rats were used in this study. Animals were randomly divided into seven groups, and each group consisted of 10 animals of each sex. One group was administered deionized water by gavage and served as the control group; the six remaining groups were given three dose levels of silica NPs or silica MPs by gavage: 166.7, 500, and 1, 500 mg/(kg·bw·day). Silica NPs and silica MPs were administered daily in the morning for 13 weeks. The gavage volume was 1 mL/100 g body weight. The body weights were measured weekly, and the gavage volume was adjusted based on the body weights of the rats. Clinical observations were recorded daily. Body weights and food consumption were measured weekly. Blood samples were collected at the end of the study for measurement of hematology and clinical biochemistry. All animals were euthanized for necropsy. Selected organs were weighed and the weights recorded. Histological examination was performed on all tissues from animals in the control group and the highest dose silica NPs and silica MPs groups. The study was performed in compliance with Good Laboratory Practices (GLP) and in accordance with the Organization for Economic Cooperation and Development (OECD) Guideline 408[16]. The protocol has been approved by the Office of Laboratory Animal Welfare, China National Center for Food Safety Risk Assessment.
-
Each animal was observed twice daily for abnormalities, physical appearance, and mortality throughout the study. Observations included, but were not limited to, changes in skin, fur, eyes, appearance, salivary gland secretions, oral mucosa, fecal characteristics, respiration, and behavior. The body weight of each rat was measured pre-test, weekly thereafter, and at sacrifice after fasting. Food consumption was measured once a week during the experiment period.
-
Following fasting for 16-18 h, rats were anesthetized with 2% sodium pentobarbital solution on day 91, and blood was collected from the abdominal aorta. Blood for hematology studies was collected into tubes containing ethylenediaminetetraacetic acid anticoagulant. A COULTER Ac.T diff2 Hematology Analyzer (Beckman Coulter Inc., USA) was employed to measure the following parameters: red blood cell count (RBC), hemoglobin (HGB), platelet count (PLT), white blood cell count (WBC), WBC differential count of lymphocytes (LYM), granulocytes (GR) and mononuclear cells (MO), mean corpuscular volume (MCV), hematocrit (HCT), mean corpuscular hemoglobin (MCH), and mean corpuscular hemoglobin concentration (MCHC). A measure of clotting potential was determined with blood plasma, using sodium citrate as an anticoagulant. Prothrombin time (PT), activated partial prothrombin time (APTT), thrombin time (TT), and fibrinogen (FIB) were analyzed by an automatic coagulation analyzer ACL TOP700 (Instrumentation Laboratory Company, USA). Blood for clinical chemistry was collected into tubes containing no anticoagulant and centrifuged to obtain serum. Serum biochemical parameters included alanine aminotransferase (ALT), aspartate aminotransferase (AST), alkaline phosphatase (ALP), total protein (TP), albumin (ALB), glucose (GLU), urea nitrogen (BUN), creatinine (CRE), cholesterol (CHO), triglyceride (TG), sodium (Na), chloride (Cl), potassium (K), calcium (Ca), total bile acids (TBA), lactate dehydrogenase (LDH), and creatine kinase (CK). Parameters were analyzed using an automatic clinical analyzer Hitachi 7080 (Hitachi, Ltd., Japan). Serum levels of triiodothyronine (T3), thyroxine (T4), and thyroid stimulating hormone (TSH) were measured using hormone-specific kits provided by the Beijing North Institute of Biological Technology by the radioimmunoassay method.
-
All rats were humanely sacrificed at the end of the study, and a complete necropsy was performed including an examination of the external features of the carcass, external body orifices, the abdominal, thoracic, and cranial cavities, organs, and tissues. Organ weights were obtained for the brain, heart, kidneys, liver, spleen, thymus, ovaries, uterus, testes, epididymis, adrenal glands, and thyroid gland. Paired organs were weighed together. Organ-to-body weight ratios (relative weight) were also calculated. The following tissues (when present) were sampled and fixed in 10% neutral-buffered formalin: brain, heart, lung, liver, kidneys, adrenal glands, spleen, stomach, duodenum, jejunum, ileum, cecum, colon, rectum, thymus, thyroid gland, pituitary gland, urinary bladder, pancreas, ovaries, uterus, testes, epididymis, prostate, seminal vesicles, lymph nodes (cervical and mesenteric lymph nodes and Peyer's patch), and sternum with bone marrow. Organs were embedded in paraffin, sectioned, stained with hematoxylin and eosin, and subjected to microscopic examination. Histopathological examination was performed on all tissues from the control and high-dose groups and the lungs from all groups.
-
Samples of whole blood, liver, kidneys, and testis were collected from five rats of each sex in all groups to determine the Si concentration. The liver, kidneys and testis were freeze dried and digested with a mixture of ultrapure nitric acid and hydrofluoric acid, then the Si content was determined using ICP-AES. The accuracy of the method was checked by standard addition experiment and the recovery calculated. The liver was spiked with silica NPs on the basis of Si content at 25 μg/mL, and the recovery was 92.3% ± 7.1%.
-
Values are expressed as mean ± SD. Organ and body weights, food consumption data, hematological data, serum biochemical data, serum hormone data, and Si contents in organs were analyzed by conducting one-way analysis of variance (ANOVA) using SPSS software (version 17.0). Levene's test was used to assess homogeneity of variances, and comparisons between multiple groups were carried out by Bonferroni's post hoc test when equal variances were assumed or Dunnett's T3 post hoc test when equal variances were not assumed. Results were considered statistically significant at P < 0.05.
-
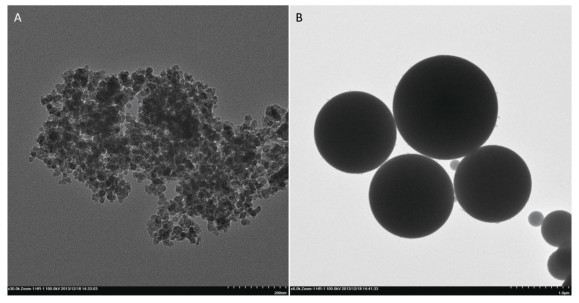
The particles were characterized according to particle size, hydrodynamic size, zeta potential, purity, crystal status, and specific surface area. Figure 1 shows TEM images of the silica NPs and silica MPs. The appearance of silica NPs and silica MPs was approximately spherical. The size of silica NPs and silica MPs were 25.9 ± 3.4 nm and 1087.8 ± 389.6 nm, respectively. Silica NPs tended to aggregate/agglomerate in deionized water, with a hydrodynamic size of 246.6 ± 47.8 nm. The zeta potential of silica NPs and silica MPs were -64.1 mV and -63.0 mV, respectively. The pH value of silica NPs and silica MPs suspensions were 6.7 and 6.4, respectively. The purity of silica NPs and silica MPs were 99.2% and 99.6%, respectively. The crystal structures of silica NPs and silica MPs were both amorphous. The specific surface area of silica NPs and silica MPs were 152.2 m2/g and 4.4 m2/g, respectively.
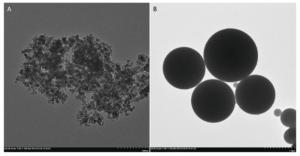
Figure 1. TEM images of silica NPs and silica MPs: (A) silica NPs, magnification 30, 000×, the scale length is 200 nm, (B) silica MPs, magnification 6, 000×, the scale length is 1.0 μm.
-
The dissolution concentrations of silica NPs and silica MPs were 0.010% ± 0.002% and 0.015% ± 0.006%, respectively, in the simulated gastric solution and 0.420% ± 0.007% and 0.361% ± 0.052%, respectively, in the intestinal solution.
-
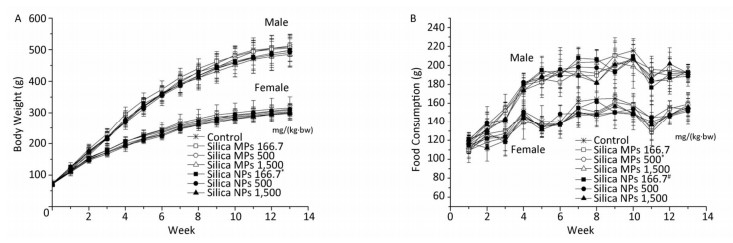
No mortality or treatment related adverse clinical reactions were found during the study. There were no statistically significant differences in the body weights of male rats between the treatment groups and the control group; however, for low-dose silica NPs in female rats, body weight at the fifth week of exposure was lower than that in the control group (Figure 2A). For middle-dose silica MPs in female rats, food consumption at the eighth week was lower than that in the control group. For low-dose silica NPs in male rats, food consumption at the 11th week was lower than that in the low-dose silica MPs group (Figure 2B).
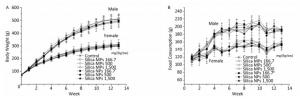
Figure 2. General observations of subchronic oral toxicity of silica NPs and silica MPs in rats. (A) Mean body weights of rats. (B) Mean food consumption of rats. *Significant difference vs. control group, P < 0.05 (body weight of female rats at the fifth week, food consumption of female rats at the eighth week), #Significant difference vs. silica MPs 166.7 mg/(kg·bw) group, P < 0.05 (food consumption of male rats at the 11th week).
-
There were some sporadic, statistically significant changes in hematology and clinical biochemistry parameters (Table 1).
Table 1. Summary of Statistically Significant Hematology and Clinical Biochemical Parameters for Rats after 90 Days Oral Administration of Silica MPs and Silica NPs
Parameters Control Silica MPs, mg/(kg·bw) Silica NPs, mg/(kg·bw) 166.7 500 1, 500 166.7 500 1, 500 Female MCH (pg) 19.1 ± 1.2 18.3 ± 0.7 18.7 ± 0.6 18.5 ± 0.6 18.3 ± 0.6 17.7 ± 1.0* 18.7 ± 0.2 Cl (mmol/L) 120.7 ± 1.8 118.6 ± 2.0 119.6 ± 1.5 121.6 ± 1.1 120.0 ± 1.8 119.0 ± 2.1 118.1 ± 1.4*# Na (mmol/L) 125.1 ± 2.0 120.2 ± 1.2* 121.0 ± 2.5* 123.8 ± 2.7 122.2 ± 2.3* 122.6 ± 1.0 121.6 ± 1.0* T4 (ng/mL) 28.1 ± 6.6 30.8 ± 7.6 28.5 ± 3.9 27.8 ± 7.7 23.7 ± 7.2 32.1 ± 12.9 39.5 ± 6.4*# Male PT (s) 10.0 ± 0.4 10.0 ± 0.3 9.6 ± 0.4 9.9 ± 0.4 10.5 ± 0.5* 9.5 ± 0.3 9.8 ± 0.2 APTT (s) 59.2 ± 3.0 56.5 ± 2.8 58.4 ± 1.9 60.2 ± 1.8 60.1 ± 2.2# 57.3 ± 1.6 57.0 ± 1.9# TP (g/L) 50.9 ± 2.1 49.5 ± 1.7 55.7 ± 3.4* 54.9 ± 2.6* 55.1 ± 1.1*# 54.0 ± 2.4 52.8 ± 3.2 ALB (g/L) 27.0 ± 1.1 26.0 ± 0.9 27.3 ± 1.3 26.8 ± 1.3 26.8 ± 0.9 26.6 ± 1.1 25.3 ± 1.5* Na (mmol/L) 121.8 ± 2.8 121.6 ± 0.9 122.8 ± 2.0 124.0 ± 3.3 124.9 ± 1.5# 122.6 ± 1.5 121.7 ± 1.2 Note.*P < 0.05 as compared with the control group. #P < 0.05 as compared with the silica MPs group. For female rats in the silica NPs middle-dose group, the MCH was significantly lower than that in the control group. For male rats in the silica NPs low-dose group, PT was significantly higher than that in the control group, APTT was significantly higher than that in the silica MPs low-dose group, and for males in the silica NPs high-dose group, APTT was significantly lower than that in the silica MPs high-dose group. For female rats in the silica MPs low-and high-dose groups and the silica NPs low-and middle-dose groups, the level of Na was significantly lower than that in the control group. For females in the silica NPs high-dose group, the level of Cl was significantly lower than that in the control group and silica MPs high-dose group. For male rats in the silica MPs middle-and high-dose group, TP concentration was higher than that in the control group, for males in the silica NPs low-dose group, TP concentration was higher than that in the control and silica MPs low-dose groups, and Na was higher than that in the silica MPs low-dose group. For males in the silica NPs high-dose group, ALB was lower than that in the control group. No significant differences were observed in the serum levels of T3 and TSH. The serum level of T4 in the silica NPs female high-dose group was statistically significantly higher than that in the control group and silica MPs high-dose group.
-
There were no remarkable gross pathological alterations in any of the animals. No statistically significant differences in all absolute organ weights and relative organ weights (organ-to-body weight ratios) in the treatment groups of either males or females were found (Table S1 available in www.besjournal.com).
Table Table S1. Absolute and Relative Organ Weights for Rats after 90 days Oral Administration of Silica MPs and Silica NPs
Parameters Control Silica MPs, mg/(kg·bw) Silica NPs, mg/(kg·bw) 166.7 500 1, 500 166.7 500 1, 500 Female Liver (g) 8.23 ± 1.20 8.03 ± 0.74 7.34 ± 0.48 7.52 ± 1.08 7.39 ± 0.55 7.68 ± 0.83 7.24 ± 0.68 Liver (%) 2.82 ± 0.26 2.83 ± 0.19 2.65 ± 0.17 2.67 ± 0.17 2.73 ± 0.12 2.68 ± 0.21 2.69 ± 0.31 Kidneys (g) 2.03 ± 0.30 2.13 ± 0.22 1.96 ± 0.18 2.00 ± 0.18 2.04 ± 0.08 2.14 ± 0.20 1.94 ± 0.12 Kidneys (%) 0.69 ± 0.08 0.75 ± 0.05 0.71 ± 0.06 0.71 ± 0.03 0.76 ± 0.04 0.75 ± 0.05 0.72 ± 0.07 Spleen (g) 0.63 ± 0.04 0.65 ± 0.06 0.63 ± 0.10 0.63 ± 0.07 0.60 ± 0.08 0.67 ± 0.10 0.66 ± 0.07 Spleen (%) 0.22 ± 0.03 0.23 ± 0.02 0.23 ± 0.04 0.22 ± 0.01 0.22 ± 0.03 0.23 ± 0.03 0.24 ± 0.03 Heart (g) 1.15 ± 0.14 1.13 ± 0.09 1.05 ± 0.06 1.11 ± 0.13 1.09 ± 0.05 1.15 ± 0.13 1.05 ± 0.07 Heart (%) 0.42 ± 0.07 0.40 ± 0.03 0.38 ± 0.03 0.39 ± 0.02 0.40 ± 0.02 0.40 ± 0.04 0.39 ± 0.03 Brain (g) 1.83 ± 0.14 1.81 ± 0.08 1.82 ± 0.12 1.83 ± 0.06 1.86 ± 0.09 1.87 ± 0.07 1.86 ± 0.06 Brain (%) 0.63 ± 0.06 0.64 ± 0.04 0.66 ± 0.06 0.66 ± 0.07 0.69 ± 0.07 0.66 ± 0.04 0.69 ± 0.05 Thymus (g) 0.51 ± 0.12 0.57 ± 0.15 0.50 ± 0.09 0.48 ± 0.10 0.45 ± 0.13 0.52 ± 0.10 0.49 ± 0.11 Thymus (%) 0.18 ± 0.04 0.20 ± 0.04 0.18 ± 0.03 0.17 ± 0.03 0.17 ± 0.04 0.18 ± 0.03 0.18 ± 0.04 Ovaries (g) 0.22 ± 0.03 0.21 ± 0.08 0.20 ± 0.04 0.19 ± 0.05 0.19 ± 0.04 0.20 ± 0.03 0.21 ± 0.04 Ovaries (%) 0.08 ± 0.01 0.07 ± 0.03 0.07 ± 0.01 0.07 ± 0.01 0.07 ± 0.02 0.07 ± 0.01 0.08 ± 0.01 Uterus (g) 0.64 ± 0.13 0.58 ± 0.17 0.59 ± 0.17 0.59 ± 0.16 0.64 ± 0.15 0.68 ± 0.18 0.71 ± 0.16 Uterus (%) 0.22 ± 0.07 0.20 ± 0.06 0.21 ± 0.06 0.21 ± 0.05 0.24 ± 0.06 0.24 ± 0.07 0.27 ± 0.06 Adrenal glands (g) 0.100 ± 0.020 0.104 ± 0.027 0.105 ± 0.039 0.097 ± 0.016 0.101 ± 0.018 0.098 ± 0.016 0.094 ± 0.030 Adrenal glands (%) 0.035 ± 0.008 0.037 ± 0.010 0.038 ± 0.015 0.034 ± 0.004 0.038 ± 0.008 0.034 ± 0.006 0.035 ± 0.011 Thyroid glands (g) 0.022 ± 0.003 0.020 ± 0.002 0.019 ± 0.001 0.022 ± 0.003 0.020 ± 0.001 0.020 ± 0.003 0.021 ± 0.002 Thyroid glands (%) 0.007 ± 0.001 0.007 ± 0.001 0.007 ± 0.001 0.008 ± 0.001 0.007 ± 0.001 0.007 ± 0.001 0.008 ± 0.001 Male Liver (g) 12.60 ± 0.94 12.56 ± 1.11 12.51 ± 1.74 11.45 ± 1.65 11.21 ± 1.88 11.31 ± 1.79 11.20 ± 0.94 Liver (%) 2.71 ± 0.13 2.65 ± 0.14 2.68 ± 0.24 2.60 ± 0.28 2.49 ± 0.22 2.56 ± 0.17 2.50 ± 0.08 Kidneys (g) 3.06 ± 0.20 3.17 ± 0.27 3.11 ± 0.27 3.10 ± 0.29 3.03 ± 0.33 3.02 ± 0.18 2.96 ± 0.25 Kidneys (%) 0.66 ± 0.04 0.67 ± 0.03 0.67 ± 0.06 0.71 ± 0.05 0.68 ± 0.03 0.69 ± 0.06 0.66 ± 0.02 Spleen (g) 0.86 ± 0.13 0.91 ± 0.23 0.81 ± 0.11 0.79 ± 0.09 0.80 ± 0.12 0.83 ± 0.19 0.80 ± 0.15 Spleen (%) 0.18 ± 0.02 0.19 ± 0.04 0.18 ± 0.03 0.18 ± 0.02 0.18 ± 0.02 0.19 ± 0.02 0.18 ± 0.03 Heart (g) 1.66 ± 0.15 1.65 ± 0.19 1.64 ± 0.14 1.58 ± 0.18 1.64 ± 0.15 1.62 ± 0.18 1.64 ± 0.13 Heart (%) 0.36 ± 0.04 0.35 ± 0.02 0.35 ± 0.04 0.36 ± 0.03 0.37 ± 0.04 0.37 ± 0.04 0.37 ± 0.03 Brain (g) 1.92 ± 0.14 2.04 ± 0.03 2.00 ± 0.06 1.98 ± 0.05 1.98 ± 0.14 2.02 ± 0.07 1.99 ± 0.07 Brain (%) 0.42 ± 0.04 0.43 ± 0.02 0.43 ± 0.04 0.45 ± 0.03 0.44 ± 0.04 0.46 ± 0.06 0.45 ± 0.03 Thymus (g) 0.60 ± 0.13 0.68 ± 0.18 0.61 ± 0.18 0.51 ± 0.10 0.49 ± 0.08 0.52 ± 0.18 0.46 ± 0.05 Thymus (%) 0.13 ± 0.02 0.15 ± 0.04 0.13 ± 0.05 0.12 ± 0.02 0.11 ± 0.02 0.12 ± 0.04 0.10 ± 0.01 Testes (g) 3.07 ± 0.49 3.13 ± 0.25 3.10 ± 0.24 3.10 ± 0.19 3.16± 0.21 3.14 ± 0.29 3.05 ± 0.12 Testes (%) 0.66 ± 0.12 0.66 ± 0.05 0.67 ± 0.08 0.71 ± 0.05 0.71± 0.08 0.72 ± 0.08 0.69 ± 0.06 Epididymis (g) 1.28 ± 0.35 1.37 ± 0.14 1.38 ± 0.11 1.38 ± 0.16 1.38 ± 0.17 1.37 ± 0.20 1.40 ± 0.13 Epididymis (%) 0.28 ± 0.07 0.29 ± 0.03 0.30 ± 0.03 0.31 ± 0.05 0.31 ± 0.04 0.31 ± 0.03 0.31 ± 0.03 Adrenal glands (g) 0.080 ± 0.018 0.079 ± 0.025 0.073 ± 0.017 0.078 ± 0.015 0.089 ± 0.020 0.093 ± 0.028 0.079 ± 0.015 Adrenal glands (%) 0.017 ± 0.003 0.017 ± 0.005 0.016 ± 0.004 0.018 ± 0.003 0.020 ± 0.004 0.022 ± 0.007 0.018 ± 0.003 Thyroid glands (g) 0.026 ± 0.002 0.025 ± 0.003 0.024 ± 0.003 0.027 ± 0.003 0.028 ± 0.004 0.026 ± 0.003 0.023 ± 0.002 Thyroid glands (%) 0.006 ± 0.001 0.005 ± 0.001 0.005 ± 0.001 0.006 ± 0.001 0.006 ± 0.001 0.006 ± 0.001 0.005 ± 0.001 The histopathological findings in rats of the control and high-dose groups of silica MPs and silica NPs are summarized in Table 2. The histopathological findings in heart, liver, duodenum, ileum, bladder, and prostate appeared to be incidental, as the frequency and severity of these lesions in silica MPs and silica NPs high-dose groups was comparable with those in the control group. Lesions in these organs included focal myocardial necrosis, mild myocardial fatty degeneration, mild hepatocyte fatty degeneration, hepatocyte spotty necrosis and inflammatory cell infiltrate, epithelial cell autolysis (duodenum and ileum), a small amount of exudate at the mucosal surface of the bladder, interstitial edema, and inflammatory cell infiltrate in the prostate.
Table 2. Histopathological Findings in Rats after 90 Days Oral Administration of Silica MPs and Silica NPs [1, 500 mg/(kg·bw)]
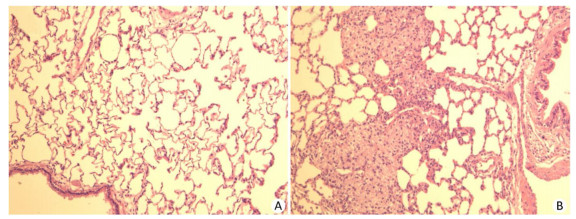
Organs Lesions Control Silica MPs Silica NPs Female Male Female Male Female Male Heart Focal myocardial necrosis 1 0 0 0 0 0 Mild myocardial fatty degeneration 1 0 0 0 0 0 Liver Mild hepatocyte fatty degeneration 6 1 3 1 4 0 Spotty necrosis, inflammatory cell infiltrate 0 0 0 1 0 0 Duodenum Epithelial cell autolysis 3 1 0 0 1 0 Lleum Epithelial cell autolysis 0 0 0 1 0 0 Bladder Small amount of exudate at the mucosal surface 0 1 0 0 0 0 Prostate Interstitial edema, inflammatory cell infiltrate - 0 - 1 - 0 Interstitial inflammatory cell infiltrate - 0 - 0 - 1 Histopathological findings in the lungs of rats in all groups are summarized in Table 3. In the lungs, lesions including mild widening of the alveolar septum, spotty foreign body granulomas, and focal epithelial cell proliferation were found, the frequencies in the high-dose silica groups were higher than those in the control group. Therefore, we conducted a histopathological examination of the lungs in the low-and middle-dose groups of silica MPs and silica NPs. In these lower groups, focal epithelial cell proliferation and foreign body granulomas were also found. The histopathological changes in the lungs are shown in Figure 3.
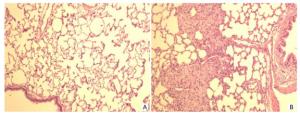
Figure 3. Histopathological findings in the lungs. (A) Control lung. (B) Foreign body granulomas in the lung, tissues of rats stained with H & E ×100.
Table 3. Histopathological Findings for Lungs of Rats in All Groups after 90 Days Oral Administration of Silica MPs and Silica NPs
Organs Lesions Control Silica MPs Silica NPs Low Middle High Low Middle High F M F M F M F M F M F M F M Lung Mild alveolar septum widening 0 1 0 0 0 0 1 0 0 0 0 1 3 0 Foreign body granulomas 0 0 0 3 3 0 0 3 1 2 1 1 1 0 Focal epithelial cell proliferation 0 0 2 0 2 4 0 3 2 1 1 3 2 1 Note. F, Female; M, Male. -
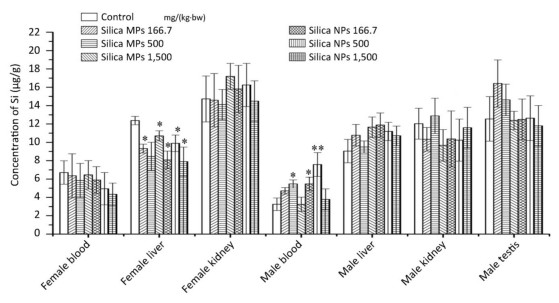
The distribution of Si in the blood, liver, kidneys and testis is shown in Figure 4. In the liver of female rats, the Si concentrations in the low-and high-dose silica MPs groups, and in the low-, middle-, and high-dose silica NPs groups were lower than those in the control group. In the blood of male rats, the Si concentrations in the middle-dose silica MPs group and low-dose silica NPs group were higher than those in the control group, and the Si concentration in the middle-dose silica NPs group was higher than those in the control and middle-dose silica MPs groups.
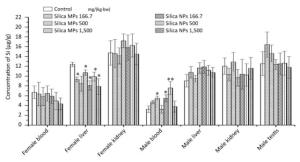
Figure 4. The concentrations of Si in tissues of rats after 90 days oral administration of silica NPs and silica MPs. *Significant difference vs. control, P < 0.05. **Significant difference vs. control and silica MPs middle-dose group, P < 0.05.
-
The increasing application of nanoscience and nanotechnologies in consumer products has raised concerns about the potential risks to human health. It is necessary and essential to identify the oral toxicity of silica NPs; however, only a few studies exist, and the difference in toxicity between silica NPs and non-nanoform compounds has not been investigated. In the present study, we selected silica particles of different sizes (25.9 ± 3.4 nm and 1087.8 ± 389.6 nm), and the silica MPs were used as the non-nanoform compound. We investigated the subchronic toxicity of silica NPs and silica MPs and examined the difference in toxicity between nanoform and non-nanoform silica.
The physicochemical properties of the particles should be completely characterized to provide additional information whenever a toxicity study is performed[17]. Herein, we conducted a characterization of the properties of silica NPs and silica MPs. The two precipitated amorphous silicas without surface modification had comparable purity and zeta potential, but the particle size and specific surface area were different. Dynamic light scattering determination indicated the presence of aggregation/agglomeration upon dispersing of silica NPs in water, but the secondary particles were still smaller than silica MPs. The hydrodynamic size of silica MPs was not provided because the suspension is relatively less stable, and the particles were settling at the bottom, which may have resulted in inaccurate measurements; therefore, the suspensions should be shaken frequently during gavage administration to ensure uniform dosing. The dissolution of particles in simulated gastric and intestinal fluids was low and not related to the particle size, which is consistent with other in vitro digestion studies[18-20]. Lee et al. also evaluated the in vivo solubility of particles in gastric fluid by orally administering a single dose of 500 mg/kg to rats. The solubility was 0.19% ± 0.11% and 0.13% ± 0.09% for nano-SiO2 and bulk SiO2, respectively[20].
In our present study, no deaths or abnormal clinical signs were observed in any of the groups. The differences in body weight and food consumption between the silica NPs and silica MPs groups were considered to be of no clinical significance, as the changes were not dose-responsive and did not occur continuously. No significant changes in necropsy findings were observed. Organ weights and organ weight/body weight showed no significant difference.
Silica NPs have been reported to decrease platelet counts and change the plasma levels of PT, APTT, and FIB in rodents via intravenous and intranasal exposure, indicating a potential blood coagulation disorder[21-23]; however, the effect was not found in our study, probably due to the oral exposure route we used. For hematology analysis, the changes in MCH level in silica NPs mid-dose group females, PT level in silica NPs low-dose group males, and APTT levels in silica NPs low-dose and high-dose group males were not considered to be of toxicological significance because the values were not dose-responsive and were within the laboratory's historical normal range of controls.
The clinical biochemical analysis indicated some isolated statistically significant changes in treatment groups. The changes in the Na levels of silica MPs low-and middle-dose and silica NPs low-and high-dose group females, Cl levels of silica NPs high-dose group females, TP levels of silica NPs low-dose group males, Na levels of silica NPs low-dose males, and ALB levels of silica NPs high-dose males were not dose-responsive and within the laboratory's historical normal range of controls and hence were not considered to be of toxicological significance. In the guidance on the risk assessment of the application of nanoscience and nanotechnologies in the food and feed chain published by the European Food Safety Authority, it proposed that additional parameters of endocrine-related endpoints should be included in a repeated-dose 90-day oral toxicity study in rodents for ingested engineered nanomaterials[10], so we determined serum thyroid hormones of T3, T4, and TSH in our study. The T4 levels were increased in female rats treated with high-dose silica NPs. The production and release of thyroid hormones by the thyroid gland is regulated by pituitary secretion of TSH and hypothalamic secretion of TRH, and this regulatory control of circulating thyroid hormone concentrations is commonly referred to as the hypothalamic-pituitary-thyroid axis[24]. Since the changes in T4 levels were not dose-responsive, and there were no changes in TSH levels, thyroid gland weight, or the histopathology of the thyroid and pituitary glands, the T4 changes were not considered to be of toxicological significance.
Microscopic changes in the heart, liver, duodenum, ileum, bladder, and prostate were randomly distributed among different groups and within the range of normal background lesions. These changes were considered incidental and reflected the usual individual variability without any correlation to the treatment. Focal epithelial cell proliferation and foreign body granulomas were found in the lungs in all silica groups. The incidence in females and males in the treatment groups was not dose-related, and the frequency and severity of lung lesions in silica NPs groups were higher than those in the control group but comparable with those in the silica MPs groups. The higher incidence of lung lesions in silica groups should be related to silica particles, because it has been reported that pulmonary exposure to silica and silica NPs could induce inflammation, pneumocyte hyperplasia, and granuloma formation in the lungs of rodents[25-27]; however, there has been no report to date about these lesions in studies via the oral route. Until now, only one study showed higher Si levels in the lungs, when colloidal silica NPs (20 nm and 100 nm) were orally administered to rats, and the increases in Si concentrations in the kidneys and liver were much higher. Transmission electron microscopy analysis confirmed the presence of Si in particulate form in the liver and kidneys[28]. Unfortunately, the lungs were not preserved for Si content detection in our study, but data from the liver, kidneys, blood, and testis showed no significant increase. Overall, we speculate that the lesions in lung were induced by silica particles, but it is uncertain whether silica particles were absorbed from the gastrointestinal tract and entered the lungs or whether silica particles entered the lungs via gavage administration.
The Si concentrations in the livers of female rats administered silica MPs and silica NPs were lower than those in the control group, and the change had no toxicological significance. The Si concentration in the blood of the low-dose silica NPs group was higher than that in the control group, the Si concentrations in the blood of the middle-dose silica MPs and silica NPs groups were higher than that in the control group, but the changes were not considered to be of toxicological significance, because they were not dose-responsive. The results of Si concentrations indicated no absorption, which was consistent with previous studies[29, 30]. There were also some studies indicating low absorption of silica NPs into the blood circulation[19, 20, 31] and accumulation in the organs. Silica was reported to accumulate in the spleens of rats after they received SAS by gavage for 84 days[32]. In another study, mesoporous silica NPs were absorbed into the intestinal tract and persisted in the livers of mice[33]. The kidneys, liver, lungs, and spleen were found to be the target organs when colloidal silica NPs (20 nm and 100 nm) were orally administered to rats[28].
Some of the studies reporting on oral toxicity in rats or mice indicated potential liver toxicity. In a feeding study in mice, when nano-or micron-sized silica particles were incorporated into feed at a proportion of 1% for 10 weeks, an elevation in the serum ALT level and a fatty liver pattern was observed[29]. In another study, when rats received silica NPs by daily oral gavage for 4 weeks, the ALT and AST levels were higher, and small amounts of inflammatory cell infiltration and hepatic cell adipose degeneration in the liver were observed in the 500 mg/kg dose group[34]. In the third study, after 84 days of exposure to NM-202 (fumed SAS) by gavage, histopathological analysis showed an increased incidence of liver fibrosis accompanied by a moderate increase in the expression of fibrosis-related genes in liver samples[32]. Several other studies showed no adverse effect of silica NPs. In a 13-week toxicity study in rats, silica NPs did not induce dose-related changes in a number of parameters associated with systemic toxicity up to 975.9 mg/kg[30]. In another 90-day oral toxicity study in rats, colloidal silica NPs did not cause any toxic effects, and the NOAEL was 2, 000 mg/kg[35]. Roland et al. investigated the effects of four SAS with or without surface functionalization using a 28-day oral exposure to rats at a dose of 1, 000 mg/(kg·day), finding neither local nor systemic effects[36]. The reason for the different results may be due to variations in the test materials. As shown by van der Zande, the tissue distribution and toxicity of two silica preparations were different under the same experimental conditions[32]. In a study of silica NPs with different sizes and electrostatic charges, the results indicated that different sized and charged silica NPs caused differential immunotoxicity[37].
SAS can be produced via the wet route (precipitated silica, silica gel) or the thermal route (pyrogenic silica). Silicas with varying sizes or forms (powder or suspension) were used in different studies, making it difficult to compare the outcomes of different studies. The European Commission's Joint Research Centre (JRC) launched a repository for representative SAS test materials including precipitated silica (NM-200, NM-201, NM-204) and pyrogenic silica (NM-202, NM-203). Results from studies indicated that pyrogenic silica may be more toxic than precipitated silica. In an in vitro study, compared with precipitated SAS, pyrogenic SAS caused greater oxidative stress and stronger proinflammatory effects in macrophages[38]. The genotoxicity of SAS indicated a weak increase in the percentage of micronucleated cells in the colon of rats with the two pyrogenic SAS at the lowest dose but not with precipitated SAS[39]. In a prenatal toxicity and a two-generation reproduction toxicity study with NM-200 (precipitated silica), the NOAELs were all 1, 000 mg/(kg·bw·day) (the highest dose tested)[40, 41], but in a 90-day repeated-dose oral administration in rats, significant changes in reproductive parameters were observed to be caused by NM-203 (pyrogenic silica)[42].
In this study, hydrophilic precipitated silica NPs or silica MPs were used, and no adverse effects were observed. The lack of a difference in toxicity demonstrated between silica NPs and silica MPs may be related to aggregation/agglomeration, as shown by the result from dynamic light scattering determination: silica NPs in water exhibited aggregation/agglomeration, although the secondary particles were smaller than silica MPs. Moreover, silica NPs would probably be further aggregated/agglomerated in the gastrointestinal tract. In the in vitro simulated digestion study by Peters et al., large silica agglomerates are formed during the gastric digestion stage[43]. Sakai-Kato et al. incubated silica NPs in the fasted-state and fed-state simulated gastric and intestinal fluids and observed that silica NPs agglomerated in fed-state intestinal fluids[44].
In conclusion, the results of our present study demonstrate that there were no dose-related changes upon administration of silica NPs and silica MPs compared with the control group, when given orally for 90 days with dosages from 166.7 up to 1, 500 mg/(kg·bw·day). There was no absorption of silica from the gastrointestinal tract into the blood, liver, kidneys, and testis. There was no difference in toxicity or Si distribution between silica NPs and silica MPs. Further studies should be carried out to elaborate the reason for lung lesion formation in the silica NPs and silica MPs groups.
doi: 10.3967/bes2018.025
-
Abstract:
Objective To investigate the subchronic oral toxicity of silica nanoparticles (NPs) and silica microparticles (MPs) in rats and to compare the difference in toxicity between two particle sizes. Methods Sprague-Dawley rats were randomly divided into seven groups:the control group; the silica NPs low-, middle-, and high-dose groups; and the silica MPs low-, middle-, and high-dose groups[166.7, 500, and 1, 500 mg/(kg·bw·day)]. All rats were gavaged daily for 90 days, and deionized water was administered to the control group. Clinical observations were made daily, and body weights and food consumption were determined weekly. Blood samples were collected on day 91 for measurement of hematology and clinical biochemistry. Animals were euthanized for necropsy, and selected organs were weighed and fixed for histological examination. The tissue distribution of silicon in the blood, liver, kidneys, and testis were determined. Results There were no toxicologically significant changes in mortality, clinical signs, body weight, food consumption, necropsy findings, and organ weights. Differences between the silica groups and the control group in some hematological and clinical biochemical values and histopathological findings were not considered treatment related. The tissue distribution of silicon was comparable across all groups. Conclusion Our study demonstrated that neither silica NPs nor silica MPs induced toxicological effects after subchronic oral exposure in rats. -
Key words:
- Subchronic toxicity /
- Silica nanoparticles /
- Silica microparticles /
- Rats
-
Figure 1. TEM images of silica NPs and silica MPs: (A) silica NPs, magnification 30, 000×, the scale length is 200 nm, (B) silica MPs, magnification 6, 000×, the scale length is 1.0 μm.
Figure 2. General observations of subchronic oral toxicity of silica NPs and silica MPs in rats. (A) Mean body weights of rats. (B) Mean food consumption of rats. *Significant difference vs. control group, P < 0.05 (body weight of female rats at the fifth week, food consumption of female rats at the eighth week), #Significant difference vs. silica MPs 166.7 mg/(kg·bw) group, P < 0.05 (food consumption of male rats at the 11th week).
Figure 3. Histopathological findings in the lungs. (A) Control lung. (B) Foreign body granulomas in the lung, tissues of rats stained with H & E ×100.
Figure 4. The concentrations of Si in tissues of rats after 90 days oral administration of silica NPs and silica MPs. *Significant difference vs. control, P < 0.05. **Significant difference vs. control and silica MPs middle-dose group, P < 0.05.
Table 1. Summary of Statistically Significant Hematology and Clinical Biochemical Parameters for Rats after 90 Days Oral Administration of Silica MPs and Silica NPs
Parameters Control Silica MPs, mg/(kg·bw) Silica NPs, mg/(kg·bw) 166.7 500 1, 500 166.7 500 1, 500 Female MCH (pg) 19.1 ± 1.2 18.3 ± 0.7 18.7 ± 0.6 18.5 ± 0.6 18.3 ± 0.6 17.7 ± 1.0* 18.7 ± 0.2 Cl (mmol/L) 120.7 ± 1.8 118.6 ± 2.0 119.6 ± 1.5 121.6 ± 1.1 120.0 ± 1.8 119.0 ± 2.1 118.1 ± 1.4*# Na (mmol/L) 125.1 ± 2.0 120.2 ± 1.2* 121.0 ± 2.5* 123.8 ± 2.7 122.2 ± 2.3* 122.6 ± 1.0 121.6 ± 1.0* T4 (ng/mL) 28.1 ± 6.6 30.8 ± 7.6 28.5 ± 3.9 27.8 ± 7.7 23.7 ± 7.2 32.1 ± 12.9 39.5 ± 6.4*# Male PT (s) 10.0 ± 0.4 10.0 ± 0.3 9.6 ± 0.4 9.9 ± 0.4 10.5 ± 0.5* 9.5 ± 0.3 9.8 ± 0.2 APTT (s) 59.2 ± 3.0 56.5 ± 2.8 58.4 ± 1.9 60.2 ± 1.8 60.1 ± 2.2# 57.3 ± 1.6 57.0 ± 1.9# TP (g/L) 50.9 ± 2.1 49.5 ± 1.7 55.7 ± 3.4* 54.9 ± 2.6* 55.1 ± 1.1*# 54.0 ± 2.4 52.8 ± 3.2 ALB (g/L) 27.0 ± 1.1 26.0 ± 0.9 27.3 ± 1.3 26.8 ± 1.3 26.8 ± 0.9 26.6 ± 1.1 25.3 ± 1.5* Na (mmol/L) 121.8 ± 2.8 121.6 ± 0.9 122.8 ± 2.0 124.0 ± 3.3 124.9 ± 1.5# 122.6 ± 1.5 121.7 ± 1.2 Note.*P < 0.05 as compared with the control group. #P < 0.05 as compared with the silica MPs group.  下载: 导出CSV
Table S1. Absolute and Relative Organ Weights for Rats after 90 days Oral Administration of Silica MPs and Silica NPs
Parameters Control Silica MPs, mg/(kg·bw) Silica NPs, mg/(kg·bw) 166.7 500 1, 500 166.7 500 1, 500 Female Liver (g) 8.23 ± 1.20 8.03 ± 0.74 7.34 ± 0.48 7.52 ± 1.08 7.39 ± 0.55 7.68 ± 0.83 7.24 ± 0.68 Liver (%) 2.82 ± 0.26 2.83 ± 0.19 2.65 ± 0.17 2.67 ± 0.17 2.73 ± 0.12 2.68 ± 0.21 2.69 ± 0.31 Kidneys (g) 2.03 ± 0.30 2.13 ± 0.22 1.96 ± 0.18 2.00 ± 0.18 2.04 ± 0.08 2.14 ± 0.20 1.94 ± 0.12 Kidneys (%) 0.69 ± 0.08 0.75 ± 0.05 0.71 ± 0.06 0.71 ± 0.03 0.76 ± 0.04 0.75 ± 0.05 0.72 ± 0.07 Spleen (g) 0.63 ± 0.04 0.65 ± 0.06 0.63 ± 0.10 0.63 ± 0.07 0.60 ± 0.08 0.67 ± 0.10 0.66 ± 0.07 Spleen (%) 0.22 ± 0.03 0.23 ± 0.02 0.23 ± 0.04 0.22 ± 0.01 0.22 ± 0.03 0.23 ± 0.03 0.24 ± 0.03 Heart (g) 1.15 ± 0.14 1.13 ± 0.09 1.05 ± 0.06 1.11 ± 0.13 1.09 ± 0.05 1.15 ± 0.13 1.05 ± 0.07 Heart (%) 0.42 ± 0.07 0.40 ± 0.03 0.38 ± 0.03 0.39 ± 0.02 0.40 ± 0.02 0.40 ± 0.04 0.39 ± 0.03 Brain (g) 1.83 ± 0.14 1.81 ± 0.08 1.82 ± 0.12 1.83 ± 0.06 1.86 ± 0.09 1.87 ± 0.07 1.86 ± 0.06 Brain (%) 0.63 ± 0.06 0.64 ± 0.04 0.66 ± 0.06 0.66 ± 0.07 0.69 ± 0.07 0.66 ± 0.04 0.69 ± 0.05 Thymus (g) 0.51 ± 0.12 0.57 ± 0.15 0.50 ± 0.09 0.48 ± 0.10 0.45 ± 0.13 0.52 ± 0.10 0.49 ± 0.11 Thymus (%) 0.18 ± 0.04 0.20 ± 0.04 0.18 ± 0.03 0.17 ± 0.03 0.17 ± 0.04 0.18 ± 0.03 0.18 ± 0.04 Ovaries (g) 0.22 ± 0.03 0.21 ± 0.08 0.20 ± 0.04 0.19 ± 0.05 0.19 ± 0.04 0.20 ± 0.03 0.21 ± 0.04 Ovaries (%) 0.08 ± 0.01 0.07 ± 0.03 0.07 ± 0.01 0.07 ± 0.01 0.07 ± 0.02 0.07 ± 0.01 0.08 ± 0.01 Uterus (g) 0.64 ± 0.13 0.58 ± 0.17 0.59 ± 0.17 0.59 ± 0.16 0.64 ± 0.15 0.68 ± 0.18 0.71 ± 0.16 Uterus (%) 0.22 ± 0.07 0.20 ± 0.06 0.21 ± 0.06 0.21 ± 0.05 0.24 ± 0.06 0.24 ± 0.07 0.27 ± 0.06 Adrenal glands (g) 0.100 ± 0.020 0.104 ± 0.027 0.105 ± 0.039 0.097 ± 0.016 0.101 ± 0.018 0.098 ± 0.016 0.094 ± 0.030 Adrenal glands (%) 0.035 ± 0.008 0.037 ± 0.010 0.038 ± 0.015 0.034 ± 0.004 0.038 ± 0.008 0.034 ± 0.006 0.035 ± 0.011 Thyroid glands (g) 0.022 ± 0.003 0.020 ± 0.002 0.019 ± 0.001 0.022 ± 0.003 0.020 ± 0.001 0.020 ± 0.003 0.021 ± 0.002 Thyroid glands (%) 0.007 ± 0.001 0.007 ± 0.001 0.007 ± 0.001 0.008 ± 0.001 0.007 ± 0.001 0.007 ± 0.001 0.008 ± 0.001 Male Liver (g) 12.60 ± 0.94 12.56 ± 1.11 12.51 ± 1.74 11.45 ± 1.65 11.21 ± 1.88 11.31 ± 1.79 11.20 ± 0.94 Liver (%) 2.71 ± 0.13 2.65 ± 0.14 2.68 ± 0.24 2.60 ± 0.28 2.49 ± 0.22 2.56 ± 0.17 2.50 ± 0.08 Kidneys (g) 3.06 ± 0.20 3.17 ± 0.27 3.11 ± 0.27 3.10 ± 0.29 3.03 ± 0.33 3.02 ± 0.18 2.96 ± 0.25 Kidneys (%) 0.66 ± 0.04 0.67 ± 0.03 0.67 ± 0.06 0.71 ± 0.05 0.68 ± 0.03 0.69 ± 0.06 0.66 ± 0.02 Spleen (g) 0.86 ± 0.13 0.91 ± 0.23 0.81 ± 0.11 0.79 ± 0.09 0.80 ± 0.12 0.83 ± 0.19 0.80 ± 0.15 Spleen (%) 0.18 ± 0.02 0.19 ± 0.04 0.18 ± 0.03 0.18 ± 0.02 0.18 ± 0.02 0.19 ± 0.02 0.18 ± 0.03 Heart (g) 1.66 ± 0.15 1.65 ± 0.19 1.64 ± 0.14 1.58 ± 0.18 1.64 ± 0.15 1.62 ± 0.18 1.64 ± 0.13 Heart (%) 0.36 ± 0.04 0.35 ± 0.02 0.35 ± 0.04 0.36 ± 0.03 0.37 ± 0.04 0.37 ± 0.04 0.37 ± 0.03 Brain (g) 1.92 ± 0.14 2.04 ± 0.03 2.00 ± 0.06 1.98 ± 0.05 1.98 ± 0.14 2.02 ± 0.07 1.99 ± 0.07 Brain (%) 0.42 ± 0.04 0.43 ± 0.02 0.43 ± 0.04 0.45 ± 0.03 0.44 ± 0.04 0.46 ± 0.06 0.45 ± 0.03 Thymus (g) 0.60 ± 0.13 0.68 ± 0.18 0.61 ± 0.18 0.51 ± 0.10 0.49 ± 0.08 0.52 ± 0.18 0.46 ± 0.05 Thymus (%) 0.13 ± 0.02 0.15 ± 0.04 0.13 ± 0.05 0.12 ± 0.02 0.11 ± 0.02 0.12 ± 0.04 0.10 ± 0.01 Testes (g) 3.07 ± 0.49 3.13 ± 0.25 3.10 ± 0.24 3.10 ± 0.19 3.16± 0.21 3.14 ± 0.29 3.05 ± 0.12 Testes (%) 0.66 ± 0.12 0.66 ± 0.05 0.67 ± 0.08 0.71 ± 0.05 0.71± 0.08 0.72 ± 0.08 0.69 ± 0.06 Epididymis (g) 1.28 ± 0.35 1.37 ± 0.14 1.38 ± 0.11 1.38 ± 0.16 1.38 ± 0.17 1.37 ± 0.20 1.40 ± 0.13 Epididymis (%) 0.28 ± 0.07 0.29 ± 0.03 0.30 ± 0.03 0.31 ± 0.05 0.31 ± 0.04 0.31 ± 0.03 0.31 ± 0.03 Adrenal glands (g) 0.080 ± 0.018 0.079 ± 0.025 0.073 ± 0.017 0.078 ± 0.015 0.089 ± 0.020 0.093 ± 0.028 0.079 ± 0.015 Adrenal glands (%) 0.017 ± 0.003 0.017 ± 0.005 0.016 ± 0.004 0.018 ± 0.003 0.020 ± 0.004 0.022 ± 0.007 0.018 ± 0.003 Thyroid glands (g) 0.026 ± 0.002 0.025 ± 0.003 0.024 ± 0.003 0.027 ± 0.003 0.028 ± 0.004 0.026 ± 0.003 0.023 ± 0.002 Thyroid glands (%) 0.006 ± 0.001 0.005 ± 0.001 0.005 ± 0.001 0.006 ± 0.001 0.006 ± 0.001 0.006 ± 0.001 0.005 ± 0.001
下载: 导出CSV
Table 2. Histopathological Findings in Rats after 90 Days Oral Administration of Silica MPs and Silica NPs [1, 500 mg/(kg·bw)]
Organs Lesions Control Silica MPs Silica NPs Female Male Female Male Female Male Heart Focal myocardial necrosis 1 0 0 0 0 0 Mild myocardial fatty degeneration 1 0 0 0 0 0 Liver Mild hepatocyte fatty degeneration 6 1 3 1 4 0 Spotty necrosis, inflammatory cell infiltrate 0 0 0 1 0 0 Duodenum Epithelial cell autolysis 3 1 0 0 1 0 Lleum Epithelial cell autolysis 0 0 0 1 0 0 Bladder Small amount of exudate at the mucosal surface 0 1 0 0 0 0 Prostate Interstitial edema, inflammatory cell infiltrate - 0 - 1 - 0 Interstitial inflammatory cell infiltrate - 0 - 0 - 1
下载: 导出CSV
Table 3. Histopathological Findings for Lungs of Rats in All Groups after 90 Days Oral Administration of Silica MPs and Silica NPs
Organs Lesions Control Silica MPs Silica NPs Low Middle High Low Middle High F M F M F M F M F M F M F M Lung Mild alveolar septum widening 0 1 0 0 0 0 1 0 0 0 0 1 3 0 Foreign body granulomas 0 0 0 3 3 0 0 3 1 2 1 1 1 0 Focal epithelial cell proliferation 0 0 2 0 2 4 0 3 2 1 1 3 2 1 Note. F, Female; M, Male.
下载: 导出CSV
-
[1] OECD. SIDS Dossier on Synthetic Amorphous Silica and Silicates. 2004. https: //hpvchemicals. oecd. org/UI/handler. axd?id=81d3694a-a582-4fa8-a8f2-f771459b67ed, [2018-01-25]. [2] Dekkers S, Krystek P, Peters RJ, et al. Presence and risks of nanosilica in food products. Nanotoxicology, 2011; 5, 393-405. doi: 10.3109/17435390.2010.519836 [3] Dekkers S, Bouwmeester H, Bos PM, et al. Knowledge gaps in risk assessment of nanosilica in food:evaluation of the dissolution and toxicity of different forms of silica. Nanotoxicology, 2013; 7, 367-77. doi: 10.3109/17435390.2012.662250 [4] World Health Organization (WHO). Evaluation of the Joint FAO/WHO Expert Committee on Food Additives (JECFA). Silicon dioxide, amorphous. 1985. http://apps.who.int/foodadditives-contaminants-jecfa-database/chemical.aspx?chemID=2462, [2018-01-25]. [5] Athinarayanan J, Periasamy VS, Alsaif MA, et al. Presence of nanosilica (E551) in commercial food products:TNF-mediated oxidative stress and altered cell cycle progression in human lung fibroblast cells. Cell Biol Toxicol, 2014; 30, 89-100. doi: 10.1007/s10565-014-9271-8 [6] Hansen SF, Michelson ES, Kamper A, et al. Categorization framework to aid exposure assessment of nanomaterials in consumer products. Ecotoxicology, 2008; 17, 438-47. doi: 10.1007/s10646-008-0210-4 [7] Lim JH, Sisco P, Mudalige TK, et al. Detection and characterization of SiO2 and TiO2 naostructures in dietary supplements. J Agric Food Chem, 2015; 63, 3144-52. doi: 10.1021/acs.jafc.5b00392 [8] Xu L, Liu Y, Bai R, et al. Applications and toxicological issues surrounding nanotechnology in the food industry. Pure Appl Chem, 2010; 82, 349-72. doi: 10.1351/PAC-CON-09-05-09 [9] Tarantini A, Huet S, Jarry G, et al. Genotoxicity of synthetic amorphous silica nanoparticles in rats following short-term exposure. Part 1:oral route. Environ Mol Mutagen, 2015; 56, 218-27. doi: 10.1002/em.v56.2 [10] EFSA. Scientific opionion on Guidance on the risk assessment of the applicaiton of nanoscience and nanotechnologies in the food and feed chain. EFSA Journal, 2011; 9, 2140. doi: 10.2903/j.efsa.2011.2140 [11] Food and Agriculture Organization of the United Nations and World Health Organization (FAO and WHO). FAO/WHO technical paper: State of the art on the initiatives and activities relevant to risk assessment and risk management of nanotechnologies in the food and agriculture sectors. Rome. FAO/WHO. 2013; 1-46. [12] Food and Drug Administration (FDA). Guidance for Industry: Assessing the effects of significant manufacturing process changes, including emerging technologies, on the safety and regulatory status of food ingredients and food contact substaces, including food ingredients that are color additives. USA FDA. 2014; 1-29. [13] OECD. OECD Environment, Health and Safety Publications Series on the Safety of Manufactured Nanomaterials. No. 25: Guidance Manual for the Testing of Manufactured Nanomaterials: OECD's sponsorship programme; first revision. Organisation for Economic Cooperation and Development. Paris, 2010; 1-92. [14] Ruby MV, Davis A, Schoof R, et al. Estimation of Lead and Arsenic Bioavailability Using a Physiologically Based Extraction Test. Environ Sci Technol, 1996; 30, 422-30. doi: 10.1021/es950057z [15] Cave MR, Wragg J, Palumbo B, et al. Measurement of the Bioaccessibility of Arsenic in UK Soils. R & D Technical Report P5-062/TR02. Environment Agency, Bristol, 2003; 1-108. doi: 10.1007/s10653-010-9324-8 [16] OECD. OECD guidelines for the testing of chemicals, Section 4:Health Effects, Test No. 408:Repeated Dose 90-day Oral Toxicity Study in Rodents. Organisation for Economic Cooperation and Development, 1998; 1-10. http://www.oecd.org/env/ehs/testing/section4-health-effects.htm [17] Magnuson BA, Jonaitis TS, Card JW. A brief review of the occurrence, use, and safety of food-related nanomaterials. J Food Sci, 2011; 76, R126-33. doi: 10.1111/jfds.2011.76.issue-6 [18] Gerloff K, Pereira DIA, Faria N, et al. Influence of simulated gastro-intestinal conditions on particle-induced cytotoxicity and interleukin-8 regulation in differentiated and undifferentiated Caco-2 cells. Nanotoxicology, 2013; 7, 353-66. doi: 10.3109/17435390.2012.662249 [19] Kim MK, Lee JA, Jo MR, et al. Bioavailability of Silica, Titanium Dioxide, and Zinc Oxide Nanoparticles in Rats. J Nanosci Nanotechnol, 2016; 16, 6580-6. doi: 10.1166/jnn.2016.12350 [20] Lee JA, Kim MK, Song JH, et al. Biokinetics of food additive silica nanoparticles and their interactions with food components. Colloids Surf B Biointerfaces, 2017; 150, 384-92. doi: 10.1016/j.colsurfb.2016.11.001 [21] Liu X, Sun J. Time-course effects of intravenously administrated silica nanoparticles on blood coagulation and endothelial function in rats. J Nanosci Nanotechnol, 2013; 13, 222-8. doi: 10.1166/jnn.2013.6910 [22] Nabeshi H, Yoshikawa T, Matsuyama K, et al. Amorphous nanosilicas induce consumptive coagulopathy after systemic exposure. Nanotechnology, 2012; 23, 045101. doi: 10.1088/0957-4484/23/4/045101 [23] Yoshida T, Yoshioka Y, Tochigi S, et al. Intranasal exposure to amorphous nanosilica particles could activate intrinsic coagulation cascade and platelets in mice. Part Fibre Toxicol, 2013; 10, 41. doi: 10.1186/1743-8977-10-41 [24] Menjo M, Yamaguchi S, Murata Y, et al. Responsiveness to thyroid hormone is enhanced in rat hepatocytes cultured as spheroids compared with that in monolayers:altered responsiveness to thyroid hormone possibly involves complex formed on thyroid hormone response elements. Thyroid, 1999; 9, 959-67. doi: 10.1089/thy.1999.9.959 [25] Cho WS, Choi M, Han BS, et al. Inflammatory mediators induced by intratracheal instillation of ultrafine amorphous silica particles. Toxicol Lett, 2007; 175, 24-33. doi: 10.1016/j.toxlet.2007.09.008 [26] Freire J, Ajona D, de Biurrun G, et al. Silica-induced chronic inflammation promotes lung carcinogenesis in the context of an immunosuppressive microenvironment. Neoplasia, 2013; 15, 913-24. doi: 10.1593/neo.13310 [27] Langley R, Mishra N, Peña-Philippides J, et al. Granuloma formation induced by low-dose chronic silica inhalation is associated with an anti-apoptotic response in Lewis rats. J Toxicol Environ Health A, 2010; 73, 669-83. doi: 10.1080/15287390903578521 [28] Lee JA, Kim MK, Paek HJ, et al. Tissue distribution and excretion kinetics of orally administered silica nanoparticles in rats. Int J Nanomedicine, 2014; 9(Suppl 2), 251-60. [29] So SJ, Jang IS, Han CS. Effect of micro/nano silica particle feeding for mice. J Nanosci Nanotechnol, 2008; 8, 5367-71. doi: 10.1166/jnn.2008.1347 [30] Yun JW, Kim SH, You JR, et al. Comparative toxicity of silicon dioxide, silver and iron oxide nanoparticles after repeated oral administration to rats. J Appl Toxicol, 2015; 35, 681-93. doi: 10.1002/jat.v35.6 [31] Paek HJ, Chung HE, Lee JA, et al. Quantitative Determination of Silica Nanoparticles in Biological Matrices and Their Pharmacokinetics and Toxicokinetics in Rats. Sci Adv Mater, 2014; 6, 1605-10. doi: 10.1166/sam.2014.1817 [32] van der Zande M, Vandebriel RJ, Groot MJ, et al. Sub-chronic toxicity study in rats orally exposed to nanostructured silica. Part Fibre Toxicol, 2014; 11, 8. doi: 10.1186/1743-8977-11-8 [33] Fu C, Liu T, Li L, et al. The absorption, distribution, excretion and toxicity of mesoporous silica nanoparticles in mice following different exposure routes. Biomaterials, 2013; 34, 2565-75. doi: 10.1016/j.biomaterials.2012.12.043 [34] Lin B, Xi Z, Zhang Y, et al. Primary study on the hepatotoxicity and nephrotoxicity of rats induced by three kinds of nanomaterials. Journal of Hygiene Research, 2008; 37, 651-3. [35] Kim YR, Lee SY, Lee EJ, et al. Toxicity of colloidal silica nanoparticles administered orally for 90 days in rats. Int J Nanomedicine, 2014; 9(Suppl 2), 67-78. [36] Buesen R, Landsiedel R, Sauer UG, et al. Effects of SiO2, ZrO2, and BaSO4 nanomaterials with or without surface functionalization upon 28-day oral exposure to rats. Arch Toxicol, 2014; 88, 1881-906. doi: 10.1007/s00204-014-1337-0 [37] Kim JH, Kim CS, Ignacio RMC, et al. Immunotoxicity of silicon dioxide nanoparticles with different sizes and electrostatic charge. Int J Nanomedicine, 2014; 9(Suppl 2), 183-93. [38] Cristo LD, Movia D, Bianchi MG, et al. Proinflammatory Effects of Pyrogenic and Precipitated Amorphous Silica Nanoparticles in Innate Immunity Cells. Toxicol Sci, 2016; 150, 40-53. doi: 10.1093/toxsci/kfv258 [39] Tarantini A, Huet S, Jarry G, et al. Genotoxicity of synthetic amorphous silica nanoparticles in rats following short-term exposure. Part 1:oral route. Environ Mol Mutagen, 2015; 56, 218-27. doi: 10.1002/em.v56.2 [40] Hofmann T, Schneider S, Wolterbeek A, et al. Prenatal toxicity of synthetic amorphous silica nanomaterial in rats. Reprod Toxicol, 2015; 56, 141-6. doi: 10.1016/j.reprotox.2015.04.006 [41] Wolterbeek A, Oosterwijk T, Schneider S, et al. Oral two-generation reproduction toxicity study with NM-200 synthetic amorphous silica in Wistar rats. Reprod Toxicol, 2015; 56, 147-54. doi: 10.1016/j.reprotox.2015.03.006 [42] Narciso L, Tassinari R, Cordelli E, et al. Effects of synthetic amorphous silica nanoparticle (NM-203) on male and female reproductive systems following 90-days repeated-dose oral administration in rat. Reprod Toxicol, 2016; 64, 42-3. https://www.researchgate.net/profile/Patrizia_Eleuteri2 [43] Peters R, Kramer E, Oomen AG, et al. Presence of nano-sized silica during in vitro digestion of foods containing silica as a food additive. Acs Nano, 2012; 6, 2441-51. doi: 10.1021/nn204728k [44] Sakai-Kato K, Hidaka M, Un K, et al. Physicochemical properties and in vitro intestinal permeability properties and intestinal cell toxicity of silica particles, performed in simulated gastrointestinal fluids. Biochim Biophys Acta, 2014; 1840, 1171-80. doi: 10.1016/j.bbagen.2013.12.014 -

 点击查看大图
计量
- 文章访问数: 2046
- HTML全文浏览量: 666
- PDF下载量: 168
- 被引次数: 0

 Quick Links