

 下载:
下载:

-
Flu A viruses are single-stranded negative-sense RNA viruses with eight gene segments. To date, 16 haemagglutinin (H1–H16) subtypes and 9 neuraminidase (N1-N9) subtypes of Flu A viruses have been detected in avian species, with additional H17N10 and H18N11 subtypes found in bats[1]. Avian influenza viruses (AIVs) are influenza A viruses, and they are classified as high, medium, or low/non pathogenic according to their pathogenicity to chickens or turkeys. AIVs rarely cross the species barrier to infect humans and other mammals, but they can infect humans if genetic recombination or mutation occurs. Additionally, some subtypes, such as H5N1, H7N9, H5N6, and H10N8, can also infect humans directly.
AIVs are globally distributed, and they continuously challenge the poultry industry and human health. Cases of human infections caused by AIVs have been frequently reported since the first case of human infection with H7N7 subtype of AIV in 1959[2]. The first highly pathogenic H5N1 virus was isolated from a farm goose in Guangdong province, China in 1996, and the first death case, which was attributed to AIV-induced respiratory disease, was caused by H5N1 infection in Hongkong, China in 1997[3, 4]. Since 2003, there have been 861 confirmed human infection cases caused by H5N1, reported as at 24 June 2019, and 455 of the cases were fatal (https://www.who.int/influenza/human_animal_interface/H5N1_cumulative_table_archives/en/). Almost all the cases of H5N1 infection in humans have been attributed to close contact with infected live or dead birds, or H5N1-contaminated environments. The virus does not infect humans easily, and spread from person to person appears to be unusual. H9N2 is globally the most prevalent low pathogenic avian influenza virus in poultry[5]. It primarily causes a mild upper respiratory disease, and does not cause or only rarely causes severe pneumonia often seen with other AIVs such as H5N1 or H7N9. It was first reported in chickens in Guangdong Province of China in the mid-1990s and subsequently detected throughout the country.
H7N9 viruses have attracted wide attention since 2013 because they have caused severe human infections[6]. H7N9 is a subtype of influenza A viruses that have been detected in birds in the past. It had not been previously reported in either animals or humans until it was detected in China in March 2013[7]. A total of 1,567 laboratory-confirmed cases of human infection with H7N9 viruses, including at least 615 deaths, were reported to World Health Organization from 2013 to March 2018. Most of the cases of human infection with H7N9 were associated with recent exposure to live poultry or potentially contaminated environments, especially markets where live birds are sold. This virus does not appear to transmit easily from person to person, and sustained human-to-human transmission has not been reported. In contrast to H5N1, H7N9 has low pathogenicity to chickens and causes mild or no clinical disease in poultry. But highly pathogenic H7N9 strains was detected in China in 2017, causing human infections and disease in chickens[8-11].
China is recognized as a geographical area with suitable conditions for the emergence of novel influenza viruses[12-15]. New strains of AIVs are widely distributed in China, occasionally causing human infections. According to previous reports, a high prevalence of H9 and H5 AIVs can be found in poultry species regardless of location, but H7 viruses are rarely detected on poultry farms and seem to be predominant among birds in live poultry markets (LPMs)[12, 16]. There have been five seasonal H7N9 epidemics observed in China since 2013[13]. A sudden increase in the number of H7N9 cases was observed during the fifth wave of infection between 2016 and 2017[17, 18]. Compared with earlier waves of infection, further geographic spread of the virus was observed in the fifth wave and a highly pathogenic AIV, H7N9, emerged in China in 2017[8, 10, 11]. Henan province is located in the central China, and compared with previous years, the number of H7N9 cases increased in Henan in 2017. During routine monitoring and case investigation, we investigated the distribution of avian influenza viruses in possible H7N9-exposed environments to analyze the context of this epidemic.
-
A total of 27 H7N9 human cases were confirmed in Henan province from 2016 to 2017 including 2 imported human cases and 25 local human cases, and 11 of the cases were fatal. Of the 25 local cases, 24 had a history of exposure to live poultry and 15 of them had H7N9 virus detected in the exposed live poultry market. Specifically, the 25 local cases mainly occurred in 10 cities between January and June of 2017 (Figures 1-2), and no cases were reported at other times. Among 27 persons with confirmed H7N9 virus infection, the median age was 49 years (range, 15-80), 85.19% were male, and 55.56% were rural residents. Furthermore, 92.59% (25/27) had a history of exposure to live poultry, 6 of them were poultry workers, 8 were farmers, and 4 were restaurant staff. There were 2 imported cases from Hubei and Zhejiang provinces.
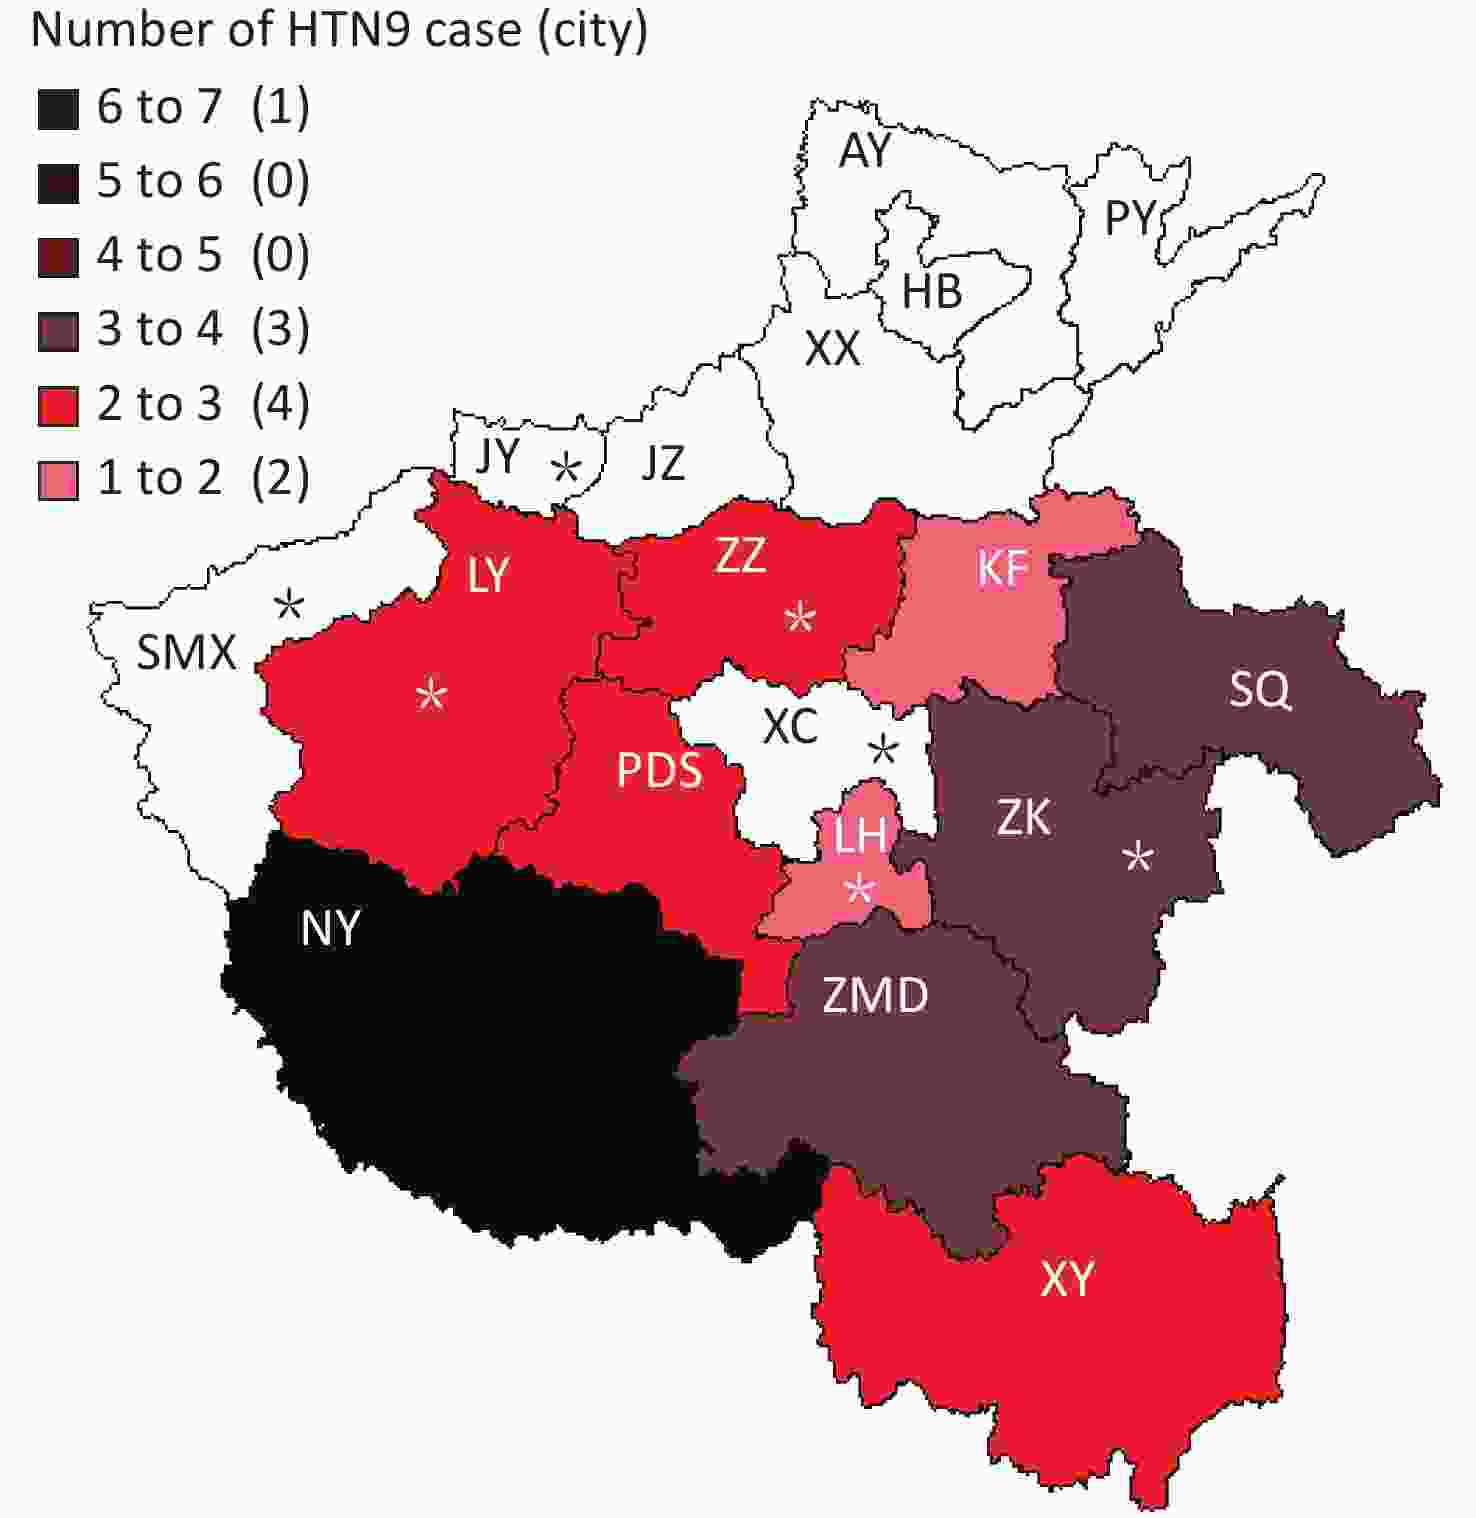
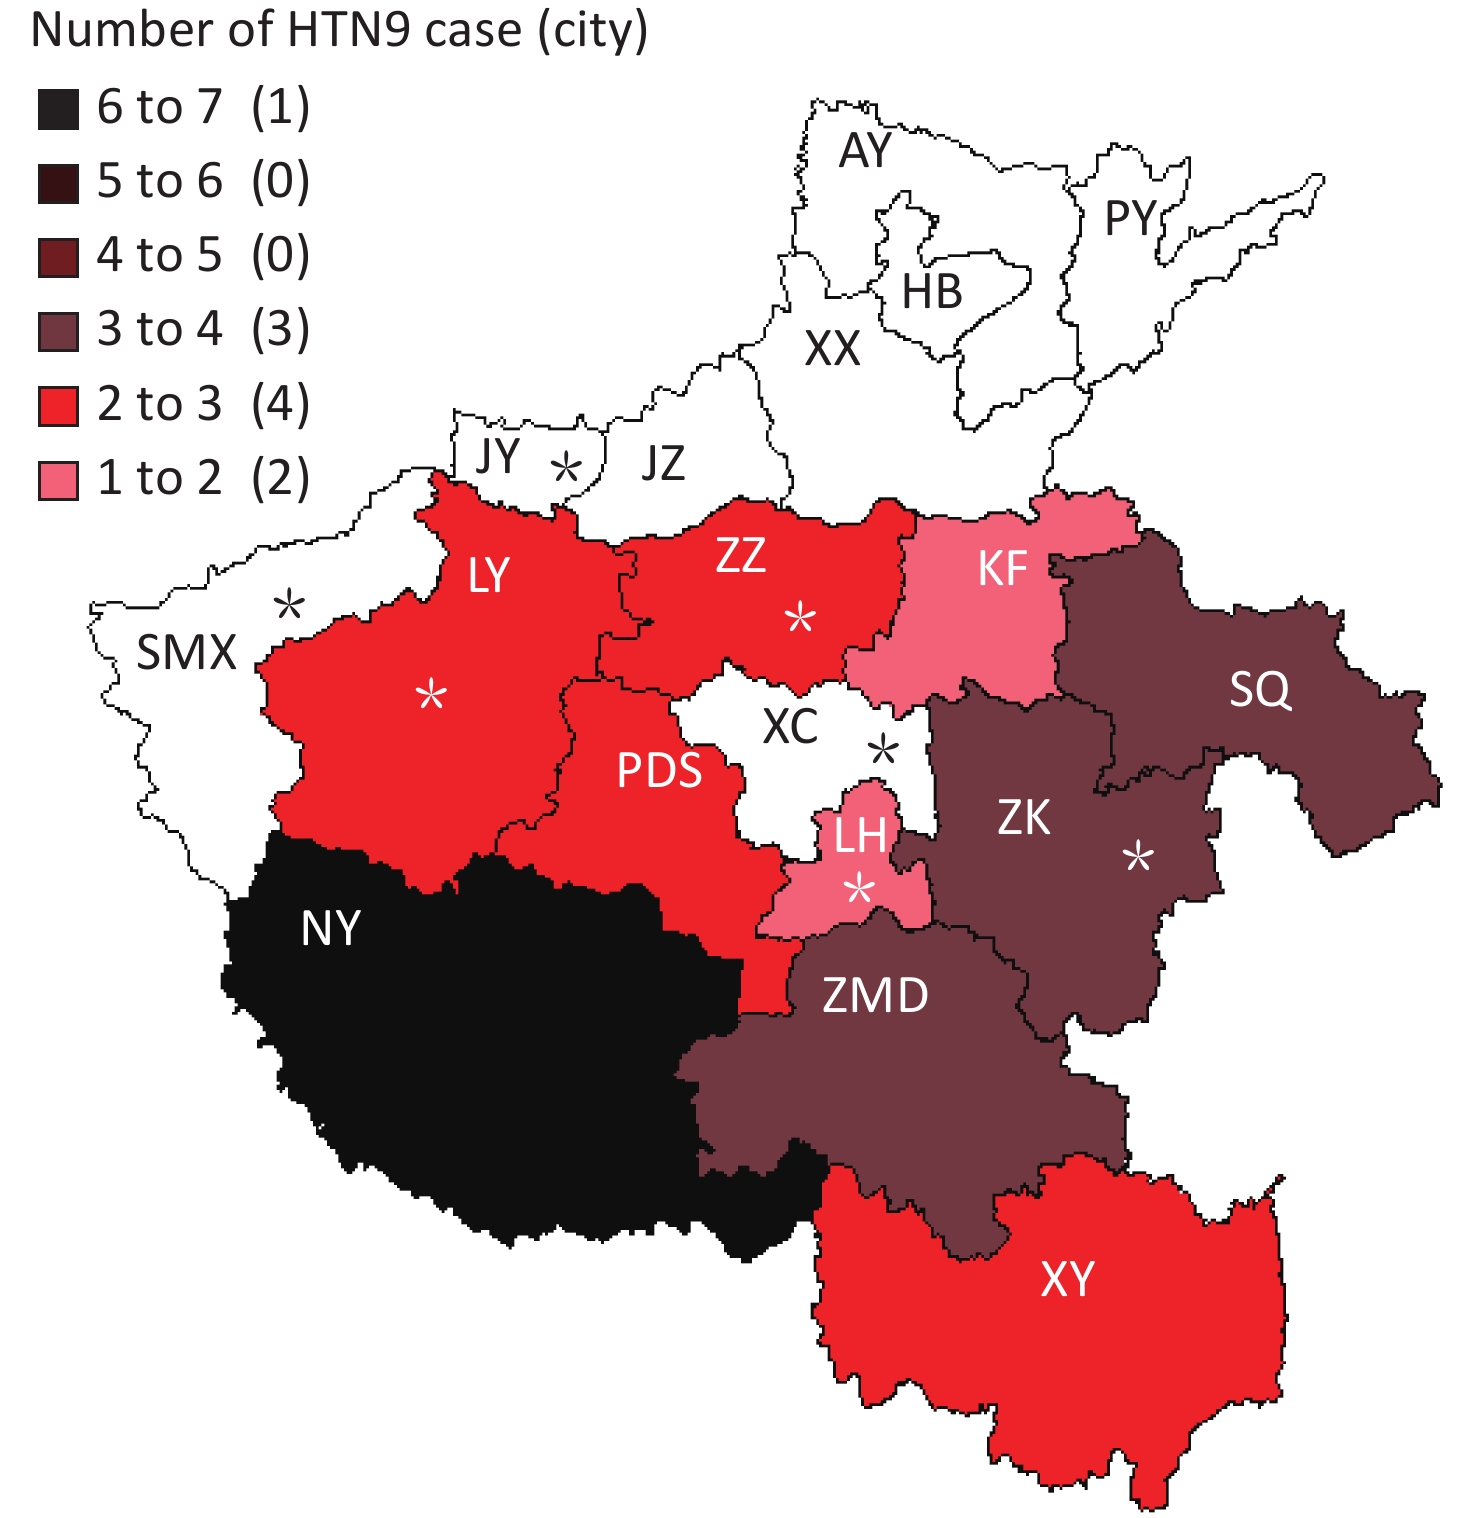
Figure 1. Routine surveillance sites and regional distribution of local H7N9 cases in Henan in 2017 Figure was made using the PHGIS software version 1.02. *: routine surveillance site.
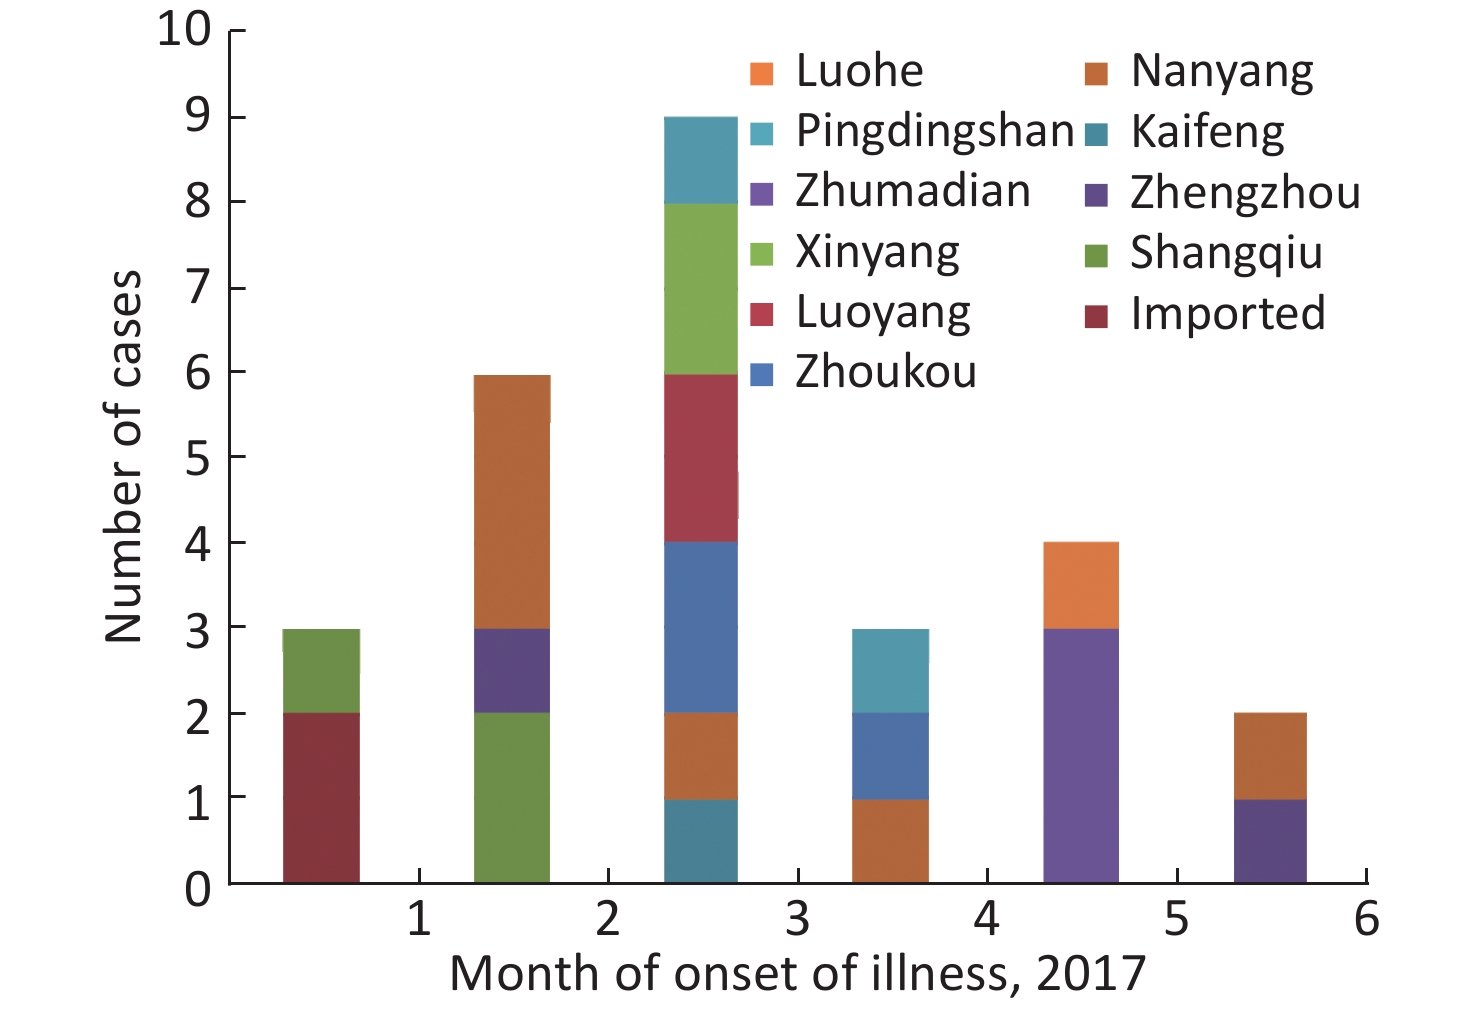
Figure 2. Month of onset of illness of 27 patients with confirmed H7N9 virus infection, according to cities in Henan province, 2017
-
Henan province has 18 municipal administrative regions and there are regular monitoring points in 7 of the regions to carry out environmental surveillance of AIVs. The 25 local H7N9 cases were from 10 cities, with 4 of them being regular monitoring sites. Nanyang (NY) city located in the southwest of Henan and near the border with Hubei Province reported 6 cases, which is the highest number of cases of H7N9. Shangqiu (SQ) as well as Zhumadian (ZMD) and Zhoukou (ZK) cities reported three H7N9 human cases. Zhengzhou (ZZ) city, Luoyang (LY), Xinyang (XY), and Pingdingshan (PDS) cities reported two H7N9 human cases, and Kaifeng (KF) and Luohe (LH) cities reported one H7N9 human case. There was no H7N9 human case reported in 6 cities in the north of Henan and 1 city in the west of Henan. It is worth mentioning that all the H7N9 human cases reported were from the south of the Yellow River. There are 6 cities in Henan Province located north of the Yellow River, and no H7N9 human case was reported in these cities.
-
All the H7N9 cases were reported in the first half of 2017, and no case was reported in 2016 and the last half of 2017. The first case was reported on January 11 and the last on June 7. The highest number of cases (9) was reported in March followed by the number recorded in February (6) (Figure 2).
-
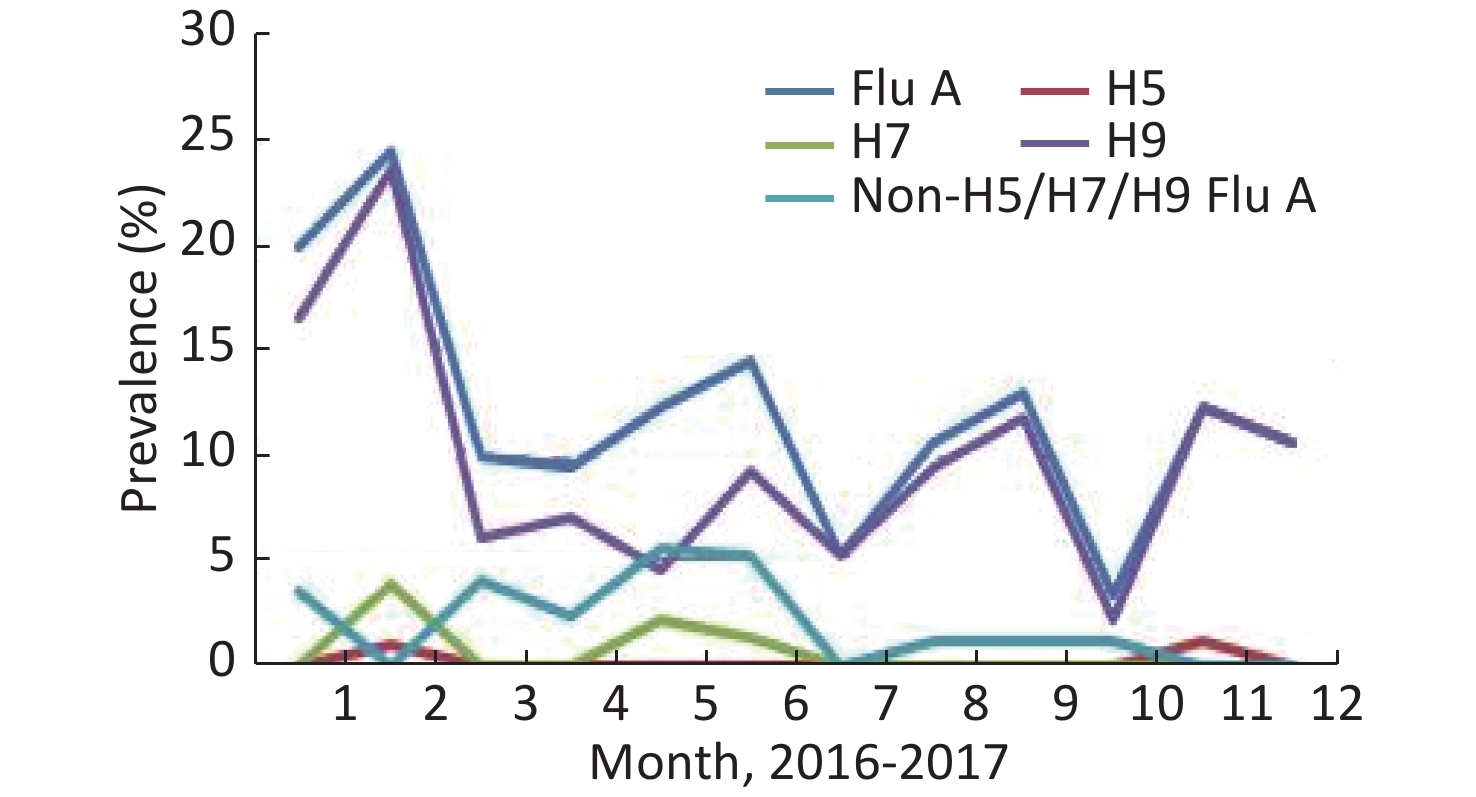
A total of 1,045 samples were collected by routine surveillance of poultry environments, and at least 35 specimens were collected per month. The prevalence of Flu A and H9 subtypes had a similar trend from January to December, while those of non-H5/H7/H9 Flu A (H5/H7/H9-negative but influenza A positive) differed (Figure 3). H5 was detected in only two samples collected in February and November. All the H7-positive specimens were detected in the first half of 2017, 4 in February, 2 in May, and 1 in June. There were 518 samples collected in 2016, 42 (8.11%) were Flu A positive, 29 (5.6%) were H9 positive, and no H7- and H5-positive samples were detected. A total of 527 samples were collected in 2017, 87 (16.51%) were positive for Flu A, and the positive rates of H5, H7, and H9 were 0.38%, 1.33%, and 14.42%, respectively (Table 1). In contrast, the positive rate of H7 was as high as 21.17% in possible H7N9 cases-exposed environments, and the positive rate of each subtype increased markedly— 47.56%, 6.19%, 33.88%, and 5.86% for Flu A, H5, H9, and non-H5/H7/H9 Flu A, respectively (Table 1).
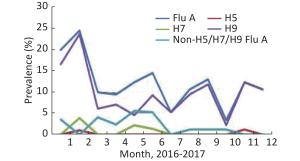
Figure 3. Prevalence of AIVs in routine surveillance sites in 2016-2017
Table 1. Temporal distribution of AIVs in environmental samples
Type of specimen source Sample year Number of positive sample n (%) Flu A H5 H7 H9 Non-H5/H7/H9 Flu A Routine surveillance specimens 2016 42 (8.11) 0 (0) 0 (0) 29 (5.60) 13 (2.51) 2017 87 (16.51) 2 (0.38) 7 (1.33) 76 (14.42) 8 (1.52) Total 129 (12.34) 2 (0.19) 6 (0.67) 105 (10.05) 21 (2.01) H7N9 cases-related specimens 2017 146 (47.56) 19 (6.19) 65 (21.17) 104 (33.88) 18 (5.86) -
A total of 1,045 samples were collected from routine surveillance of poultry-related environments and 307 samples from H7N9-contaminated environments. For routine surveillance, 67.27% (703/1,025) samples were collected from LPMs, and 342 samples from poultry slaughtering plants, poultry scale farm, free-range poultry, and wetland habitat. For routine monitoring, 18.21% (128/703) samples were positive for Flu A in LPMs, and only 1 sample was positive for H9 in other 342 samples. Furthermore, the positive rates of H5, H7, H9, and non-H5/H7/H9 Flu A were 0.28%, 1%, 14.79%, and 2.99% in live poultry markets. H9 was the main avian influenza subtype (10.05%) in routine surveillance, and only 1 sample was H7 positive. Samples collected from H7N9-exposed live poultry markets had higher AIVs positive rates than those from routine surveillance sites, with prevalence values of 54.84% (136/248) for Flu A, 7.66% (19/248) for H5, 19.37% (55/248) for H7, 41.94% (104/248) for H9, and 7.26% (18/248) for non-H5/H7/H9 Flu A (Table 1), with H9 as the main avian influenza. One patient, who worked at a live poultry farm, was diagnosed with H7N9 infection. A total of 39 environmental specimens were collected from the chicken farm where this patient worked, and 25.64% (10/39) of the samples were positive for H7, and no H5 or H9 was detected. Interestingly, 20 samples collected from 2 H7N9 patient's home, none was positive for Flu A.
-
The data from Table 2 showed that 96% (264/275) of Flu A-positive samples were from live poultry markets. Hence, we analyzed the positive rates of AIVs in different types of samples from live poultry markets (Table 3). The detection rate of Flu A in poultry plucker swabs was the highest, with 40% (4/10) for routine surveillance sites and 81.08% (30/37) for H7N9 cases-exposed environments. H9 was detected in all the different types of specimens, with the highest (66.67%) and lowest positive rates in drinking water of H7N9 cases exposure environment and that of the monitoring sites, respectively. H7 was detected in all the different types of specimens from H7N9 cases-exposed environments, and in fecal swabs, poultry cages swabs, and poultry plucker swabs from monitoring sites. The highest H7 positive rate, 45% (9/20), was observed in sewage samples followed by 43.24% (16/37) in poultry plucker swabs, and both types samples were from H7N9 cases-exposed environments. In routine monitoring, the prevalence of H5 was low, as only 2 were positive out of 703 sewage samples and cutting board swabs in live poultry markets. On the contrary, 19 of 295 samples, which are from the four types of specimens, were positive for H5.
Table 2. Number of positive of AIVs in different environments, Henan, 2016–2017
Type of environment Number of
samplesNumber of positive sample n (%) Flu A H5 H7 H9 Non-H5/H7/H9 Flu A Routine surveillance
sitesLive poultry market 703 128 (18.21) 2 (0.28) 7 (1.00) 104 (14.79) 21 (2.99) Others 342 1 (0.29) 0 (0) 0 (0) 1 (0.29) 0 (0) Total 1,045 129 (12.34) 2 (0.19) 7 (0.67) 105 (10.05) 21 (2.01) H7N9 case exposure
environmentLive poultry market 248 136 (54.84) 19 (7.66) 55 (19.37) 104 (41.94) 18 (7.26) Patient's house 20 0 (0) 0 (0) 0 (0) 0 (0) 0 (0) Live poultry farm 39 10 (25.64) 0 (0) 10 (25.64) 0 (0) 0 (0) Total 307 146 (47.56) 19 (6.19) 65 (21.17) 104 (33.88) 18 (5.86) Table 3. Positive rates of AIVs in different sample types from live poultry markets
Types of environment Types of samples Number of samplesl
samplesPercentages (%) (Number of positive samples) Flu A H5 H7 H9 Non-H5/H7/H9 Flu A Routine surveillance
sitesFecal swabs 274 14.96 (41) 0 (0) 1.46 (4) 12.04 (33) 2.55 (7) Poultry cages swabs 153 24.84 (38) 0 (0) 1.31 (2) 22.22 (34) 0.65 (1) Drinking water samples 75 13.33 (10) 0 (0) 0 (0) 10.67 (8) 2.67 (2) Sewage samples 134 17.16 (23) 0.75 (1) 0 (0) 11.19 (15) 5.22 (7) Poultry plucker swabs 10 40 (4) 0 (0) 10 (1) 30 (3) 0 (0) Cutting board swabs 57 21.05 (12) 1.75 (1) 0 (0) 19.30 (11) 1.75 (1) H7N9 cases-exposed
environmentFecal swabs 72 40.28 (29) 6.94 (5) 20.83 (15) 34.72 (25) 2.78 (2) Poultry cages swabs 46 41.30 (19) 2.17 (1) 6.52 (3) 36.96 (17) 4.35 (2) Drinking water samples 9 77.78 (7) 0 (0) 33.33 (3) 66.67 (6) 0 (0) Sewage samples 20 75.00 (15) 30.00 (6) 45.00 (9) 55.00 (11) 5.00 (1) Poultry plucker swabs 37 81.08 (30) 16.22 (6) 43.24 (16) 59.46 (22) 10.81 (4) Cutting board swabs 25 56.00 (14) 4.00 (1) 8.00 (2) 32.00 (8) 16.00 (4) Others 39 53.85 (21) 0 (0) 17.95 (7) 38.46 (15) 10.26 (4) -
H9 was the main AIV in routine monitoring sites, and hence, we analyzed the mixed infections of AIVs in LPMs-related human H7N9 infection. The rate of mixed infections by H9 and H5/H7 was 43.27% (45/104), by H5 and H7/H9 was 89.47% (17/19), and by H7 and H5/H9 was 81.82% (45/55) (Table 1 and Table 4). In addition, the mixed infection of H7 and H9 was 78.18% (43/55) of H7-positive samples and 41.34% (43/104) of H9-positive samples.
Table 4. Mixed infections of AIVs in LPMs related with H7N9 cases
Type of mixed infection Number Percentages of H5-positive samples Percentages of H7-positive samples Percentages of H9-positive samples H7+H9 43 − 78.18 41.34 H5+H9 15 78.95 − 14.42 H5+H7 15 78.95 27.27 − H5+H7+H9 13 68.42 23.64 12.50 -
Henan, located in central China, has a large population, and the demand for poultry and its products including eggs is large. In Henan, poultry farming industry is developed, transportation is convenient, and trade is frequent. Since 2013, H7N9 viruses have caused five waves of human infection in China. However, in Henan, there were only 4 cases of H7N9 infection diagnosed in 2013, and there was no other H7N9 case reported until 2017. In order to assess the risk of human infections, surveillance on AIVs in poultry-related environments has been routinely conducted year-round in Henan 2013. H7 was not detected in the monitoring sites from 2014 to 2016, when there were no H7N9 cases reported. What caused the surge in the number of human H7N9 cases in 2017? Perhaps we can find some clues by comparing the detection of AIVs in H7N9 cases-exposed environments with that in the routine monitoring sites.
The detection rate of AIVs in H7N9 cases-exposed environment was much higher than that of conventional monitoring sites (Table 2). Out of all the H7N9 cases-exposed environments, LPMs had the highest number of AIVs. Almost all the AIVs were detected from LPMs and all 7 H7-positive environmental specimens were collected from the LPMs in routine monitoring. The most serious area of AIVs contamination was the LPMs[12], which is unquestionable, as it is also evidenced by the history of exposure of live poultry markets in most cases. It must be pointed out that the supply of poultry in the urban and rural LPMs is more complicated, and may be transported by vendor from all over the country. Some live poultry vendors told us that their live poultry were from H7N9 epidemic provinces, but unfortunately we were not able to collect all the data on the source of the H7N9-positive live poultry sold in LPMs. Hence, we believe that the closure of LPMs may be effective in controlling the incidence of AIVs infection in humans at the local level[17], but to some extent, it may accelerate the spread of AIVs to free areas. Moreover, previous studies[9, 19, 20] suggested that LPM interventions cannot completely halt H7N9 virus persistence and dissemination, highlighting the epidemic risk to regions of fewer H7N9 cases. After all, this measure would increase the number of illegal transactions, and force traders to export poultry, such as to rural market instead of urban LPM or LPMs in other areas. We speculate that, during the fifth wave, H7N9 cases were highly sporadic, the proportion of rural cases increased, and the proportion of urban cases decreased, possibly due to illicit trading and live poultry sales across provinces. Hence, after the fifth wave, more control measures were adopted by the government to strengthen the regulation of live poultry transportation and farms such as the implementation of centralized slaughtering, cold chain transportation, and chilled supply.
In addition, our data also shows that February was usually the month with the highest detection rate of AIVs, and the sudden increase in human H7N9 cases also occurred from the Chinese New Year. We speculate that this may be related to the Chinese New Year being at the end of January or early February of the annual solar calendar. Some researchers have classified AIVs infection in humans as a behavioral and ecological infectious disease[21]. During the Chinese New Year, population migration and the demand for poultry and eggs are higher than other times of the year, which increases the transportation and trade of poultry. We collected 223 specimens from free-range (backyard) poultry in Henan in 2013 and 2017; and it is remarkable that no AIV was detected (data not shown). All the free-range poultry mostly started from eggs or chicks by the free-range households. They are free-range, have low population density, and have limited contact with the poultry from other areas. Previous data[16] showed that free-range poultry has the lowest viral prevalence and diversity. We also collected 20 samples from the house of one H7N9 patient, and no AIV was detected.
H9, as avian low-pathogenic AIV, has long been prevalent in various environments, and it can cause mixed infections with other subtypes of AIV, which is one of the risk factors for human cases of avian influenza. We know that H9N2 viruses provided the novel reassortant's internal genes of the novel human H7N9 influenza virus[7], which may have been facilitated by a high mixed infection rate. Moreover, except for H7N9, the recently emerged reassortant AIVs, such as H10N8[22, 15] and H5N2[14] subtypes found in domestic poultry[5], appear to be related to the widespread H9N2 viruses. Hence, more attention should be paid to H9N2, which is prevalent and can cause mixed infections with other subtype AIVs. The prevalence and variation of H9N2 influenza virus in avian-related environments could provide an important early warning of the emergence of novel reassortants with pandemic potential[23, 24].
-
This research was approved by the Institutional Review Board (2017-ky-025-01) at Henan Center for Disease Control and Prevention (HN CDC), and this study was carried out in accordance with the approved guidelines. Written informed consents for the use of clinical samples were obtained from all the patients. The study was carried out according to the Declaration of Helsinki.
-
Henan province has 18 municipal administrative regions, and we had regular monitoring points in 7 of the regions to survey environmental AIVs contamination in Henan. From 2016 to 2017, different forms of environmental samples were collected monthly from the 7 monitoring points in Henan. In addition, we also collected specimens from possible H7N9 cases-exposed sites upon the report of H7N9 cases. Real-time-polymerase chain reaction (Jiangsu Bioperfectus Technologies) analysis was adopted to detect the nucleic acid of influenza A (Flu A), H5, H7, and H9 viruses from all the samples.
-
All the H7N9 human cases were reported to HN CDC. H7N9 human cases were confirmed by clinical specimens positive for H7N9 nucleic acid at the local CDC. Clinical and epidemiological information were also collected by local CDC. Statistical analyses were performed using SPSS 17.0 to describe epidemiological features, including demographic characteristics, gender and age distribution, seasonal variation, clustering, and geographic distribution.
-
We sincerely acknowledge the contributions of all the centers for disease control and prevention in Henan to this study.
-
XH and HM designed the study. HM, RW, YN, JS, DL, YL, YD, HW, and XL performed the study. HM analyzed the data and wrote the first draft of the manuscript. HM, ZW, and BX revised the manuscript.
-
None declared.
doi: 10.3967/bes2019.101
Distribution of Avian Influenza A Viruses in Poultry-Related Environment and Its Association with Human Infection in Henan, 2016 to 2017
-
Abstract:
Objective To survey avian influenza A viruses (AIVs) in the environment and explore the reasons for the surge in human H7N9 cases. Methods A total of 1,045 samples were collected from routine surveillance on poultry-related environments and 307 samples from human H7N9 cases-exposed environments in Henan from 2016 to 2017. The nucleic acids of influenza A (Flu A), H5, H7, and H9 subtypes were detected by real-time polymerase chain reaction. Results A total of 27 H7N9 cases were confirmed in Henan from 2016 to 2017, 24 had a history of live poultry exposure, and 15 had H7N9 virus detected in the related live poultry markets (LPMs). About 96% (264/275) Flu A positive-environmental samples were from LPMs. H9 was the main AIV subtype (10.05%) from routine surveillance sites with only 1 H7-positive sample, whereas 21.17% samples were H7-positive in H7N9 cases-exposed environments. Samples from H7N9 cases-exposed LPMs (47.56%) had much higher AIVs positive rates than those from routine surveillance sites (12.34%). The H7+H9 combination of mixed infection was 78.18% (43/55) of H7-positive samples and 41.34% (43/104) of H9-positive samples. Conclusion The contamination status of AIVs in poultry-related environments is closely associated with the incidence of human infection caused by AIVs. Therefore, systematic surveillance of AIVs in LPMs in China is essential for the detection of novel reassortant viruses and their potential for interspecies transmission. -
Figure 1. Routine surveillance sites and regional distribution of local H7N9 cases in Henan in 2017 Figure was made using the PHGIS software version 1.02. *: routine surveillance site.
Figure 2. Month of onset of illness of 27 patients with confirmed H7N9 virus infection, according to cities in Henan province, 2017
Table 1. Temporal distribution of AIVs in environmental samples
Type of specimen source Sample year Number of positive sample n (%) Flu A H5 H7 H9 Non-H5/H7/H9 Flu A Routine surveillance specimens 2016 42 (8.11) 0 (0) 0 (0) 29 (5.60) 13 (2.51) 2017 87 (16.51) 2 (0.38) 7 (1.33) 76 (14.42) 8 (1.52) Total 129 (12.34) 2 (0.19) 6 (0.67) 105 (10.05) 21 (2.01) H7N9 cases-related specimens 2017 146 (47.56) 19 (6.19) 65 (21.17) 104 (33.88) 18 (5.86)  下载: 导出CSV
Table 2. Number of positive of AIVs in different environments, Henan, 2016–2017
Type of environment Number of
samplesNumber of positive sample n (%) Flu A H5 H7 H9 Non-H5/H7/H9 Flu A Routine surveillance
sitesLive poultry market 703 128 (18.21) 2 (0.28) 7 (1.00) 104 (14.79) 21 (2.99) Others 342 1 (0.29) 0 (0) 0 (0) 1 (0.29) 0 (0) Total 1,045 129 (12.34) 2 (0.19) 7 (0.67) 105 (10.05) 21 (2.01) H7N9 case exposure
environmentLive poultry market 248 136 (54.84) 19 (7.66) 55 (19.37) 104 (41.94) 18 (7.26) Patient's house 20 0 (0) 0 (0) 0 (0) 0 (0) 0 (0) Live poultry farm 39 10 (25.64) 0 (0) 10 (25.64) 0 (0) 0 (0) Total 307 146 (47.56) 19 (6.19) 65 (21.17) 104 (33.88) 18 (5.86)
下载: 导出CSV
Table 3. Positive rates of AIVs in different sample types from live poultry markets
Types of environment Types of samples Number of samplesl
samplesPercentages (%) (Number of positive samples) Flu A H5 H7 H9 Non-H5/H7/H9 Flu A Routine surveillance
sitesFecal swabs 274 14.96 (41) 0 (0) 1.46 (4) 12.04 (33) 2.55 (7) Poultry cages swabs 153 24.84 (38) 0 (0) 1.31 (2) 22.22 (34) 0.65 (1) Drinking water samples 75 13.33 (10) 0 (0) 0 (0) 10.67 (8) 2.67 (2) Sewage samples 134 17.16 (23) 0.75 (1) 0 (0) 11.19 (15) 5.22 (7) Poultry plucker swabs 10 40 (4) 0 (0) 10 (1) 30 (3) 0 (0) Cutting board swabs 57 21.05 (12) 1.75 (1) 0 (0) 19.30 (11) 1.75 (1) H7N9 cases-exposed
environmentFecal swabs 72 40.28 (29) 6.94 (5) 20.83 (15) 34.72 (25) 2.78 (2) Poultry cages swabs 46 41.30 (19) 2.17 (1) 6.52 (3) 36.96 (17) 4.35 (2) Drinking water samples 9 77.78 (7) 0 (0) 33.33 (3) 66.67 (6) 0 (0) Sewage samples 20 75.00 (15) 30.00 (6) 45.00 (9) 55.00 (11) 5.00 (1) Poultry plucker swabs 37 81.08 (30) 16.22 (6) 43.24 (16) 59.46 (22) 10.81 (4) Cutting board swabs 25 56.00 (14) 4.00 (1) 8.00 (2) 32.00 (8) 16.00 (4) Others 39 53.85 (21) 0 (0) 17.95 (7) 38.46 (15) 10.26 (4)
下载: 导出CSV
Table 4. Mixed infections of AIVs in LPMs related with H7N9 cases
Type of mixed infection Number Percentages of H5-positive samples Percentages of H7-positive samples Percentages of H9-positive samples H7+H9 43 − 78.18 41.34 H5+H9 15 78.95 − 14.42 H5+H7 15 78.95 27.27 − H5+H7+H9 13 68.42 23.64 12.50
下载: 导出CSV
-
[1] Wu Y, Wu Y, Tefsen B, et al. Bat-derived influenza-like viruses H17N10 and H18N11. Trends Microbiol, 2014; 22, 183−91. doi: 10.1016/j.tim.2014.01.010 [2] Alexander DJ. Avian influenza viruses and human health. Dev Biol (Basel), 2006; 124, 77−84. [3] Claas EC, Osterhaus AD, van Beek R, et al. Human influenza A H5N1 virus related to a highly pathogenic avian influenza virus. Lancet, 1998; 351, 472−7. doi: 10.1016/S0140-6736(97)11212-0 [4] Shortridge KF, Zhou NN, Guan Y, et al. Characterization of avian H5N1 influenza viruses from poultry in Hong Kong. Virology, 1998; 252, 331−42. doi: 10.1006/viro.1998.9488 [5] Sun Y, Liu J. H9N2 influenza virus in China: a cause of concern. Protein Cell, 2015; 6, 18−25. doi: 10.1007/s13238-014-0111-7 [6] Nicoll A, Danielsson N. A novel reassortant avian influenza A(H7N9) virus in China - what are the implications for Europe. Euro Surveill, 2013; 18, 20452. [7] Gao R, Cao B, Hu Y, et al. Human infection with a novel avian-origin influenza A (H7N9) virus. N Engl J Med, 2013; 368, 1888−97. doi: 10.1056/NEJMoa1304459 [8] Shi J, Deng G, Ma S, et al. Rapid Evolution of H7N9 Highly Pathogenic Viruses that Emerged in China in 2017. Cell Host Microbe, 2018; 24, 558−68. doi: 10.1016/j.chom.2018.08.006 [9] Yang Q, Shi W, Zhang L, et al. Westward Spread of Highly Pathogenic Avian Influenza A(H7N9) Virus among Humans, China. Emerg Infect Dis, 2018; 24, 1095−98. doi: 10.3201/eid2406.171135 [10] Zhu W, Yang L, Shu Y. Did the Highly Pathogenic Avian Influenza A(H7N9) Viruses Emerged in China Raise Increased Threat to Public Health? Vector Borne Zoonotic Dis, 2019; 19, 22−5. [11] Zhu W, Zhou J, Li Z, et al. Biological characterisation of the emerged highly pathogenic avian influenza (HPAI) A(H7N9) viruses in humans, in mainland China, 2016 to 2017. Euro Surveill, 2017; 22. [12] Su S, Bi Y, Wong G, et al. Epidemiology, Evolution, and Recent Outbreaks of Avian Influenza Virus in China. J Virol, 2015; 89, 8671−6. doi: 10.1128/JVI.01034-15 [13] Xu C, Havers F, Wang L, et al. Monitoring avian influenza A(H7N9) virus through national influenza-like illness surveillance, China. Emerg Infect Dis, 2013; 19, 1289−92. [14] Xu H, Meng F, Huang D, et al. Genomic and phylogenetic characterization of novel, recombinant H5N2 avian influenza virus strains isolated from vaccinated chickens with clinical symptoms in China. Viruses, 2015; 7, 887−98. doi: 10.3390/v7030887 [15] Liu M, Li X, Yuan H, et al. Genetic diversity of avian influenza A (H10N8) virus in live poultry markets and its association with human infections in China. Sci Rep, 2015; 5, 7632. doi: 10.1038/srep07632 [16] Chen LJ, Lin XD, Guo WP, et al. Diversity and evolution of avian influenza viruses in live poultry markets, free-range poultry and wild wetland birds in China. J Gen Virol, 2016; 97, 844−54. doi: 10.1099/jgv.0.000399 [17] Huo X, Chen L, Qi X, et al. Significantly elevated number of human infections with H7N9 virus in Jiangsu in eastern China, October 2016 to January 2017. Euro Surveill, 2017; 22. [18] Zhou L, Ren R, Yang L, et al. Sudden increase in human infection with avian influenza A(H7N9) virus in China, September-December 2016. Western Pac Surveill Response J, 2017; 8, 6−14. [19] Wu J, Lu J, Faria NR, et al. Effect of Live Poultry Market Interventions on Influenza A(H7N9) Virus, Guangdong, China. Emerg Infect Dis, 2016; 22, 2104−12. doi: 10.3201/eid2212.160450 [20] Zhou X, Li Y, Wang Y, et al. The role of live poultry movement and live bird market biosecurity in the epidemiology of influenza A (H7N9): A cross-sectional observational study in four eastern China provinces. J Infect, 2015; 71, 470−9. doi: 10.1016/j.jinf.2015.06.012 [21] Xu JG. Behavioral and ecological infectious diseases: from SARS to H7N9 avian influenza outbreak in China. Chinese Jonrnal of Epidemiology, 2013; 34, 417−8. (In Chinese) [22] Ye G, Liang CH, Hua DG, et al. Phylogenetic Analysis and Pathogenicity Assessment of Two Strains of Avian Influenza Virus Subtype H9N2 Isolated from Migratory Birds: High Homology of Internal Genes with Human H10N8 Virus. Front Microbiol, 2016; 7, 57. [23] Pu J, Wang S, Yin Y, et al. Evolution of the H9N2 influenza genotype that facilitated the genesis of the novel H7N9 virus. Proc Natl Acad Sci U S A, 2015; 112, 548−53. doi: 10.1073/pnas.1422456112 [24] Li C, Wang S, Bing G, et al. Genetic evolution of influenza H9N2 viruses isolated from various hosts in China from 1994 to 2013. Emerg Microbes Infect, 2017; 6, e106. -

 点击查看大图
计量
- 文章访问数: 1336
- HTML全文浏览量: 318
- PDF下载量: 58
- 被引次数: 0

 Quick Links