

 下载:
下载:


-
Japanese encephalitis (JE) was first discovered in Japan in 1871; in 1924, a major outbreak occurred, with 6,000 JE cases reported and a mortality rate of approximately 60%[1, 2]. Later studies showed that JE is caused by the Japanese encephalitis virus (JEV), which is spread by mosquitoes. JEV can be carried by a variety of mosquitoes (Culex, Anopheles, Aedes, and Mansonia), and there are several hosts, namely aquatic wading birds as reservoir hosts of JEV, pigs (including wild boar and domestic pigs) as amplification hosts, and humans and equids as terminal hosts. Culex tritaeniorhynchus, a mosquito species that mainly breeds in rice paddies, is the most important vector of JEV[1-3]. Since its discovery in Japan, JE has gradually spread to South Korea in East Asia, mainland China, the Philippines, Indonesia, Thailand, and Vietnam in Southeast Asia, and then to India and Sri Lanka in South Asia. JE has also spread to Papua New Guinea in the Pacific and to northern Australia[4-6]. Although it is a vaccine-preventable disease[1, 2], JE is currently prevalent in 24 countries and regions in Asia and Oceania, with an annual incidence of approximately 69,000 cases and a mortality rate of 30%; 70% of survivors have neurological sequelae of varying severity. Therefore, JE is a vector-borne viral infectious disease with a huge burden[5-7].
The spread of JE from Japan to China began in the 1930s. In 1934, two cases of acute viral encephalitis in children in Beijing were confirmed to be JEV infection by neutralization experiments[8, 9], and these could therefore be considered the first laboratory-confirmed JE cases in China. JE was subsequently reported in the southeastern city of Amoy and the eastern city of Shanghai[9, 10], and then in Shenyang and Tianjin in northern and eastern China, respectively. In 1939, the epidemiological data, clinical manifestations, and outcomes of six cases of acute viral encephalitis in Beijing were recorded[11], and neutralizing antibodies against JEV in the serum of these patients were detected by neutralization tests, all of which were confirmed to be JEV infections[12]. An epidemiological investigation of JE conducted in Beijing during the 3-year period from 1948 to 1950 identified a total of 729 cases and 330 deaths (fatality rate, 45.3%): 137 cases and 71 deaths in 1948, 225 cases and 110 deaths in 1949, and 367 cases and 149 deaths in 1950[13]. JE became a serious public health problem in China in the late 1940s and was associated with a huge public health burden. As there was no national infectious disease reporting system in China at that time, the epidemiological characteristics of JE were only detailed in scientific research papers, and the overall prevalence of JE in China could not be determined.
The People’s Republic of China was founded in 1949. On November 25, 1950, the Interim Measures for the Prevention and Treatment of Infectious Diseases classified 13 infectious diseases, including JE. Therefore, since 1950, JE has been a nationally notifiable disease, and the national annual JE incidence and mortality rates have been recorded[14]. We collected JE annual incidence and mortality data for China from 1950 to 2018, including its spatiotemporal distribution, to characterize the process beginning when JE first entered China, followed by the nationwide JE pandemic, and decades of efforts to effectively control JE in China by vaccination. This study summarizes JE prevention and control efforts in China and serves as a valuable reference for the prevention and control of JE in other areas around the world.
-
In China (excluding regions of Taiwan, Hong Kong, and Macao), a total of 2,364,177 JE cases and 275,792 deaths were reported between 1950 and 2018, with an average annual incidence of 34,263 and an average annual mortality of 3,997 (Table 1).
Table 1. Endemicity of Japanese encephalitis in China by region and period
Period Southeast China Northwest China Total@ Nationwide╤ Yunnan-
Guizhou
PlateauNorth
China
PlainYangtze
River
PlainPearl River
Delta PlainSubtotal Loess
PlateauNortheast
China
PlainInner
Mongolian
PlateauOthers* Subtotal Average
annual
incidence
(per 100,000
population)Average
annual
mortality
(per 100,000
population)Average
annual
fatality
(%)Invasion
(1950–1962)12,653/
2,572
(6.6)#70,202/
18,117
(36.7)75,603/
13,794
(39.5)9,659/
2,731
(5.0)168,117/
37,214
(87.8)4,615/
1,242
(2.4)18,627/
5,525
(9.7)50/6
(0.03)4/0
(0.002)23,296/
6,773
(12.2)191,413/
43,9872.59 0.6 22.98 Pandemic
(1963–1975)173,635/
25,890
(12.3)391,367/
46,701
(27.8)627,706/
66,450
(44.6)119,704/
16,673
(8.5)1,312,412/
155,714
(93.2)31,066/
4,416
(2.2)64,205/
9,541
(4.6)177/43
(0.01)5/0
(0.003)95,453/
14,000
(6.8)1,407,865/
169,71413.65 1.65 12.06 Decline
(1976–2007)195,265/
17,057
(26.2)154,883/
11,762
(20.8)322,781/
23,904
(43.4)21,185/
2,626
(2.8)694,114/
55,349
(93.2)35,371/
3,049
(4.8)13,092/
2,495
(1.8)1,616/
296
(0.2)45/1
(0.006)50,124/
5,841
(6.8)744,238/
61,1902.23 0.17 8.22 Subtotal 381,553/
45,519
(16.3)616,452/
76,580
(26.3)1,026,090/
104,148
(43.8)150,548/
22,030
(6.4)2,174,643/
248,277
(92.8)71,052/
8,707
(3.0)95,924/
17,561
(4.1)1,843/
345
(0.08)54/1
(0.002)168,873/
26,614
(7.2)2,343,516/
274,8914.91 0.61 11.46 Control
(2008–2018)9,058/
360
(43.8)4,744/
208
(23.0)3,636/
1,30
(17.5)604/21
(2.9)18,042/
719
(87.3)2,515/
165
(12.2)77/14
(0.4)15/2
(0.07)12/1
(0.06)2,619/
182
(12.7)20,661/
9010.14 0.01 4.36 Total 390,611/
45,879
(16.5)621,196/
76,788
(26.3)1,029,726/
104,278
(43.6)151,152/
22,051
(6.4)2,192,685/
248,996
(92.7)73,567/
8,872
(3.1)96,001/
17,575
(4.1)18,583/
347
(0.08)66/2
(0.003)171,492/
26,796
(7.3)2,364,177/
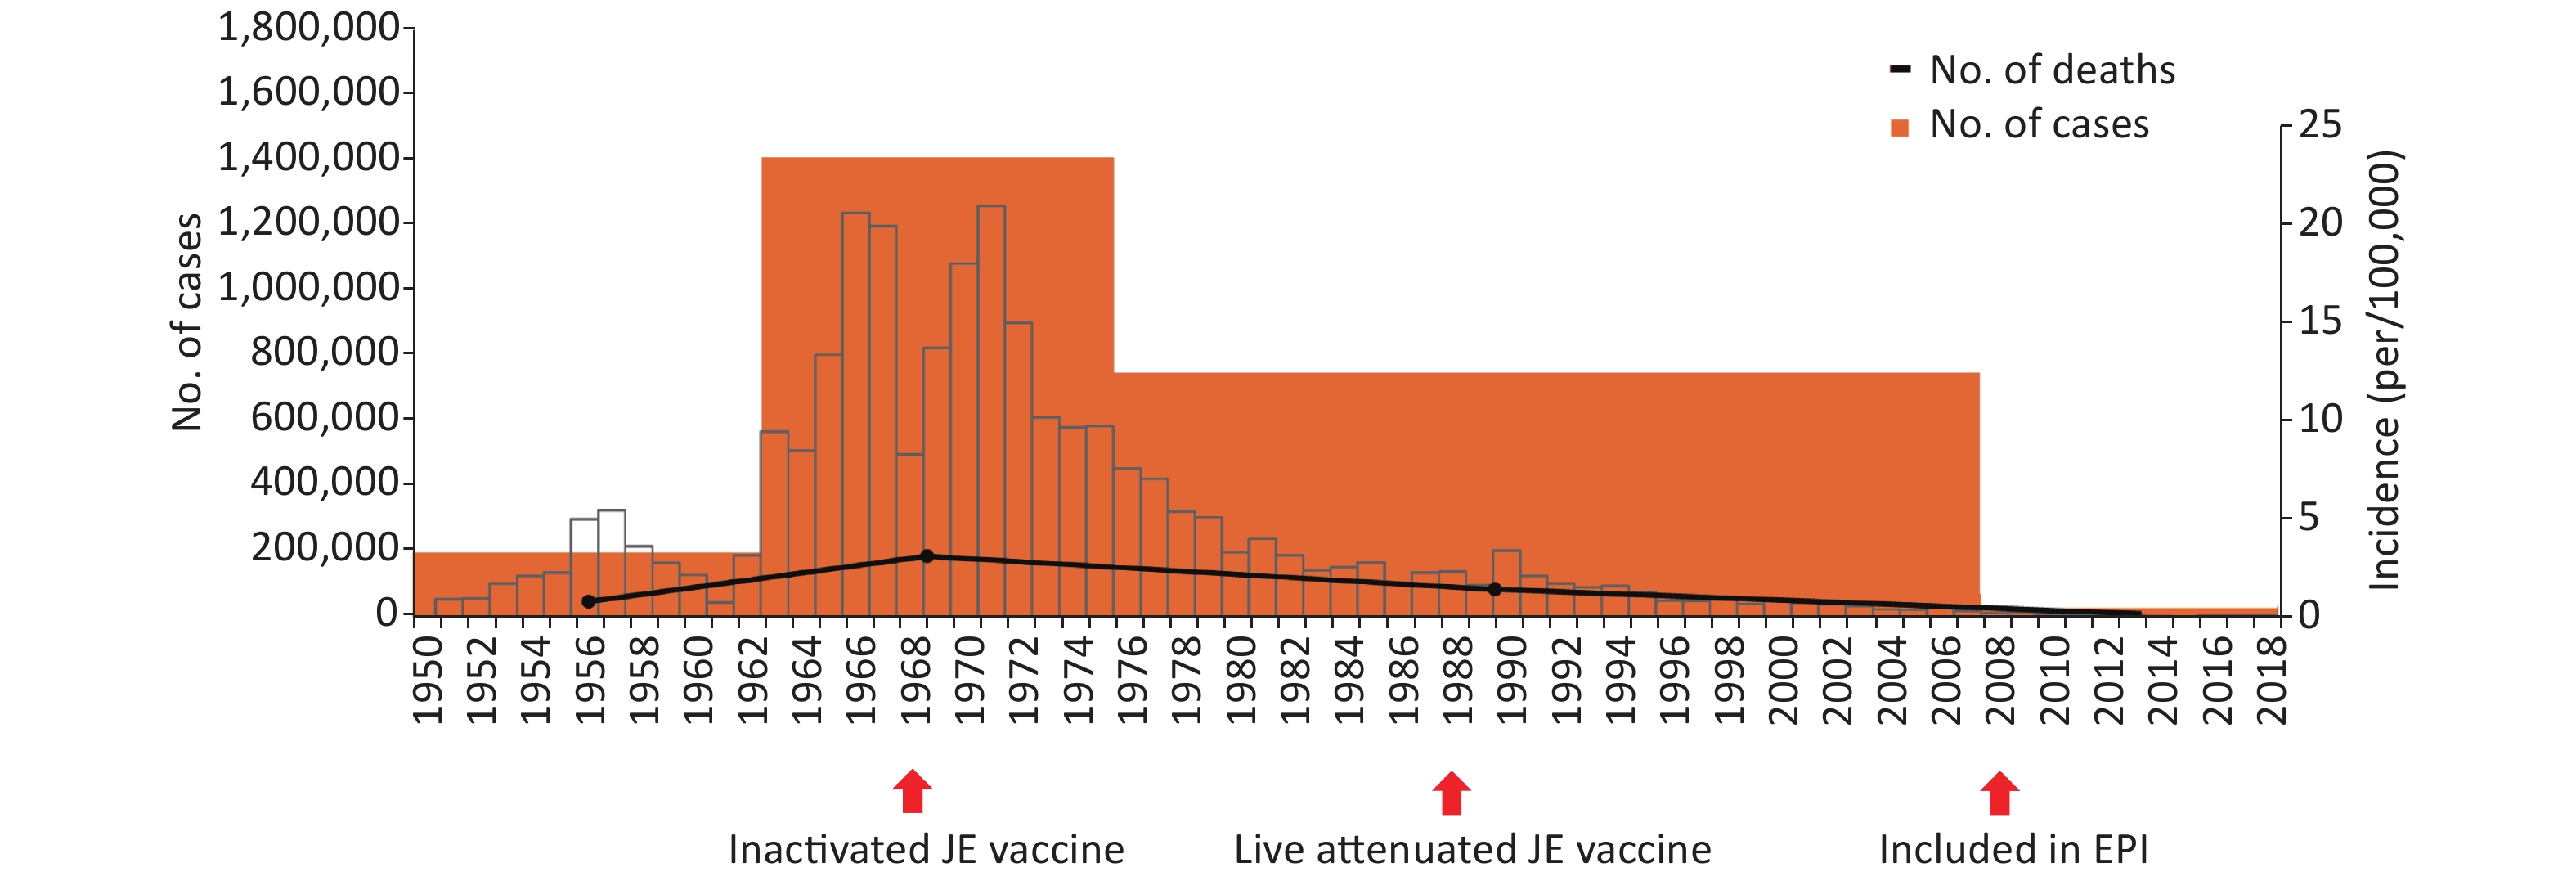
275,7924.14 0.51 10.31 Note. #Number of cases/deaths (percentage of total cases in this period). *Tibetan Plateau (Qinghai and Tibet provinces), and Xinjiang Province. ╤Not including Japanese encephalitis data for 1950. @Total number of cases/total number of deaths. The history of JE in China can be divided into four periods (Table 1 and Figure 1). The period from 1950 to 1962 was the invasion period, with the cases therein accounting for 8.1% of the total (191,413/2,364,177), with an average annual incidence of 2.59/100,000. The cases in the pandemic period (1963–1975) account for 60.0% of the total (1,407,865/2,364,177) and this period has the highest annual incidence of 13.65/100,000. During the 30-year period from 1976 to 2007, the incidence and mortality rates decreased annually; this period accounts for 31.5% (744,238/2,364,177) of all cases, with an average annual incidence of 2.23/100,000. During the 10-year period from 2008 to 2018, during which the JE vaccine was included in China’s Expanded Program on Immunization (EPI), the average annual incidence fell to 0.14/100,000. Epidemiological information on JE in China from 1950 to 2018 is shown in Table 1 and Figures 1 and 2.
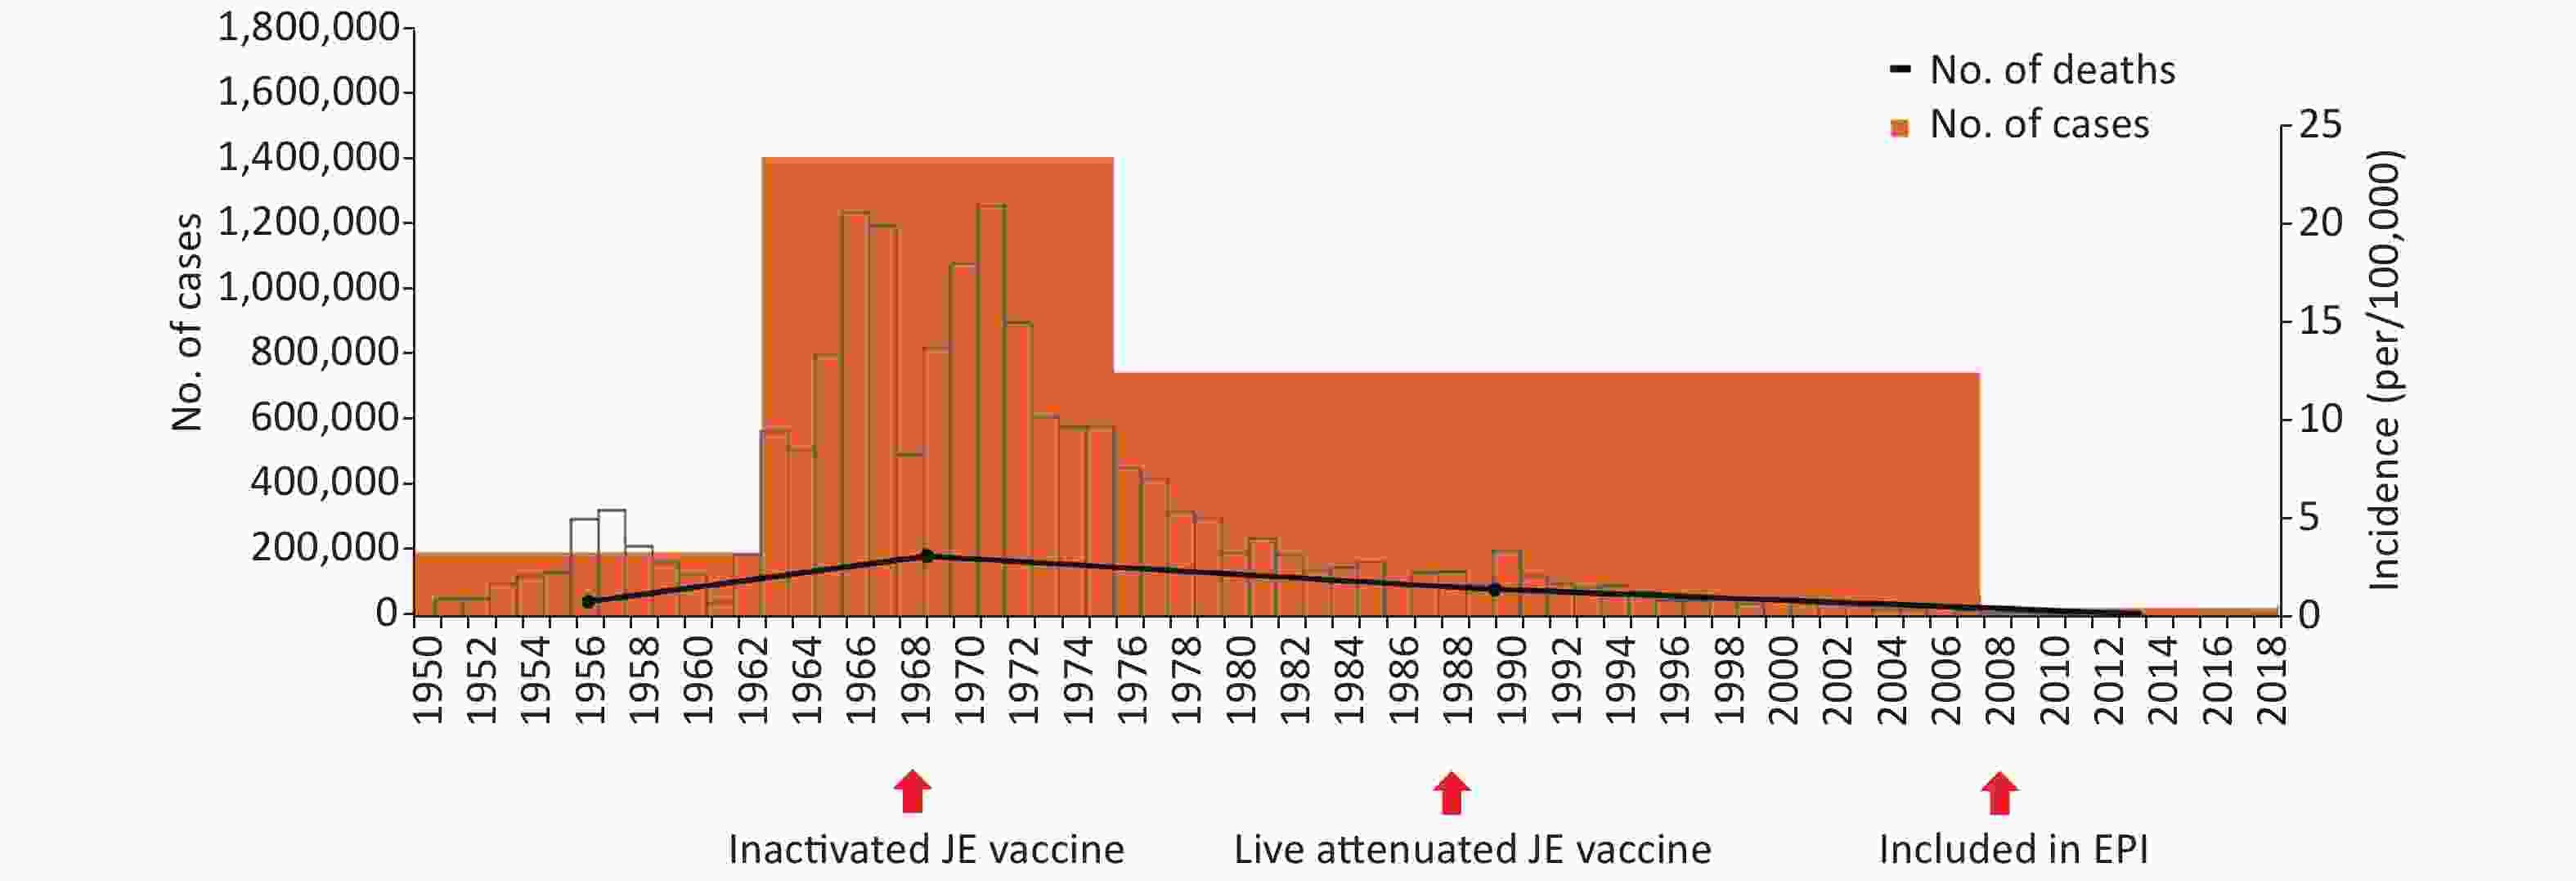
Figure 1. Overall trends of Japanese encephalitis in China for the period of 1950–2018. The bars represent the annual incidence of Japanese encephalitis (JE), while the orange and blue blocks indicate the number of JE cases and the number of JE deaths in four distinct periods. The arrows denote the introduction of the P3 inactivated JE vaccine in 1968 (stage 2) and the live attenuated JE vaccine in 1988 (stage 3), and the inclusion of the JE vaccine in China’s Expanded Program on Immunization (EPI) in 2008 (stage 4). The figure covers the invasion of JE into China in 1950–1962, the pandemic in 1963–1975, the decline in 1976–2007, and effective control in 2008–2018.
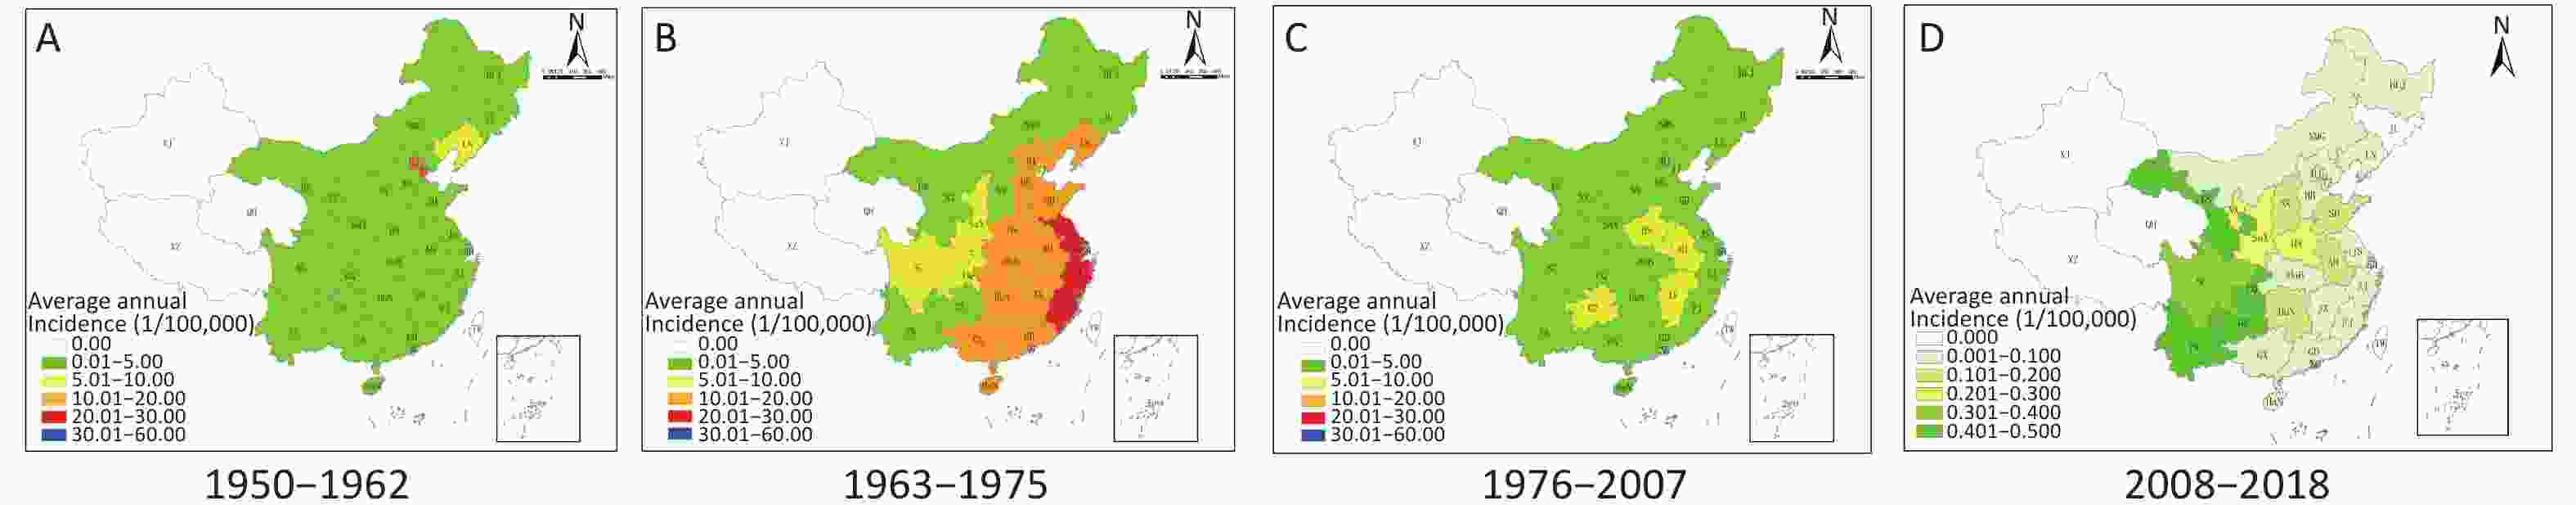
Figure 2. Japanese encephalitis (JE) in China for the period of 1950–2018. (A)–(D) show the geographic changes in JE endemic areas in China in the four periods, 1950–1962, 1963–1975, 1976–2007, and 2008–2018, respectively. The colors indicate the average annual JE incidence rates by province.
JE is a natural focal disease, and its prevalence is related to the local natural environment. China is located in the eastern region of Asia, with a land area of 9.6 million km2, including high mountains and plains, and can be roughly divided into southeastern and northwestern regions based on geoclimatic conditions and residential populations (Figure 3A). The southeastern region includes the Yunnan-Guizhou Plateau (Yunnan, Guizhou, Sichuan, Guangxi, and Chongqing), the North China Plain (Hebei, Beijing, Tianjin, Shanxi, Shandong, and Henan), the Yangtze River Plain (Hunan, Hubei, Anhui, Jiangsu, Zhejiang, Jiangxi, Shanghai, and Fujian), and the Pearl River Delta Plain (Guangdong and Hainan), while the northwestern region includes the Loess Plateau (Shaanxi, Gansu, and Ningxia), the Northeast China Plain (Heilongjiang, Jilin, and Liaoning), the Inner Mongolian Plateau (Inner Mongolian Autonomous Region), the Qinghai-Tibet Plateau (Qinghai and Tibet), and Xinjiang Province [15-17].
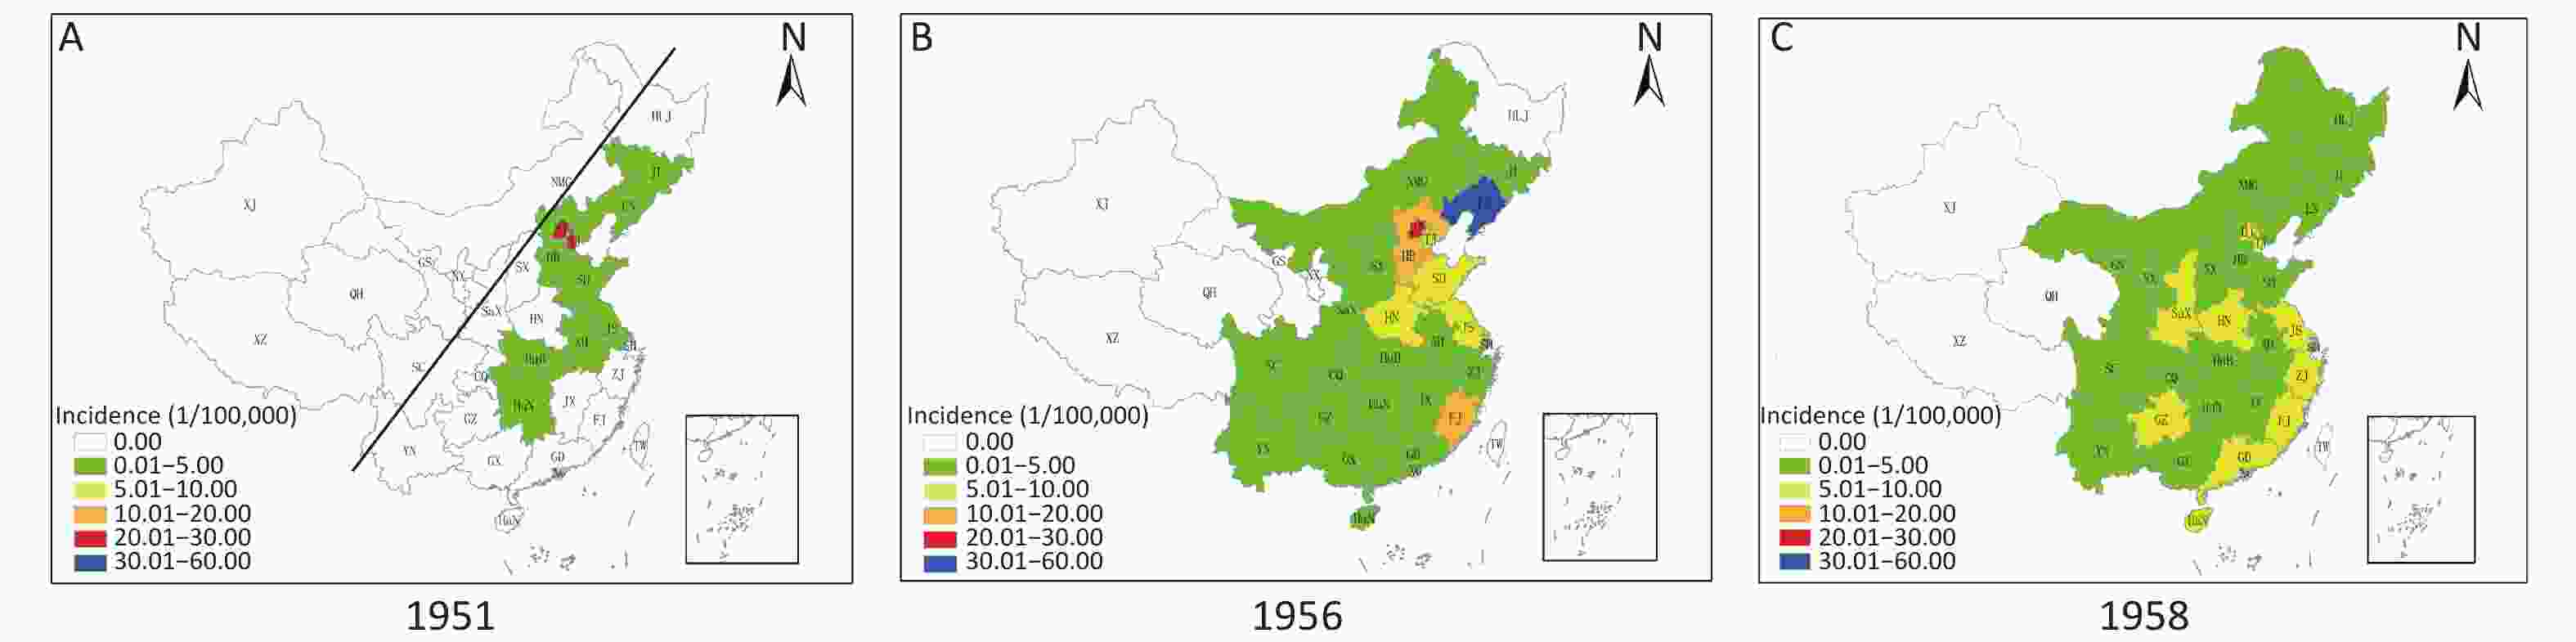
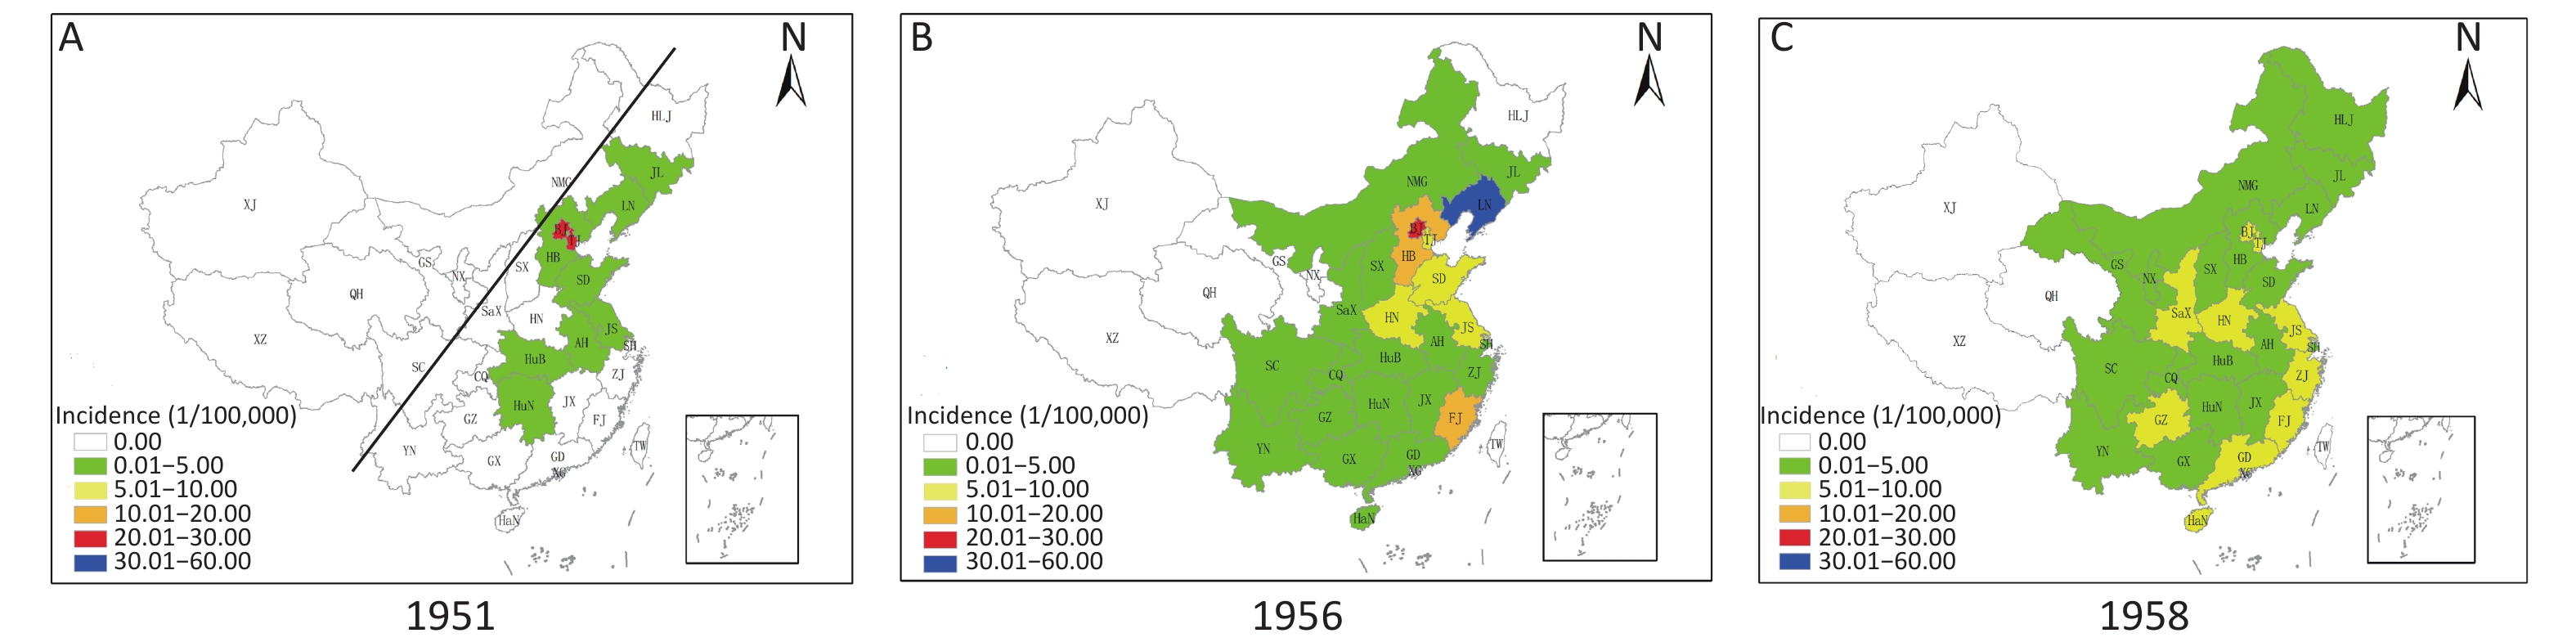
Figure 3. Invasion of China by Japanese encephalitis (JE) (1950–1962). (A)–(C) show the geographic changes in the JE endemic areas in China in 1951, 1956, and 1958, respectively. The line in Figure 3A represents the approximate boundary between southeast and northwest China.
Table 1 shows the endemicity of JE by region and period in China. Between 1950 and 2018, southeastern China accounted for 92.7% (2,192,685/2,364,177) of all JE cases, while the northwestern region accounted for only 7.3% (171,492/2,364,177). During the JE pandemic period (1963–1975), cases in the southeastern region accounted for 93.2% (1,312,412/1,407,865) of all cases in this period. Cases of JE in the Yangtze River Plain accounted for 44.6% (627,706/1,407,865) of all cases in this period, and 47.8% (627,706/1,312,412) of those in the southeastern region. The Yangtze River Plain has historically been a highly endemic area for JE in China. The cases of JE in the Yunnan-Guizhou Plateau area of the southeastern region of China accounted for 12.3% (173,635/1,407,865) of all cases nationwide during the pandemic period (1963–1975), and 43.8% (9,058/20,661) of those during the period of routine JE vaccination (2008–2018). The Yunnan-Guizhou Plateau has the highest JE rate in China. The proportion of JE cases in the Loess Plateau (northwestern China) increased from 2.4% in 1950–1962 to 12.2% in 2008–2018 (Table 1).
-
JE has been a nationally notifiable disease in China since 1950. JE was mainly reported in 10 provinces, typically in eastern China, with Beijing (25.39/100,000), Tianjin (21.16/100,000), Liaoning (3.80/100,000), Jiangsu (1.35/100,000), and Shandong (0.86/100,000) accounting for 90.2% (2,725/3,021) of all cases in 1951 (Figure 3A). Since then, the number of provinces reporting JE cases has increased each year, with the disease gradually spreading to central and east-central China and was seen in 25 provinces nationwide in 1956 (Figure 3B). By 1958, JE had been reported in all provinces of China except Xinjiang, Tibet, and Qinghai, and were thus classified as JE-free areas (Figure 3C). With the expansion of endemic JE areas, the number of JE cases in this period also increased (Table 1).
-
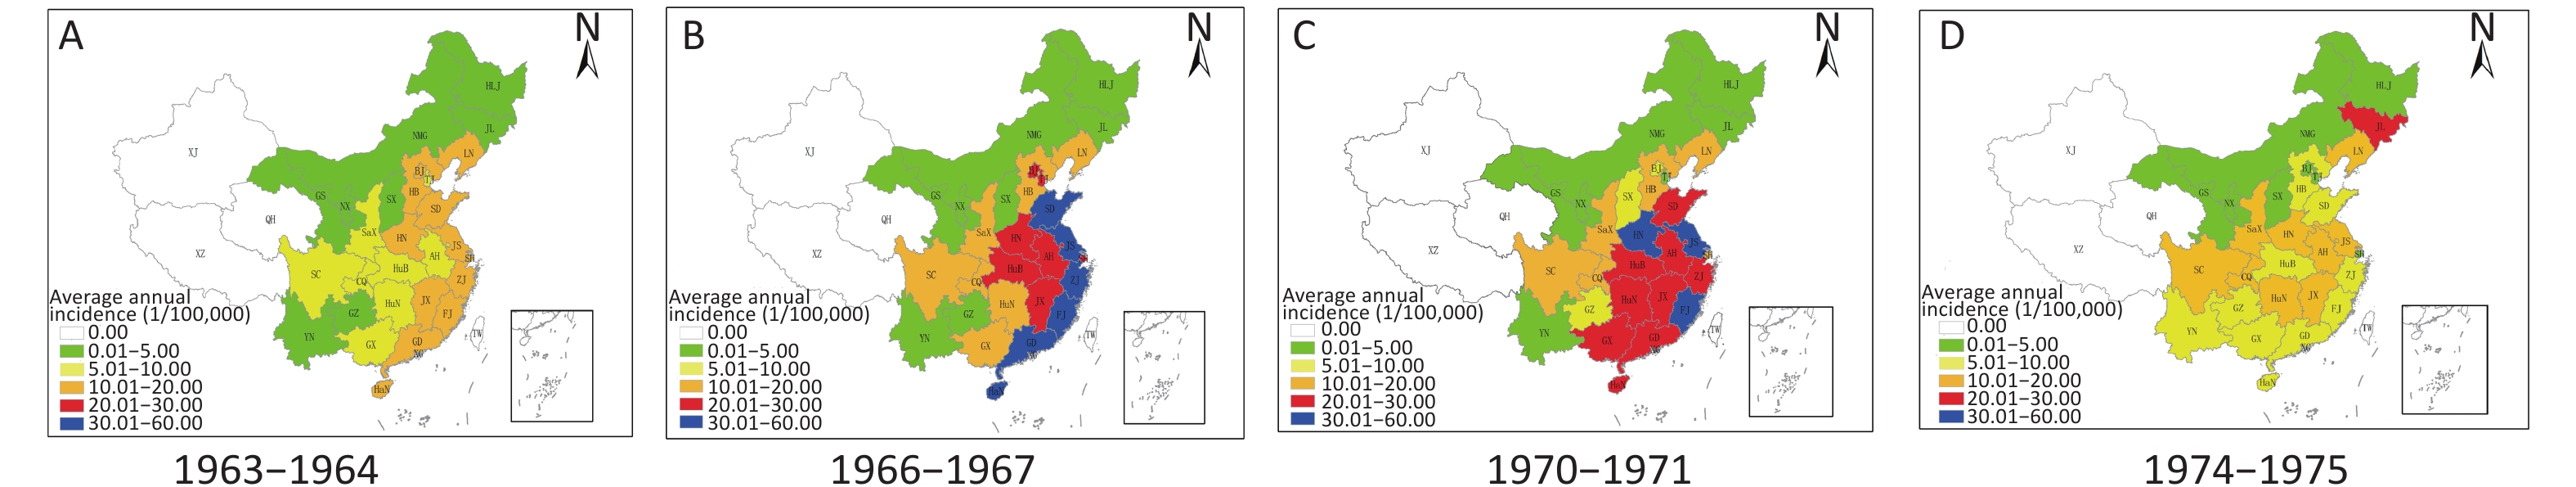
Two epidemics of JE occurred in China during the period of 1963–1975: one in 1966 and the other in 1971 (Figures 1 and 4). During 1963 and 1964 (before the two peak years), the average annual JE incidence rate in China (except Xinjiang, Tibet, and Qinghai) varied between 0.01 and 20.00/100,000, and the provinces with incidence rates between 10.00 and 20.00/100,000 were mainly in southeastern China (Figure 4A). The first JE pandemic in China occurred in 1966–1967, which had a significantly higher incidence than that in 1963–1964. The incidence rates increased during this period: six provinces showed incidence rates of 10.01–20.00/100,000 (Figure 4B, orange area), while seven showed incidence rates of 20.01–30.00/100,000 (Figure 4B, red area) and five had incidence rates exceeding 30.00/100,000 (Figure 4B, blue area). Another JE pandemic occurred in China in 1970–1971; only six provinces had incidence rates of 0.01–5.00/100,000 (Figure 4C, green area), with the remaining provinces having significantly higher rates. Only Fujian, Jiangsu, and Henan Provinces had average annual incidence rates exceeding 30.00/100,000 (Figure 4C, blue area), but the average annual incidence rate increased greatly in east-central Chinese provinces, including Shandong, Hubei, Hunan, Anhui, Jiangxi, Zhejiang, Guangxi, and Guangdong, to 20.00–30.00/100,000 (Figure 4C, red area).

Figure 4. Pandemic of Japanese encephalitis (JE) in China (1963–1975). (A)–(D) show the geographic changes in JE endemic areas in China in the periods 1963–1964, 1966–1967, 1970–1971, and 1974–1975, respectively.
After the two peaks in JE incidence, the number of cases decreased annually, and the national annual incidence became 9.74/100,000 by 1975. The incidence of JE ranged between 0.01–20.00/100,000 in most provinces from 1974 to 1975; only Jilin Province in northeast China had an incidence of over 20.00/100,000 (Figure 4D).
-
From 1976 to 1977, the average annual incidence rates of JE were 20.00–30.00/100,000 in Anhui Province and 10.00–20.00/100,000 in Henan, Jiangsu, and Jiangxi Provinces; the remaining provinces had incidence rates below 10.00/100,000 (Figure 5A). In the 5-year period from 1980 to 1985, the average annual incidence rate of JE was 0.01–5.00/100,000 in all provinces except Jiangsu, Anhui, Jiangxi, and Guizhou (Figure 5B, yellow region). The average annual incidence rate of JE in Henan Province (Figure 5C, yellow region) remained at 5.00–10.00/100,000 between 1990 and 1995, and the incidence rates in the other provinces were all between 0.01 and 5.00/100,000. From 2000 to 2005, the annual average incidence rates of JE for all provinces in China were less than 5.00/100,000 (Figure 5D).
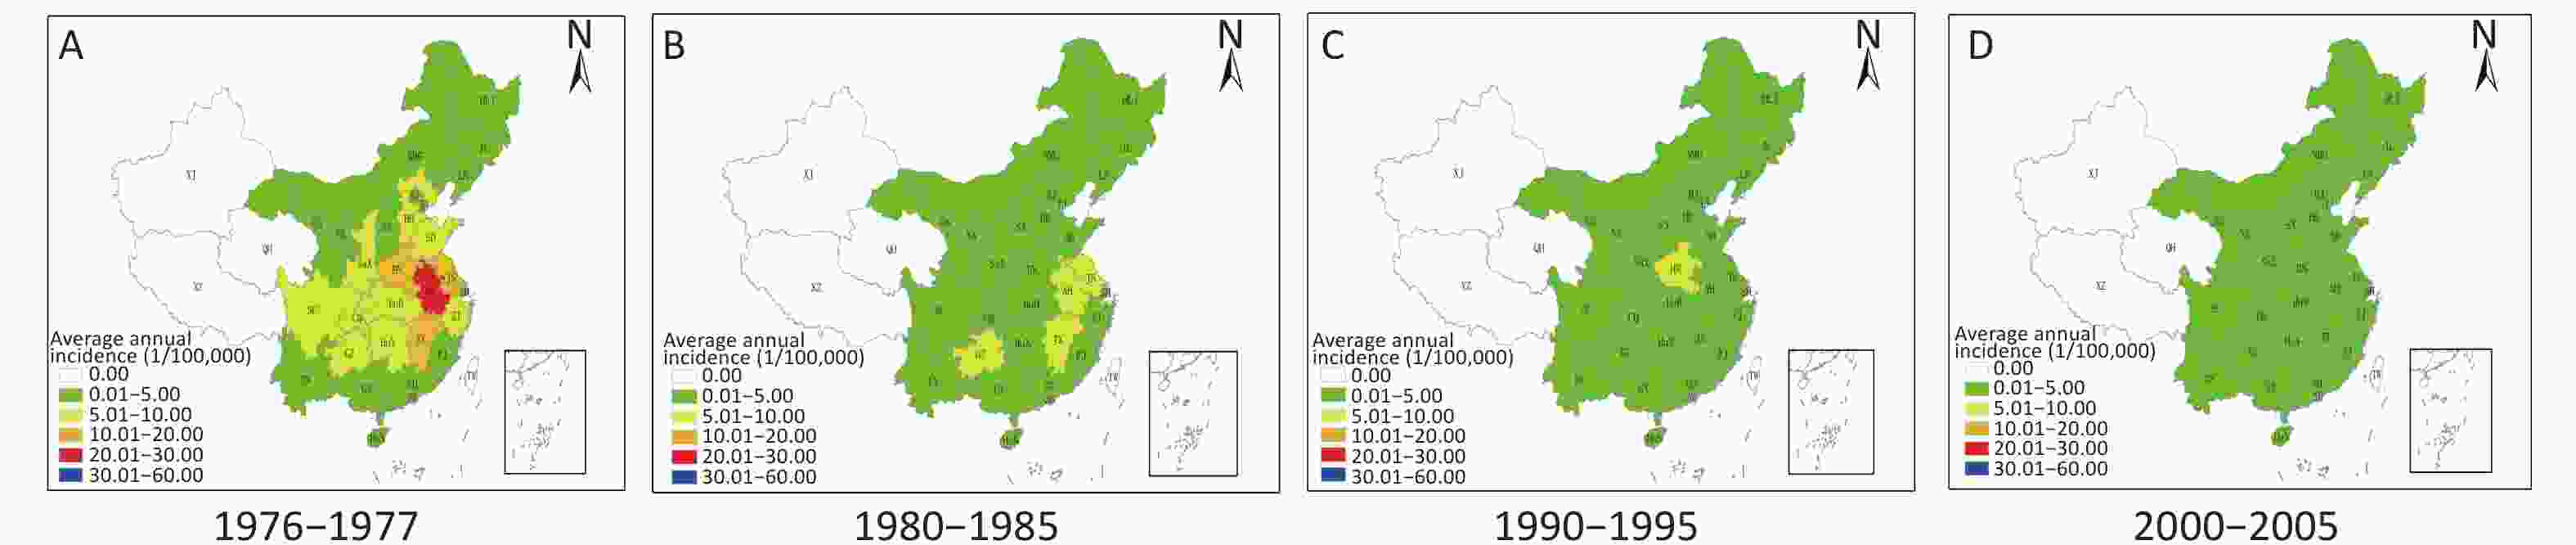
Figure 5. Decline of Japanese encephalitis (JE) in China (1976–2007). (A)–(D) show the geographic changes in JE endemic areas in China in the periods 1976–1977, 1980–1985, 1990–1995, and 2000–2005, respectively.
-
The incidence of JE has sharply decreased in China since 2008, when the JE vaccine was included in China’s EPI (Figure 2D). A total of 20,661 JE cases and 901 deaths were reported during the period of 2008–2018, i.e., an average of 1,878 cases and 82 deaths per year. The average annual incidence rates of JE in the central and eastern provinces of China, which historically had high incidence rates, were less than 0.20/100,000, while the rates were 0.20–0.30/100,000 in Ningxia, Shaanxi, and Henan, and 0.40–0.50/100,000 in Gansu, Yunnan, Guizhou, and Chongqing.
-
JE was imported into China in the 1930s[8–10]. Why did the endemic JE area expand, and the number of cases increase annually in China? A total of 1.4 million cases of JE occurred in the period of 1963–1975 in China, and it has become an entrenched infectious disease. This may be due to factors such as China’s natural environment, farming culture, population density, and sociodemographic characteristics.
First, due to the Tibetan Plateau and Tianshan Mountains, China is characterized by high elevations in the west and low elevations in the east. The western region has a high average elevation, many mountains and deserts, and a cold climate, and experiences drought and very little rain; meanwhile, the southeastern region has a low average elevation, vast plain area, and high average rainfall and temperature, such that it is rich in vegetation conducive to the presence of multiple species of mosquitoes and contains ample breeding sites. Thus, the natural environment in southeastern China provides ideal natural conditions for the local multiplication of JEV[15-19].
Second, JE is a vector-borne natural epidemic disease, with Culex (Cx.) tritaeniorhynchus being the main vector, and pigs being the main amplification hosts[1-3, 20]. The southeast is rich in water networks, and for thousands of years, farming in this area has been dominated by the cultivation of rice (the main breeding site of Cx. Tritaeniorhynchus). The local population is mainly of Han ethnicity, and pork is favored. Domestic animals (mainly pigs) are reared for personal consumption or sold for income. Pigsties are usually located in residential courtyards for convenience. Cx. tritaeniorhynchus breeding in rice fields results in JEV infection of swine, which is transmitted through biting[18, 19, 21]. Mosquitoes carrying JEV can also spread the virus to people living in nearby villages. This is an important reason why JEV became established in southeastern China, and why the majority of JE cases in China are concentrated in rural areas. The Yangtze River Plain is a typical example of large-scale farmland irrigation that also facilitates the natural circulation of JEV, which is one reason why this area has the largest proportion of JE cases in China[21-23].
Third, due to the low average elevation of southeastern China, the geographical environment is characterized by plain areas that are suitable for human habitation. In total, 96% of China’s population resides in the southeast region, which accounts for 36% of China’s total land area; only 4% of the population resides in the northwest region, which accounts for 64% of the land area[15-17]. The huge population in southeastern China accords with the continually high incidence of JE in this region. Between 1950 and 2018, JE cases in southeastern China accounted for 92.7% of the cases nationwide, while northwestern China accounted for only 7.3% of all cases (Table 1). The relatively well-developed highway, railway, and waterway transportation systems in southeast China also provide a convenient means for the transmission and spread of JEV throughout this region.
Fourth, China developed an inactivated JE vaccine (P3) in 1968[24] and a live attenuated JE vaccine (SA14-14-2) in 1988[25]. However, due to the inability to produce vaccines in the required amounts in China at that time, and to technological limitations, full protection of the population against JEV infection was impossible[18, 26]. A JE pandemic occurred in China between 1963 and 1975, when no JE vaccine immunization was available[16]. The numbers of JE cases and deaths during this period accounted for 60% (1,407,865/2,364,177) and 62% (169,714/275,792) of the total between 1950 and 2018, respectively (Table 1). During this period, the World Health Organization (WHO) reported that 90% of JE cases worldwide occurred in China[27]. In addition, China was undergoing the Cultural Revolution from 1966 to 1976, which was characterized by social turmoil, near-collapse of the economy, and an almost complete absence of national control measures for JE that contributed to the JE pandemic during this period.
Because JE has existed in China for decades and China has a vast territory, the epidemic characteristics of JE in different periods and regions may still have varying local characteristics. However, we did not conduct a detailed spatiotemporal distribution analysis due to space and data limitations, which is also a limitation of this study.
-
Japan began a JE vaccination program in 1954, and the prolonged vaccination campaign has ultimately led to only a few JE cases being reported annually since the 1990s[28, 29]. In Korea, the JE vaccine was introduced in 1971 and has been included in national vaccination programs since 1983; few JE cases have been reported annually since 2000[30, 31]. Although they are traditionally endemic areas, vaccination programs have essentially eliminated JE in Japan and Korea. China’s EPI involved three implementation periods. In 1978, two viral disease vaccines, oral polio vaccine (OPV) and measles vaccine (MV), and the diphtheria-pertussis-tetanus triple vaccine were provided[32]. The hepatitis B vaccine was included in 2002[33], and the meningitis, JE, hepatitis A, rubella, and mumps vaccines were included in 2008[26, 34].
China developed inactivated and live attenuated vaccines for JE in 1968 and 1988, respectively. Given the limited capacity to produce the vaccine and the low economic status of China at the time, the JE vaccine was not included in the 1978 EPI. Nevertheless, the national EPI of 1978 was followed by the implementation of EPI for vaccine-preventable infectious diseases at the local government level (i.e., at the province/autonomous region level). Since the 1980s, provincial governments, especially in the coastal areas of southeast China, have made great progress in JE vaccination. In Shandong, Jiangsu, and Zhejiang, the JE vaccine is included in the EPI[35-37]. A number of other provinces subsequently included the JE vaccine in their EPI strategies (11 and 16 provinces by 2005 and 2006, respectively). The incidence rates of JE in these provinces have been consistently high[26, 38]. In 2008, the Chinese government included the JE vaccine in its EPI, targeting children <15 years of age in using a two-dose schedule of live attenuated JE vaccine at 8 months and at 2 years, and the incidence of JE among children <15 years old decreased dramatically, from 1.63/100,000 population in 2004 to 0.16/100,000 in 2018[38, 39]. Following its addition to the EPI, one- and two-dose coverage increased from 97.0% and 89.5% in 2011[40] to 99.6% and 99.4%, respectively, in 2015[41]. The vaccine is now an effective means of JE prevention and control at the national level[26, 34, 38]. Accordingly, the incidence of JE has dropped to its lowest level in history since its introduction into China, with an average annual incidence rate of 0.14/100,000 from 2008 to 2018 (Table 1). Moreover, the improvement of China’s economy, and major investment in public health management coupled with improvements in living standards (e.g., removal of sewage to reduce mosquito breeding sites, changes in pig-rearing practices in courtyards, and keeping pigsties away from villages to reduce JEV transmission), have played important roles in the control of JE[38, 42].
Although JE has been effectively controlled in China, JEV remains the arbovirus most commonly isolated from mosquitoes collected in natural environments; there is still a large reservoir of JEV in natural mosquitoes in China[18, 19]. The number of JE cases in China varies annually, and cases in Guizhou and Yunnan in southwestern China accounted for 43.8% of all cases nationwide in the period of 2008–2018 (Table 1). In addition, the emergence of JE epidemics in traditionally low-incidence areas in northern China, such as Shaanxi and Gansu[23, 43], presents new challenges for JE prevention and control in China.
-
According to the WHO, JE is endemic in 24 countries or regions in Asia and the Pacific, but it has not been reported in Africa, the Americas, and Europe[5-7]. However, genotypes of JEV and its geographical distribution have changed significantly due to climate change[44]. Genotype 3 JEV has recently been found in mosquitoes and birds in Europe[45, 46]. In addition, a patient in Africa was infected with both yellow fever and genotype 3 JEV during a yellow fever epidemic; the patient had not left his hometown before his illness, indicating the emergence of JE in Africa[47]. It is likely that JEV has spread to regions outside of Asia and the Pacific. JEV can also be carried and transmitted by migratory birds and many Culex species other than Cx. tritaeniorhynchus can act as vectors. Therefore, JEV is likely to spread from traditionally endemic areas in Asia to the rest of the world, which would impose a major public health burden, followed by the West Nile virus[48] and the Zika virus[49]. Viral encephalitis caused by JEV is similar in terms of clinical symptoms and onset season to other types of viral encephalitis, such as the West Nile virus, making it important to improve surveillance of JEV outside traditionally endemic areas to facilitate early detection and diagnosis, and thus control the worldwide spread of JE.
-
The authors declare that there are no conflicts of interest.
-
WH and LG conceived the study. CX, LX, GX, LM, FS, HY, LF, YQ, XS, and WD collected, analyzed the data, and created the figures. CX wrote the original draft. WH, LY, YZ, YG, and LG reviewed and edited the manuscript.
-
HLJ, Heilongjiang; JL, Jilin; LN, Liaoning; NMG, Inner Mongolia; BJ, Beijing; TJ, Tianjin; HB, Hebei; HN, Henan; SD, Shandong; SX, Shanxi; SaX, Shaanxi; NX, Ningxia; GS, Gansu; QH, Qinghai; XJ, Xinjiang; XZ, Tibet; SC, Sichuan; YN, Yunnan; GZ, Guizhou; GX, Guangxi; GD, Guangdong; GX, Guangxi; HuN, Hunan; HuB, Hubei; JX, Jiangxi; JS, Jiangsu; ZJ, Zhejiang; AH, Anhui; FJ, Fujian; SH, Shanghai; HaN, Hainan; TW, Taiwan.
doi: 10.3967/bes2021.024
Japanese Encephalitis in China in the Period of 1950–2018: From Discovery to Control
-
-
Figure 1. Overall trends of Japanese encephalitis in China for the period of 1950–2018. The bars represent the annual incidence of Japanese encephalitis (JE), while the orange and blue blocks indicate the number of JE cases and the number of JE deaths in four distinct periods. The arrows denote the introduction of the P3 inactivated JE vaccine in 1968 (stage 2) and the live attenuated JE vaccine in 1988 (stage 3), and the inclusion of the JE vaccine in China’s Expanded Program on Immunization (EPI) in 2008 (stage 4). The figure covers the invasion of JE into China in 1950–1962, the pandemic in 1963–1975, the decline in 1976–2007, and effective control in 2008–2018.
Figure 2. Japanese encephalitis (JE) in China for the period of 1950–2018. (A)–(D) show the geographic changes in JE endemic areas in China in the four periods, 1950–1962, 1963–1975, 1976–2007, and 2008–2018, respectively. The colors indicate the average annual JE incidence rates by province.
Figure 3. Invasion of China by Japanese encephalitis (JE) (1950–1962). (A)–(C) show the geographic changes in the JE endemic areas in China in 1951, 1956, and 1958, respectively. The line in Figure 3A represents the approximate boundary between southeast and northwest China.
Figure 4. Pandemic of Japanese encephalitis (JE) in China (1963–1975). (A)–(D) show the geographic changes in JE endemic areas in China in the periods 1963–1964, 1966–1967, 1970–1971, and 1974–1975, respectively.
Figure 5. Decline of Japanese encephalitis (JE) in China (1976–2007). (A)–(D) show the geographic changes in JE endemic areas in China in the periods 1976–1977, 1980–1985, 1990–1995, and 2000–2005, respectively.
Table 1. Endemicity of Japanese encephalitis in China by region and period
Period Southeast China Northwest China Total@ Nationwide╤ Yunnan-
Guizhou
PlateauNorth
China
PlainYangtze
River
PlainPearl River
Delta PlainSubtotal Loess
PlateauNortheast
China
PlainInner
Mongolian
PlateauOthers* Subtotal Average
annual
incidence
(per 100,000
population)Average
annual
mortality
(per 100,000
population)Average
annual
fatality
(%)Invasion
(1950–1962)12,653/
2,572
(6.6)#70,202/
18,117
(36.7)75,603/
13,794
(39.5)9,659/
2,731
(5.0)168,117/
37,214
(87.8)4,615/
1,242
(2.4)18,627/
5,525
(9.7)50/6
(0.03)4/0
(0.002)23,296/
6,773
(12.2)191,413/
43,9872.59 0.6 22.98 Pandemic
(1963–1975)173,635/
25,890
(12.3)391,367/
46,701
(27.8)627,706/
66,450
(44.6)119,704/
16,673
(8.5)1,312,412/
155,714
(93.2)31,066/
4,416
(2.2)64,205/
9,541
(4.6)177/43
(0.01)5/0
(0.003)95,453/
14,000
(6.8)1,407,865/
169,71413.65 1.65 12.06 Decline
(1976–2007)195,265/
17,057
(26.2)154,883/
11,762
(20.8)322,781/
23,904
(43.4)21,185/
2,626
(2.8)694,114/
55,349
(93.2)35,371/
3,049
(4.8)13,092/
2,495
(1.8)1,616/
296
(0.2)45/1
(0.006)50,124/
5,841
(6.8)744,238/
61,1902.23 0.17 8.22 Subtotal 381,553/
45,519
(16.3)616,452/
76,580
(26.3)1,026,090/
104,148
(43.8)150,548/
22,030
(6.4)2,174,643/
248,277
(92.8)71,052/
8,707
(3.0)95,924/
17,561
(4.1)1,843/
345
(0.08)54/1
(0.002)168,873/
26,614
(7.2)2,343,516/
274,8914.91 0.61 11.46 Control
(2008–2018)9,058/
360
(43.8)4,744/
208
(23.0)3,636/
1,30
(17.5)604/21
(2.9)18,042/
719
(87.3)2,515/
165
(12.2)77/14
(0.4)15/2
(0.07)12/1
(0.06)2,619/
182
(12.7)20,661/
9010.14 0.01 4.36 Total 390,611/
45,879
(16.5)621,196/
76,788
(26.3)1,029,726/
104,278
(43.6)151,152/
22,051
(6.4)2,192,685/
248,996
(92.7)73,567/
8,872
(3.1)96,001/
17,575
(4.1)18,583/
347
(0.08)66/2
(0.003)171,492/
26,796
(7.3)2,364,177/
275,7924.14 0.51 10.31 Note. #Number of cases/deaths (percentage of total cases in this period). *Tibetan Plateau (Qinghai and Tibet provinces), and Xinjiang Province. ╤Not including Japanese encephalitis data for 1950. @Total number of cases/total number of deaths.  下载: 导出CSV
-
[1] Lindenbach BD, Thiel HJ, Rice CM. Flaviviridae: the viruses and their replication. In: Knipe DM, Howley PM. Fields Virology. Lippincott-Raven Publishers. 2007, 1102−53. [2] Halstead SB, Jacobson J. Japanese encephalitis vaccines. In: Plotkin SA, OrensteinWA, Offit PA. Vaccine, 5th ed. Elsevier. 2008, 311−52. [3] Mackenzie JS, Williams DT, Smith DW. Japanese encephalitis virus: the geographic distribution, incidence, and spread of a virus with a propensity to emerge in new areas. Perspect Med Virol, 2006; 16, 201−68. [4] Mackenzie JS, Gubler DJ, Petersen LR. Emerging flaviviruses: the spread and resurgence of Japanese encephalitis, West Nile and dengue viruses. Nat Med, 2004; 10, S98−109. doi: 10.1038/nm1144 [5] Hills SL, Phillips DC. Past, present, and future of Japanese encephalitis. Emerg Infect Dis, 2009; 15, 1333. doi: 10.3201/eid1508.090149 [6] Campbell GL, Hills SL, Fischer M, et al. Estimated global incidence of Japanese encephalitis: a systematic review. Bull World Health Organ, 2011; 89, 766−74E. doi: 10.2471/BLT.10.085233 [7] Turtle L, Solomon T. Japanese encephalitis-the prospects for new treatments. Nat Rev Neurol, 2018; 14, 298−313. doi: 10.1038/nrneurol.2018.30 [8] Kuttner AG, Ts'un T. Encephalitis in north China. Results obtained with neutralization tests. J Clin Invest, 1936; 15, 525−30. doi: 10.1172/JCI100805 [9] Su TE. Encephalitis epidemica in Amoy. Chin Med J, 1936; 50, 1279−80. [10] Lowenberg RD. Notes on encephalitis in Shanghai. Chin Med J, 1937; 51, 989−1000. [11] Huang CH, Liu SH. Acute epidemic encephalitis of Japanese type: clinical report of six proven cases. Chin Med J, 1940; 58, 427−39. [12] Huang CH. The neutralization of Japanese encephalitis virus by serum. Chin Med J, 1941; 59, 34−44. [13] Huang CH, Song G, Tian FD. Epidemiological investigation on Japanese encephalitisb in Beijing from 1948 to 1950. Chin Med J, 1951; 37, 253−73. (In Chinese [14] The interim measures for the prevention and treatment of infectious diseases. Beijing Municipal Daily, 1951; 2. [15] Huan YH. The distribution of population in China, with statistics and maps. Acta Geogr Sin, 1935; 2, 33−74. [16] Li XL, Gao XY, Ren ZP, et al. A spatial and temporal analysis of Japanese encephalitis in mainland China, 1963-1975: a period without Japanese encephalitis vaccination. PLoS One, 2014; 9, e99183. doi: 10.1371/journal.pone.0099183 [17] Qi W, Liu SH, Zhao MF, et al. China’s different spatial patterns of population growth based on the “Hu Line”. J Geogr Sci, 2016; 26, 1611−25. doi: 10.1007/s11442-016-1347-3 [18] Zheng YY, Li MH, Wang HY, et al. Japanese encephalitis and Japanese encephalitis virus in mainland China. Rev Med Virol, 2012; 22, 301−22. doi: 10.1002/rmv.1710 [19] Liang GD, Li XL, Gao XY, et al. Arboviruses and their related infections in China: a comprehensive field and laboratory investigation over the last 3 decades. Rev Med Virol, 2018; 28, e1959. doi: 10.1002/rmv.1959 [20] Miller RH, Masuoka P, Klein TA, et al. Ecological niche modeling to estimate the distribution of Japanese encephalitis virus in Asia. PLoS Negl Trop Dis, 2012; 6, e1678. doi: 10.1371/journal.pntd.0001678 [21] Ren XJ, Fu SH, Dai PF, et al. Pigsties near dwellings as a potential risk factor for the prevalence of Japanese encephalitis virus in adult in Shanxi, China. Infect Dis Poverty, 2017; 6, 100. doi: 10.1186/s40249-017-0312-4 [22] Gao XY, Nasci R, Liang GD. The neglected arboviral infections in mainland China. PLoS Negl Trop Dis, 2010; 4, e624. doi: 10.1371/journal.pntd.0000624 [23] Li XL, Cui SH, Gao XY, et al. The spatio-temporal distribution of Japanese encephalitis cases in different age groups in mainland China, 2004-2014. PLoS Negl Trop Dis, 2016; 10, e0004611. doi: 10.1371/journal.pntd.0004611 [24] Gu PW, Ding ZE. Inactivated Japanese encephalitis (JE) vaccine made from hamster kidney cell culture (a review). JE HFRS Bull, 1987; 2, 15−26. [25] Xin YY, Ming ZG, Peng GY, et al. Safety of a live-attenuated Japanese encephalitis virus vaccine (SA14-14-2) for children. Am J Trop Med Hyg, 1988; 39, 214−7. doi: 10.4269/ajtmh.1988.39.214 [26] Wang HQ, An ZJ, Yin ZD. Achievements in prevention and control of seven infectious diseases targeted by the National Immunization Program in China across 70 years. Chin J Vacc Immun, 2019; 25, 359−67. (In Chinese [27] Tsai TF. New initiatives for the control of Japanese encephalitis by vaccination: minutes of a WHO/CVI meeting, Bangkok, Thailand, 13-15 October 1998. Vaccine, 2000; 18, 1−25. doi: 10.1016/S0264-410X(00)00037-2 [28] Arai S, Matsunaga Y, Takasaki T, et al. Japanese encephalitis: surveillance and elimination effort in Japan from 1982 to 2004. Jpn J Infect Dis, 2008; 61, 333−8. [29] Igarashi A. Control of Japanese encephalitis in Japan: immunization of humans and animals, and vector control. Curr Top Microbiol Immunol, 2002; 267, 139−52. [30] Sohn YM. Japanese encephalitis immunization in South Korea: past, present, and future. Emerg Infect Dis, 2000; 6, 17−24. [31] Lee DW, Choe YJ, Kim JH, et al. Epidemiology of Japanese encephalitis in South Korea, 2007-2010. Int J Infect Dis, 2012; 16, e448−52. [32] Ministry of Health. Notification of expanded national immunization programmes. [1978-09-13]. [33] Ministry of Health、Ministry of Financ. Notification of the inclusion of Hepatitis B vaccine in children's immunization programmes. [2001-12-05]. [34] Ministry of Health. Notification of the implementation plan for the expanded national immunization programme. [2007-12-29]. [35] Tao H, Wang ZG, Fu BF, et al. Study on Japanese encephalitis remedial expense and project immunization cost in Jiangsu province. Chin J Public Health, 2007; 23, 1109−10. (In Chinese [36] Zhou CL, Zhou HN. Progress in the study of the prevalence of encephalitis B in Shandong Province. J Pathog Biol, 2010; 5, 301−3. (In Chinese [37] Yao J. Epidemiological analysis of Japanese encephalitis in Zhejiang from 1952 to 1988. Zhejiang J Prev Med, 1990; 2, 5−7. [38] Gao XY, Li XL, Li MH, et al. Vaccine strategies for the control and prevention of Japanese encephalitis in Mainland China, 1951-2011. PLoS Negl Trop Dis, 2014; 8, e3015. doi: 10.1371/journal.pntd.0003015 [39] Documents from Chinese Ministry of Health. (2004) Guidance for the prevention and control of Japanese encephalitis. Chin J Vacc Immun, 2004; 10, 252−3. (In Chinese [40] Wang HY, Liang GD. Epidemiology of Japanese encephalitis: past, present, and future prospects. Ther Clin Risk Manag, 2015; 11, 435−48. [41] Cao L, Wang HQ, Zheng JS, et al. National immunization coverage survey in China after integrated more vaccines into EPI Since 2008. Chin J Vacc Immun, 2012; 18, 419−24, 78. (In Chinese [42] Cui J, Cao L, Zheng JS, et al. Reported coverage of vaccines in the national immunization program of China, 2015. Chin J Vacc Immun, 2017; 23, 601−7. (In Chinese [43] Li XL, Gao XY, Fu SH, et al. An outbreak of Japanese encephalitis in adults in northern China, 2013: a population-based study. Vector Borne Zoonotic Dis, 2019; 19, 26−34. doi: 10.1089/vbz.2017.2251 [44] Gao XY, Liu H, Li XL, et al. Changing geographic distribution of Japanese encephalitis virus genotypes, 1935-2017. Vector Borne Zoonotic Dis, 2019; 19, 35−44. doi: 10.1089/vbz.2018.2291 [45] Ravanini P, Huhtamo E, Ilaria V, et al. Japanese encephalitis virus RNA detected in Culex pipiens mosquitoes in Italy. Euro Surveill, 2012; 17, 20221. [46] Platonov A, Rossi G, Karan L, et al. Does the Japanese encephalitis virus (JEV) represent a threat for human health in Europe? Detection of JEV RNA sequences in birds collected in Italy. Euro Surveill, 2012; 17, 20241. [47] Simon-Loriere E, Faye O, Prot M, et al. Autochthonous Japanese encephalitis with yellow fever Coinfection in Africa. N Engl J Med, 2017; 376, 1483−5. doi: 10.1056/NEJMc1701600 [48] Ronca SE, Murray KO, Nolan MS. Cumulative incidence of west Nile virus infection, continental united states, 1999-2016. Emerg Infect Dis, 2019; 25, 325−7. doi: 10.3201/eid2502.180765 [49] Franca RFO, Neves MHL, Ayres CFJ, et al. First international workshop on Zika virus held by Oswaldo Cruz foundation FIOCRUZ in northeast brazil march 2016-a meeting report. PLoS Negl Trop Dis, 2016; 10, e0004760. doi: 10.1371/journal.pntd.0004760 -

 点击查看大图
计量
- 文章访问数: 2151
- HTML全文浏览量: 252
- PDF下载量: 267
- 被引次数: 0

 Quick Links