

 下载:
下载:

-
Drug-resistant tuberculosis is a major public health problem that poses a threat to global tuberculosis control programs. The emergence of multidrug-resistant tuberculosis (MDR-TB) has severely hampered control because it is resistant to the two key drugs, isoniazid (INH) and rifampicin (RIF), in tuberculosis treatment. In the 2019 World Health Organization (WHO) Global Tuberculosis Report, 10 million new cases of tuberculosis were recorded worldwide in 2018, and the incidence of MDR-TB was approximately 3.4% of new cases and 18% of previously treated cases. In 2018, the number of patients with MDR-TB in the world was approximately 484,000, resulting in 214,000 deaths[1]. Although the proportion of MDR-TB is lower in the total number of tuberculosis cases, the response to anti-tuberculosis treatment in clinical practice is poor. MDR is difficult to cure, causing grievous harm to patients and increasing transmission.
Definitive diagnosis of MDR-TB by conventional culture followed by drug susceptibility testing (DST) based on phenotypic tests is time-consuming and tedious. Rapid and accurate diagnosis followed by prompt treatment and completed therapy is essential for the effective control of MDR-TB. The conventional DST cannot provide the appropriate and timely diagnosis required for proper patient management. During the past decades, efficient molecular detection techniques that have been used for DST include Xpert MTB/RIF, GenoType MTBDRplus, and Abbott RealTime MTB RIF/INH Resistance[2-4]. Loop-mediated isothermal amplification (LAMP), which was first reported in 2004, is a nucleic acid amplification technology used to detect Mycobacterium tuberculosis (Mtb)[5,6]. MDR-LAMP assay is a new manual mutation site detection method based on the LAMP platform from Eiken Chemical Company in Japan. The probes (MDR-LAMP) detect mutations associated with the rpoB gene for RIF resistance, katG genes for high-level INH resistance, and the inhA regulatory region gene for low-level INH resistance.
This study aimed to evaluate the mutation detection accuracy of MDR-LAMP in the National Reference Laboratory for Tuberculosis in China.
-
Mycobacterial strains were obtained from the National Reference Laboratory for Tuberculosis in China. We selected 65 MDR isolates, 22 INH mono-resistant isolates, 4 RIF mono-resistant isolates, and 9 INH- and RIF-sensitive isolates on the basis of the drug sensitivity test results. A total of 100 strains were re-cultured on Löwenstein-Jensen medium and incubated in 37 ℃ for 3 weeks.
-
For each sample, one loop of cultures was suspended in 400 µL of TE buffer, boiled at 95 °C for 30 min, and then placed in an ice bath for 5 min. After cooling, the suspension was sonicated for 5 min and then centrifuged at 12,000 ×g for 5 min. Finally, 200 μL of the supernatant containing DNA was transferred into a new microcentrifuge tube.
-
Measurements were performed with a Microflex LT (Bruker Daltonics) mass spectrometer laser. Spectra were recorded in the positive linear mode [delay: 170 ns; ion source 1 (IS1) voltage: 20 kV; ion source 2 (IS2) voltage: 16.65 kV; lens voltage: 7.20 kV; mass range: 2–20 kD]. Each spectrum was obtained after 6 × 200 shots (1200 shots) in automatic mode at a variable laser power, and the acquisition time ranged from 60 s to 120 s per spot. All signals with resolution ≥ 400 were automatically acquired using MALDI Biotyper RTC in FlexControl software version 3.4, and the identifications were obtained by MALDI Biotyper OC version 4.0 with the Mycobacteria Library v3.0 (2017) database, which contains 987 main spectrum profiles representing 173 species. An identification score was given using Biotyper software version 4.0 (Bruker Daltonics).
-
DSTs were performed at the National Reference Laboratory for Tuberculosis in China by using the broth microdilution MIC method. A panel of 13 drugs (including INH and RPF) using the Sensititre® MYCOTBI pates for Mtb (TREK Diagnostic Systems, Cleveland, USA) was used in the drug resistance test. During the experiments, 0.5 McFarland suspensions of bacteria were prepared by Ultrasonic Milling Instrument (TB Healthcare, China) from colonies grown on an L-J culture medium. Suspensions were diluted 100-fold with the addition of 100 μL of the 0.5 Mc suspensions to 10 mL of Mueller-Hinton broth with/without OADC. Aliquots of 100 μL of the standard 1.5 × 10⁵ CFU/mL inoculum were distributed to each well by using the semi-automated SensititreTM Auto-inoculator (Thermo Fisher, Scientific Inc., USA). The plates were sealed with the adhesive membranes accurately and adequately and incubated at the recommended temperature to prevent evaporation and skipped wells during incubation. MIC is defined as the lowest concentration without obvious visible bacterial growth compared with positive controls, which was measured by two readers, aided by VizionTM Digital viewing system. Mtb H37Rv (ATCC 27294) was used as quality control in every batch of drug susceptibility testing. The breakpoints based on CLSI M62 to INH and RPF were 0.25 and 2.
-
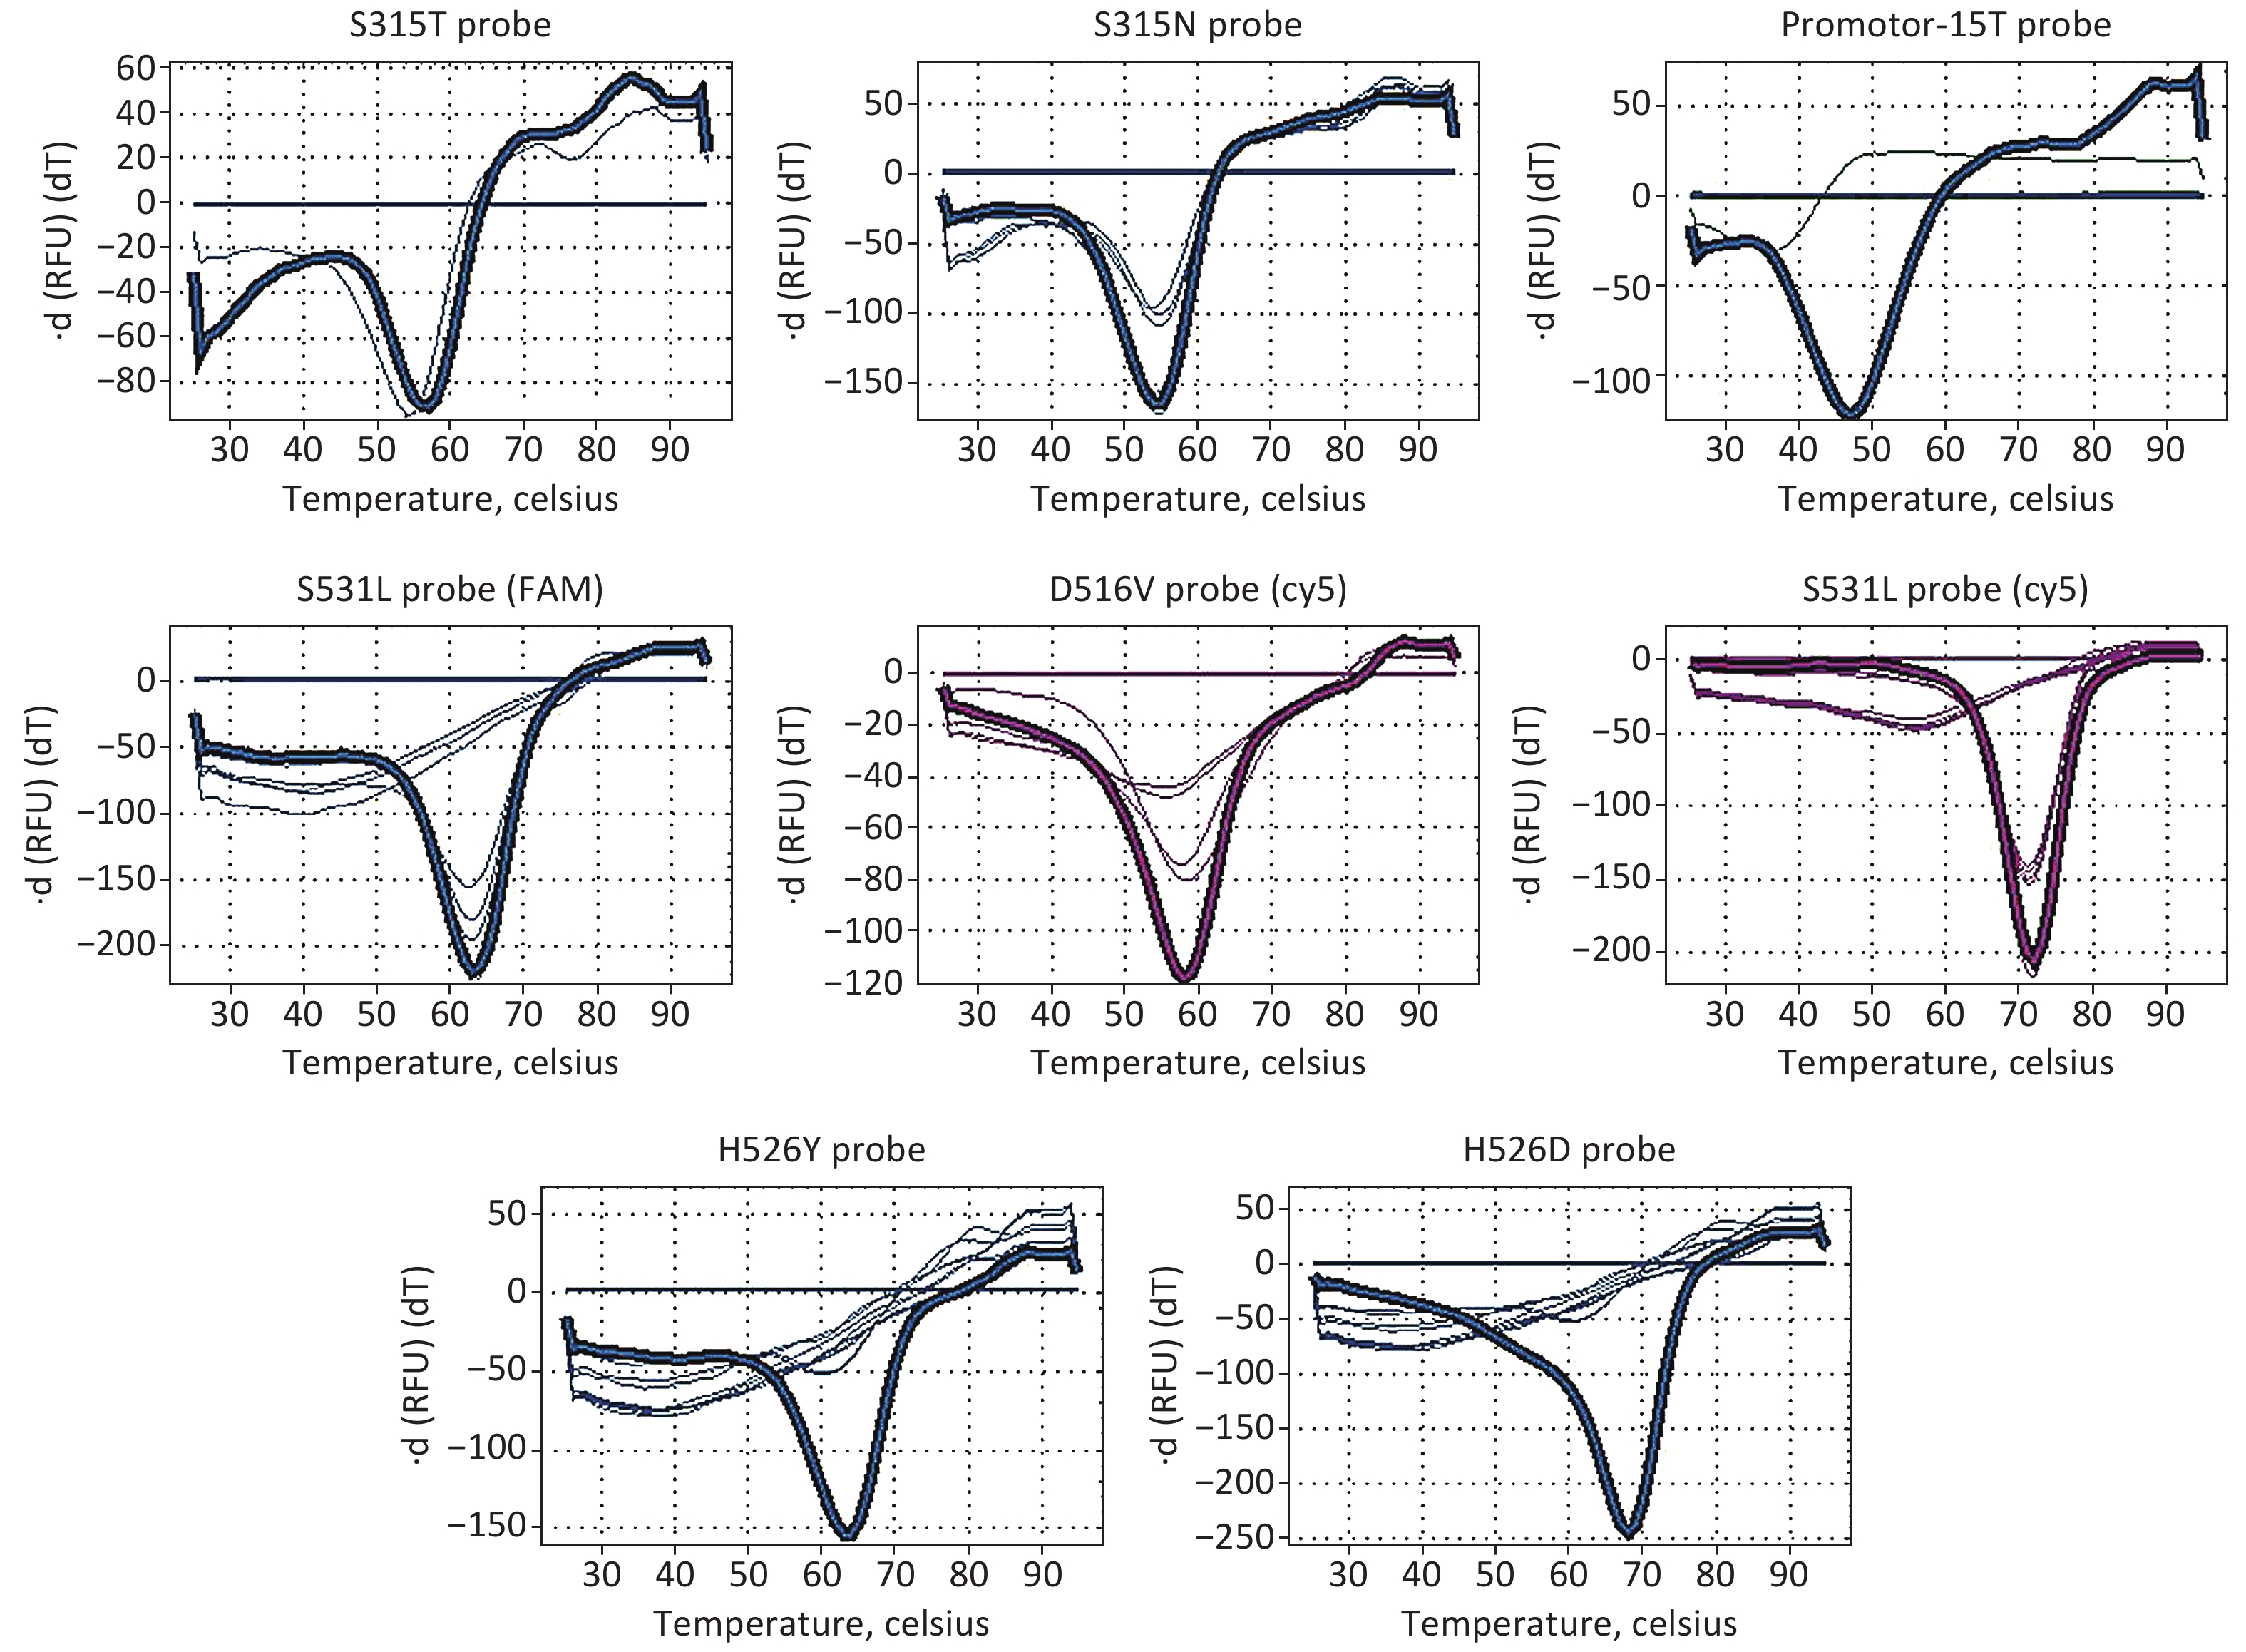
MDR-LAMP assay was performed using a detection kit (supplied by Eiken, Japan). The extracted DNA samples were denatured at 90 ℃ for 5 min, and 5 µL was added to each reaction tube that dispensed Reagent A, B, or C. When the measurement with the LAMP reaction step, denaturing step, and thermal dissociation step was finished, results were checked as follows: Reagent A: FAM curve: Presence of peaks over 50 ℃ indicates that the sample has a mutation on the katG legion (S315T, S315N); presence of peaks under 50 ℃ indicates that the sample has a mutation on the inhA Promotor-15. Reagent B: FAM curve: The presence of some peaks indicates that the sample has a mutation on the rpoB legion (S531L or L533P); Cy5 curve: Presence of some peaks indicates that the sample has a mutation on the rpoB legion (D516V or S531L). Reagent C: FAM curve: The presence of some peaks indicates that the sample has a mutation on the rpoB legion (H526Y or H526D). Other conditions were used to check correct amplification.
-
Genomic DNA of the INH and/or RIF-resistant mutants was subjected to WGS using the Illumina HiSeq 2500 system with the paired-end strategy as described previously[7]. A previously validated pipeline was used for mapping the short sequencing reads to the reference genome. Mutations were called when they were present in more than two reads in the forward and reverse directions, with Mtb H37Rv strain (NC_000962.3) as a reference. Mutations in genes of the proline–glutamic acid (PE)/proline–proline–glutamic acid (PPE) family and in regions with repetitive sequences were excluded from the analysis.
-
Data were analyzed using VassarStats (http://vassarstats.net/index.html), a website for statistical computation. Sensitivity, specificity, and positive and negative predictive values (PPV and NPV) were calculated of MDR-LAMP. The percentages of specificity and sensitivity were calculated using the formulae shown below: Sensitivity = true positives / (true positives + false negatives) × 100 and Specificity = true negatives / (true negatives + false positives) × 100. The PPV was calculated by true positives × 100 / (true positives + false positives). The NPV was calculated by true negatives × 100 / (true negatives + false negatives). The concordance between the two tests was calculated using χ2 and McNemar tests and expressed as a P value.
-
Phenotypic DST was performed on 100 Mtb strains using the CLSI-recommended broth microdilution MIC method. The phenotypic DST results of the 100 Mtb isolates selected in this study are listed in Supplementary Table S1, available in www.besjournal.com. Of the 100 Mtb isolates, 65 (65%) were MDR strains, 22 (22%) were mono-INH-resistant strains, 4 (4%) were mono-RIF-resistant strains, and 9 (9%) were INH- and rifampin-sensitive strains. The results for each probe detected by MDR-LAMP are shown in Figure 1. The performance of MDR-LAMP is summarized in Table 1. The sensitivity and specificity of MDR-LAMP reagents for detecting RIF resistance were 85.5% and 93.5%, respectively. The PPV and NPV were 96.7% and 74.4%, respectively. The sensitivity and specificity of detecting INH resistance were 80.5% and 92.3%, respectively, and the PPV and NPV were 98.6% and 41.4%, respectively. Considering that the P values are both lesser than 0.01, we investigated the reason why the coverage of the resistant genes tested or the accuracy of the MDR-LAMP reagents affected the consistency between MDR-LAMP and phenotypic DST results. As shown in Table 2, the sensitivity of the MDR-LAMP detection of INH (katG and inhA) resistance gene mutations was 93.2%, and the specificity was 92.3%. The PPV and NPV were 97.2% and 82.8% compared with whole-genome sequencing (WGS). The sensitivity and specificity of RIF (rpoB) resistance gene mutations were 89.1% and 88.9%, respectively, and the PPV and NPV were 93.4% and 82.1%, respectively. The results showed that the accuracy of the MDR-LAMP reagents to detect rpoB gene mutations must improve. We calculated the detection sensitivity, specificity, PPV, and NPV of each probe compared with the mutation results obtained by WGS analysis to evaluate the efficiency of each probe for detecting rpoB. The consistency rate of each probe for detecting rpoB S531L/L533P and rpoB H526Y/H526D mutations presented a significant difference to WGS (P < 0.05). The specificity of the probe for detecting rpoB H526Y/H526D mutation was 93.7%, whereas that of the other probes was 100% (Table 3). As shown in Table 4, all the 11 rpoB S531L mutations detected by the FAM filter in rpoB S531L mutations were detected by the Cy5 filter, whereas the sensitivity of the probe rpoB S531L/L533P was 29.7%. In conclusion, the number of resistance-related mutation sites should be increased in the MDR-LAMP assay to cover the phenotypic resistance of INH and RIF. In addition, the probes for detecting gene mutations should be optimized to improve accuracy, especially for the rpoB gene.
Table S1. The phenotypic DST results of the 100 Mtb isolates
LAMP MDR assay Strain No. MIC Cutoff-value DST (S:Sensitivity, R:Resistance) WGS Gene: (W:Wild, M:Mutant) LAMP MDR (+:Detect, −:Not Detect) INH:
> 0.2RIF:
> 1INH RIF rpoB site katG site inhA-
Promotor-
15Reagent
AT Reagent
BT Reagent
CT 031024 2 > 16 R R M S531L M S315T W + 55 °C + Cy5:73 °C − 033059 4 > 16 R R W − W − M − − + 64 °C 033061 2 > 16 R R M H526Y M S315T W + 54 °C − + 65 °C 033062 2 > 16 R R M H526Y M S315T W + 54 °C − + 65 °C 033063 2 > 16 R R M H526Y M S315T W + 56 °C − + 65 °C 033064 2 > 16 R R M H526Y M S315T W + 56 °C − + 65 °C 033065 2 > 16 R R M H526Y M S315T W + 54 °C − + 62 °C 033066 2 > 16 R R M H526Y M S315T W + 54 °C − + 65 °C 033067 2 > 16 R R M H526Y M S315T W + 54 °C − + 65 °C 033068 2 > 16 R R M H526Y M S315T W + 54 °C − + 65 °C 033070 2 > 16 R R M H526Y M S315T W + 54 °C − + 65 °C 033071 2 > 16 R R M H526Y M S315T W + 54 °C − + 64 °C 033102 1 > 16 R R M S531L W − W − + Cy5:71 °C − 033106 1 > 16 R R M S531L W − W − + Cy5:72 °C − 033109 1 > 16 R R M S531L W − W − + Cy5:72 °C − 033127 2 > 16 R R M S531L M S315T W + 55 °C − + 62 °C 033129 1 > 16 R R M H526Y M S315T W + 55 °C − + 66 °C 033159 4 > 16 R R M S531L M S315T W + 55 °C + Cy5:72 °C − 033214 4 > 16 R R M S531L M S315T W + 55 °C + Cy5:72 °C − 061021 0.5 > 16 R R M S531L W − W − + Cy5:71 °C − 061026 4 > 16 R R W − M S315T W + 54 °C − + 61 °C 061045 4 ≤ 0.12 R S W − M S315T W + 54 °C − − 061046 4 > 16 R R W − M S315T W + 54 °C − − 061102 0.06 > 16 S R M H526Y W − W − − + 62 °C 061105 4 ≤ 0.12 R S W − M S315T W + 55 °C − − 061260 0.06 > 16 S R M S531L W − W − − + 68 °C 061300 4 ≤ 0.12 R S W − M S315T W + 55 °C − − 061301 4 ≤ 0.12 R S W − M S315T W + 55 °C − − 061305 4 > 16 R R W − M S315T W + 55 °C − − 061315 > 4 1 R S W − W − M − − − 071014 4 16 R R M S531L M S315T W − − − 071023 4 0.12 R S W − M S315T W + 55 °C − − 071028 4 0.5 R S W − M S315T W + 55 °C − − 071031 4 0.25 R S W − M S315T W + 55 °C − − 071040 2 16 R R M H526Y M S315T W + 54 °C − + 62 °C 071061 4 16 R R M S531L M S315T W + 54 °C + FAM:63 °C,
Cy5:72 °C+ 64 °C 071070 2 16 R R M H526D W − W − − + 67 °C 071075 4 0.12 R S W − M S315T W + 55 °C − − 071097 4 16 R R W − M S315T W + 54 °C − − 071107 4 16 R R W − M S315T W + 55 °C − − 071121 4 0.12 R S W − M S315T W + 55 °C − − 071126 4 0.12 R S W − M S315T W + 55 °C − − 071127 4 16 R R W − M S315T W + 55 °C − − 071140 4 1 R S W − M S315T W + 55 °C − − 081005 2 > 16 R R M H526D M S315T W + 54 °C − + 68 °C 081044 2 > 16 R R M S531L M S315T W + 54 °C + FAM:63 °C,
Cy5:72 °C− 081051 2 > 16 R R M S531L M S315T W + 54 °C + FAM:63 °C,
Cy5:72 °C− 081056 2 > 16 R R M S531L M S315T W + 54 °C + FAM:63 °C,
Cy5:72 °C− 081067 4 > 16 R R M S531L M S315T W + 54 °C + FAM:63 °C,
Cy5:72 °C− 081161 0.06 > 16 S R M S531L W − W − + Cy5:72 °C − 081217 0.12 > 16 S R M S531L W − W − + Cy5:71 °C − 082248 4 16 R R M S531L M S315T W + 54 °C + Cy5:71 °C − 082308 0.25 > 16 R R M S531L W − W − + Cy5:72 °C − 082312 4 > 16 R R M L533P W − W + 48 °C − − 091079 4 0.25 R S W − M S315N W + 54 °C − − 091104 4 0.25 R S W − M S315T W + 55 °C − − 091119 4 0.25 R S W − M S315T W + 55 °C − − 102238 4 16 R R M S531L M S315T W + 54 °C + FAM:62 °C,
Cy5:72 °C− 104186 0.03 0.12 S S W − W − W − − − 104191 0.03 0.25 S S W − W − W − − − 104200 0.06 0.5 S S W − W − W − − − 104218 0.03 0.12 S S W − W − W − − − 104229 0.03 0.12 S S W − W − W − − − 151022 2 16 R R M H526D M S315T W + 54 °C − + 67 °C 153058 4 16 R R M H526Y M S315T W + 55 °C − − 154089 2 16 R R M H526Y M S315T W + 54 °C − + 66 °C 154214 4 0.25 R S W − M S315T W + 55 °C − − 154285 4 0.12 R S W − M S315T W + 55 °C − − 154286 2 16 R R M H526Y M S315T W + 55 °C − + 66 °C 171019 2 16 R R M D516V W − W − + Cy5:60 °C − 171026 0.5 > 16 R R M S531L W − W − + FAM:62 °C,
Cy5:72 °C− 171052 > 4 > 16 R R M S531L W − W − + FAM:62 °C,
Cy5:72 °C− 171064 > 4 > 16 R R M H526D M S315T W + 54 °C − + 67 °C 171078 > 4 16 R R M D516V M S315T W + 54 °C − − 171079 > 4 16 R R M D516V W − W − + Cy5:60 °C − 171292 2 > 16 R R M H526Y M S315T W + 56 °C − + 64 °C 171607 4 > 16 R R M S531L M S315T W + 56 °C + Cy5:72 °C − 172096 0.06 ≤ 0.12 S S M S531L M S315T W + 56 °C + Cy5:72 °C − 172300 4 > 16 R R M D516V M S315T W + 56 °C + Cy5:60 °C − 172314 > 4 > 16 R R M S531L M S315T W + 56 °C + Cy5:72 °C − 172573 2 > 16 R R M S531L M S315N W + 54 °C + Cy5:72 °C − 173001 0.25 > 16 R R M S531L W − W + 46 °C + FAM:62 °C,
Cy5:71 °C− 173093 > 4 > 16 R R M S531L W − W − + FAM:62 °C,
Cy5:72 °C− 173422 0.5 ≤ 0.12 R S W − W − W − − − 174067 0.06 0.25 S S W − M S315T W − − − 184403 4 16 R R M S531L M S315T W + 55 °C + Cy5:71 °C − 185209 4 0.5 R S W − M S315T W + 55 °C − − 185544 4 16 R R M S531L M S315T W + 56 °C + Cy5:67 °C − 185551 4 0.25 R S W − M S315T W + 55 °C − − 19200003 4 0.25 R S W − M S315T W + 55 °C − − 19200399 4 16 R R M S531L M S315T W + 55 °C + Cy5:72 °C − 221211 2 1 R S M D516V M S315N W − + Cy5:60 °C − 221227 0.25 16 R R M S531L W − W − + FAM:62 °C,
Cy5:71 °C− 221437 2 16 R R M S531L M S315T W + 56 °C + Cy5:72 °C − 221518 4 16 R R M S531L W − M + 48 °C + Cy5:72 °C − 221571 4 16 R R M S531L M S315T W + 55 °C + Cy5:72 °C − 222280 4 16 R R M D516V M S315T W + 55 °C + Cy5:60 °C − 233077 0.06 0.25 S S W − W − W − − − 235254 0.06 0.12 S S W − W − W − − − 320005 2 2 R R M S531L M S315T W + 55 °C − − 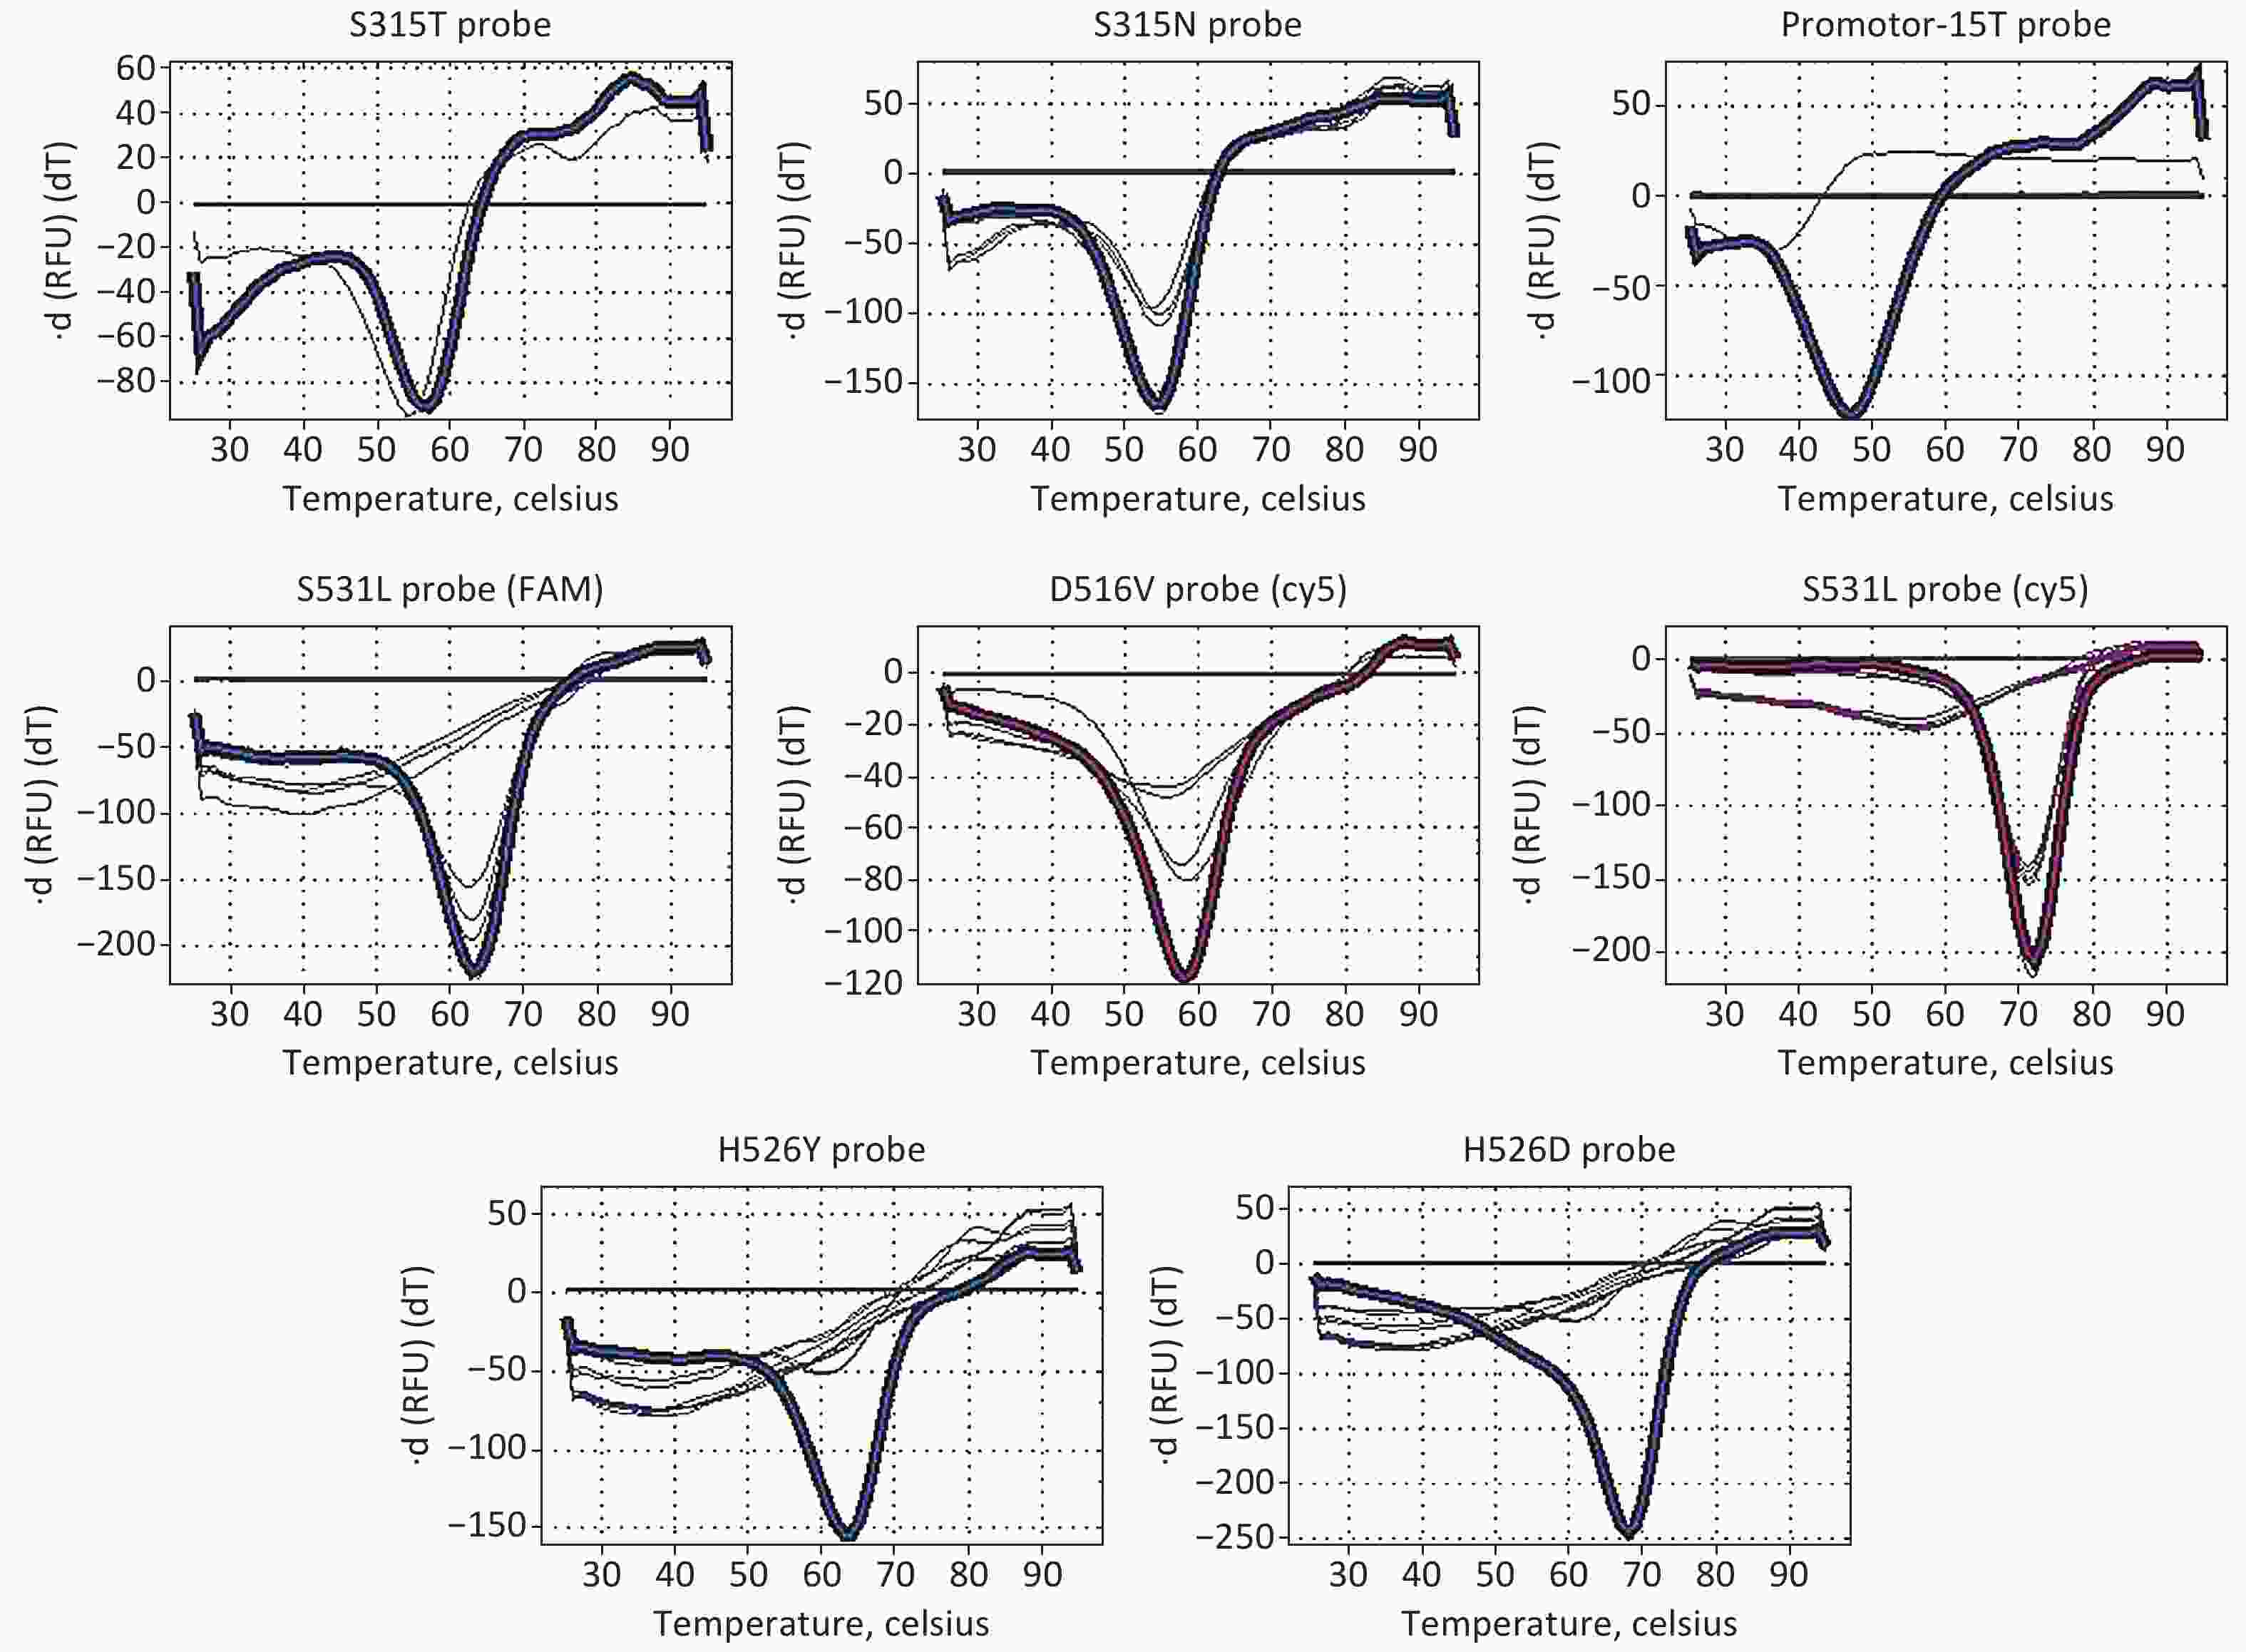
Figure 1. Degree Celsius distribution of each probe by MDR-LAMP reagents.
Table 1. Efficacy of MDR-LAMP test compared with the broth microdilution MIC method
Drugs MIC MDR-LAMP Sub-total Sensitivity
(95% CI)aSpecificity
(95% CI)aPPV
(95% CI)aNPV
(95% CI)aχ2 b Pc Resistance Sensitive RIF Resistance 59 10 69 85.5%
(74.5–92.5)93.6%
(77.2–98.9)96.7%
(87.6–99.4)74.4%
(57.6–86.4)10.73d 0.039 Sensitive 2 29 31 Sub-total 61 39 100 INH Resistance 70 17 87 80.5%
(70.3–87.9)92.3%
(62.1–99.6)98.6%
(91.4–99.9)41.4%
(24.1–60.9)17.64e < 0.01 Sensitive 1 12 13 Sub-total 71 29 100 Note. aWilson 95% confidence interval: including continuity correction; bν = 1 the chi-square value reported is the Yates chi-square, corrected for continuity (dν = 1, P = 0.0011, eν = 1, P < 0.0001); cMcNemar’s test, two-tail. Table 2. Comparison of gene mutation identified by WGS and MDR-LAMP assay
Drugs (genes) WGS MDR-LAMP Sub-total Sensitivity
(95% CI)aSpecificity
(95% CI)aPPV
(95% CI)aNPV
(95% CI)aχ2 b Pc Mutation Wild INH (katG, inhA) Mutation 69 5 74 93.2%
(84.3–97.5)92.3%
(73.4–98.7)97.2%
(89.3–99.5)82.8%
(63.5–93.5)5.33d 0.453 Wild 2 24 26 Sub-total 71 29 100 RIF (rpoB) Mutation 57 7 64 89.1%
(78.2–95.1)88.9%
(73.0–96.4)93.4%
(83.3–97.9)82.1%
(65.9–91.9)9.62e 0.549 Wild 4 32 36 Sub-total 61 39 100 Note. aWilson 95% confidence interval: including continuity correction; bν = 1 the chi-square value reported is the Yates chi-square, corrected for continuity (dν = 1, P = 0.021, eν = 1, P = 0.0019); cMcNemar’s test, two-tail. Table 3. Evolution efficiency of each probe of MDR-LAMP
Reagent Probes WGS MDR-LAMP Sub-total Sensitivity
(95% CI)aSpecificity
(95% CI)aPPV
(95% CI)aNPV
(95% CI)aχ2 b Pc Mutation Wild Reagent B FAM: rpoB
S531L/L533PMutation 11 26 37 29.7%
(16.4–47.2)100%
(92.8–100)100%
(67.9–100)70.8%
(60.1–79.7)27.6d < 0.01 Wild 0 63 63 Sub-total 11 89 100 Reagent B Cy5: rpoB
D516V/S531LMutation 37 5 42 88.1%
(73.6–95.5)100%
(92.3–100)100%
(88.3–100)92.1%
(81.7–97.0)3.28e 0.063 Wild 0 58 58 Sub-total 37 63 100 Reagent C FAM: rpoB
H526Y/ H526DMutation 20 1 21 95.2%
(74.1–99.8)93.7%
(85.2–97.7)80%
(58.7–92.4)98.7%
(91.8–99.9)4.3f 0.219 Wild 5 74 79 Sub-total 25 75 100 Reagent A FAM: katG
S315N/S315TMutation 68 3 71 95.8%
(87.3–98.9)100%
(85.4–100)100%
(93.3–100)90.6%
(73.8–97.6)1.35g 0.25 Wild 0 29 29 Sub-total 68 32 100 Reagent A FAM:
inhA Promotor-15Mutation 1 2 3 33.3%
(1.8–87.5)100%
(95.3–100)100%
(5.5–100)98%
(92.2–99.7)0.51h 0.5 Wild 0 97 97 Sub-total 1 99 100 Note. aWilson 95% confidence interval: including continuity correction; bν = 1 the chi-square value reported is the Yates chi-square, corrected for continuity (dν = 1, P < 0.0001, eν = 1, P = 0.0701, fν = 1, P = 0.0381, gν = 1, P = 0.2453, hν = 1, P = 0.4751); cMcNemar’s test, two-tail. Table 4. Degree Celsius distribution of each probe by MDR-LAMP reagents
Drugs (genes) Mutation site Number of strains Predict degree Celsius Actual degree Celsius (Number) INH (katG、inhA) katG S315T 68 FAM:56 °C 54 °C (25), 55 °C (32), 56 °C (9), -(2) katG S315N 3 FAM:54 °C 54 °C (2), -(1) inhA Promotor-15T 3 FAM:46 °C 46 °C (2), 48 °C (1) RIF (rpoB) rpoB S531L 36 FAM:63 °C and / or Cy5:73 °C FAM:62 °C and Cy5:71 °C (2), FAM:62 °C and
Cy5:72 °C (4), FAM:63 °C and Cy5:72 °C (5),
Cy5:67 °C (1), Cy5:71 °C (5), Cy5:72 °C (14),
Cy5:73 °C (1), -(4)rpoB D516V 6 Cy5:61 °C 60 °C (5), -(1) rpoB L533P 0 − − rpoB H526Y 17 FAM:67 °C 62 °C (3), 64 °C (2), 65 °C (8), 66 °C (3), -(1) rpoB H526D 4 FAM: 69 °C 67 °C (3), 68 °C (1) Note. “−” indicates “not detected.” -
In our study, we evaluated an in vitro LAMP assay for the detection of RIF and INH resistance-associated mutations in Mtb complex samples. A nucleic acid amplification method relies on auto-cycling strand displacement DNA synthesis[5,8,9]. The targets are diverse and include the rpoB, katG, and inhA promoter genes. Compared with the phenotypic method, which is the gold standard for Mtb drug susceptibility testing, we obtained sensitivity and specificity of 85.5% and 93.5% for RIF resistance, respectively, and 80.5% and 92.3% for INH resistance, respectively. Compared with WGS, which has been proposed as the ultimate molecular diagnostic test for detecting all molecular determinants for resistance[10-12], sensitivity and specificity of 92.2% and 94.4% for RIF resistance gene mutations, respectively, and 95.9% and 100% for INH resistance gene mutations, respectively, were reported.
Drug-resistant tuberculosis is a permanent threat to the global control of the disease. The emergence of MDR-TB is increasing in some regions of the world. During the past decades, the methods currently available are based on the evidence that resistance-associated mutations occur in specific regions of the genes whose products are targeted by these antibiotics[13]. MDR-LAMP assay is a molecular diagnostic test that detects INH and RIF resistance-associated mutations. The most frequent INH resistance-conferring mutations have been indicated in the katG and inhA gene regions[14]. The katG S315I, S315N, S315T, and combined frameshifts and premature stop codons are high-confidence markers of INH resistance, and the inhA promoter-15 mutation is a moderate-confidence resistance mutation[15]. The mutations in an 81-base pair region of the rpoB gene are most commonly associated with RIF resistance[16]. The rpoB D516V, H526D, H526Y, and S531L are high-confidence markers, while L533P is a moderate-confidence marker of RIF resistance[10,17]. MDR-LAMP assay covers the overlapping RIF resistance determining region of the rpoB, katG, and inhA genes and above mutations of the rpoB gene, mutations at codon 315 of the katG gene, and mutations in the promoter-15 of the inhA gene.
The TB-LAMP method was endorsed by the WHO in 2016 for the diagnosis of pulmonary tuberculosis in adults, which has been a primary diagnostic test for pulmonary tuberculosis in low-resource settings[13]. MDR-LAMP assay gains similar sensitivity and specificity to other genotypic assays used to screen drug resistance-associated mutations in Mtb[18,19]. In conclusion, MDR-LAMP assay is a simple, rapid, specific, and cost-effective method that needs less sophisticated infrastructures and minimal biosafety requirements. The number of resistance-related mutation sites should be increased to cover the phenotypic resistance of INH and RIF and improve the accuracy of the MDR-LAMP assay. In addition, the probes for detecting ropB should be optimized to improve accuracy.
-
We highly acknowledge the reagents supplied by Eiken, Japan.
-
The authors declare no known competing financial interests or personal relationships that could have appeared to influence the work reported in this paper.
-
SONG Yi Meng: conceptualization, methodology, software. LIU Chun Fa: data curation, writing-original draft preparation. HE Ping: visualization, investigation. HE Wen Cong: supervision. LIU Dong Xin: software, validation. LI Yan Ming: supervision. ZHAO Yan Lin: writing-reviewing and editing.
doi: 10.3967/bes2021.085
Evaluation of Multidrug Resistant Loop-mediated Isothermal Amplification Assay for Detecting the Drug Resistance of Mycobacterium tuberculosis
-
Abstract:
Objective To evaluate multidrug resistant loop-mediated isothermal amplification (MDR-LAMP) assay for the early diagnosis of multidrug-resistant tuberculosis and to compare the mutation patterns associated with the rpoB, katG, and inhA genes at the Chinese Center for Disease Control and Prevention. Methods MDR-LAMP assay was evaluated using 100 Mycobacterium tuberculosis (Mtb) isolates obtained from the National Reference Laboratory for Tuberculosis in China. Phenotypic resistance to isoniazid and rifampicin and whole-genome sequencing served as reference standards. Results The sensitivity, specificity, positive predictive value (PPV), and negative predictive value (NPV) of MDR-LAMP were 85.5%, 93.6%, 96.7%, and 74.4% for the detection of resistance to isoniazid and rifampicin, respectively, and 80.5%, 92.3%, 98.6%, and 41.4% for the detection of Mtb cultured from smear-positive sputum samples, respectively. When DNA sequencing was used as the reference standard, the sensitivity, specificity, PPV, and NPV of MDR-LAMP were 93.1%, 92.3%, 97.2%, and 82.8% for the detection of katG and inhA gene mutations, respectively, and 89.1%, 88.9%, 93.4%, and 81.1% for the detection of rpoB gene mutation, respectively. Conclusion MDR-LAMP is a rapid and accessible assay for the laboratory identification of rifampicin and isoniazid resistance of Mtb isolates. -
Key words:
- MDR-LAMP /
- Mycobacterium tuberculosis /
- Diagnostic method
注释: -
S1. The phenotypic DST results of the 100 Mtb isolates
LAMP MDR assay Strain No. MIC Cutoff-value DST (S:Sensitivity, R:Resistance) WGS Gene: (W:Wild, M:Mutant) LAMP MDR (+:Detect, −:Not Detect) INH:
> 0.2RIF:
> 1INH RIF rpoB site katG site inhA-
Promotor-
15Reagent
AT Reagent
BT Reagent
CT 031024 2 > 16 R R M S531L M S315T W + 55 °C + Cy5:73 °C − 033059 4 > 16 R R W − W − M − − + 64 °C 033061 2 > 16 R R M H526Y M S315T W + 54 °C − + 65 °C 033062 2 > 16 R R M H526Y M S315T W + 54 °C − + 65 °C 033063 2 > 16 R R M H526Y M S315T W + 56 °C − + 65 °C 033064 2 > 16 R R M H526Y M S315T W + 56 °C − + 65 °C 033065 2 > 16 R R M H526Y M S315T W + 54 °C − + 62 °C 033066 2 > 16 R R M H526Y M S315T W + 54 °C − + 65 °C 033067 2 > 16 R R M H526Y M S315T W + 54 °C − + 65 °C 033068 2 > 16 R R M H526Y M S315T W + 54 °C − + 65 °C 033070 2 > 16 R R M H526Y M S315T W + 54 °C − + 65 °C 033071 2 > 16 R R M H526Y M S315T W + 54 °C − + 64 °C 033102 1 > 16 R R M S531L W − W − + Cy5:71 °C − 033106 1 > 16 R R M S531L W − W − + Cy5:72 °C − 033109 1 > 16 R R M S531L W − W − + Cy5:72 °C − 033127 2 > 16 R R M S531L M S315T W + 55 °C − + 62 °C 033129 1 > 16 R R M H526Y M S315T W + 55 °C − + 66 °C 033159 4 > 16 R R M S531L M S315T W + 55 °C + Cy5:72 °C − 033214 4 > 16 R R M S531L M S315T W + 55 °C + Cy5:72 °C − 061021 0.5 > 16 R R M S531L W − W − + Cy5:71 °C − 061026 4 > 16 R R W − M S315T W + 54 °C − + 61 °C 061045 4 ≤ 0.12 R S W − M S315T W + 54 °C − − 061046 4 > 16 R R W − M S315T W + 54 °C − − 061102 0.06 > 16 S R M H526Y W − W − − + 62 °C 061105 4 ≤ 0.12 R S W − M S315T W + 55 °C − − 061260 0.06 > 16 S R M S531L W − W − − + 68 °C 061300 4 ≤ 0.12 R S W − M S315T W + 55 °C − − 061301 4 ≤ 0.12 R S W − M S315T W + 55 °C − − 061305 4 > 16 R R W − M S315T W + 55 °C − − 061315 > 4 1 R S W − W − M − − − 071014 4 16 R R M S531L M S315T W − − − 071023 4 0.12 R S W − M S315T W + 55 °C − − 071028 4 0.5 R S W − M S315T W + 55 °C − − 071031 4 0.25 R S W − M S315T W + 55 °C − − 071040 2 16 R R M H526Y M S315T W + 54 °C − + 62 °C 071061 4 16 R R M S531L M S315T W + 54 °C + FAM:63 °C,
Cy5:72 °C+ 64 °C 071070 2 16 R R M H526D W − W − − + 67 °C 071075 4 0.12 R S W − M S315T W + 55 °C − − 071097 4 16 R R W − M S315T W + 54 °C − − 071107 4 16 R R W − M S315T W + 55 °C − − 071121 4 0.12 R S W − M S315T W + 55 °C − − 071126 4 0.12 R S W − M S315T W + 55 °C − − 071127 4 16 R R W − M S315T W + 55 °C − − 071140 4 1 R S W − M S315T W + 55 °C − − 081005 2 > 16 R R M H526D M S315T W + 54 °C − + 68 °C 081044 2 > 16 R R M S531L M S315T W + 54 °C + FAM:63 °C,
Cy5:72 °C− 081051 2 > 16 R R M S531L M S315T W + 54 °C + FAM:63 °C,
Cy5:72 °C− 081056 2 > 16 R R M S531L M S315T W + 54 °C + FAM:63 °C,
Cy5:72 °C− 081067 4 > 16 R R M S531L M S315T W + 54 °C + FAM:63 °C,
Cy5:72 °C− 081161 0.06 > 16 S R M S531L W − W − + Cy5:72 °C − 081217 0.12 > 16 S R M S531L W − W − + Cy5:71 °C − 082248 4 16 R R M S531L M S315T W + 54 °C + Cy5:71 °C − 082308 0.25 > 16 R R M S531L W − W − + Cy5:72 °C − 082312 4 > 16 R R M L533P W − W + 48 °C − − 091079 4 0.25 R S W − M S315N W + 54 °C − − 091104 4 0.25 R S W − M S315T W + 55 °C − − 091119 4 0.25 R S W − M S315T W + 55 °C − − 102238 4 16 R R M S531L M S315T W + 54 °C + FAM:62 °C,
Cy5:72 °C− 104186 0.03 0.12 S S W − W − W − − − 104191 0.03 0.25 S S W − W − W − − − 104200 0.06 0.5 S S W − W − W − − − 104218 0.03 0.12 S S W − W − W − − − 104229 0.03 0.12 S S W − W − W − − − 151022 2 16 R R M H526D M S315T W + 54 °C − + 67 °C 153058 4 16 R R M H526Y M S315T W + 55 °C − − 154089 2 16 R R M H526Y M S315T W + 54 °C − + 66 °C 154214 4 0.25 R S W − M S315T W + 55 °C − − 154285 4 0.12 R S W − M S315T W + 55 °C − − 154286 2 16 R R M H526Y M S315T W + 55 °C − + 66 °C 171019 2 16 R R M D516V W − W − + Cy5:60 °C − 171026 0.5 > 16 R R M S531L W − W − + FAM:62 °C,
Cy5:72 °C− 171052 > 4 > 16 R R M S531L W − W − + FAM:62 °C,
Cy5:72 °C− 171064 > 4 > 16 R R M H526D M S315T W + 54 °C − + 67 °C 171078 > 4 16 R R M D516V M S315T W + 54 °C − − 171079 > 4 16 R R M D516V W − W − + Cy5:60 °C − 171292 2 > 16 R R M H526Y M S315T W + 56 °C − + 64 °C 171607 4 > 16 R R M S531L M S315T W + 56 °C + Cy5:72 °C − 172096 0.06 ≤ 0.12 S S M S531L M S315T W + 56 °C + Cy5:72 °C − 172300 4 > 16 R R M D516V M S315T W + 56 °C + Cy5:60 °C − 172314 > 4 > 16 R R M S531L M S315T W + 56 °C + Cy5:72 °C − 172573 2 > 16 R R M S531L M S315N W + 54 °C + Cy5:72 °C − 173001 0.25 > 16 R R M S531L W − W + 46 °C + FAM:62 °C,
Cy5:71 °C− 173093 > 4 > 16 R R M S531L W − W − + FAM:62 °C,
Cy5:72 °C− 173422 0.5 ≤ 0.12 R S W − W − W − − − 174067 0.06 0.25 S S W − M S315T W − − − 184403 4 16 R R M S531L M S315T W + 55 °C + Cy5:71 °C − 185209 4 0.5 R S W − M S315T W + 55 °C − − 185544 4 16 R R M S531L M S315T W + 56 °C + Cy5:67 °C − 185551 4 0.25 R S W − M S315T W + 55 °C − − 19200003 4 0.25 R S W − M S315T W + 55 °C − − 19200399 4 16 R R M S531L M S315T W + 55 °C + Cy5:72 °C − 221211 2 1 R S M D516V M S315N W − + Cy5:60 °C − 221227 0.25 16 R R M S531L W − W − + FAM:62 °C,
Cy5:71 °C− 221437 2 16 R R M S531L M S315T W + 56 °C + Cy5:72 °C − 221518 4 16 R R M S531L W − M + 48 °C + Cy5:72 °C − 221571 4 16 R R M S531L M S315T W + 55 °C + Cy5:72 °C − 222280 4 16 R R M D516V M S315T W + 55 °C + Cy5:60 °C − 233077 0.06 0.25 S S W − W − W − − − 235254 0.06 0.12 S S W − W − W − − − 320005 2 2 R R M S531L M S315T W + 55 °C − −  下载: 导出CSV
Table 1. Efficacy of MDR-LAMP test compared with the broth microdilution MIC method
Drugs MIC MDR-LAMP Sub-total Sensitivity
(95% CI)aSpecificity
(95% CI)aPPV
(95% CI)aNPV
(95% CI)aχ2 b Pc Resistance Sensitive RIF Resistance 59 10 69 85.5%
(74.5–92.5)93.6%
(77.2–98.9)96.7%
(87.6–99.4)74.4%
(57.6–86.4)10.73d 0.039 Sensitive 2 29 31 Sub-total 61 39 100 INH Resistance 70 17 87 80.5%
(70.3–87.9)92.3%
(62.1–99.6)98.6%
(91.4–99.9)41.4%
(24.1–60.9)17.64e < 0.01 Sensitive 1 12 13 Sub-total 71 29 100 Note. aWilson 95% confidence interval: including continuity correction; bν = 1 the chi-square value reported is the Yates chi-square, corrected for continuity (dν = 1, P = 0.0011, eν = 1, P < 0.0001); cMcNemar’s test, two-tail.
下载: 导出CSV
Table 2. Comparison of gene mutation identified by WGS and MDR-LAMP assay
Drugs (genes) WGS MDR-LAMP Sub-total Sensitivity
(95% CI)aSpecificity
(95% CI)aPPV
(95% CI)aNPV
(95% CI)aχ2 b Pc Mutation Wild INH (katG, inhA) Mutation 69 5 74 93.2%
(84.3–97.5)92.3%
(73.4–98.7)97.2%
(89.3–99.5)82.8%
(63.5–93.5)5.33d 0.453 Wild 2 24 26 Sub-total 71 29 100 RIF (rpoB) Mutation 57 7 64 89.1%
(78.2–95.1)88.9%
(73.0–96.4)93.4%
(83.3–97.9)82.1%
(65.9–91.9)9.62e 0.549 Wild 4 32 36 Sub-total 61 39 100 Note. aWilson 95% confidence interval: including continuity correction; bν = 1 the chi-square value reported is the Yates chi-square, corrected for continuity (dν = 1, P = 0.021, eν = 1, P = 0.0019); cMcNemar’s test, two-tail.
下载: 导出CSV
Table 3. Evolution efficiency of each probe of MDR-LAMP
Reagent Probes WGS MDR-LAMP Sub-total Sensitivity
(95% CI)aSpecificity
(95% CI)aPPV
(95% CI)aNPV
(95% CI)aχ2 b Pc Mutation Wild Reagent B FAM: rpoB
S531L/L533PMutation 11 26 37 29.7%
(16.4–47.2)100%
(92.8–100)100%
(67.9–100)70.8%
(60.1–79.7)27.6d < 0.01 Wild 0 63 63 Sub-total 11 89 100 Reagent B Cy5: rpoB
D516V/S531LMutation 37 5 42 88.1%
(73.6–95.5)100%
(92.3–100)100%
(88.3–100)92.1%
(81.7–97.0)3.28e 0.063 Wild 0 58 58 Sub-total 37 63 100 Reagent C FAM: rpoB
H526Y/ H526DMutation 20 1 21 95.2%
(74.1–99.8)93.7%
(85.2–97.7)80%
(58.7–92.4)98.7%
(91.8–99.9)4.3f 0.219 Wild 5 74 79 Sub-total 25 75 100 Reagent A FAM: katG
S315N/S315TMutation 68 3 71 95.8%
(87.3–98.9)100%
(85.4–100)100%
(93.3–100)90.6%
(73.8–97.6)1.35g 0.25 Wild 0 29 29 Sub-total 68 32 100 Reagent A FAM:
inhA Promotor-15Mutation 1 2 3 33.3%
(1.8–87.5)100%
(95.3–100)100%
(5.5–100)98%
(92.2–99.7)0.51h 0.5 Wild 0 97 97 Sub-total 1 99 100 Note. aWilson 95% confidence interval: including continuity correction; bν = 1 the chi-square value reported is the Yates chi-square, corrected for continuity (dν = 1, P < 0.0001, eν = 1, P = 0.0701, fν = 1, P = 0.0381, gν = 1, P = 0.2453, hν = 1, P = 0.4751); cMcNemar’s test, two-tail.
下载: 导出CSV
Table 4. Degree Celsius distribution of each probe by MDR-LAMP reagents
Drugs (genes) Mutation site Number of strains Predict degree Celsius Actual degree Celsius (Number) INH (katG、inhA) katG S315T 68 FAM:56 °C 54 °C (25), 55 °C (32), 56 °C (9), -(2) katG S315N 3 FAM:54 °C 54 °C (2), -(1) inhA Promotor-15T 3 FAM:46 °C 46 °C (2), 48 °C (1) RIF (rpoB) rpoB S531L 36 FAM:63 °C and / or Cy5:73 °C FAM:62 °C and Cy5:71 °C (2), FAM:62 °C and
Cy5:72 °C (4), FAM:63 °C and Cy5:72 °C (5),
Cy5:67 °C (1), Cy5:71 °C (5), Cy5:72 °C (14),
Cy5:73 °C (1), -(4)rpoB D516V 6 Cy5:61 °C 60 °C (5), -(1) rpoB L533P 0 − − rpoB H526Y 17 FAM:67 °C 62 °C (3), 64 °C (2), 65 °C (8), 66 °C (3), -(1) rpoB H526D 4 FAM: 69 °C 67 °C (3), 68 °C (1) Note. “−” indicates “not detected.”
下载: 导出CSV
-
[1] World Health Organization. Global tuberculosis report 2020. World Health Organization. 2020. [2] Machado D, Couto I, Viveiros M. Advances in the molecular diagnosis of tuberculosis: from probes to genomes. Infect Genet Evol, 2019; 72, 93−112. doi: 10.1016/j.meegid.2018.11.021 [3] Theron G, Peter J, van Zyl-Smit R, et al. Evaluation of the xpert MTB/RIF assay for the diagnosis of pulmonary tuberculosis in a high HIV prevalence setting. Am J Respir Crit Care Med, 2011; 184, 132−40. doi: 10.1164/rccm.201101-0056OC [4] Meaza A, Kebede A, Yaregal Z, et al. Evaluation of genotype MTBDRplus VER 2.0 line probe assay for the detection of MDR-TB in smear positive and negative sputum samples. BMC Infect Dis, 2017; 17, 280. doi: 10.1186/s12879-017-2389-6 [5] Jian JY, Yang XY, Yang J, et al. Evaluation of the GenoType MTBDRplus and MTBDRsl for the detection of drug-resistant Mycobacterium tuberculosis on isolates from Beijing, China. Infect Drug Resist, 2018; 11, 1627−34. doi: 10.2147/IDR.S176609 [6] Notomi T, Okayama H, Masubuchi H, et al. Loop-mediated isothermal amplification of DNA. Nucleic Acids Res, 2000; 28, e63. doi: 10.1093/nar/28.12.e63 [7] Mori Y, Notomi T. Loop-mediated isothermal amplification (LAMP): a rapid, accurate, and cost-effective diagnostic method for infectious diseases. J Infect Chemother, 2009; 15, 62−9. doi: 10.1007/s10156-009-0669-9 [8] Yadav R, Sharma N, Khaneja R, et al. Evaluation of the TB-LAMP assay for the rapid diagnosis of pulmonary tuberculosis in Northern India. Int J Tuberc Lung Dis, 2017; 21, 1150−3. doi: 10.5588/ijtld.17.0035 [9] Zhou Y, Anthony R, Wang SF, et al. The epidemic of multidrug resistant tuberculosis in China in historical and phylogenetic perspectives. J Infect, 2020; 80, 444−53. doi: 10.1016/j.jinf.2019.11.022 [10] Geojith G, Dhanasekaran S, Chandran SP, et al. Efficacy of loop mediated isothermal amplification (LAMP) assay for the laboratory identification of Mycobacterium tuberculosis isolates in a resource limited setting. J Microbiol Methods, 2011; 84, 71−3. doi: 10.1016/j.mimet.2010.10.015 [11] Sethi SK, Singh S, Dhatwalia SK, et al. Evaluation of in-house loop-mediated isothermal amplification (LAMP) assay for rapid diagnosis of M. tuberculosis in pulmonary specimens. J Clin Lab Anal, 2013; 27, 272−6. doi: 10.1002/jcla.21596 [12] Papaventsis D, Casali N, Kontsevaya I, et al. Whole genome sequencing of Mycobacterium tuberculosis for detection of drug resistance: a systematic review. Clin Microbiol Infect, 2017; 23, 61−8. doi: 10.1016/j.cmi.2016.09.008 [13] Pankhurst LJ, del Ojo Elias C, Votintseva AA, et al. Rapid, comprehensive, and affordable mycobacterial diagnosis with whole-genome sequencing: a prospective study. Lancet Respir Med, 2016; 4, 49−58. doi: 10.1016/S2213-2600(15)00466-X [14] Phelan J, O'Sullivan DM, Machado D, et al. The variability and reproducibility of whole genome sequencing technology for detecting resistance to anti-tuberculous drugs. Genome Med, 2016; 8, 132. doi: 10.1186/s13073-016-0385-x [15] Seifert M, Catanzaro D, Catanzaro A, et al. Genetic mutations associated with isoniazid resistance in Mycobacterium tuberculosis: a systematic review. PLoS One, 2015; 10, e0119628. doi: 10.1371/journal.pone.0119628 [16] Telenti A, Imboden P, Marchesi F, et al. Detection of rifampicin-resistance mutations in Mycobacterium tuberculosis. Lancet, 1993; 341, 647−51. doi: 10.1016/0140-6736(93)90417-F [17] Comas I, Borrell S, Roetzer A, et al. Whole-genome sequencing of rifampicin-resistant Mycobacterium tuberculosis strains identifies compensatory mutations in RNA polymerase genes. Nat Genet, 2012; 44, 106−10. doi: 10.1038/ng.1038 [18] Bojang AL, Mendy FS, Tientcheu LD, et al. Comparison of TB-LAMP, GeneXpert MTB/RIF and culture for diagnosis of pulmonary tuberculosis in The Gambia. J Infect, 2016; 72, 332−7. doi: 10.1016/j.jinf.2015.11.011 [19] Sali M, De Maio F, Caccuri F, et al. Multicenter evaluation of anyplex plus MTB/NTM MDR-TB Assay for rapid detection of Mycobacterium tuberculosis complex and multidrug-resistant isolates in pulmonary and extrapulmonary specimens. J Clin Microbiol, 2016; 54, 59−63. doi: 10.1128/JCM.01904-15 -

 点击查看大图
图(1) / 表ll (5)
计量
- 文章访问数: 1028
- HTML全文浏览量: 487
- PDF下载量: 128
- 被引次数: 0

 Quick Links