

 下载:
下载:


-
Globally, breast cancer is the second major cause of cancer death among women [1]. Cyclophosphamide (CTX) is a common chemotherapeutic agent for patients with breast cancer who have undergone surgery. CTX metabolites act by disrupting deoxyribonucleic acid and by arresting the cell cycle of tumor cells, which results in their apoptosis or growth inhibition [2]. However, CTX triggers the production of excessive amounts of reactive oxygen species (ROS), which produces various side effects in different organs or systems [3]. In the initial stage of cancer development, ROS may promote the expansion of cancerous cells by modifying apoptosis-related genes [4]. Furthermore, ROS will activate the NF-κB pathway and NF-κB-dependent genes that are involved in apoptosis and cell adhesion, which are implicated in multiple aspects of cancer development [5]. ROS, as a survival or apoptotic signal to cancer cells, is determined by the dosage, duration, type, and site of ROS production [6].
Previous studies have suggested that antioxidants can produce protective effects against several types of cancers, including breast cancer [7]. Thus, we hypothesized that antioxidation might generate inhibitory effects on the growth of EMT-6 cells at the early stage and that the combination of Ginkgo biloba L. extract (GBE) and CTX would have better inhibiting effects on the growth of EMT-6 cells when compared with EMT-6 cells treated with CTX alone.
EMT-6 cells were incubated in RPMI 1640 medium supplemented with 10% fetal bovine serum (HyClone, USA), penicillin 100 IU/mL, and streptomycin 100 µg/mL at 37 °C with 5% CO2.
All procedures used in handling animals were approved by the Institutional Review Board of the School of Public Health, Jilin University. ICR mice (Liaoning Changsheng Biotechnology, Co. Limited, China), aged 8 weeks, with a bodyweight of 18–22 g, were housed in the animal center for 10 days to make them adapt to the environment. After adaptation, the mice were injected with EMT-6 cells at the dose of 1 × 10⁶ cells/mouse in the right thigh, and they were randomly distributed into four treatment groups, with 12 mice per group. After 24 h, the mice in the phosphate buffer saline (PBS) group were injected with PBS intraperitoneally at a volume of 0.2 mL, the GBE group were injected with GBE (Chi Sheng Chemical Corporation, Taiwan, China) intraperitoneally at the dose of 3 mg/kg bodyweight, the CTX group were injected intraperitoneally with CTX at the dose of 2 mg/kg bodyweight, and the GBE + CTX group were injected intraperitoneally with both CTX at the dose of 2 mg/kg bodyweight and GBE at the dose of 3 mg/kg bodyweight. Injections were conducted consecutively for 10 days when all mice in the PBS group developed a palpable tumor, except for the CTX group, which was injected every other day. The fifth group of 12 mice (negative controls) was not injected with EMT-6 cells but was included for comparison of bodyweight gain, serum malondialdehyde (MDA) level, and superoxide dismutase (SOD) activity with cancer-free mice. The bodyweight was measured every day until the mice were sacrificed. Tumor onset was determined by palpation. The day of tumor onset was recorded for each mouse to compare the tumor latency among the groups. The length and width of the tumor were measured. The tumor volume was calculated based on the formula V = (a × b2) / 2, where a is the length of the tumor and b is the width of the tumor. When each mouse in the PBS group developed a tumor, all mice from different groups were sacrificed, and the tumor from each mouse was removed and weighed. The level of MDA and SOD activity were measured in serum. Western blot analysis was conducted following the protocols described by Ren et al.[8]. Detection was performed by measuring the chemiluminescence of the ECL reagent (Pierce, Thermo Scientific, USA). SPSS 21.0 software (SPSS Inc., Chicago Illinois, USA) was used to perform the statistical analysis by analysis of variance, and Duncan multiple comparisons were carried out for between-group comparisons. Normality was tested using quantile plots. Kruskal-Wallis statistic was used to generate 100,000-bootstrapped samples, from which the P-value was estimated for the testing of overall differences among groups. Pairwise comparisons of medians were conducted with an exact Wilcoxon statistic, and a Dunn’s test was used to adjust for multiple comparisons. Data were tested on whether they met the proportional hazards assumption, and the Cox proportional hazards model was used to assess differences in the time-to-event analysis with uncensored data because all outcomes were observed at 10 days. The four treatment groups were coded as 1 = PBS, 2 = CTX, 3 = GBE, and 4 = GBE + CTX. Exponentiated hazard ratios (HR) with 95% confidence intervals (CI) were calculated.
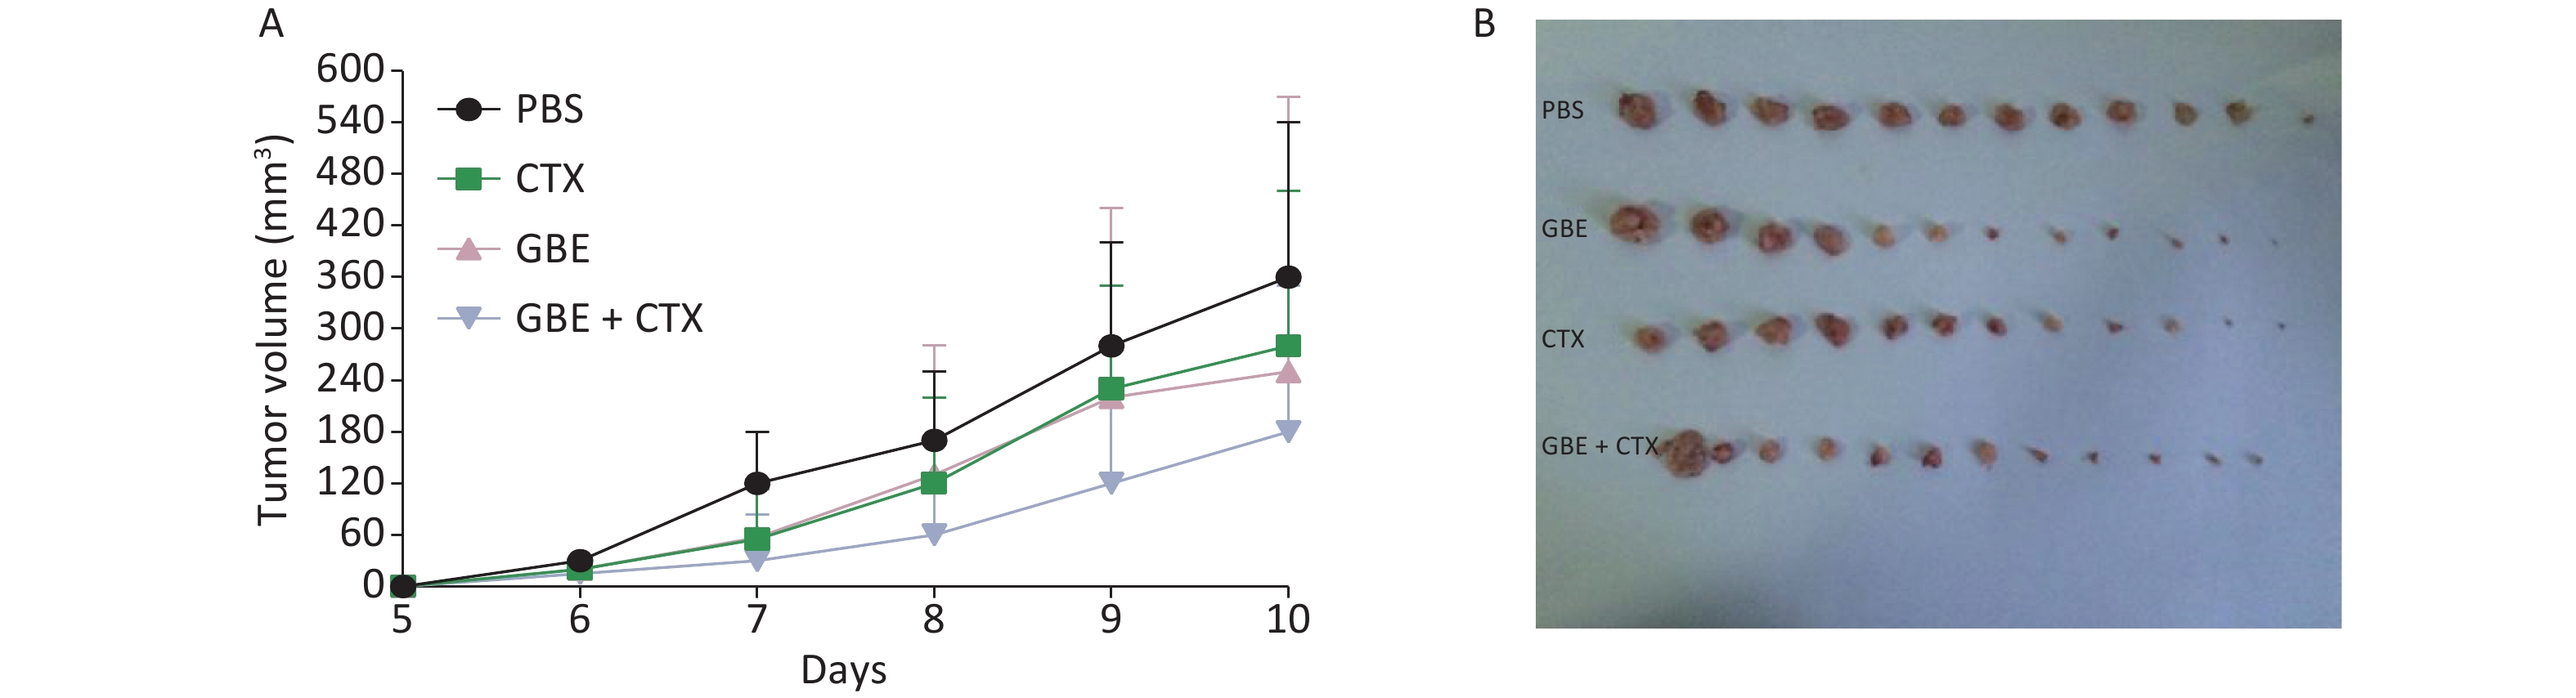
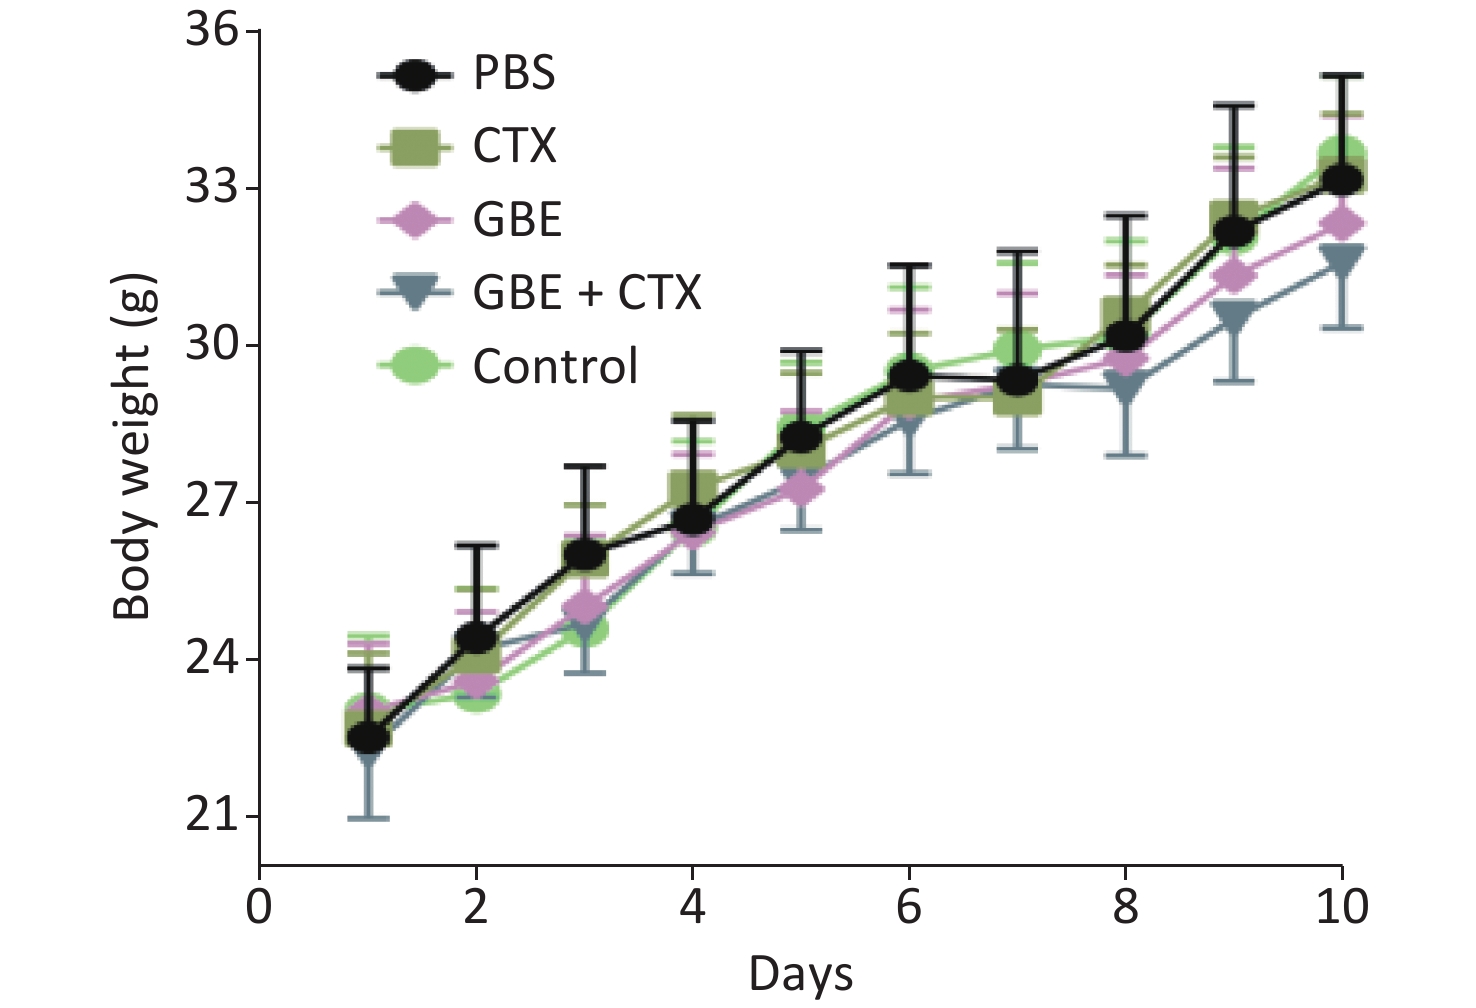
When the mice were sacrificed, no significant difference was found in the bodyweight among the groups (Figure 1). No significant differences were identified in the overall median latency times (P = 0.20). The tumor weights in the PBS control group were normally distributed, and the other groups demonstrated non-normal distribution. Overall, the tumor weights were not different by treatment groups (P = 0.20). Despite the lack of significance in the overall group effects, the CTX + GBE group differed significantly from the PBS control group (P = 0.01) by pairwise comparisons. The tumor volume and image are shown in Supplementary Figure S1, available in www.besjournal.com.
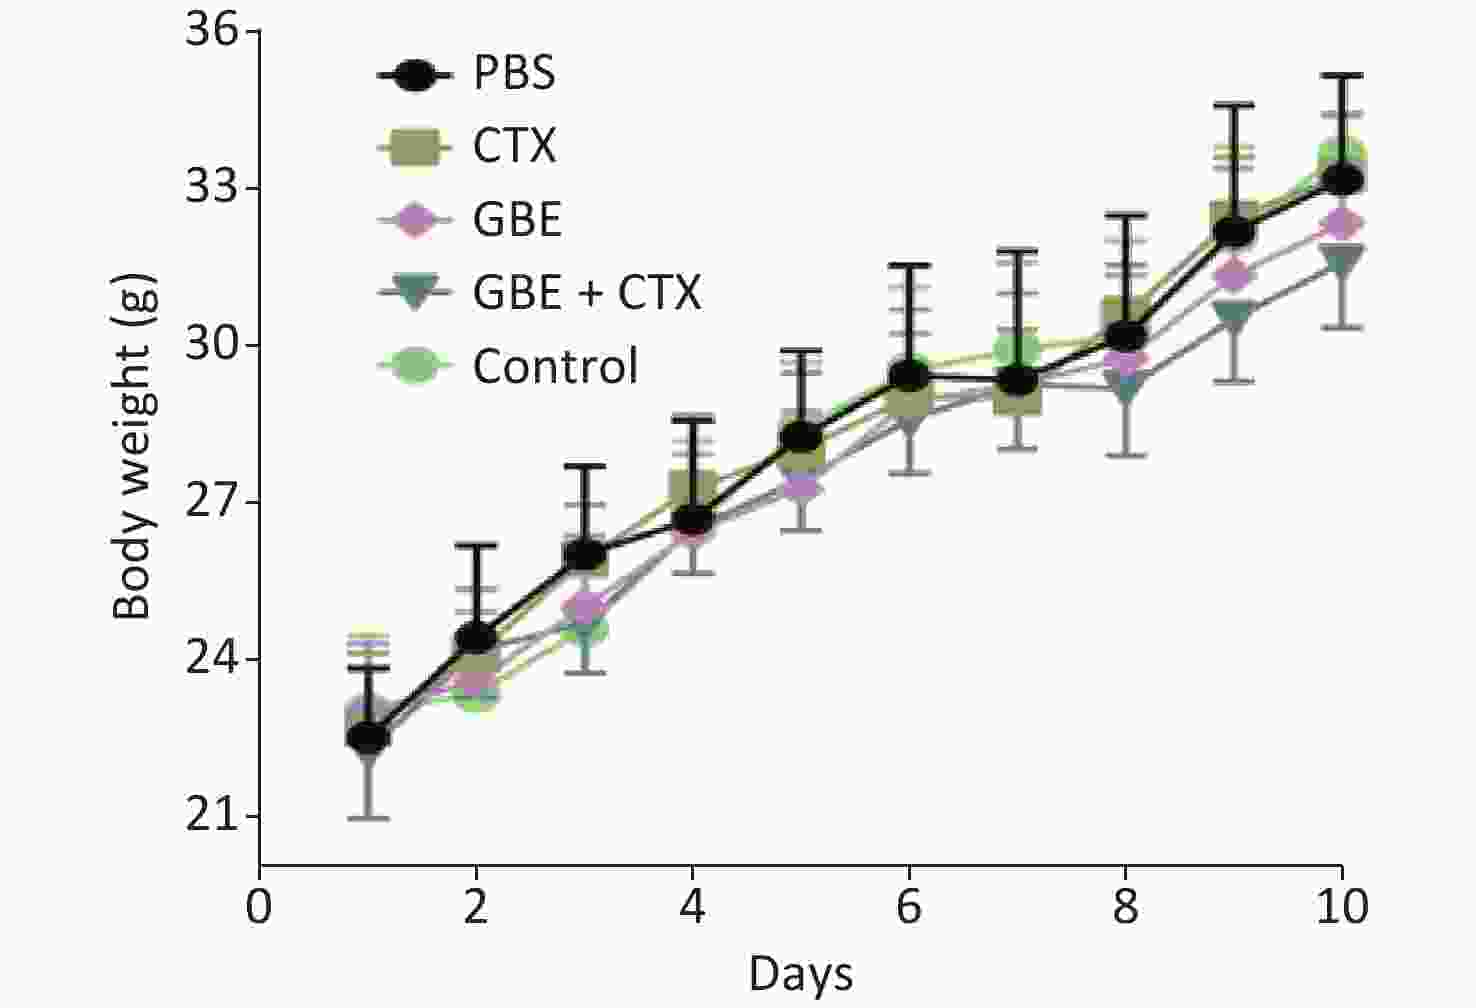
Figure 1. Body weight change of mice in different groups. The body weights of the mice were measured every day until all mice in the PBS group grew palpated tumors and all mice were sacrificed.
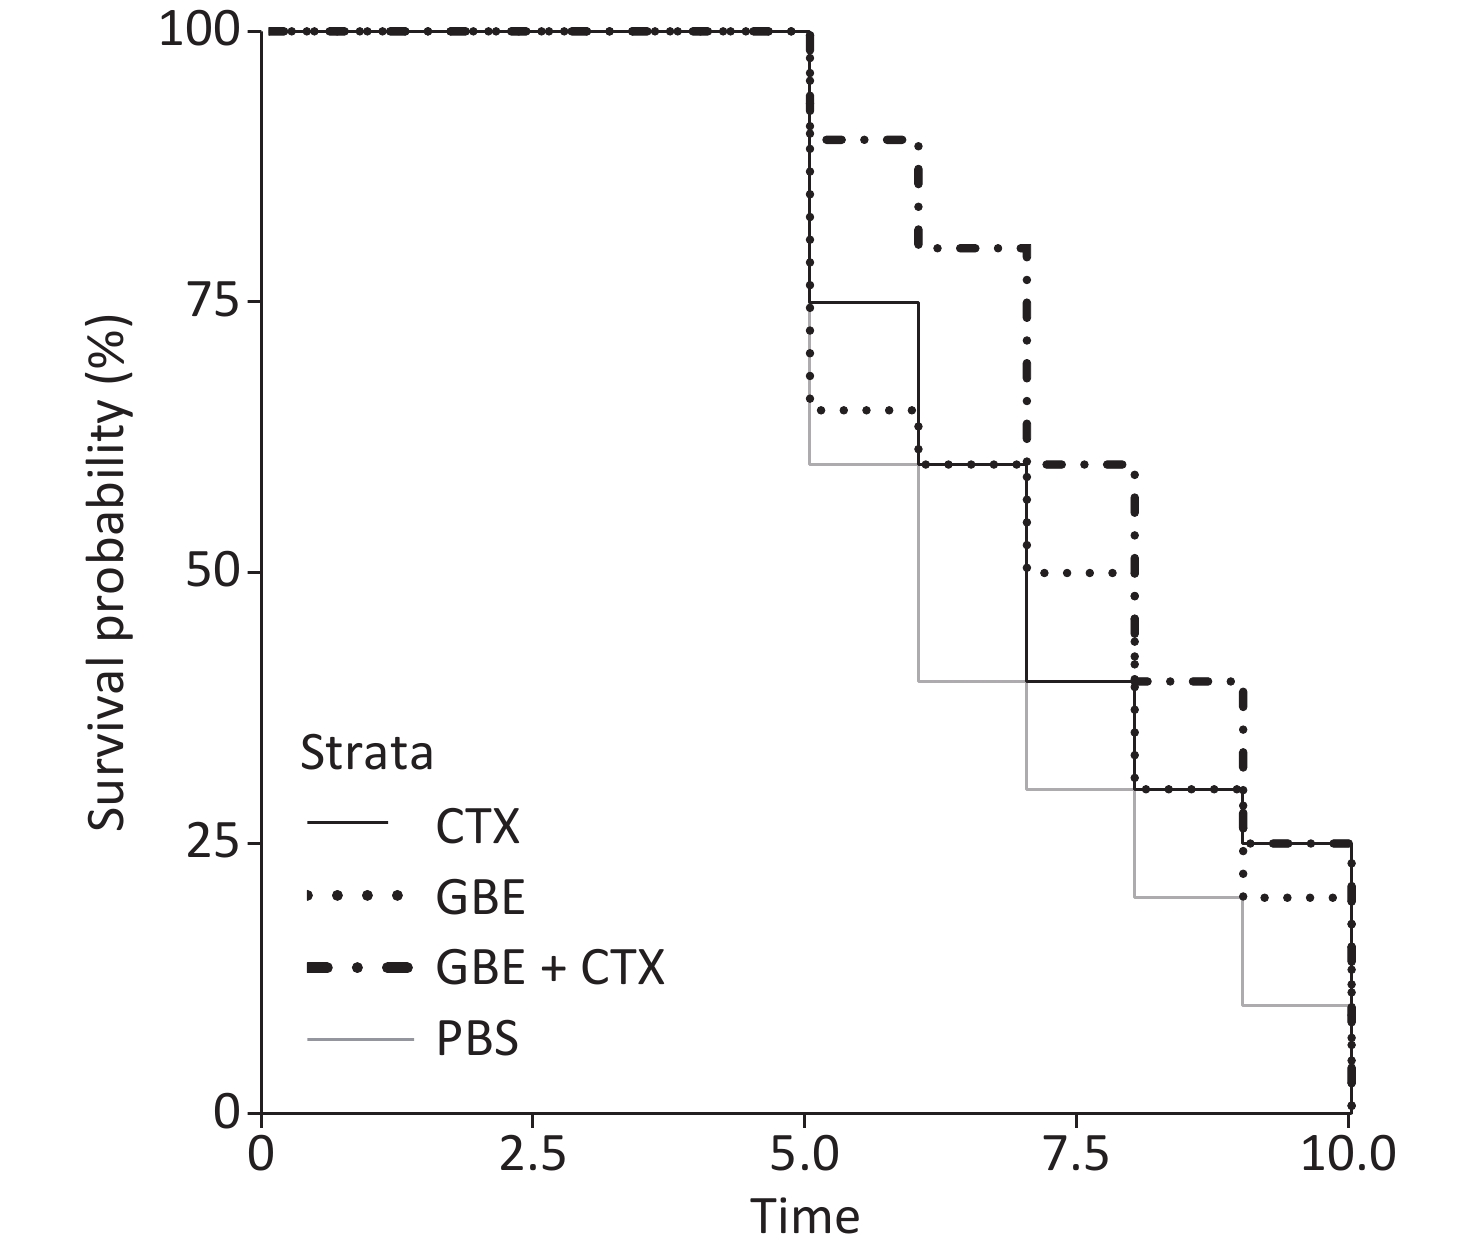
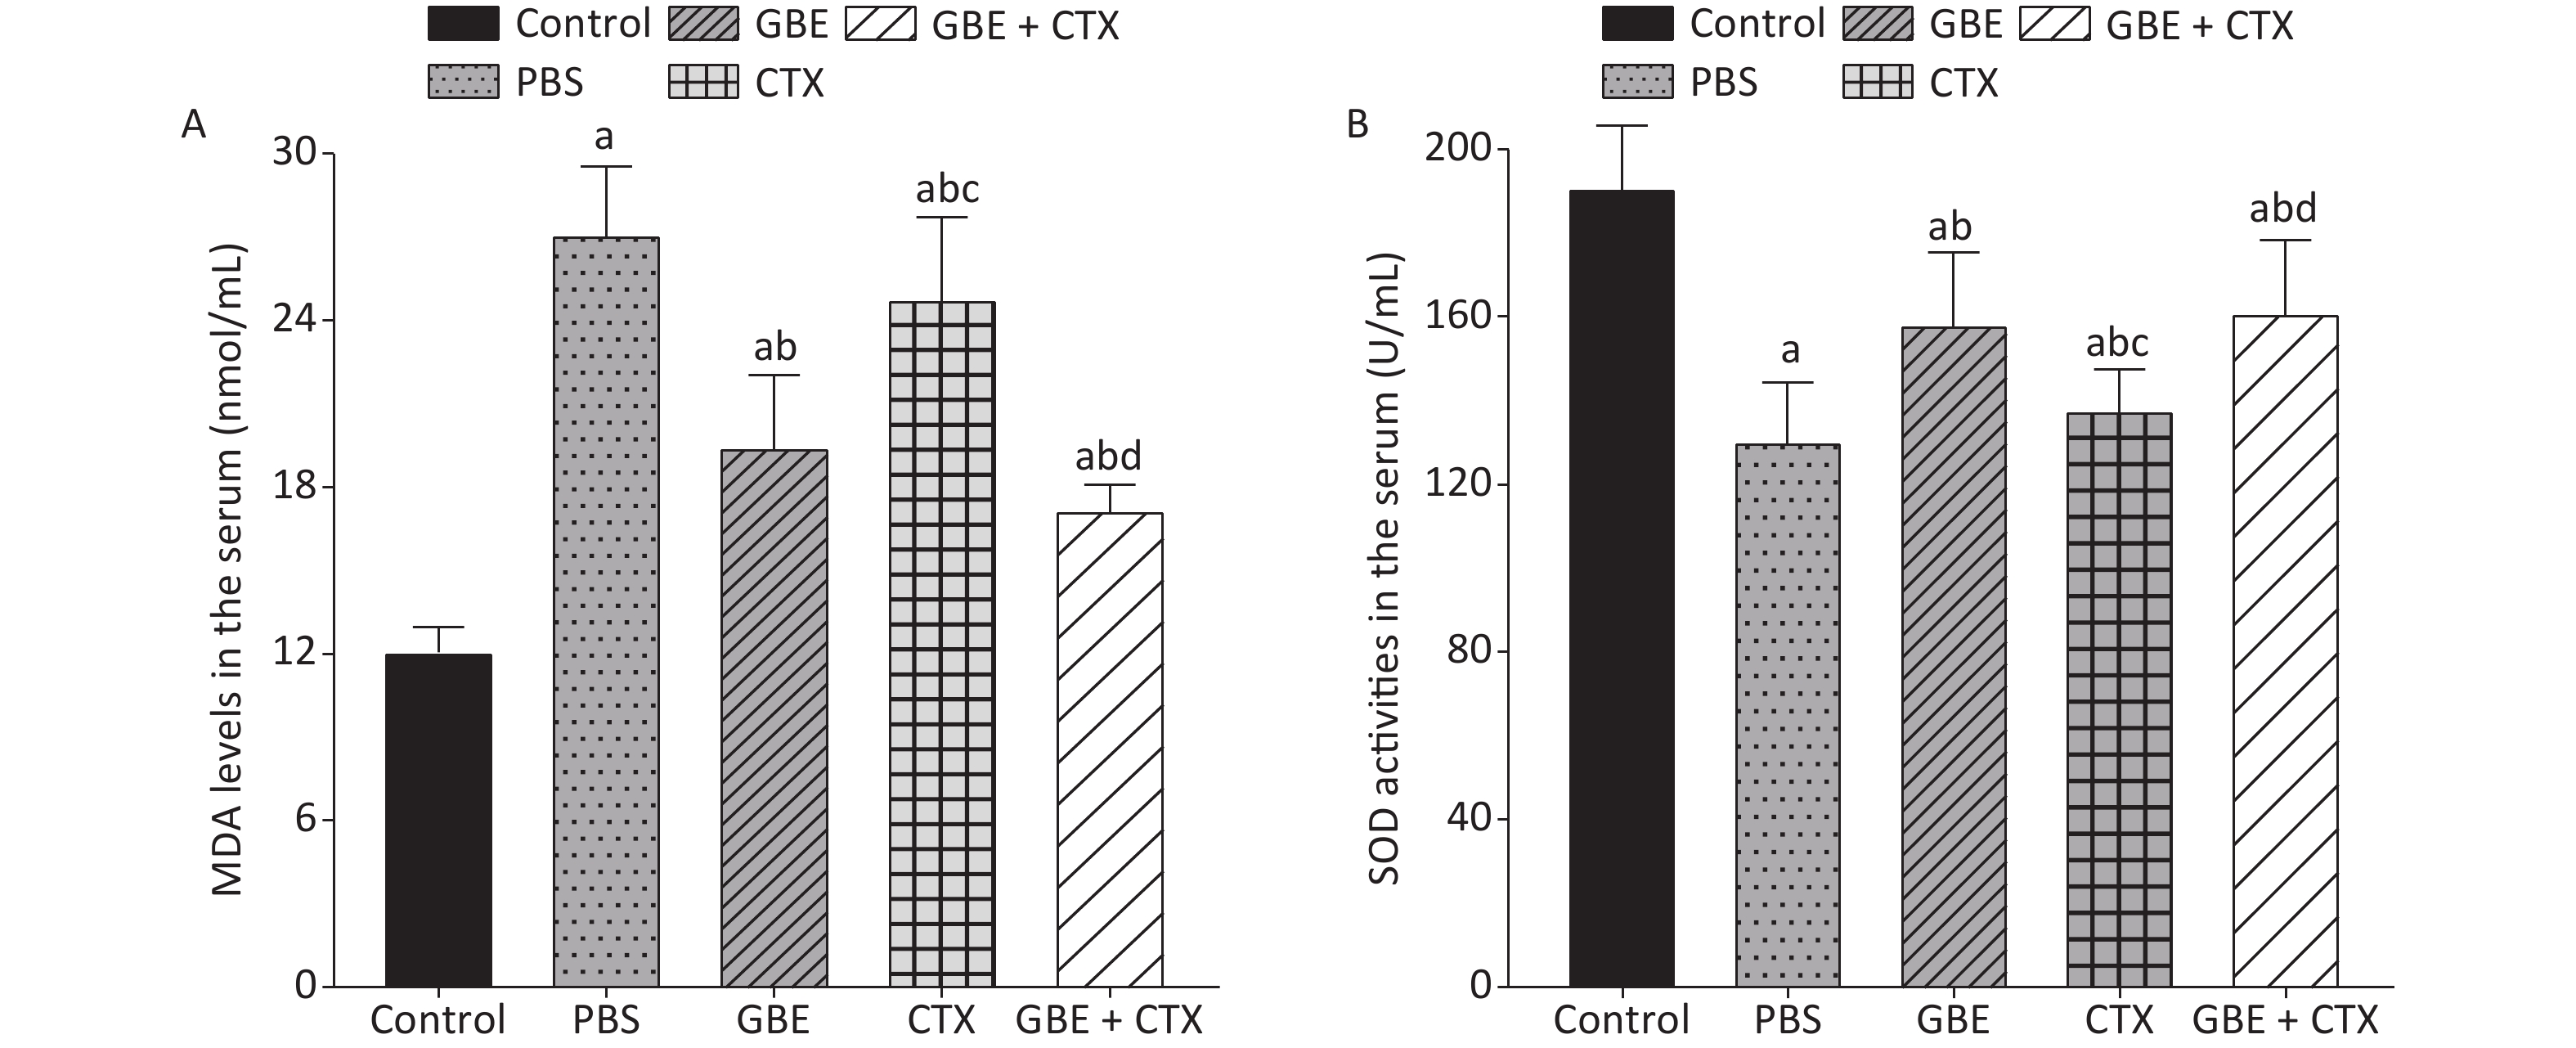
The data met the proportional hazards assumption. The HR, as a measure of effect size for the treatment effect on the latency period, was 0.84 [CI = 0.65, 1.09, standard error (SE) = 0.13, P = 0.32] (Figure 2). Figure 2 shows a rightward shift in the GBE + CTX group, indicating that co-treatment with GBE + CTX resulted in greater time to tumor detection than PBS alone. In the comparison of CTX + GBE with PBS, the latency period (HR = 0.81, SE = 0.14, CI = 0.62, 1.06) was longer than the effect size in the comparison of CTX with PBS (HR = 0.67, SE = 0.41, CI = 0.30, 1.50), suggesting that CTX alone decreased the latency by 17% compared with combining CTX with GBE. The GBE, CTX, and GBE + CTX groups showed lower MDA levels and higher SOD activities than the PBS group. The GBE + CTX and GBE groups had lower MDA levels and higher SOD activities than the PBS or CTX group (P < 0.05) (Supplementary Figure S2A–B available in www.besjournal.com).
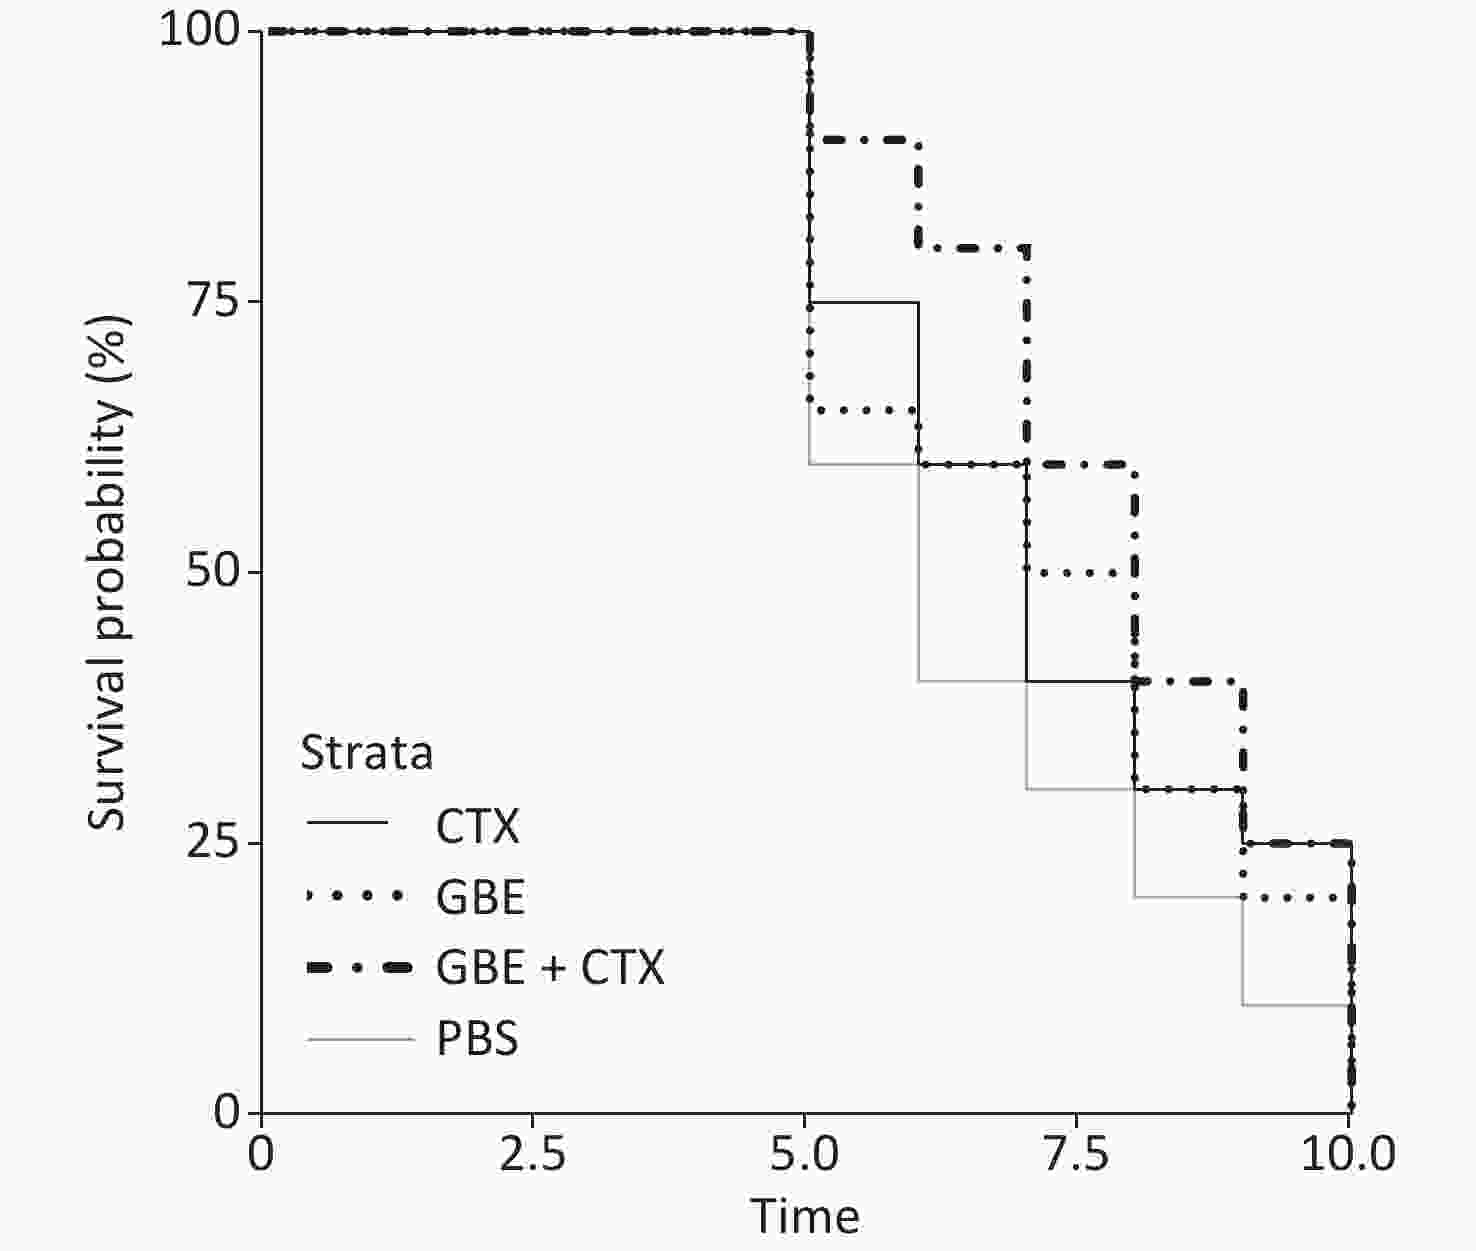
Figure 2. Survival curves for four treatment groups with 12 per group.
In this study, the main finding was that GBE + CTX-treated mice demonstrated better growth inhibition of EMT-6 cells than PBS-treated mice. Compared with PBS, GBE, or CTX alone did not inhibit the growth of EMT-6 cells. Although the results of the survival analysis did not reach significance, a clear upward shift was found in the survival curves in the GBE + CTX group when compared with that in the PBS group. Furthermore, the median latency time when comparing the GBE + CTX group with the PBS group with P = 0.06 suggests that significance would have been achieved if the sample size was larger. This finding is important because it might offer a treatment regimen for the prevention of tumor recurrence.
The survival probability curves suggest an increased survival probability of 17% in GBE + CTX mice compared with CTX mice, by comparing each group with the PBS control group. Notably, the SE differed greatly between the two groups (GBE + CTX SE = 0.14 vs. CTX SE = 0.41). The addition of GBE appeared to reduce the uncertainty around the survival probability estimates. The experiment needs to be replicated using a longer follow-up time, allowing time for each of the CTX and GBE + CTX mice to develop a tumor.
The MDA level was lower and the SOD activity was higher in the GBE group than in the PBS group, demonstrating the antioxidant effects of GBE. Adding GBE to CTX caused the mice in the combination group to appear similar to the GBE group. The comparisons provide evidence that GBE can reduce ROS with and without CTX.
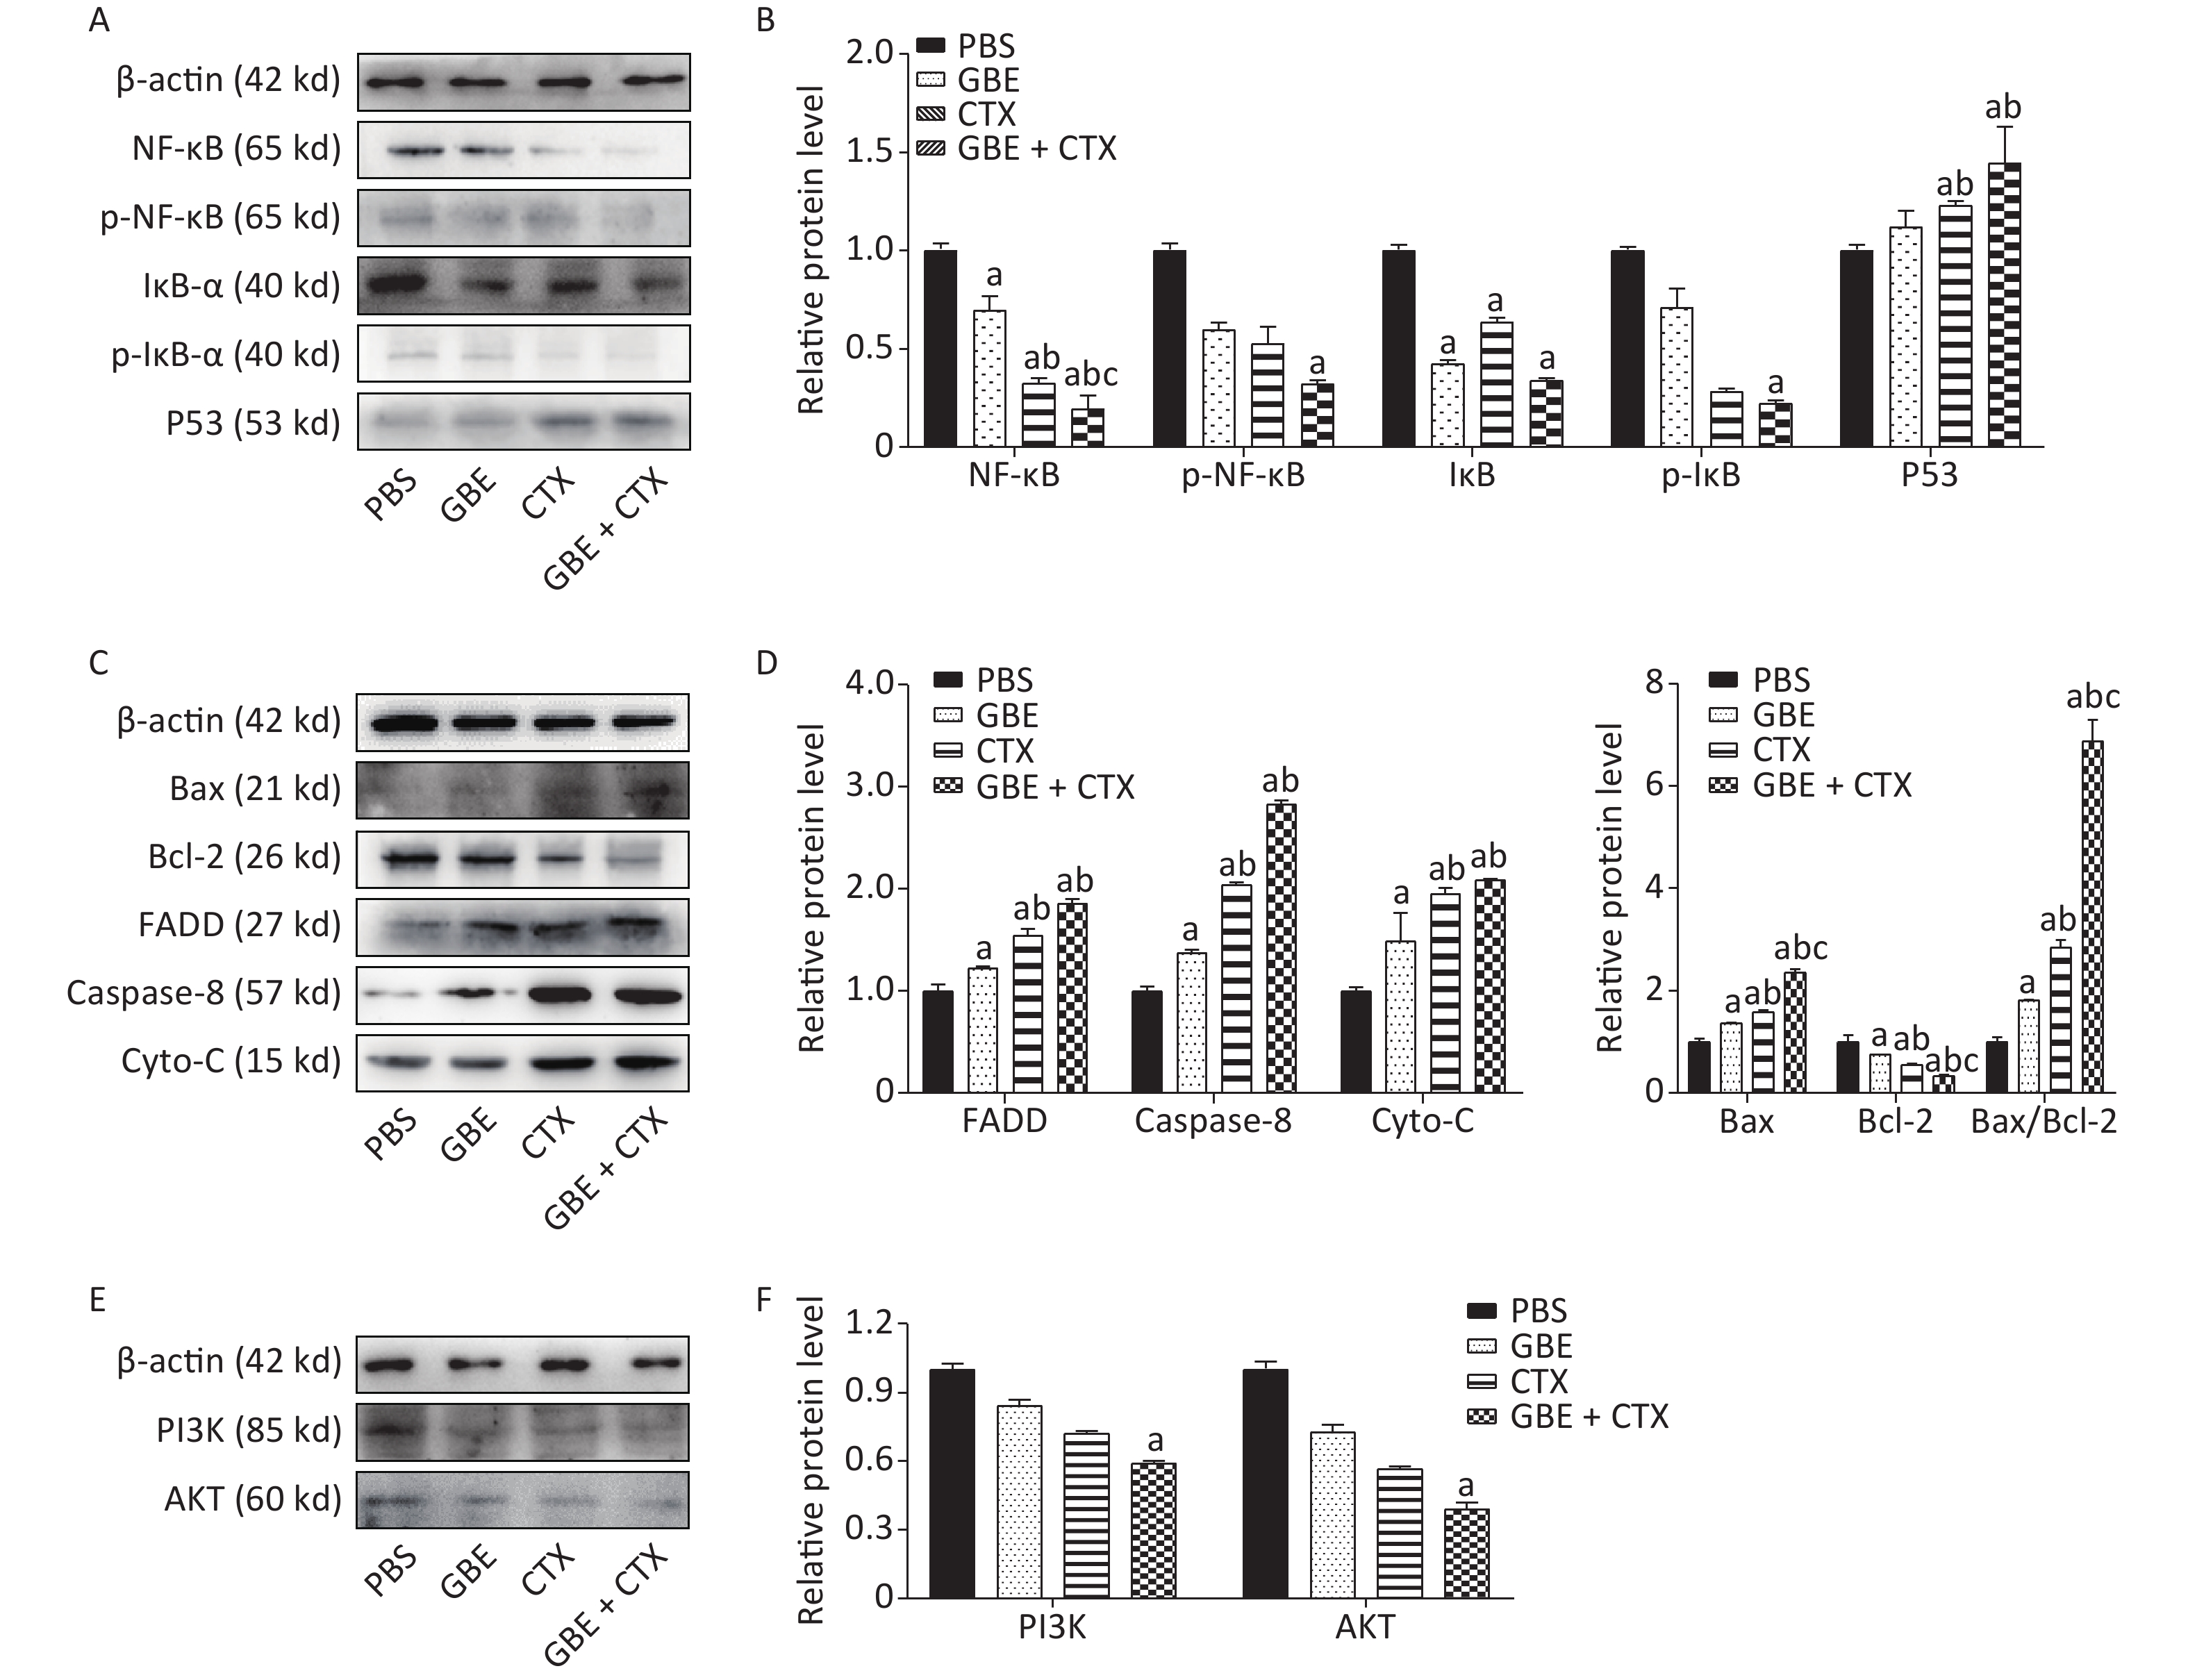
The expression of NF-κB was significantly decreased in the GBE + CTX group compared with that in the GBE, CTX, or PBS group (P < 0.05) (Figure 3A), and the expression of IκB-ɑ was significantly decreased in the GBE + CTX group compared with that in the PBS group (P < 0.05) (Figure 3A). Additionally, the phosphorylations of NF-κB and IκB-ɑ were significantly decreased in the GBE + CTX group when compared with those in the PBS group (P < 0.05) (Figure 3A, B). Similarly, the expression of p53 was significantly increased in the GBE + CTX group compared with that in the GBE or PBS group (P < 0.05) (Figure 3A, B).
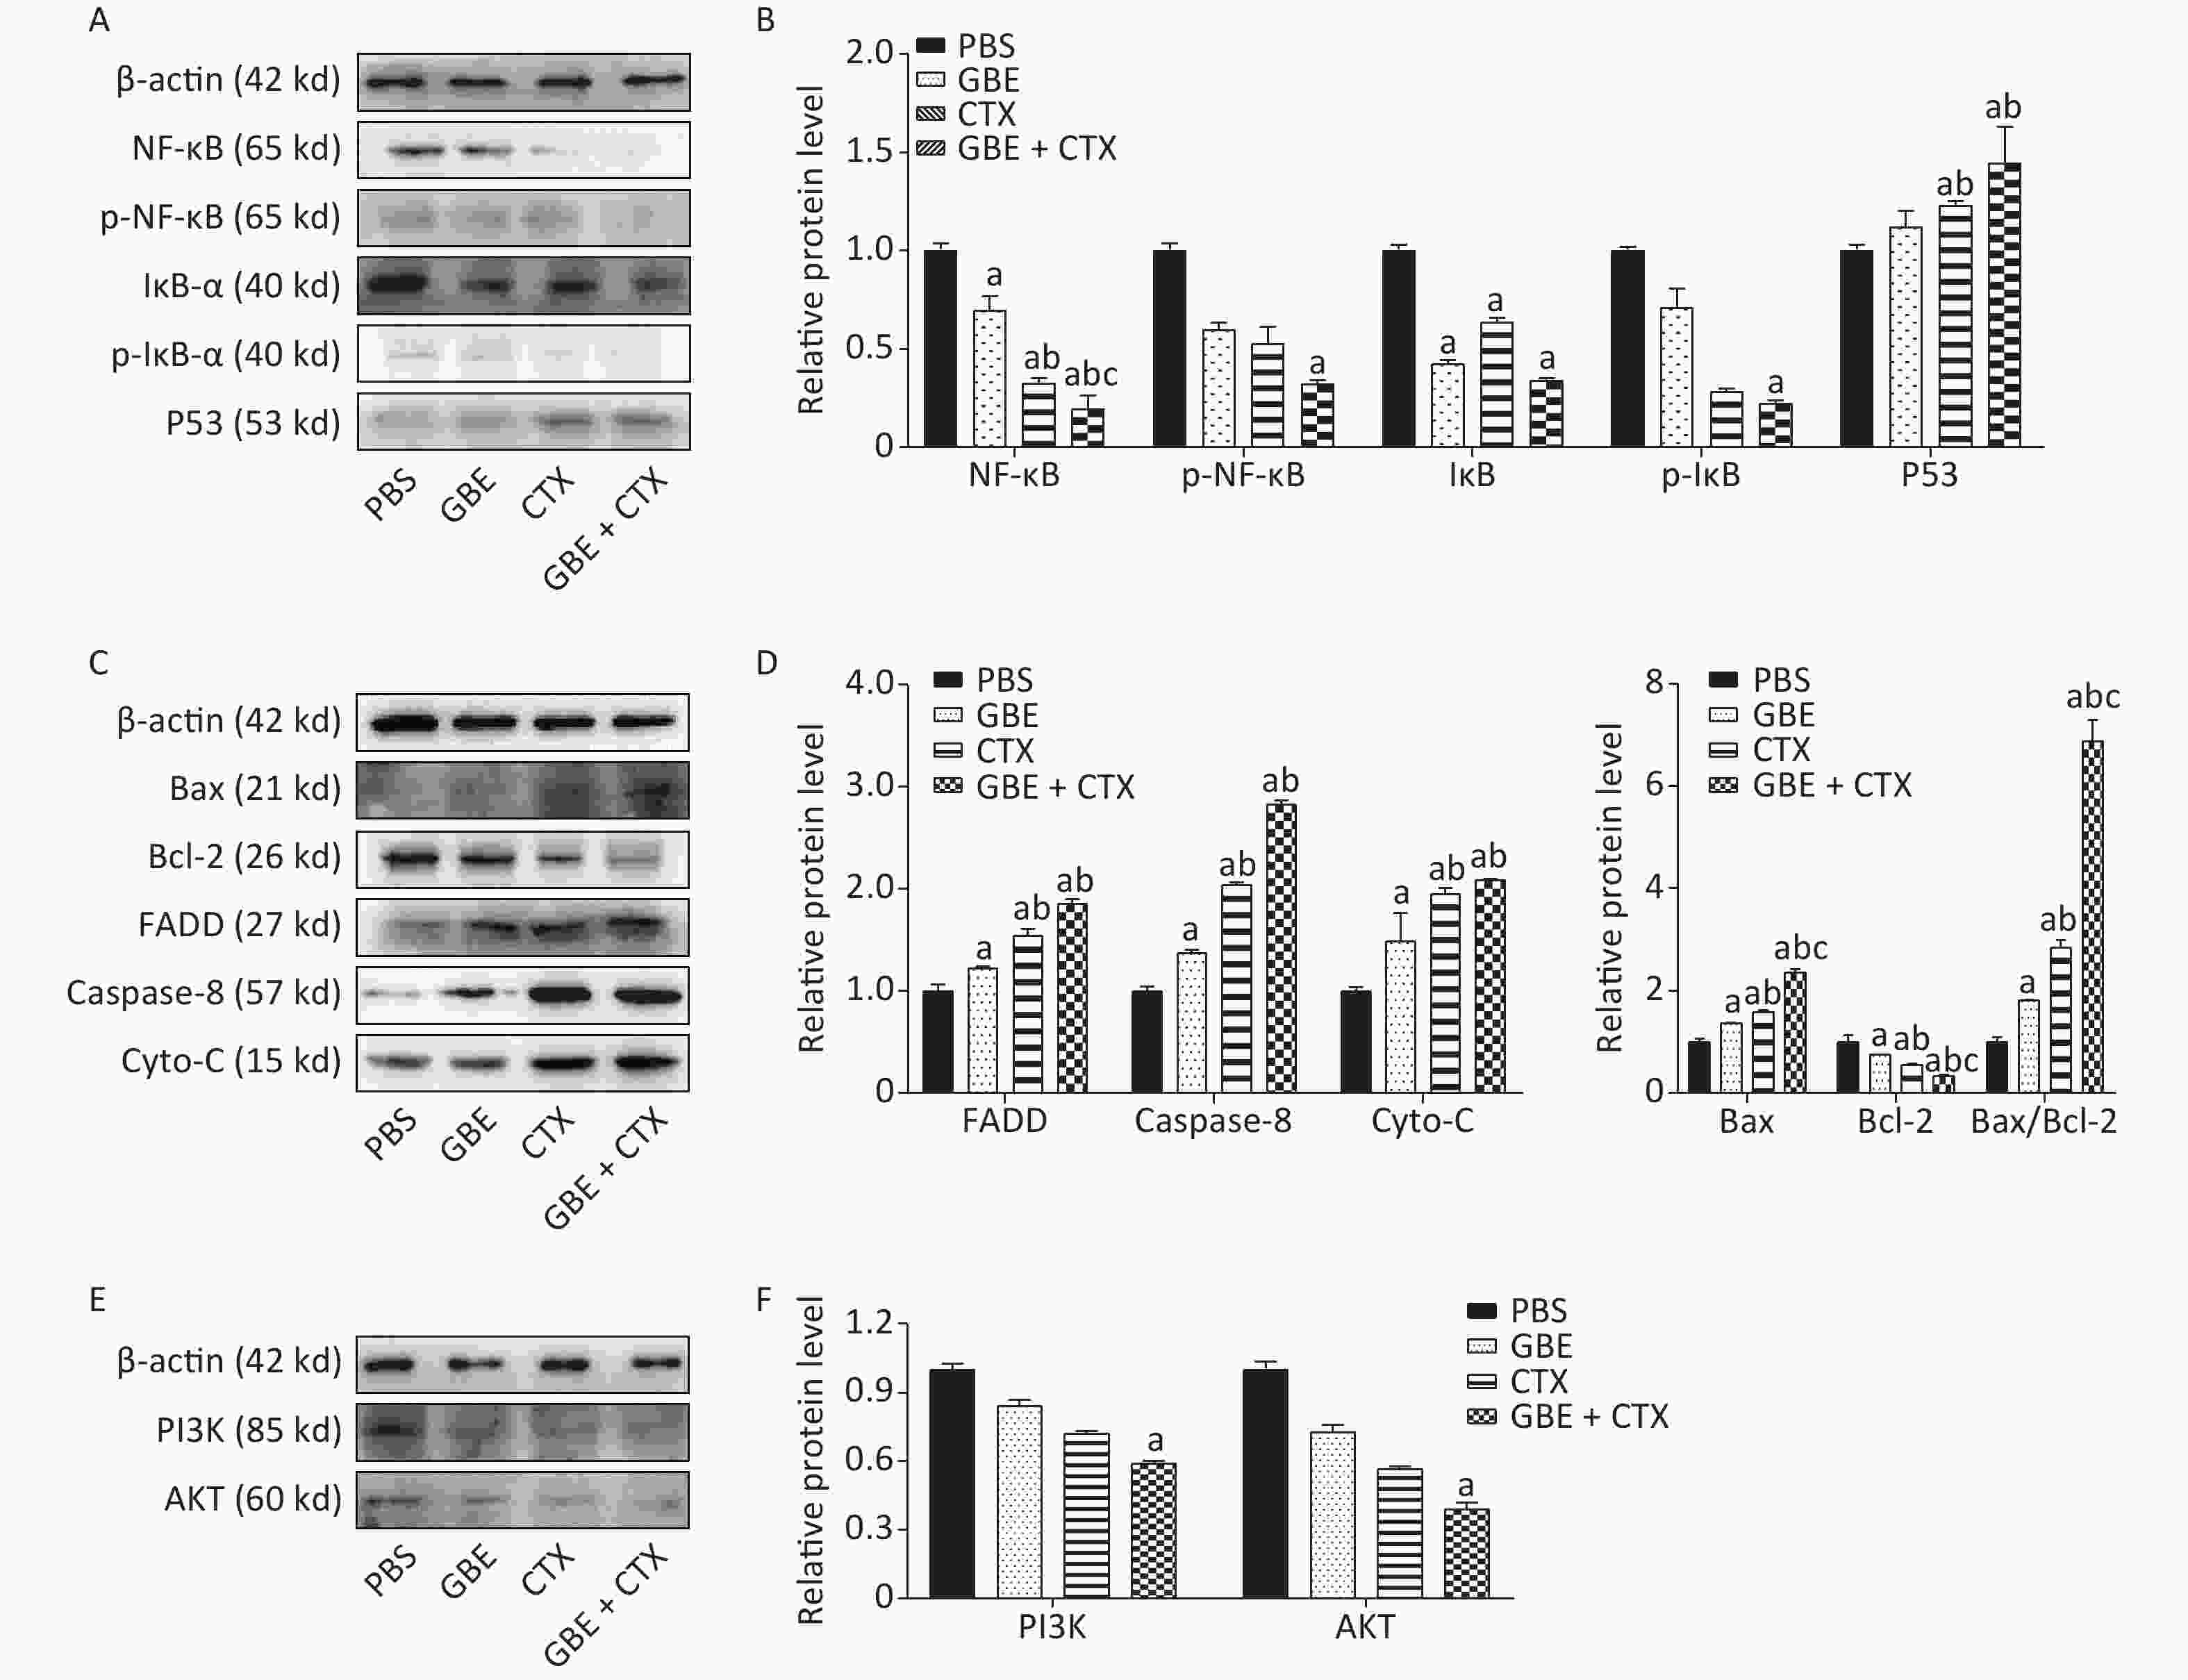
Figure 3. Western blot analysis of NF-κB, IκB-ɑ, P53, Bax, Bcl-2, FADD, Caspas-8, Cyto-C, PI3K, and Akt. β-Actin was used as a loading control. Representative images from three independent experiments and the results of densitometric analyses (means ± SDs) are shown. The photographs generated were quantitatively analyzed with a Quantity One image densitometer. (A) Western blot analysis of NF-κB, p-NF-κB, IκB-ɑ, p-IκB-ɑ, and P53 expression in tumors of mice treated with PBS, GBE, CTX, or GBE+CTX. (B) The comparison of NF-κB, p-NF-κB, p-IκB-ɑ and P53 relative expression level in tumors of mice treated with PBS, GBE, CTX, or GBE + CTX. (C) Western blot analysis of Bax, Bcl-2, FADD, Caspase-8, and cyto-C expression in tumors of mice treated with PBS, GBE, CTX, or GBE + CTX. (D) The comparison of FADD, Caspase-8, cyto-C, Bax, Bcl-2 and ratio of Bax to Bcl-2 relative expression level in tumors of mice treated with PBS, GBE, CTX, or GBE + CTX. (E) Western blot analysis of PI3K and Akt expression in tumors of mice treated with PBS, GBE, CTX, or GBE + CTX. (F) The comparison of PI3K and Akt relative expression level in tumors of mice treated with PBS, GBE, CTX, or GBE + CTX. aP < 0.05 vs. PBS; bP < 0.05 vs. GBE; cP < 0.05 vs. CTX.
The expression of Bax was significantly increased in the GBE + CTX group compared with those in the GBE, CTX, or PBS group (Figure 3C). Besides, the expression of Bcl-2 was significantly decreased in the GBE + CTX group compared with its expression in the GBE, CTX, or PBS group (P < 0.05) (Figure 3C). The ratio of Bax/Bcl-2 was significantly higher in the GBE + CTX group than in the GBE, CTX, or PBS group (P < 0.05) (Figure 3D). The expressions of FADD, caspase-8, and Cyto-C were significantly increased in the GBE + CTX group compared with those in the PBS or GBE group (P < 0.05) (Figure 3C, D). The expressions of PI3K and Akt in the GBE + CTX group were significantly decreased when compared with those in the PBS group (P < 0.05) (Figure 3E, F).
Despite the balance between the benefits and disadvantages of adjuvant antioxidants in chemotherapy, early co-administration of antioxidants with chemotherapeutic agents might be useful in scavenging ROS. The resulting reduction in the ROS signaling pathways may, in early stages, suppress tumor growth. Our results showed that GBE + CTX reduced IκB expression and its phosphorylation was above that of CTX alone, resulting in decreased activation of the NF-κB signaling pathway and promoting apoptosis. The pro-death response to GBE + CTX was consistent with the increased expressions of FADD, caspase-8, Cyto-C, Bax, and Bax/Bcl-2 ratio, showing the highest levels in the GBE + CTX group, followed by the CTX, GBE, and PBS groups. A reverse pattern was observed for the expression of Bcl-2. These expression patterns support the hypothesis that GBE promotes apoptosis in the early stage of tumor initiation and enhances the effects of CTX.
In summary, in this study, a combination of CTX and GBE was administered after only 24 h to mice transplanted with tumor cells; this period was considered the initial stage of tumor growth. A study presented inconsistency regarding whether antioxidation should be used in tumor treatment [6]. In the present study, the tumor weight was significantly decreased with CTX + GBE administration. The mechanisms underlying this change are as follows: GBE + CTX significantly inhibited the activation of NF-kB, upregulated proapoptotic and P53 genes, and downregulated the PI3K/Akt pathway, which are implicated in the expansion of cancerous cells.
Acknowledgement We would like to thank Professor WANG Li Ying at the Department of Molecular Biology, College of Basic Medicine, Jilin University, for her gift of EMT-6 cells.
Author Contributions REN Shu Ping designed the study; YANG Jing Hui, MENG Fan Zhu, LI Hao, LIU Xiao Mei, GUO Yin Pei, QIN Li Li, and ZUO Ru Yue performed the experiment; BESELER Cheryl L. analyzed the data; BESELER Cheryl L. and REN Shu Ping prepared the draft and reviewed and edited the manuscript. All authors approved the final manuscript.
Conflicts of Interest The authors declare that there is no conflicts of interest.
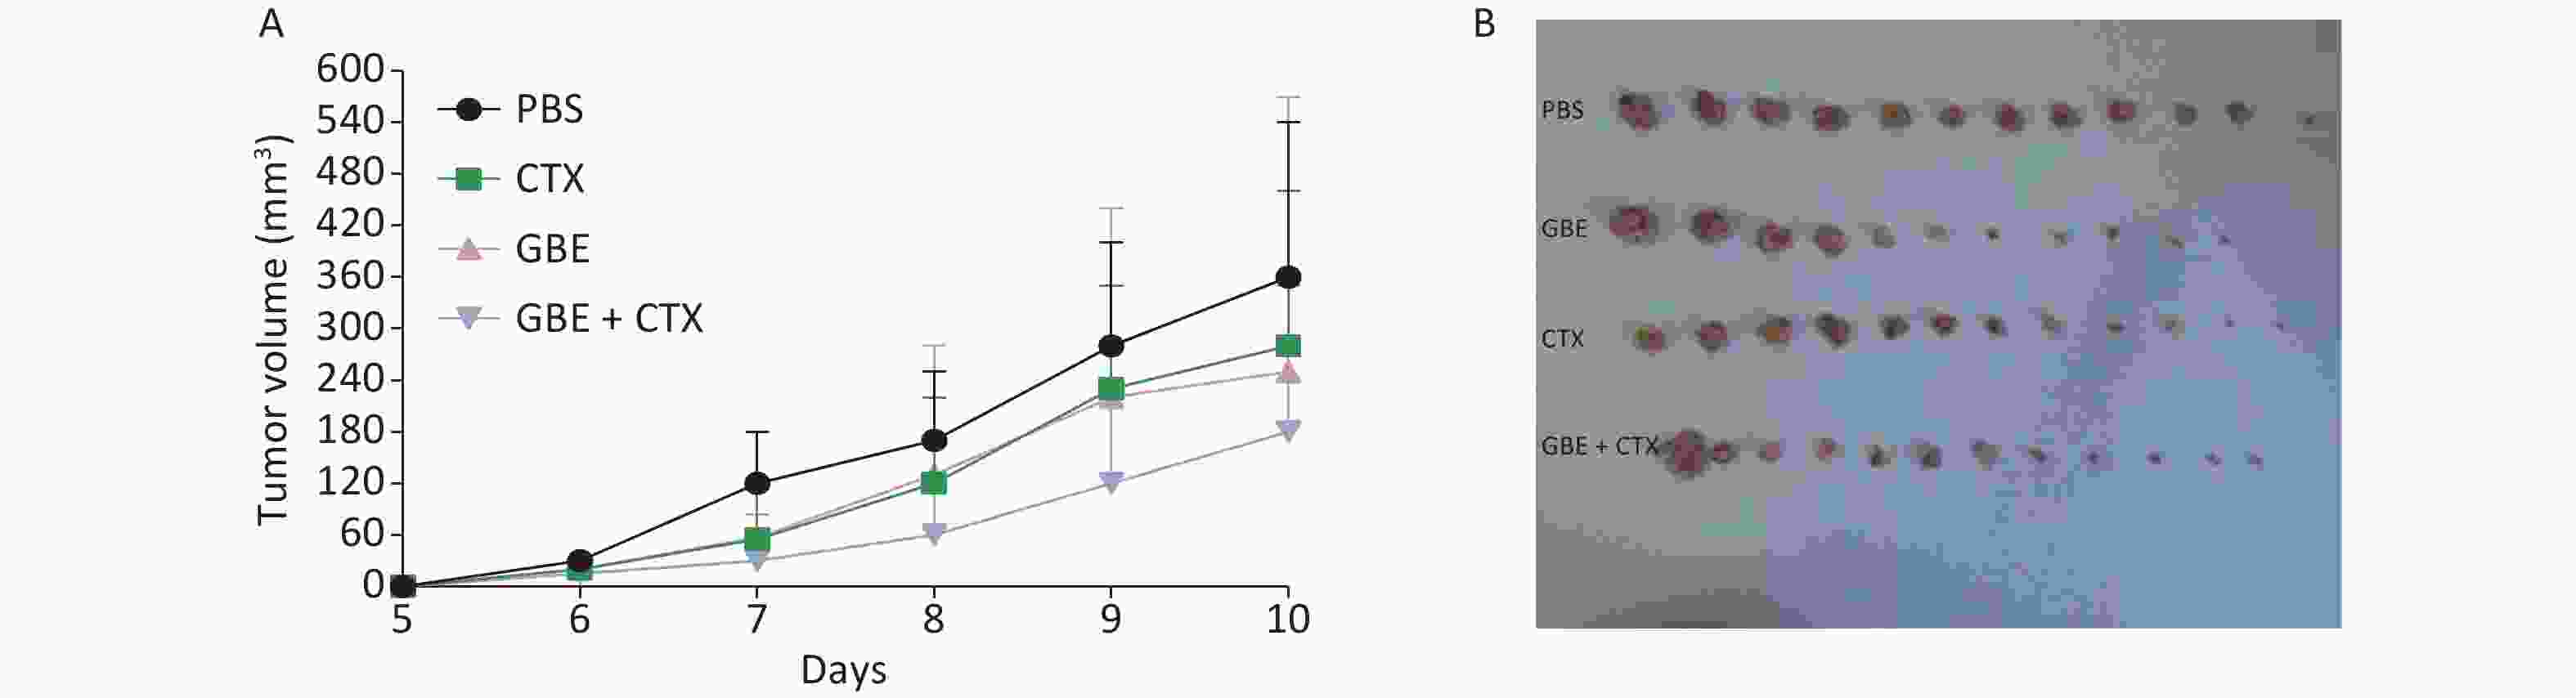
Figure S1. Comparison of tumor volume and weight in mice from different groups. The length and width of the tumor was measured every day. On day 10, all the mice from the PBS developed a palpated tumor and all the mice from different groups were anesthetized and sacrificed, the tumor was removed from each and every mice (n = 12). (A) Tumor growth represented by tumor volume, n = 12. (B) Tumor picture.
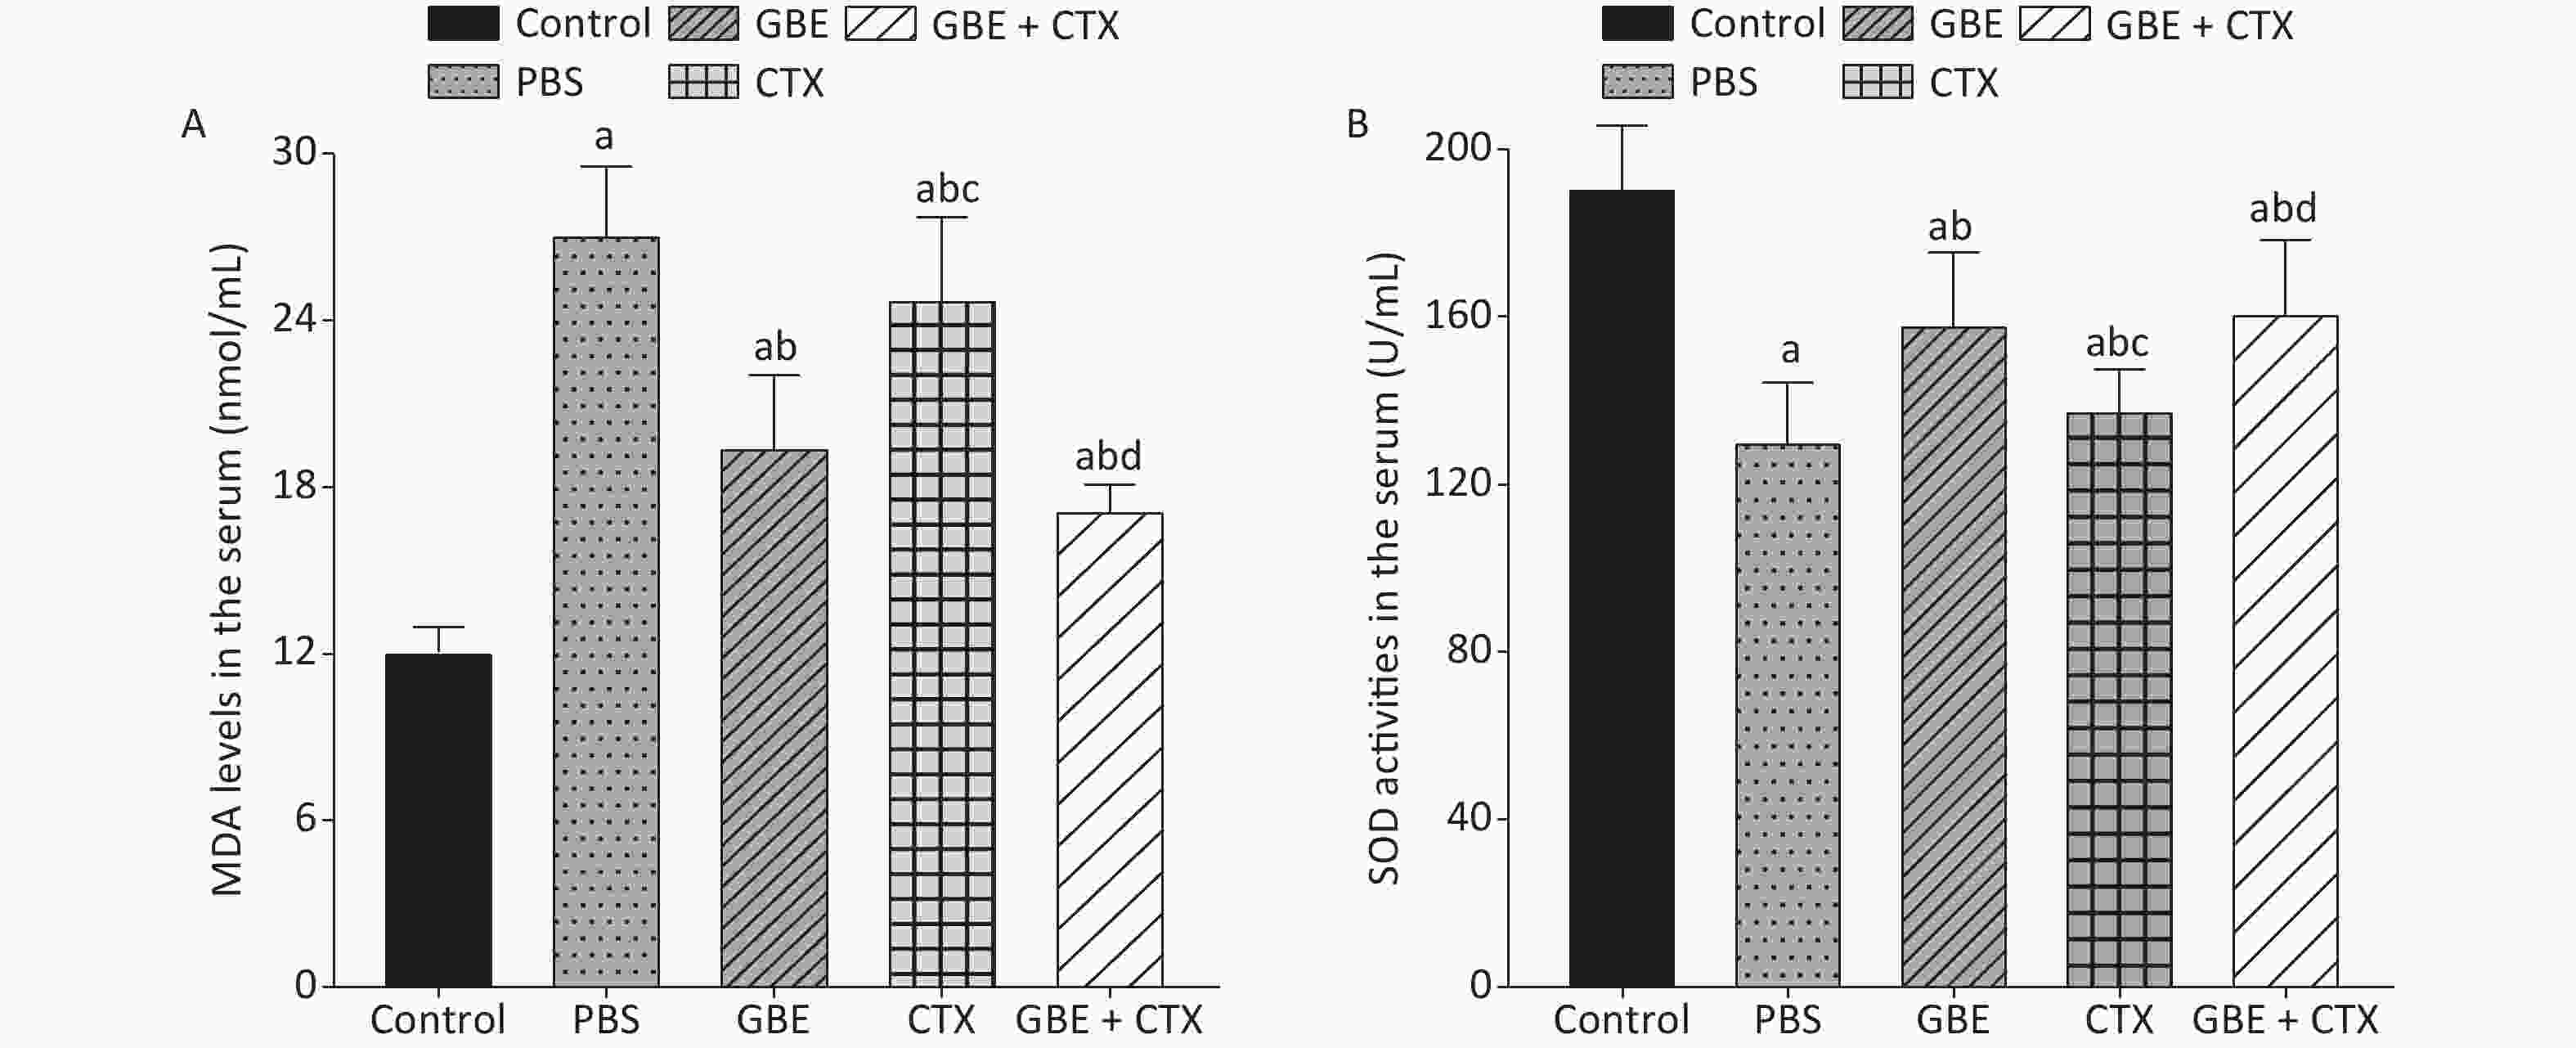
Figure S2. Comparison of MDA levels and SOD activities in the serum of mice. (A) Comparison of MDA levels in the serum of mice from different groups. (B) Comparison of SOD activities in the serum of mice from different groups. aP < 0.05 vs. control; bP < 0.05 vs. PBS; cP < 0.05 vs. GBE; dP < 0.05 vs. CTX.
doi: 10.3967/bes2021.136
Application of Ginkgo biloba L. Extract at the Early Stage of Tumor Development Helps Cyclophosphamide Inhibit the Growth of Tumor Cells
-
-
Figure 1. Body weight change of mice in different groups. The body weights of the mice were measured every day until all mice in the PBS group grew palpated tumors and all mice were sacrificed.
Figure 3. Western blot analysis of NF-κB, IκB-ɑ, P53, Bax, Bcl-2, FADD, Caspas-8, Cyto-C, PI3K, and Akt. β-Actin was used as a loading control. Representative images from three independent experiments and the results of densitometric analyses (means ± SDs) are shown. The photographs generated were quantitatively analyzed with a Quantity One image densitometer. (A) Western blot analysis of NF-κB, p-NF-κB, IκB-ɑ, p-IκB-ɑ, and P53 expression in tumors of mice treated with PBS, GBE, CTX, or GBE+CTX. (B) The comparison of NF-κB, p-NF-κB, p-IκB-ɑ and P53 relative expression level in tumors of mice treated with PBS, GBE, CTX, or GBE + CTX. (C) Western blot analysis of Bax, Bcl-2, FADD, Caspase-8, and cyto-C expression in tumors of mice treated with PBS, GBE, CTX, or GBE + CTX. (D) The comparison of FADD, Caspase-8, cyto-C, Bax, Bcl-2 and ratio of Bax to Bcl-2 relative expression level in tumors of mice treated with PBS, GBE, CTX, or GBE + CTX. (E) Western blot analysis of PI3K and Akt expression in tumors of mice treated with PBS, GBE, CTX, or GBE + CTX. (F) The comparison of PI3K and Akt relative expression level in tumors of mice treated with PBS, GBE, CTX, or GBE + CTX. aP < 0.05 vs. PBS; bP < 0.05 vs. GBE; cP < 0.05 vs. CTX.
S1. Comparison of tumor volume and weight in mice from different groups. The length and width of the tumor was measured every day. On day 10, all the mice from the PBS developed a palpated tumor and all the mice from different groups were anesthetized and sacrificed, the tumor was removed from each and every mice (n = 12). (A) Tumor growth represented by tumor volume, n = 12. (B) Tumor picture.
S2. Comparison of MDA levels and SOD activities in the serum of mice. (A) Comparison of MDA levels in the serum of mice from different groups. (B) Comparison of SOD activities in the serum of mice from different groups. aP < 0.05 vs. control; bP < 0.05 vs. PBS; cP < 0.05 vs. GBE; dP < 0.05 vs. CTX.
-
[1] Januškevičienė I, Petrikaitė V. Heterogeneity of breast cancer: the importance of interaction between different tumor cell populations. Life Sci, 2019; 239, 117009. doi: 10.1016/j.lfs.2019.117009 [2] Emadi A, Jones RJ, Brodsky RA. Cyclophosphamide and cancer: golden anniversary. Nat Rev Clin Oncol, 2009; 6, 638−47. doi: 10.1038/nrclinonc.2009.146 [3] Kurauchi K, Nishikawa T, Miyahara E, et al. Role of metabolites of cyclophosphamide in cardiotoxicity. BMC Res Notes, 2017; 10, 406. doi: 10.1186/s13104-017-2726-2 [4] Trueba GP, Sánchez GM, Giuliani A. Oxygen free radical and antioxidant defense mechanism in cancer. Front Biosci, 2004; 9, 2029−44. doi: 10.2741/1335 [5] Liu ZW, Ren ZP, Zhang J, et al. Role of ROS and nutritional antioxidants in human diseases. Front Physiol, 2018; 9, 477. doi: 10.3389/fphys.2018.00477 [6] Yang HT, Villani RM, Wang HL, et al. The role of cellular reactive oxygen species in cancer chemotherapy. J Exp Clin Cancer Res, 2018; 37, 266. doi: 10.1186/s13046-018-0909-x [7] Turati F, Rossi M, Pelucchi C, et al. Fruit and vegetables and cancer risk: a review of southern European studies. Br J Nutr, 2015; 113, S102−10. doi: 10.1017/S0007114515000148 [8] Ren M, Yang SJ, Li JH, et al. Ginkgo biloba L. extract enhances the effectiveness of syngeneic bone marrow mesenchymal stem cells in lowering blood glucose levels and reversing oxidative stress. Endocrine, 2013; 43, 360‐9. -
 21148Supplementary Materials.pdf

-

 点击查看大图
计量
- 文章访问数: 633
- HTML全文浏览量: 238
- PDF下载量: 51
- 被引次数: 0

 Quick Links