

 下载:
下载:


-
Insulin resistance is closely associated with metabolic disorders and the pathogenesis of type 2 diabetes mellitus (T2DM). Accumulating evidence suggests that excess fatty acids due to inappropriate lipolysis increase the risk of insulin resistance, which, in turn, stimulates hyperinsulinemia, worsens metabolism, and leads to insulin resistance due to impaired β-cell function, subsequently resulting in diabetes[1]. Therefore, identifying the risk factors that can lead to metabolic disorders is important to prevent insulin resistance and T2DM. Recently, as people have become increasingly environmentally conscious, the harmful effects of environmental endocrine disruptors (EDCs) on insulin resistance have become obvious[2]. Currently, more than 1,000 synthesized compounds are considered as EDCs. They are defined as exogenous chemicals or mixtures of chemicals that interfere with hormonal action.
Di-2-ethylhexyl phthalate (DEHPs) is a typical EDC that is widely used as a plasticizer in plastic products[3]. Previous studies have reported that exposure to DEHPs can cause reproductive, while other studies have found that it can lead to hepatic disorders, thereby affecting metabolism[4]. This finding has been attributed to the activation of the peroxisome proliferator–activated receptor γ (PPARγ) upon DEHP metabolites exposure, which plays a key role in the progression of liver damage. An epidemiological study found that DEHP metabolites are associated with increased glucose concentrations and insulin resistance[5]. This study combined datasets from the National Health and Nutrition Survey (NHANES) and Gene Expression Omnibus (GEO) to explore the relationship between DEHPs and T2DM from epidemiological and bioinformatic perspectives.
We downloaded the 2017–2018 cycle survey database from the NHANES website and chose participants who had complete information on DEHP metabolites and T2DM status. Individuals below 18 years of age, pregnant women, and those with creatinine levels > 300 mg/mL were excluded. Finally, 1,042 adults from the US were included in this study. All the participants provided written informed consent, and their personal and private information was kept confidential and retained for the stated purposes. The procedures and protocols for each exam component from 2017–2018 can also be found on the NHANES website. After excluding DEHPs metabolites with a lower limit of detection > 40%, 10 DEHP metabolites were included in the final analysis. High-performance liquid chromatography-electrospray ionization-tandem mass spectrometry was used for the quantitative detection of the following metabolites in urine: monobenzyl phthalate (MBzP), mono- (2-ethyl-5-oxohexyl) phthalate (MEOHP), mono-isobutyl phthalate (MiBP), mono- (2-ethyl-5-hydroxyhexyl) phthalate (MEHHP), monoethyl phthalate (MEP), mono- (3-carboxypropyl) phthalate (MC1P), mono-n-butyl phthalate (MnBP), mono-2-ethyl-5-carboxypentyl phthalate (MECPP), mono (carboxyisoctyl) phthalate (MCOP), and mono (carboxyisononyl) phthalate (MCNP). We also assessed ∑DEHP based on urine mono- (2-ethyl-5-oxohexyl) phthalate (MEOHP), urine mono- (2-ethyl-5-hydroxyhexyl) phthalate (MEHHP), and urine mono-2-ethyl-5-carboxypentyl phthalate (MECPP). Owing to the skewed distribution of the DEHPs metabolites, we transformed the components by log2 for analysis.
The NHANES gathers information on an individual’s diabetes status using a self-administered questionnaire. Based on the diagnostic criteria for T2DM, we defined individuals with T2DM as those with a fasting plasma glucose (FPG) level of 7.0 mmol/L or a glycosylated hemoglobin level of > 6.5%. Of the 1,042 participants, 104 were diabetic and 938 were non-diabetic. To better understand the association between DEHP metabolites and the risk of diabetes, we analyzed the relationship between DEHP metabolites and glucose metabolism variables, including FPG and fasting insulin (FINS) levels, and homeostasis model assessment for insulin resistance (HOMA-IR). The formula used to determine HOMA-IR was as follows: FPG (mmol/L) × FINS (μU/mL)/22.5. To determine the independent association between DEHPs metabolites and diabetes, we selected variables, including age, race, education level, body mass index (BMI), waist circumference (WC), systolic blood pressure (SBP), diastolic blood pressure (DBP), total cholesterol (TG), triacylglycerol (TC), high-density lipoprotein (HDL), Low Density Lipoprotein (LDL), and creatinine levels as covariates.
To investigate the potential pathological mechanisms of DEHP metabolites in T2DM, we selected a gene expression dataset from the GEO database (https://www.ncbi.nlm.nih.gov/geo/) website. This dataset, named GSE14629, was uploaded by Professor Eveillard A[6], who investigated the potential mechanisms underlying the effect of DEHP metabolites on adult mouse livers in vivo. The author designed four experimental conditions: control mice (vehicle-treated) and mice treated with 30 mg/kg per day (D30), 180 mg/kg per day (D180), or 1,100 mg/kg per day (D1100) for 14 days. Adult mice that received the vehicle and those treated with DEHP 1,100 mg/kg per day were selected for our analysis.
All statistical analyses were conducted using R 4.2.2 software; the R packages “tidyverse” and “rms” were used to analyze the relationship between DEHPs and T2DM. For the epidemiological analysis, we first transformed non-normally distributed data and compared the differences between the nondiabetic and diabetic groups using two-sample t-tests. Nonparametric tests were used if the data were not normally distributed after transformation. Furthermore, we divided the epidemiological samples using quantiles of DEHP metabolites and compared the effects of different levels of DEHP metabolite exposure on the risk of diabetes. We also used restricted cubic spline plots to determine the association between DEHP metabolites and the risk of T2DM and used linear model estimation using ordinary least squares to analyze the association between DEHP metabolites and glucose variables. The Weighted Quantile Sum (WQS) was performed to analyze the combined effect of DEHP metabolites on the risk of diabetes. For bioinformatics analysis, we used the R package “limma” to identify differentially expressed genes in the GSE14629 dataset and performed functional enrichment analysis using the Database for Annotation, Visualization, and Integrated Discovery (DAVID; http://www.david.abcc.ncifcrf.gov/). Heatmaps were used to illustrate genes expressed differentially in different groups, namely those exposed to DEHPs. Statistical significance was set at P < 0.05.
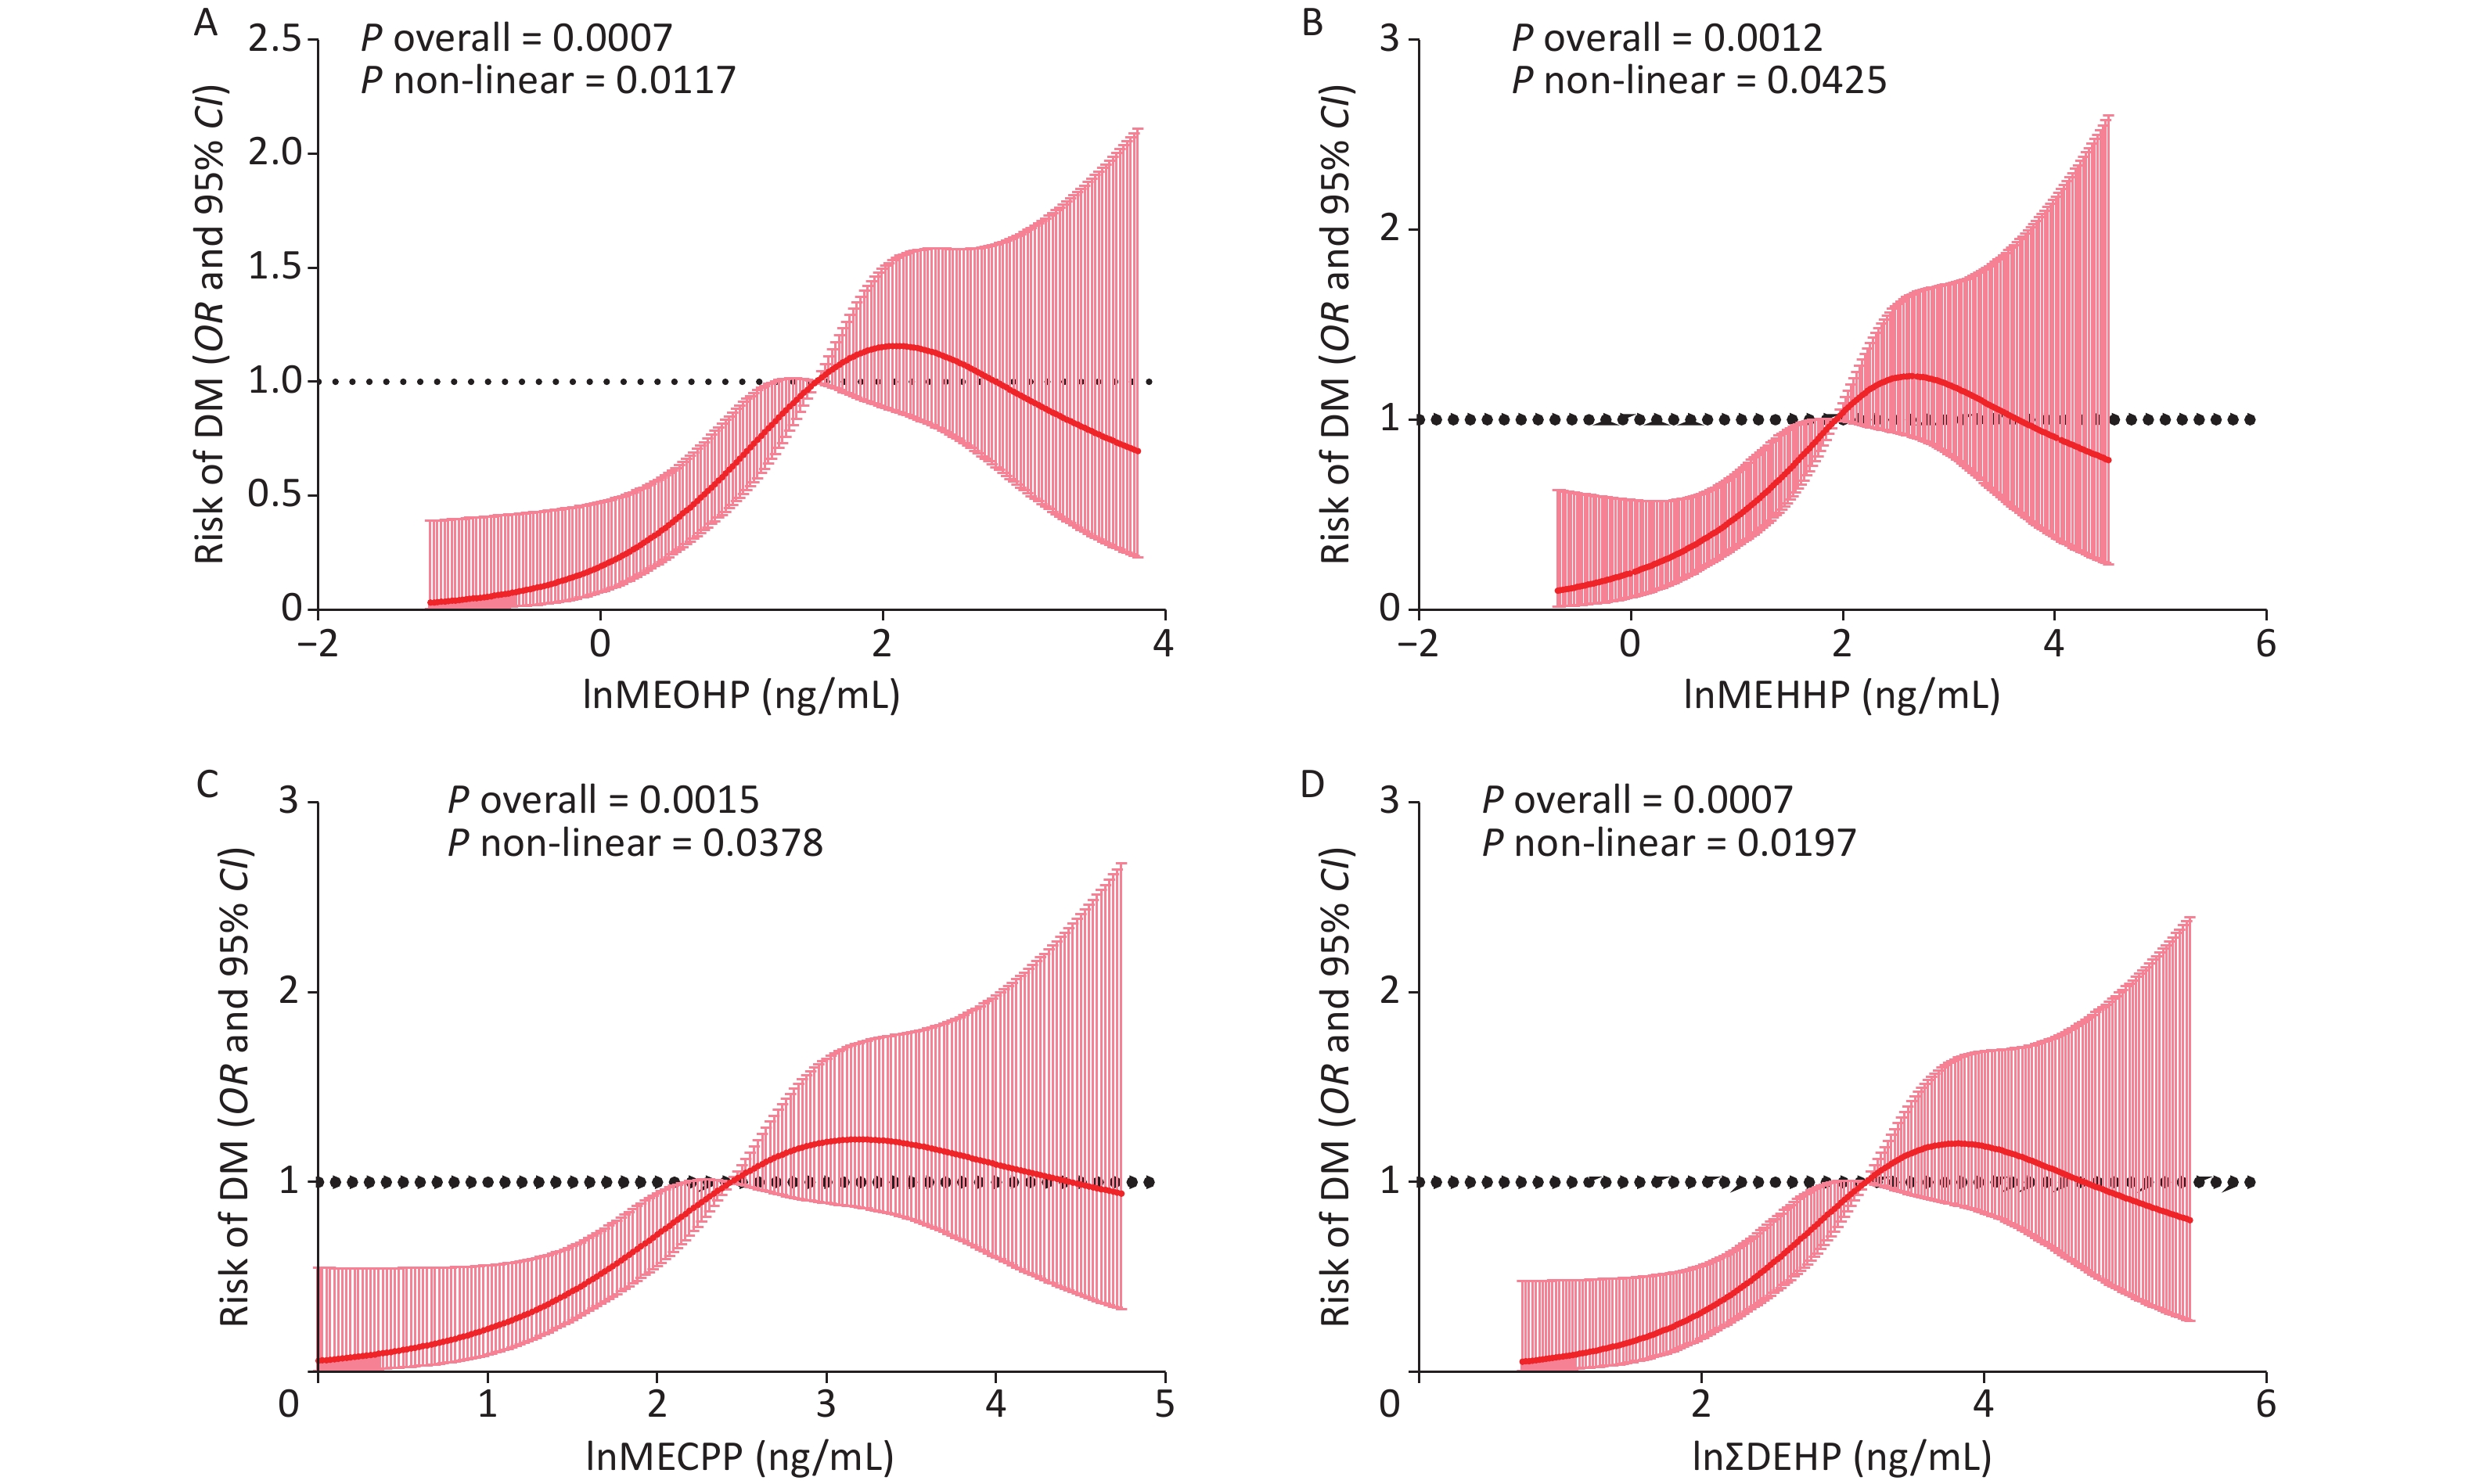
In the diabetic group, a total of 104 participants were older and had higher BMI, WC, SBP, TG, FPG, FINS, and ∑DEHP, as well as three DEHP metabolites: MECPP, MEHHP, and MEOHP. Other DEHP components, such as MCNP, MCOP, MnBP, MC1P, MEP, MiBP, and MBzP, did not differ significantly between the groups. Sex and race did not differ significantly between the two groups. The HDL and LDL levels in the non-diabetic group were higher than those in the diabetic group (Table 1). After adjusting for sex, race, age, BMI, SBP, TG, and other covariates, we explored the association of the risk of T2DM with MECPP, MEHHP, MEOHP, and ∑DEHP (Figure 1) and found that these DEHPs metabolites were significantly related to the risk of T2DM through a non-linear correlation. This finding is in agreement with previous studies that reported an increased risk of diabetes with MECPP and MEOHP exposure[7]. We also explored DEHP metabolites associated with FPG, Fins, and HOMA-IR (Supplementary Figure S1, available in www.besjournal.com) and found that MECPP, MEHHP, MEOHP, and ∑DEHP were positively related to Fins and HOMA-IR. Additionally, using the WQS method, we confirmed that DEHP metabolites were associated with the risk of T2DM and HOMA-IR (Supplementary Figure S2, available in www.besjournal.com). Bioinformatic analysis revealed that compared with non-DEHPs exposure mice, the top 10 genes (ACOX1, EHHADH, ACADM, ACAA1B, HSD17B4, ACOT1, PEX11A, ECI1, ECI2, and ECH1) in the PPAR signaling and insulin resistance pathways were highly expressed in DEHPs exposure mice (Figure 2). It is important to note that the ACOX1, EHHADH, ACADM, ACAA1B, and HSD17B4 genes participate in multiple metabolic pathways by upregulating their respective expression.
Table 1. The clinical characteristic of 2017–2018 NHANES data according to T2DM status
Variables Non-T2DM T2DM P n 938 104 Age (years) 41.26 ± 20.67 60.38 ± 13.77 < 0.001 BMI (kg/m2) 27.66 ± 7.19 31.16 ± 7.22 < 0.001 WC (cm) 94.28 ± 17.23 107.24 ± 16.38 < 0.001 SBP (mmHg) 118.98 ± 17.42 129.65 ± 19.08 < 0.001 DBP (mmHg) 67.27 ± 12.11 68.10 ± 16.09 0.538 TC (mmol/L) 4.71 ± 1.06 4.55 ± 0.97 0.144 TG (mmol/L) 1.20 ± 0.82 1.64 ± 1.12 < 0.001 HDL (mmol/L) 1.40 ± 0.41 1.29 ± 0.33 0.007 LDL (mmol/L) 2.77 ± 0.94 2.53 ± 0.84 0.015 FPG (mmol/L) 5.49 ± 0.83 8.86 ± 3.47 < 0.001 Fins (pmol/L) 56.55 (36.90−91.14) 74.70 (47.13−126.00) 0.001 Cr (mg/dL) 134.26 ± 79.80 122.62 ± 62.13 0.151 Sex (male, %) 446 (47.5) 55 (52.9) 0.301 Race, n (%) Mexican American 130 (13.9) 20 (19.2) 0.281 Other Hispanic 82 (8.7) 8 (7.7) Non-Hispanic White 374 (39.9) 35 (33.7) Non-Hispanic Black 200 (21.9) 28 (26.9) Other Race 152 (16.2) 13 (12.5) Smoked status, n (%) Yes 205 (21.9) 41 (39.4) < 0.001 No 733 (78.1) 63 (60.6) Alcohol used, n (%) Yes 572 (61.0) 67 (64.4) 0.494 No 366 (39.0) 37 (35.6) Phthalates and plasticizers metabolites MECPP (ng/mL)* 2.37 ± 1.01 2.65 ± 0.78 0.001 MEHHP (ng/mL)* 1.82 ± 1.10 2.11 ± 0.87 0.002 MEOHP (ng/mL)* 1.42 ± 1.06 1.73 ± 0.79 < 0.001 ∑DEHP (ng/mL)* 3.06 ± 1.02 3.35 ± 0.78 0.001 MCNP (ng/mL)* 0.91 (0.26−1.67) 0.99 (0.47−1.78) 0.172 MCOP (ng/mL)* 3.00 ± 1.43 3.16 ± 1.30 0.274 MnBP (ng/mL)* 2.28 ± 1.09 2.36 ± 0.86 0.462 MC1P (ng/mL)* 0.64 (−0.22 to 1.55) 0.77 (0.09 to 1.64) 0.137 MEP (ng/mL)* 3.72 ± 1.50 3.76 ± 1.32 0.783 MiBP (ng/mL)* 2.09 ± 1.08 2.15 ± 1.04 0.614 MBzP (ng/mL)* 1.53 (0.58−2.42) 1.56 (0.88−2.56) 0.441 Note. *: The variable was transferred by ln. Continuous variables are expressed as mean ± SD, or M (P25, P75). BMI: body mass index; WC: waist circumference; SBP: systolic blood pressure; DBP: diastolic blood pressure; TC: total cholesterol; TG: triglyceride; HDL: high-density lipoprotein; LDL: Low-Density Lipoprotein; FPG: fasting plasma glucose; Fins: fasting insulin; Cr: creatinine; MBzP: Urine mono-benzyl phthalate; MEOHP: Urine mono- (2-ethyl-5-oxohexyl) phthalate; MiBP: Urine mono-isobutyl phthalate; MEHHP: Urine mono- (2-ethyl-5-hydroxyhexyl) phthalate; MEP: Urine monoethyl phthalate; MC1P: Urine Mono- (3-carboxypropyl) phthalate; MnBP: Urine mono-n-butyl phthalate; MECPP: Urine mono-2-ethyl-5-carboxypentyl phthalate; MCOP: Urine mono (carboxyisoctyl) phthalate; MCNP: Urine mono (carboxyisononyl) phthalate. 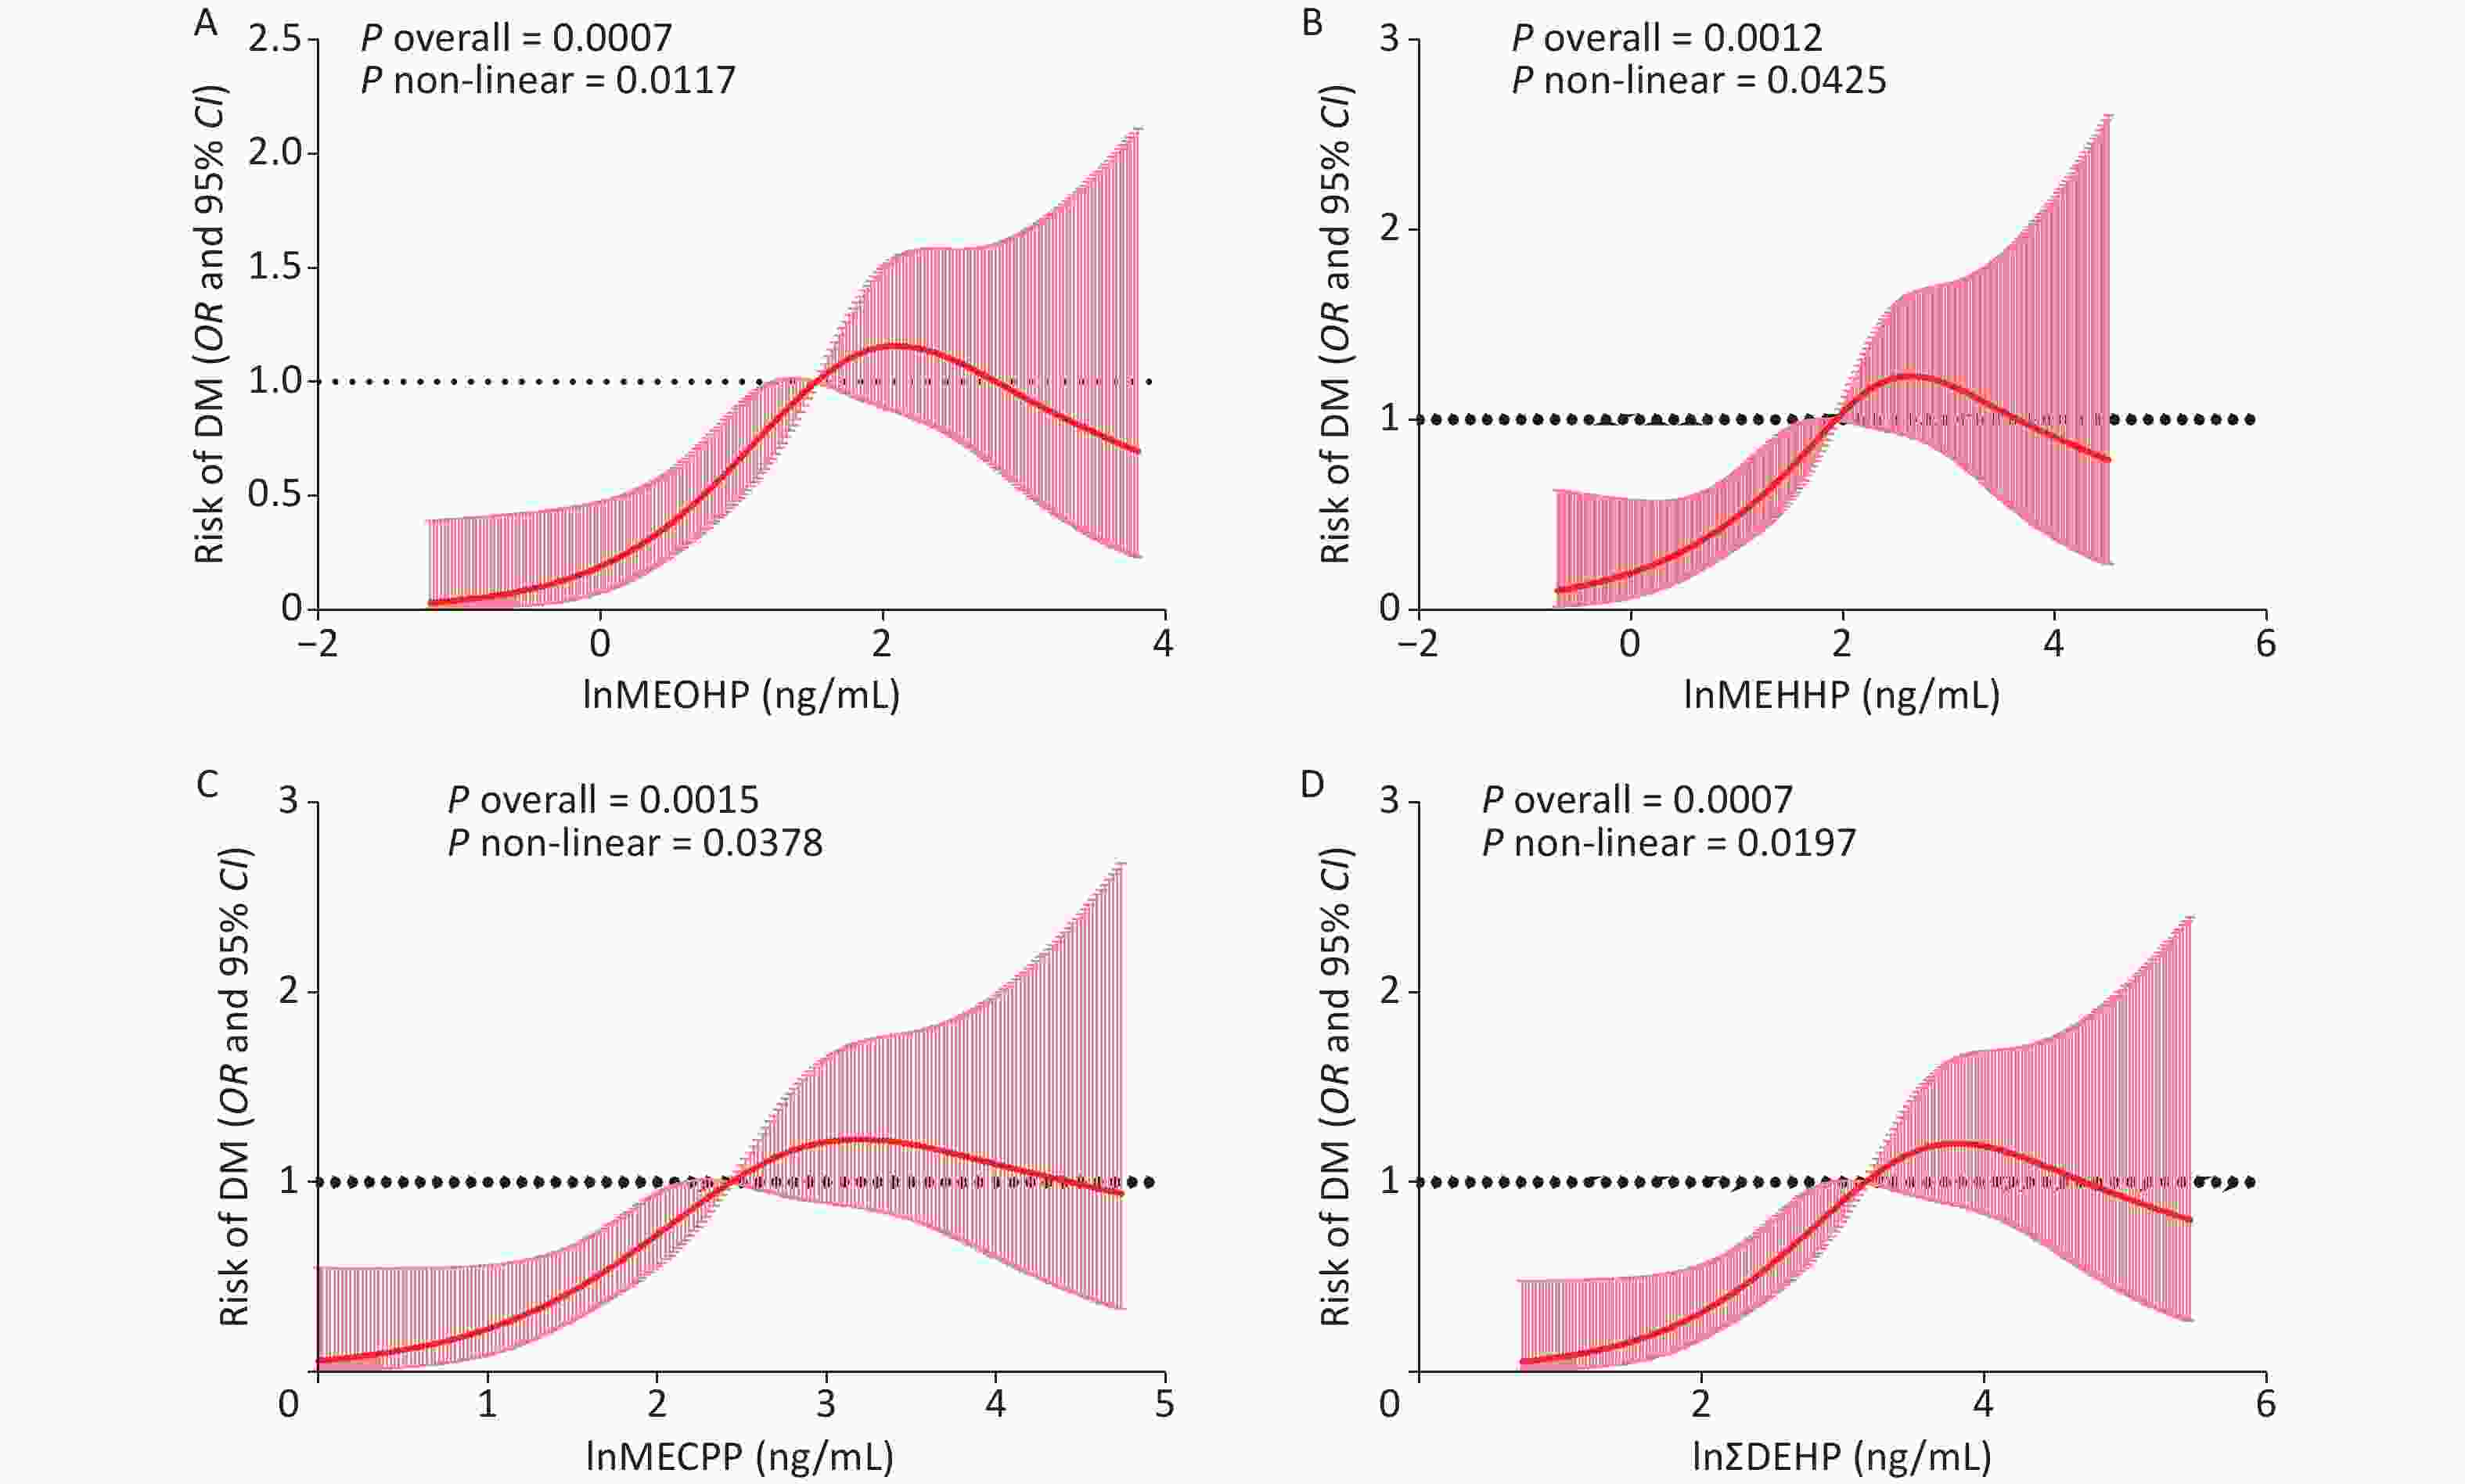
Figure 1. The risk of T2DM is related to the level of MECPP, MEOHP, MEHHP, and ∑DEHP. (A) The association between the risk of T2DM and the level of MEOHP; (B) The association between the risk of T2DM and the level of MEHHP; (C) The association between the risk of T2DM and the level of MECPP; (D) The association between the risk of T2DM and the level of ∑DEHP. MEOHP: Urine mono- (2-ethyl-5-oxohexyl) phthalate; MEHHP: Urine mono- (2-ethyl-5-hydroxyhexyl) phthalate; MECPP: Urine mono-2-ethyl-5-carboxypentyl phthalate; T2DM: Type 2 diabetes mellitus; DEHP: Di-2-ethylhexyl phthalate.
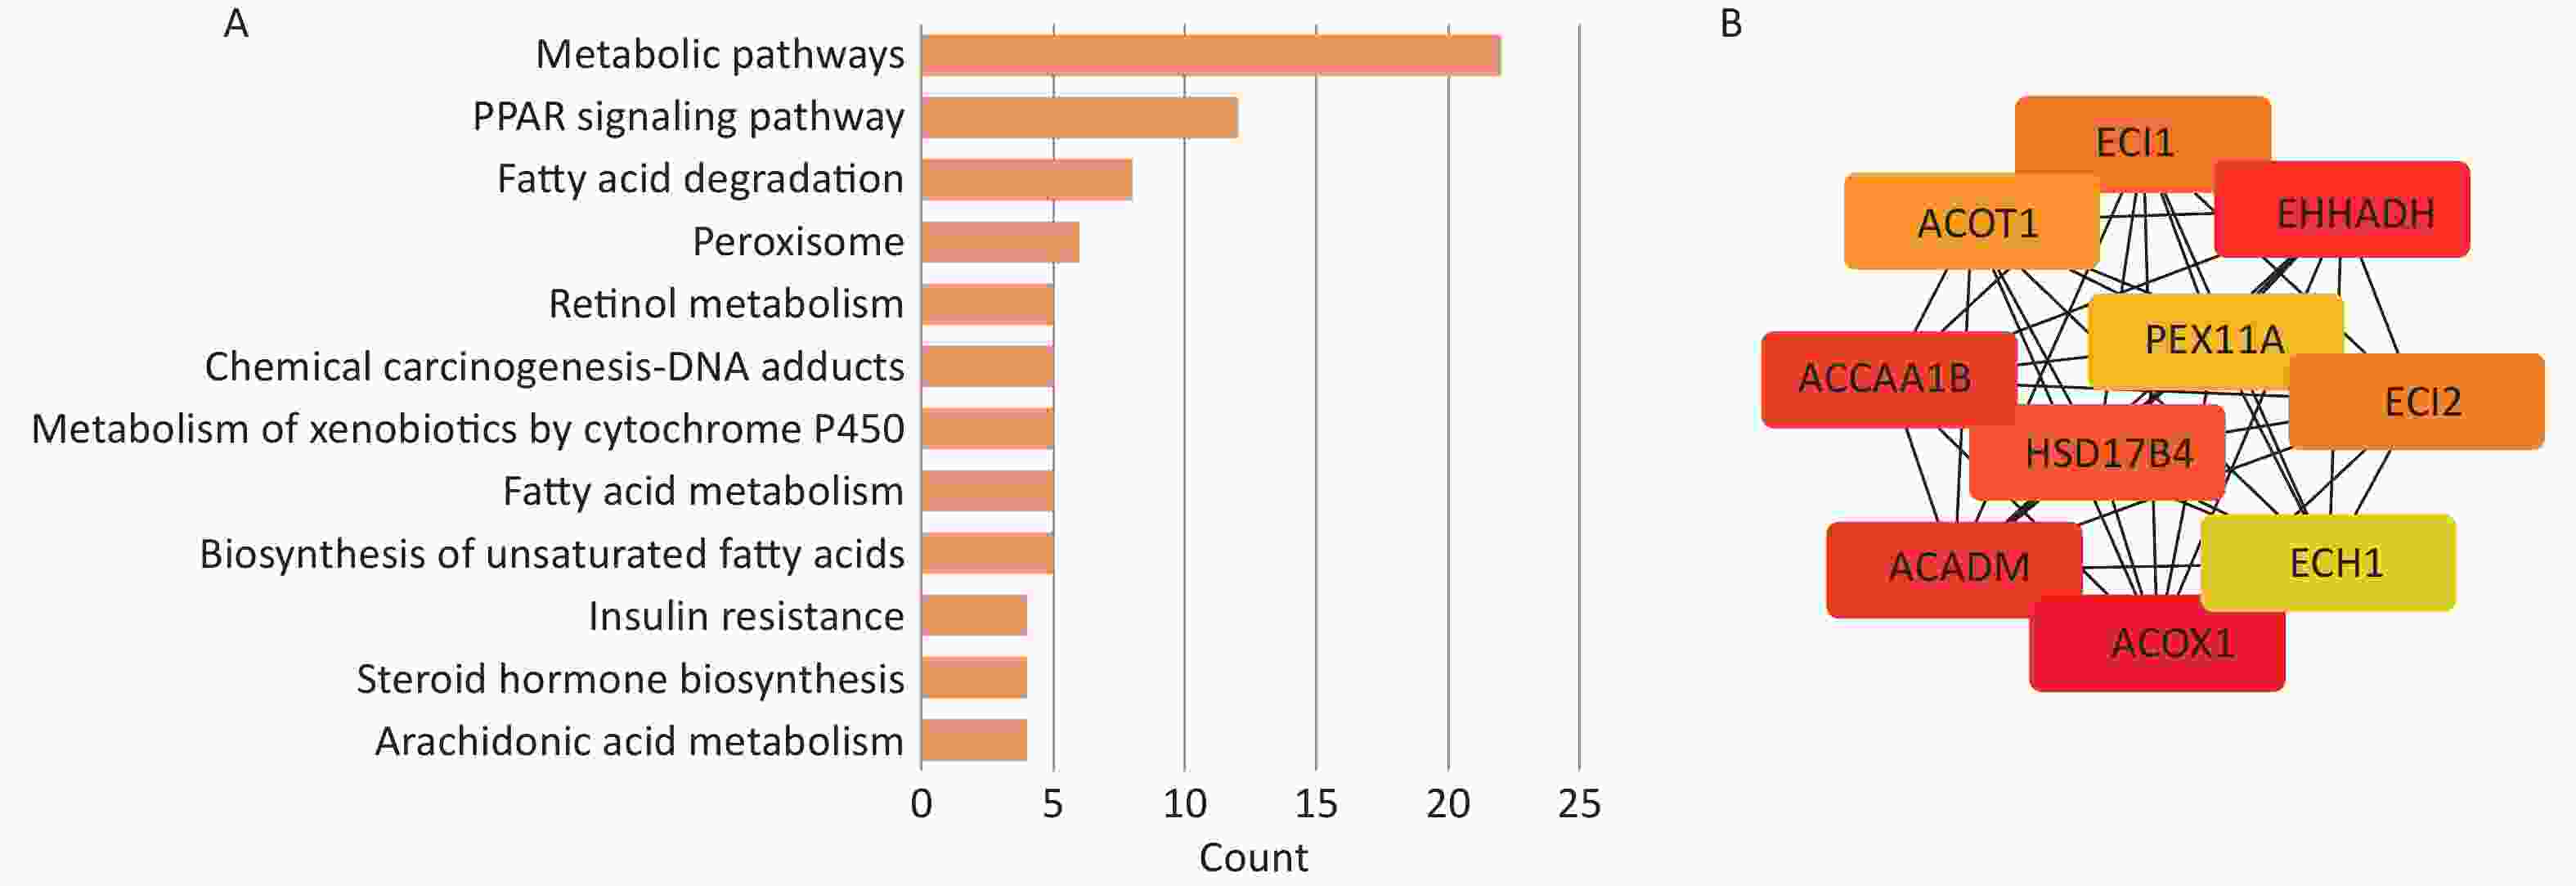
Figure 2. The hub genes and their correlation. (A) The underlying functions and pathways of differentially expressed genes using the DAVID database. (B) The Top 10 hub genes from STRING data.
Acyl-CoA oxidase 1 (ACOX1) is the first and rate-limiting enzyme in peroxisomal fatty acid oxidation in all eukaryotes. The abnormal upregulation of ACOX1 by PPAR activation stimulates hepatic fatty acid oxidation with concomitant H2O2 accumulation; consequently, oxidative stress increases considerably, which might directly damage insulin-producing pancreatic β-cells and decrease insulin sensitivity[8]. Hydratase/3-hydroxyacyl CoA dehydrogenase (EHHADH) is also a key gene in the PPAR pathway, which is important for maintaining peroxisomes, and its overexpression can cause abnormalities in fatty acid oxidation[9]. Similar to our findings, Xi Lan et al.[10] found that EHHADH and ACOX1 were highly expressed in the livers of patients with type 2 diabetes, suggesting that both genes may be involved in the onset of diabetes. The ACADM, ACAA1B, and HSD17B4 genes were all overexpressed in the livers of rats exposed to DEHP and were all enriched in the PPAR signaling and metabolic pathways. Similar to ACOX1 and EHHADH, the high expression of ACADM, ACAA1B, and HSD17B4 indicated increased hepatic fat accumulation and accelerated fatty acid breakdown. Several genes that are affected by DEHP exposure are associated with lipid metabolism. Dysregulation of lipid and fatty acid metabolism is an independent risk factor for diabetes due to insulin resistance and glucose metabolism disorders. Therefore, it is reasonable to speculate that DEHP exposure increases the risk of developing diabetes.
Our study had some limitations. First, only adults from the US were included in the final analysis. Thus, the exposure of adolescents and children to DEHP metabolites should be considered in future studies. Second, although we found that exposure to DEHP metabolites increased the risk of DM, the metabolic pathways affected by DEHP metabolite exposure that led to DM should be studied further. In the bioinformatics analysis, we ultimately identified two distinct groups: the non-exposed DEHP group and the exposed DEHP 1,100 mg/(kg∙day) group. Although we were able to highlight the differential gene expression between these groups, our analysis was unable to yield any insight into the dose-response relationship that may exist between DEHP metabolites and T2DM.
In summary, using the 2017–2018 NHANES and GSE14629 datasets, we found that MECPP, MEHHP, MEOHP, and ∑DEHP were positively associated with T2DM risk. This outcome may be due to exposure to DEHP metabolites, which cause metabolic disorders by altering PPAR signaling, fatty acid degradation, and insulin resistance pathways. This finding contributes to the prevention of T2DM onset and provides health knowledge to the population.
-

Figure S1. The flow diagram of study participants.
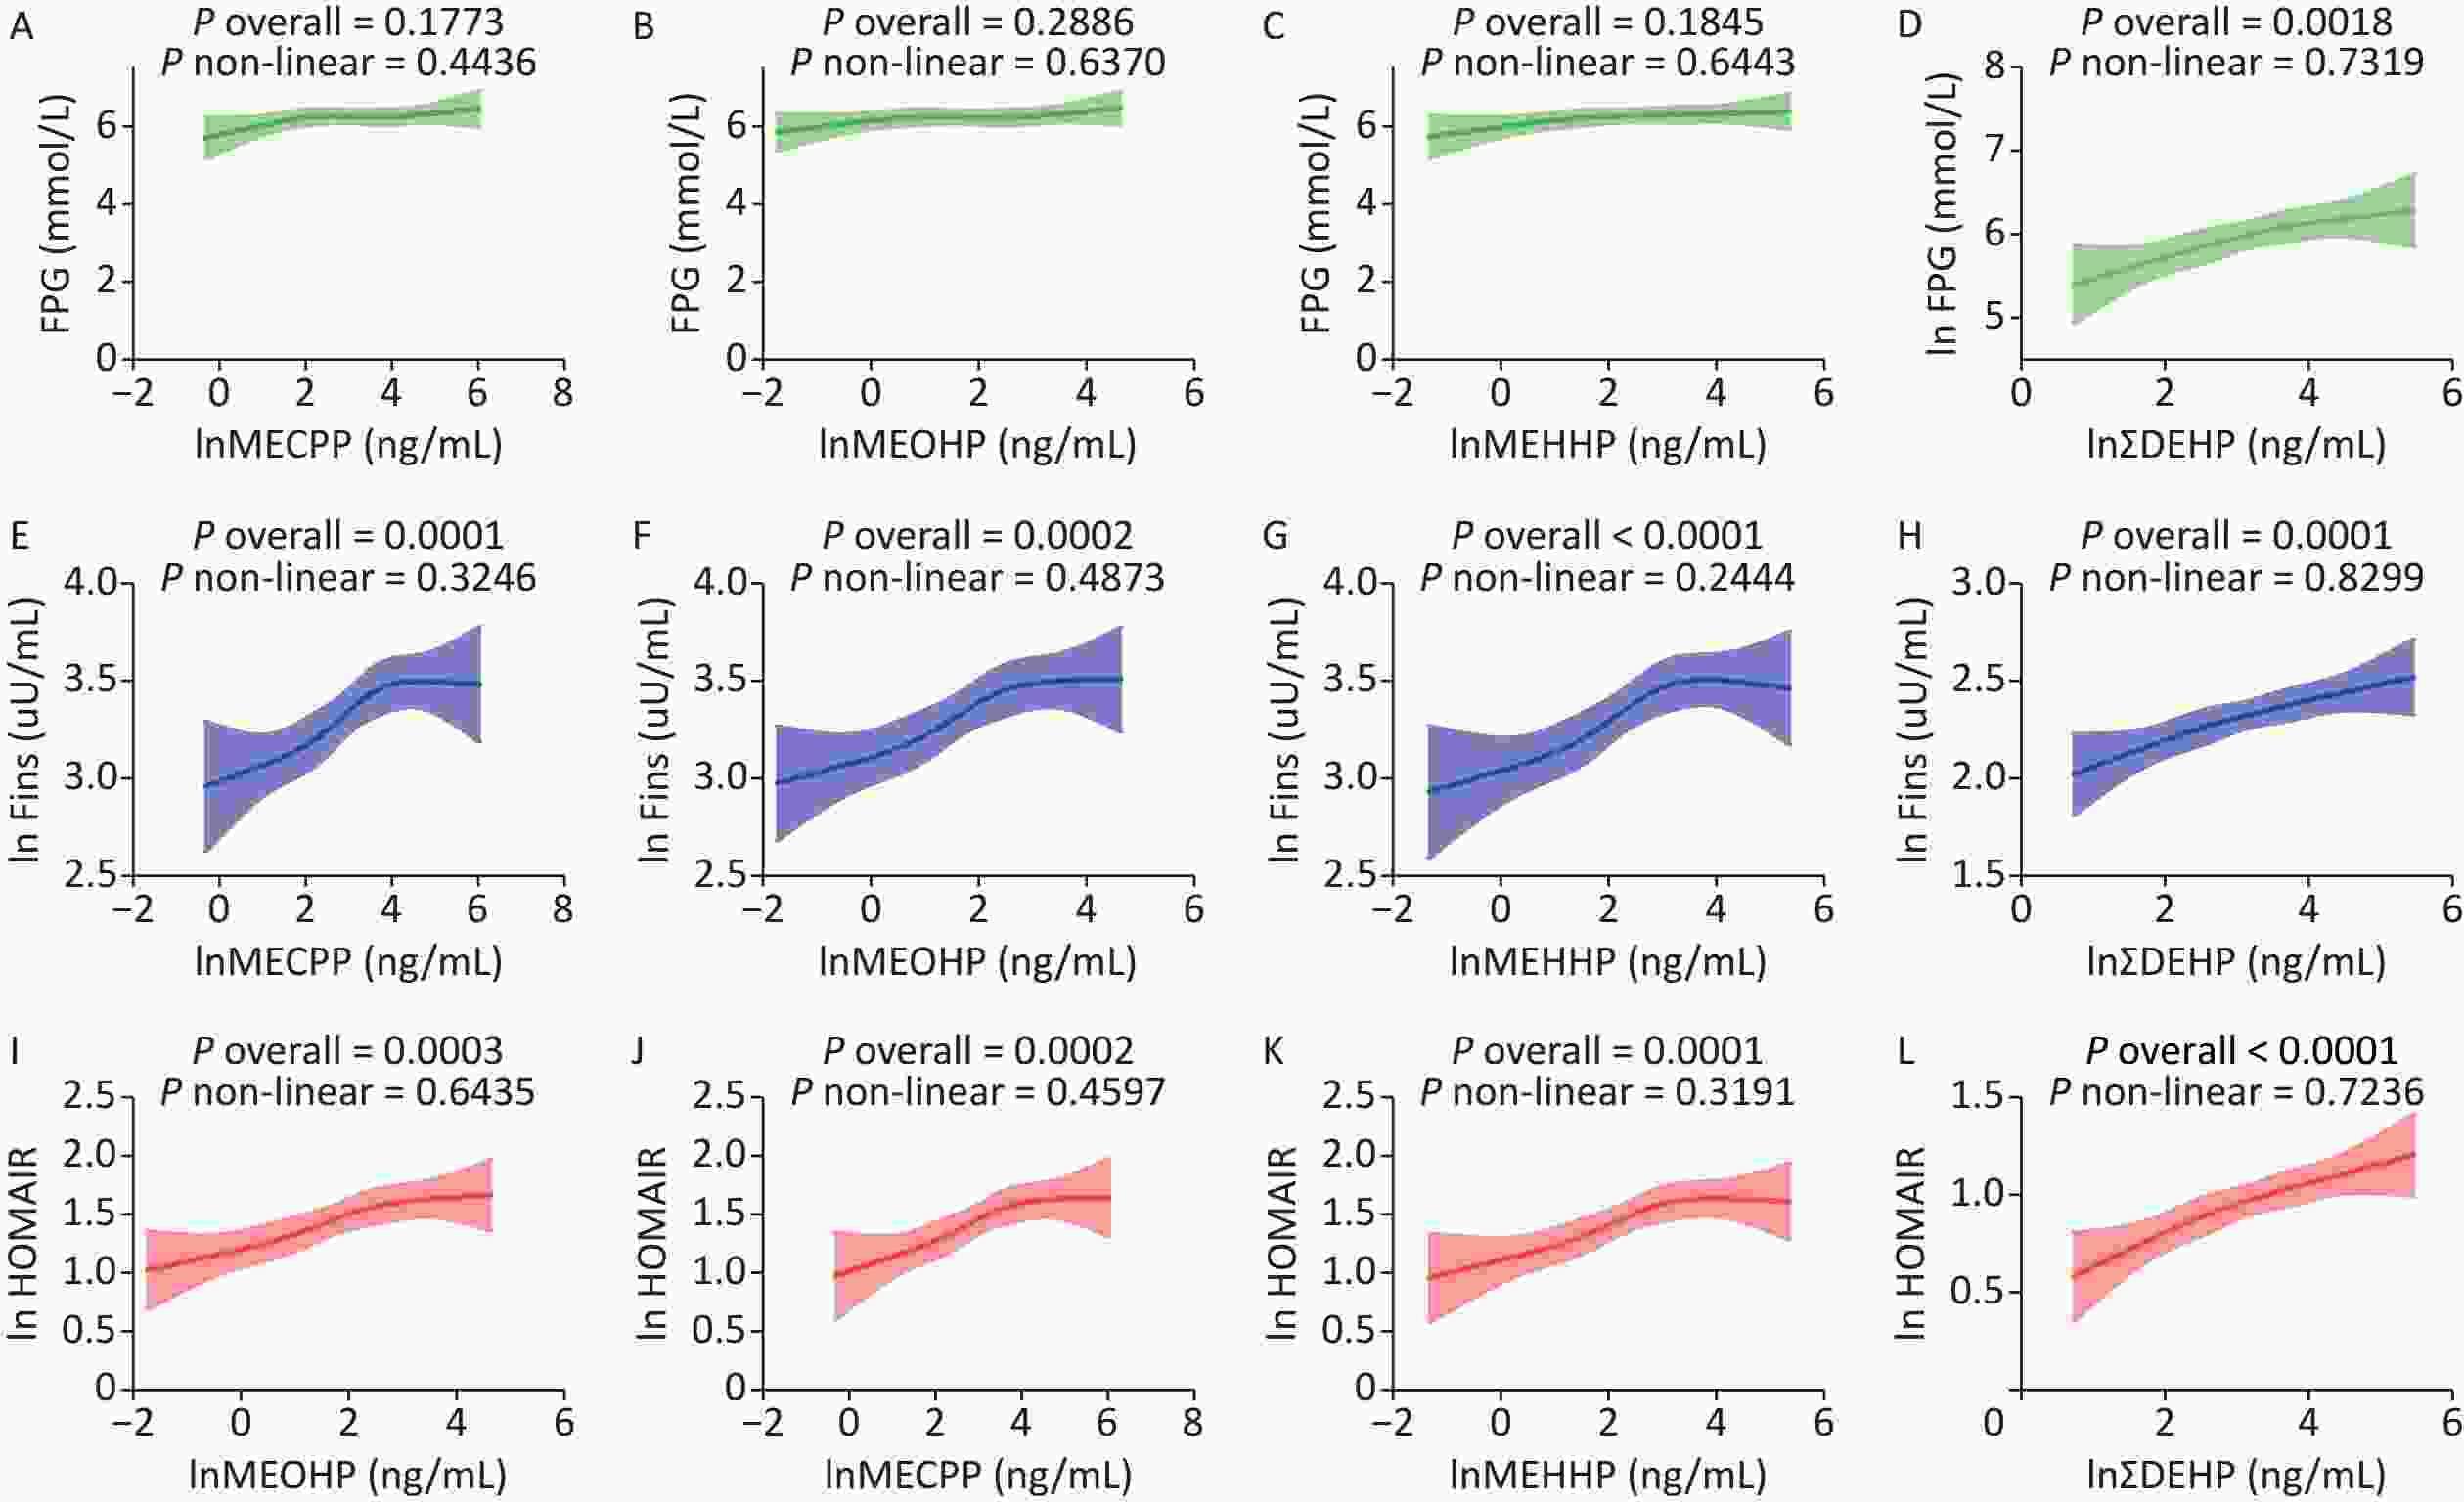
Figure S2. MECPP, MEOHP, MEHHP, and DEHP levels are associated with fasting insulin, fasting plasma glucose, and HOMA-IR. (A, B, C, D): MECPP, MEOHP, MEHHP, and ∑DEHP associated with fasting plasma glucose; (E, F, G, H): MECPP, MEOHP, MEHHP, and ∑DEHP associated with fasting insulin; (I, J, K, L): MECPP, MEOHP, MEHHP, and ∑DEHP associated with HOAMIR. MEOHP: Urine mono- (2-ethyl-5-oxohexyl) phthalate; MEHHP: Urine mono- (2-ethyl-5-hydroxyhexyl) phthalate; MECPP: Urine mono-2-ethyl-5-carboxypentyl phthalate; T2DM: type 2 diabetes mellitus; DEHP: Di-2-ethylhexyl phthalate.
doi: 10.3967/bes2023.115
The Link between Exposure to Phthalates and Type 2 Diabetes Mellitus: A Study Based on NHANES Data and Bioinformatic Analysis
-
All authors approved the final version of the manuscript. Jun Liang was responsible for the integrity of this work. XK Liu and SW contributed equally to this study.
The authors declare that they have no competing interests or other interests that might influence the results or discussion reported in this paper.
The study was reviewed and approved by the Ethics Committees of Xuzhou Central Hospital.
&These authors contributed equally to this work.
注释:1) Authors' Contributions: 2) Competing Interests: 3) Ethics Approval and Consent to Participate: -
Figure 1. The risk of T2DM is related to the level of MECPP, MEOHP, MEHHP, and ∑DEHP. (A) The association between the risk of T2DM and the level of MEOHP; (B) The association between the risk of T2DM and the level of MEHHP; (C) The association between the risk of T2DM and the level of MECPP; (D) The association between the risk of T2DM and the level of ∑DEHP. MEOHP: Urine mono- (2-ethyl-5-oxohexyl) phthalate; MEHHP: Urine mono- (2-ethyl-5-hydroxyhexyl) phthalate; MECPP: Urine mono-2-ethyl-5-carboxypentyl phthalate; T2DM: Type 2 diabetes mellitus; DEHP: Di-2-ethylhexyl phthalate.
Figure 2. The hub genes and their correlation. (A) The underlying functions and pathways of differentially expressed genes using the DAVID database. (B) The Top 10 hub genes from STRING data.
S2. MECPP, MEOHP, MEHHP, and DEHP levels are associated with fasting insulin, fasting plasma glucose, and HOMA-IR. (A, B, C, D): MECPP, MEOHP, MEHHP, and ∑DEHP associated with fasting plasma glucose; (E, F, G, H): MECPP, MEOHP, MEHHP, and ∑DEHP associated with fasting insulin; (I, J, K, L): MECPP, MEOHP, MEHHP, and ∑DEHP associated with HOAMIR. MEOHP: Urine mono- (2-ethyl-5-oxohexyl) phthalate; MEHHP: Urine mono- (2-ethyl-5-hydroxyhexyl) phthalate; MECPP: Urine mono-2-ethyl-5-carboxypentyl phthalate; T2DM: type 2 diabetes mellitus; DEHP: Di-2-ethylhexyl phthalate.
Table 1. The clinical characteristic of 2017–2018 NHANES data according to T2DM status
Variables Non-T2DM T2DM P n 938 104 Age (years) 41.26 ± 20.67 60.38 ± 13.77 < 0.001 BMI (kg/m2) 27.66 ± 7.19 31.16 ± 7.22 < 0.001 WC (cm) 94.28 ± 17.23 107.24 ± 16.38 < 0.001 SBP (mmHg) 118.98 ± 17.42 129.65 ± 19.08 < 0.001 DBP (mmHg) 67.27 ± 12.11 68.10 ± 16.09 0.538 TC (mmol/L) 4.71 ± 1.06 4.55 ± 0.97 0.144 TG (mmol/L) 1.20 ± 0.82 1.64 ± 1.12 < 0.001 HDL (mmol/L) 1.40 ± 0.41 1.29 ± 0.33 0.007 LDL (mmol/L) 2.77 ± 0.94 2.53 ± 0.84 0.015 FPG (mmol/L) 5.49 ± 0.83 8.86 ± 3.47 < 0.001 Fins (pmol/L) 56.55 (36.90−91.14) 74.70 (47.13−126.00) 0.001 Cr (mg/dL) 134.26 ± 79.80 122.62 ± 62.13 0.151 Sex (male, %) 446 (47.5) 55 (52.9) 0.301 Race, n (%) Mexican American 130 (13.9) 20 (19.2) 0.281 Other Hispanic 82 (8.7) 8 (7.7) Non-Hispanic White 374 (39.9) 35 (33.7) Non-Hispanic Black 200 (21.9) 28 (26.9) Other Race 152 (16.2) 13 (12.5) Smoked status, n (%) Yes 205 (21.9) 41 (39.4) < 0.001 No 733 (78.1) 63 (60.6) Alcohol used, n (%) Yes 572 (61.0) 67 (64.4) 0.494 No 366 (39.0) 37 (35.6) Phthalates and plasticizers metabolites MECPP (ng/mL)* 2.37 ± 1.01 2.65 ± 0.78 0.001 MEHHP (ng/mL)* 1.82 ± 1.10 2.11 ± 0.87 0.002 MEOHP (ng/mL)* 1.42 ± 1.06 1.73 ± 0.79 < 0.001 ∑DEHP (ng/mL)* 3.06 ± 1.02 3.35 ± 0.78 0.001 MCNP (ng/mL)* 0.91 (0.26−1.67) 0.99 (0.47−1.78) 0.172 MCOP (ng/mL)* 3.00 ± 1.43 3.16 ± 1.30 0.274 MnBP (ng/mL)* 2.28 ± 1.09 2.36 ± 0.86 0.462 MC1P (ng/mL)* 0.64 (−0.22 to 1.55) 0.77 (0.09 to 1.64) 0.137 MEP (ng/mL)* 3.72 ± 1.50 3.76 ± 1.32 0.783 MiBP (ng/mL)* 2.09 ± 1.08 2.15 ± 1.04 0.614 MBzP (ng/mL)* 1.53 (0.58−2.42) 1.56 (0.88−2.56) 0.441 Note. *: The variable was transferred by ln. Continuous variables are expressed as mean ± SD, or M (P25, P75). BMI: body mass index; WC: waist circumference; SBP: systolic blood pressure; DBP: diastolic blood pressure; TC: total cholesterol; TG: triglyceride; HDL: high-density lipoprotein; LDL: Low-Density Lipoprotein; FPG: fasting plasma glucose; Fins: fasting insulin; Cr: creatinine; MBzP: Urine mono-benzyl phthalate; MEOHP: Urine mono- (2-ethyl-5-oxohexyl) phthalate; MiBP: Urine mono-isobutyl phthalate; MEHHP: Urine mono- (2-ethyl-5-hydroxyhexyl) phthalate; MEP: Urine monoethyl phthalate; MC1P: Urine Mono- (3-carboxypropyl) phthalate; MnBP: Urine mono-n-butyl phthalate; MECPP: Urine mono-2-ethyl-5-carboxypentyl phthalate; MCOP: Urine mono (carboxyisoctyl) phthalate; MCNP: Urine mono (carboxyisononyl) phthalate.  下载: 导出CSV
-
[1] da Silva Rosa SC, Nayak N, Caymo AM, et al. Mechanisms of muscle insulin resistance and the cross-talk with liver and adipose tissue. Physiol Rep, 2020; 8, e14607. [2] Yilmaz B, Terekeci H, Sandal S, et al. Endocrine disrupting chemicals: exposure, effects on human health, mechanism of action, models for testing and strategies for prevention. Rev Endocr Metab Disord, 2020; 21, 127−47. doi: 10.1007/s11154-019-09521-z [3] Hays SM, Aylward L, Blount BC. Variation in urinary flow rates according to demographic characteristics and body mass index in NHANES: potential confounding of associations between health outcomes and urinary biomarker concentrations. Environ Health Perspect, 2015; 123, 293−300. doi: 10.1289/ehp.1408944 [4] Li G, Zhao CY, Wu Q, et al. Integrated metabolomics and transcriptomics reveal di(2-ethylhexyl) phthalate-induced mitochondrial dysfunction and glucose metabolism disorder through oxidative stress in rat liver. Ecotoxicol Environ Saf, 2021; 228, 112988. doi: 10.1016/j.ecoenv.2021.112988 [5] Dales RE, Kauri LM, Cakmak S. The associations between phthalate exposure and insulin resistance, β-cell function and blood glucose control in a population-based sample. Sci Total Environ, 2018; 612, 1287−92. doi: 10.1016/j.scitotenv.2017.09.009 [6] Eveillard A, Lasserre F, de Tayrac M, et al. Identification of potential mechanisms of toxicity after di-(2-ethylhexyl)-phthalate (DEHP) adult exposure in the liver using a systems biology approach. Toxicol Appl Pharmacol, 2009; 236, 282−92. doi: 10.1016/j.taap.2009.02.008 [7] Svensson K, Hernández-Ramírez RU, Burguete-García A, et al. Phthalate exposure associated with self-reported diabetes among Mexican women. Environ Res, 2011; 111, 792−6. doi: 10.1016/j.envres.2011.05.015 [8] Xu Y, Tang GY, Zhang C, et al. Gallic acid and diabetes mellitus: its association with oxidative stress. Molecules, 2021; 26, 7115. doi: 10.3390/molecules26237115 [9] Yang G, Sun SX, He JX, et al. Enoyl-CoA hydratase/3-hydroxyacyl CoA dehydrogenase is essential for the production of DHA in zebrafish. J Lipid Res, 2023; 64, 100326. doi: 10.1016/j.jlr.2022.100326 [10] Lan X, Han J, Wang BX, et al. Integrated analysis of transcriptome profiling of lncRNAs and mRNAs in livers of type 2 diabetes mellitus. Physiol Genomics, 2022; 54, 86−97. doi: 10.1152/physiolgenomics.00105.2021 -
 23088+Supplementary Materials.pdf

-

 点击查看大图
计量
- 文章访问数: 549
- HTML全文浏览量: 249
- PDF下载量: 44
- 被引次数: 0

 Quick Links