

 下载:
下载:


-
In recent years, extended life expectancies and lifestyle changes have markedly contributed to the increased incidence of heart failure (HF) worldwide[1]. In China, while the age of patients with chronic HF has increased annually, the mortality rate has not decreased significantly[1]. Malnutrition, an issue for patients with HF, is associated with a worse prognosis because it can lead to disease progression attributable to loss of skeletal mass, a vicious cycle associated with cytokine activation, and cachexia[2]. Prealbumin (PA) and albumin levels are known to reflect the nutritional status of patients and are associated with a poor prognosis for patients with HF[3]. The half-life of PA is only 1.9 days, which is shorter than that of albumin[4]. In some patients with liver disease or poor nutrition, PA levels decrease while albumin levels remain normal. Previous studies have confirmed that N-terminal pro b-type brain natriuretic peptide (NT-proBNP) can reflect cardiac function in patients with HF and is significantly correlated with prognosis[5]. However, to treat such high-risk patients, practitioners tend to pay more attention to cardiac function improvement based on NT-proBNP levels and less attention to nutritional support.
In terms of study design, using propensity score matching (PSM) can effectively reduce confounding biases and is similar to randomized controlled trials. PSM has been shown to balance covariates between groups; thus, non-randomized controlled data can be evaluated for intervention effects[6]. In this study based on PSM, we aimed to assess whether PA was an effective prognostic indicator in patients with HF. We compared the predictive accuracy of PA with that of NT-proBNP to determine whether the use of PA could improve predictive accuracy in combination with NT-proBNP.
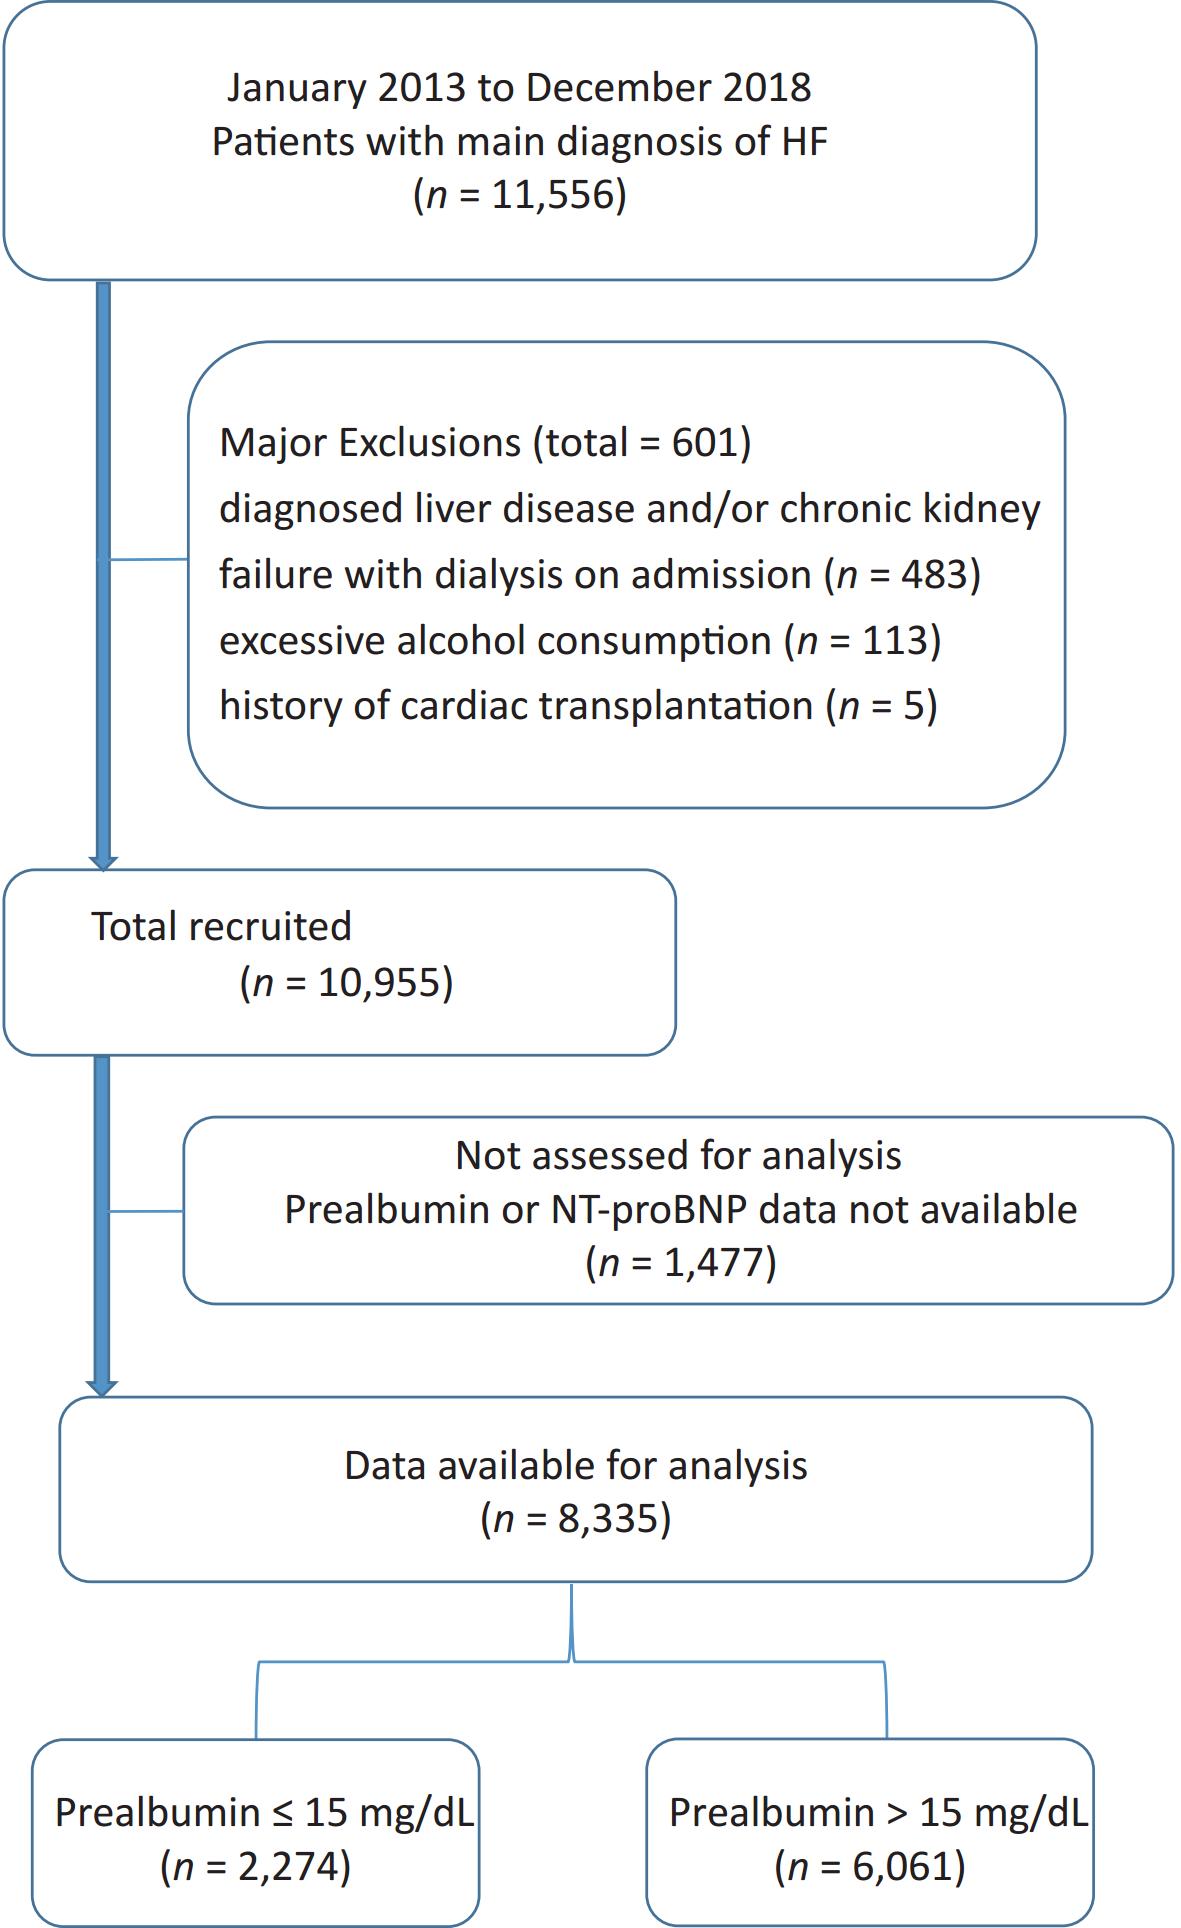
This study comprised 11,556 consecutive patients with HF (aged > 18 years) as their main diagnosis at the time of admission to the Shengjing Hospital of China Medical University between January 2013 and December 2018. Patient data included baseline characteristics and electronic data system hospitalization records. HF was defined based on modified Framingham criteria[7]. Fasting venous blood samples were collected from all patients between 06:00 h and 07:00 h on the second day of admission. PA was assayed using a particle-enhanced immunonephelometric assay on an automated analyzer (AU5800; Beckman Coulter Corp., USA). The concentrations of NT-proBNP were determined using a double-antibody sandwich enzyme-linked immunosorbent assay (ELISA) and an electrochemiluminescence analyzer (Cobas, e601, Roche, Switzerland). The estimated glomerular filtration rate (eGFR) was calculated using the following equation: 175 × SCr−1.154 × age−0.203 × 0.742 (if female). Left ventricular ejection fraction (LVEF) was determined using echocardiography and Simpson’s biplane method during the hospital stay (within the first three days of admission) or upon arrival at the emergency department. The primary endpoint was all-cause mortality during hospitalization. Exclusion criteria comprised a diagnosis of liver disease and/or chronic kidney failure requiring dialysis on admission, a history of cardiac transplantation or chronic alcoholism, and no available PA or NT-proBNP levels. In total, 8,335 study patients with HF were enrolled (Supplementary Figure S1, available in www.besjournal.com). This study complied with the principles of the Declaration of Helsinki and was approved by the Shengjing Hospital of the China Medical University Research Ethics Committee.
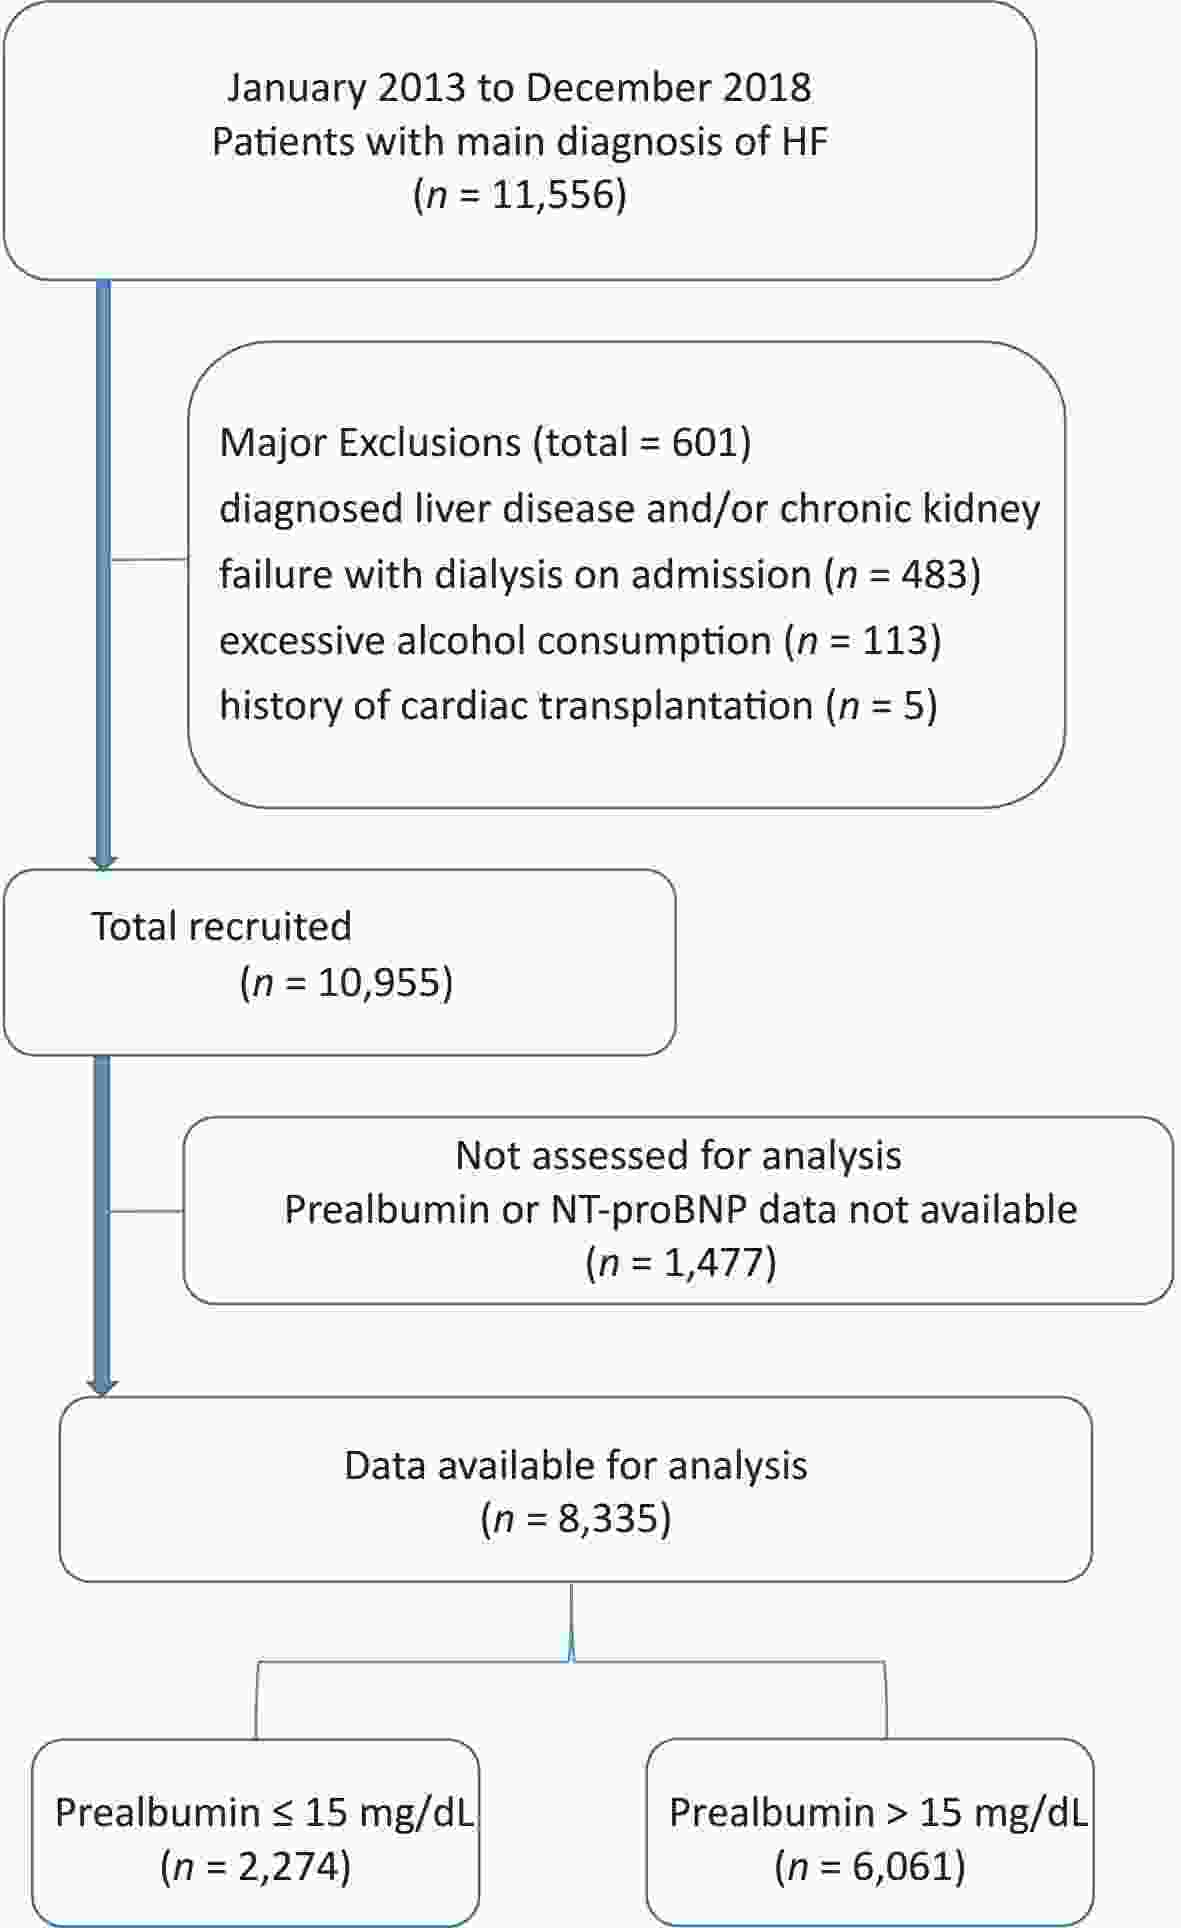
Figure S1. Flowchart of participant selection.
To reduce bias owing to imbalances in baseline characteristics dependent on the presence or absence of PA, we used PSM to assemble a matched and balanced cohort. Patients with a PA level ≤ 15.0 mg/dL (optimal cutoff value, largest Youden's index [sensitivity+ specificity-1]) and those with a PA level > 15 mg/dL were compared. We calculated the PA propensity score (PS) for each patient using a non-parsimonious multivariable logistic regression model. Propensity analysis was used to identify patients with similar probabilities of having a lower-level PA based on observed clinical characteristics. In our PS model, 24 baseline characteristics were used as covariates (Table 1). We computed the logit of the estimated PS for each patient to match patients in the different groups. We then used a greedy matching algorithm to match patients using a calipers set to a maximum width of 0.2 standard deviations (SDs) of the estimated PS. Standardized differences for all covariates were used to compare the balance of baseline covariates between the two groups before and after matching. A standardized difference of < 10% suggested inconsequential bias. Continuous variables were presented as mean ± SD or median (interquartile range), depending on whether they were normally distributed. Categorical variables were presented as counts and proportions (%). Logistic multivariate regression analysis was used to assess the prognostic relationship between PA and in-hospital mortality. PA was analyzed as both a categorical and continuous variable. Results are represented as odds ratios (ORs) with associated 95% confidence intervals (CIs). The prognostic potentials of PA, NT-proBNP, and PA+NT-proBNP were analyzed using the following methods. (1) MedCalc statistical software (version 18.1.1; MedCalc Software, Ltd., Belgium) was used to calculate the area under the curve (AUC) with relation to the primary end point through the receiver operating characteristic (ROC) curve. (2) We used category-free net reclassification improvement (NRI) and absolute integrated discrimination improvement (IDI) to examine improvement in the risk estimation efficiency of PA, NT-proBNP, and PA+NT-proBNP. Data analyses were conducted using Statistical Analysis Software (version 9.4; SAS Institute, Inc., Cary, North Carolina) and the level of statistical significance was defined as P < 0.05.
Table 1. Baseline characteristics of patients in the low and high prealbumin groups before and after propensity matching
General information Pre-match Propensity-matched* The overall
(n = 8,335)Prealbumin ≤ 15 mg/dL
(n = 2,274)Prealbumin
> 15 mg/dL
(n = 6,061)P-value Prealbumin
≤ 15 mg/dL
(n = 1,485)Prealbumin
> 15 mg/dL
(n = 1,485)Age (year) 68.4 (13.6) 71.5 (13.5) 67.3 (13.4) < 0.001 71.1 (13.4) 71.0 (13.2) Male [n (%)] 4,477 (53.7) 1,134 (49.9) 3,343 (55.2) < 0.001 749 (50.4) 717 (48.3) NYHA grading [n (%)] < 0.001 II 2,165 (26.0) 262 (11.5) 1,903 (31.4) 211 (14.2) 220 (14.8) III 3,506 (42.1) 954 (42.0) 2,552 (42.1) 639 (43.0) 634 (42.7) IV 2,664 (31.9) 1,058 (46.5) 1,606 (26.5) 635 (42.8) 631 (42.5) Admission HR (bpm) 87.1 (22.8) 91.3 (24.1) 85.5 (22.0) < 0.001 90.3 (24.0) 89.6 (24.2) Admission SPs (mmHg) 134.9 (22.2) 131.0 (22.2) 136.3 (21.9) < 0.001 133.6 (22.0) 132.5 (22.5) PA (mg/dL) 0.19 (0.07) 0.11 (0.03) 0.22 (0.05) < 0.001 12.2 (2.3) 19.9 (3.6) Albumin (g/L) 37.5 (4.4) 33.9 (4.2) 38.8 (3.7) < 0.001 35.5 (3.6) 35.6 (3.5) ALT (μ/L) 26.1 (11.9) 25.8 (11.6) 26.1 (11.9) 0.221 25.6 (10.6) 25.9 (12.8) TBIL (μmol/L) 15.9 (10.5) 19.6 (14.2) 14.6 (8.4) < 0.001 17.0 (10.6) 16.7 (11.5) LDL (mmol/L) 2.5 (0.9) 2.2 (0.8) 2.6 (0.9) < 0.001 2.3 (0.8) 2.4 (0.8) BUN (mmol/L) 7.7 (3.5) 8.5 (4.4) 7.3 (3.1) < 0.001 8.1 (4.0) 8.1 (3.6) eGFR
(mL·min-1 ·1.73 m-2)81.8 (27.3) 81.1 (31.1) 82.1 (25.8) 0.180 80.7 (28.6) 79.2 (28.0) UA (mmol/L) 430.1 (140.5) 441.8 (163.1) 425.7 (130.7) < 0.001 437.7 (157.9) 438.3 (138.9) Hgb (g/L) 130.0 (20.9) 121.6 (22.7) 133.1 (19.3) < 0.001 124.3 (20.5) 124.3 (21.3) Serum Na (mmol/L) 138.9 (3.8) 137.6 (4.5) 139.5 (3.3) < 0.001 138.4 (4.1) 138.5 (4.1) CRP (mg/dL) 15.6 (7.8) 18.4 (8.1) 13.2 (6.9) 0.005 25.4 (19.6) 26.1 (19.7) FBG (mmol/L) 6.5 (1.5) 6.4 (1.4) 6.5 (1.5) < 0.001 6.5 (1.4) 6.5 (1.6) HbA1c (%) 6.5 (1.2) 6.5 (1.3) 6.5 (1.2) 0.106 6.5 (1.3) 6.5 (1.3) cTNI
(ng/mL, M [P25, P75])0.03 (0.01, 0.14) 0.04 (0.02, 0.2) 0.03 (0.01, 0.11) < 0.001 0.04 (0.02, 0.18) 0.04 (0.01, 0.20) NT-proBNP
(pg/mL, M [P25, P75])3,934 (1,192, 4,362) 4,362 (2,792, 7,132) 2,978 (858, 4,361) < 0.001 4,362 (2,545, 5,724) 4,363 (1,910, 6,041) LVEF (%) 49.7 (11.7) 48.1 (11.7) 50.2 (11.7) < 0.001 48.4 (11.8) 48.3 (11.9) Accompanies [n (%)] CHD 5,217 (62.6) 1,329 (58.4) 3,888 (64.1) < 0.001 913 (61.5) 914 (61.5) Hypertension 4,984 (59.8) 1,152 (50.7) 3,832 (63.2) < 0.001 831 (56.0) 813 (54.7) AF 2,958 (35.4) 727 (31.9) 2,231 (36.8) < 0.001 482 (32.5) 461 (31.0) DM 2,503 (30.0) 661 (29.1) 1,842 (30.4) 0.240 454 (30.6) 447 (30.1) In-hospital mortality 193 (2.3) 124 (64.2) 69 (35.8) < 0.001 58 (3.9) 26 (1.8) Note. AF, atrial fibrillation; ALT, alanine transaminase; BUN, blood urea nitrogen; CHD, coronary heart disease; CRP, C-reactive protein; cTNI, cardiac troponin I; DM, diabetes mellitus; eGFR, estimated glomerular filtration rate; FBG, fasting blood glucose; Hgb, hemoglobin; HR, heart rate; LDL, low-density lipoprotein; LVEF, left ventricular ejection fraction; NT-proBNP, N-terminal pro brain natriuretic peptide; NYHA, New York Heart Association; SBP, systolic blood pressure; PA, prealbumin; TBIL, total bilirubin; UA, uric acid. *Differences among all groups were P > 0.05, except for prealbumin and in-hospital mortality group. The baseline clinical characteristics of the 8,335 patients (mean age, 68.4 years; males, 53.7%) are shown in Table 1. Patients in the lower PA group were older, disproportionately female, had a higher New York Heart Association (NYHA) grading, a higher heart rate on admission, lower systolic blood pressure on admission, and lower proportions of coronary heart disease, hypertension, and atrial fibrillation. The lower PA group also had higher total bilirubin, blood urea nitrogen, uric acid, cardiac troponin I, and NT-proBNP levels and lower albumin, low-density lipoprotein, eGFR, hemoglobin, serum sodium, and LVEF levels. PSM resulted in 1,485 matched patient pairs in the PA groups. The baseline characteristics for all patients (except for PA) showed P > 0.05, and PSM reduced the standardized difference for all variables to < 10% (Table 1).
Several studies have shown that albumin levels are associated with a poor prognosis for patients with HF, whether hospitalized or discharged. However, its long half-life makes it an insensitive indicator. Owing to the considerable challenges in treating patients with HF, a more sensitive indicator may be needed to determine their nutritional status. PA, also called transthyretin, with a half-life of 1.9 days, is mainly synthesized through the liver and excreted by the kidneys[4]. PA is directly correlated with dual-energy X-ray absorptiometry results and bioelectrical impedance analysis, which are gold standards for defining malnutrition. Malnutrition is common in patients with HF, varying in prevalence rates of 20%–70%[3] and is strongly associated with a poor prognosis in patients with HF. Masakazu et al.[8] investigated 166 patients with chronic heart failure and found that patients with anorexia were more likely to present with impaired functional capacity and higher all-cause mortality within two years. A multicenter registry study suggested that identifying malnourished patients at hospital discharge was helpful in predicting the long-term prognosis of older adult patients with HF and a preserved ejection fraction[9]. In our study, 193 (2.3%) patients died during hospitalization, and the outcome was poor in the lower PA group. The multivariate adjusted OR for all-cause in-hospital mortality was 0.443 (95% CI: 0.305–0.642, P < 0.001) for the category, and 0.92 (95% CI: 0.888–0.954, P < 0.001) for PA per mg/dL increase (Table 2). Logistic regression analysis showed similar results after PSM. In the multivariate model, the risk of in-hospital mortality was 0.438 (95% CI: 0.274–0.700, P < 0.001) and 0.905 (95% CI: 0.861–0.951, P < 0.001) when PA was treated as a categorical and continuous variable, respectively (Table 2).
Table 2. Effects of multiple variables on clinical outcomes in multivariate analysis
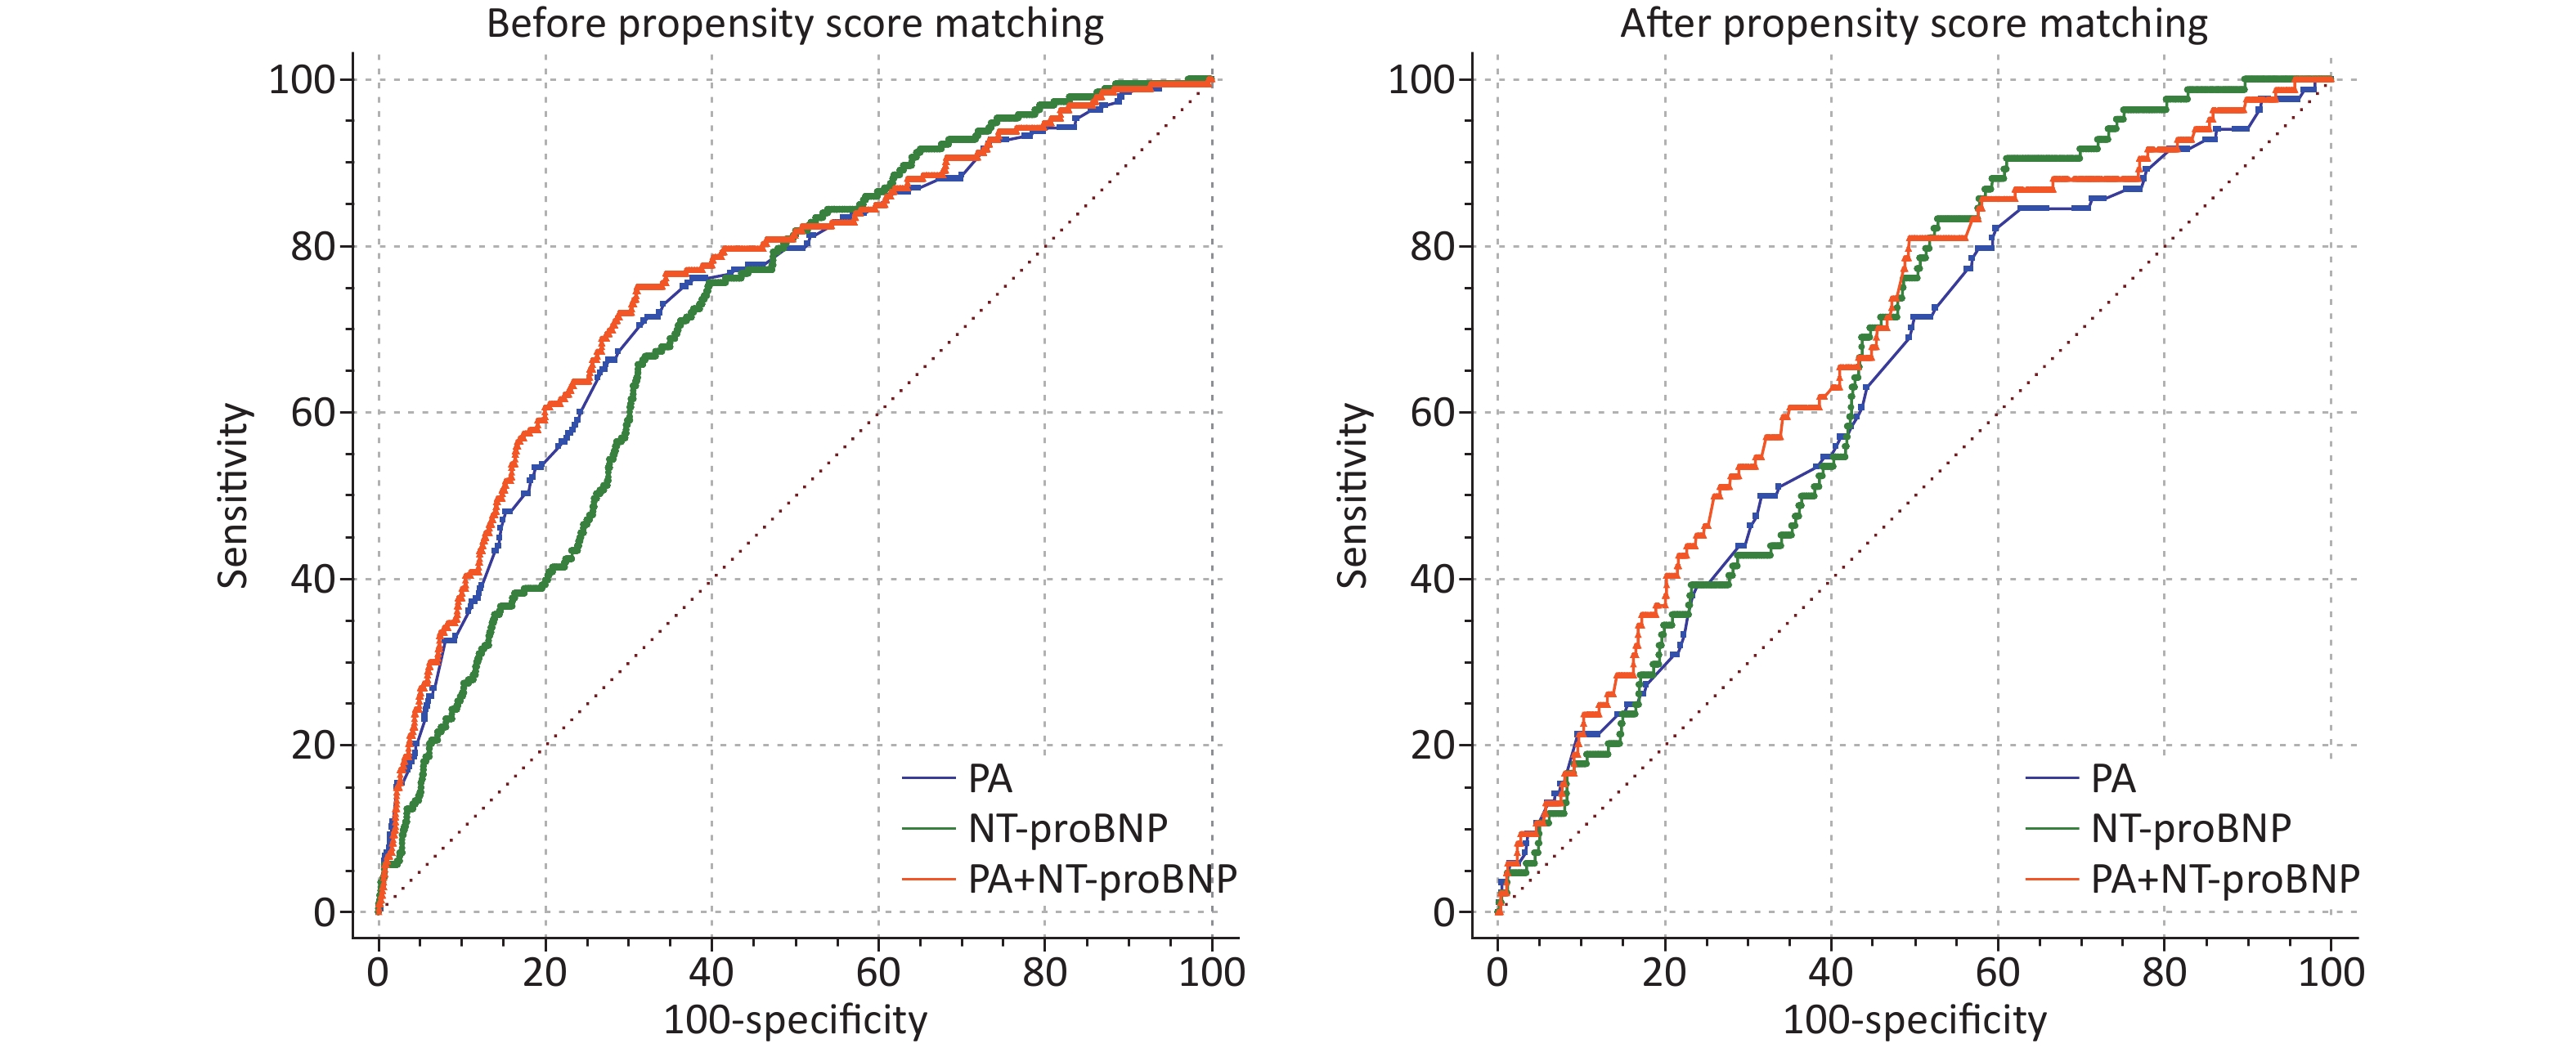
Variables Pre-match Propensity-matched OR 95% CI P-value OR 95% CI P-value NT-proBNP (100 pg/mL) 1.002 1.001–1.003 < 0.001 1.005 1.002–1.008 < 0.001 PA (1 mg/dL) 0.920 0.888–0.954 < 0.001 0.905 0.861–0.951 < 0.001 PA as a categories variable Low PA Reference − Reference − High PA 0.443 0.305–0.642 < 0.001 0.438 0.274–0.700 0.001 Note. CI, confidence interval; NT-proBNP, N-terminal pro brain natriuretic peptide; OR, odds ratio; PA, prealbumin. The pre- and post-match PSM ROC curves for PA, NT-proBNP, and PA+NT-proBNP were assessed using C-statistics (Supplementary Figure S2 and Supplementary Table S1, available in www.besjournal.com). NT-proBNP has been reported to be associated with adverse events in patients with HF, whether hospitalized or discharged[5]. The metabolic pathway of NT-proBNP involves the kidney, and its circulating concentration is affected through renal clearance. Renal dysfunction, which abnormally increases the concentration of NT-proBNP and limits its clinical utility, is prevalent in patients with HF[10]. PA had no such limitations and showed the same predictive accuracy for in-hospital mortality (C-statistic: Z = 1.148, P = 0.251). Furthermore, the novel model consisting of PA and NT-proBNP showed better performance than NT-proBNP alone (C-statistic: Z = 2.368, P = 0.018; IDI = 0.0176, P < 0.001; NRI = 0.6526, P < 0.001). The prognostic significance was not attenuated after PSM (C-statistic: Z = 2.521, P = 0.012; IDI = 0.0057, P < 0.001; NRI = 0.3645, P = 0.001) (Table 3, Supplementary Figure S2).
Table 3. Comparisons of the predictive performance of PA, PA +NT-proBNP, and NT-proBNP for the prognosis prediction
Variables z for C-statistic P for C-statistic NRI P for NRI IDI P for IDI Pre-match PA vs. NT-proBNP 1.148 0.251 − − − − PA+NT-proBNP vs. PA 3.903 < 0.001 0.2573 < 0.001 0.0060 0.007 PA+NT-proBNP vs. NT-proBNP 2.368 0.018 0.6526 < 0.001 0.0176 < 0.001 Propensity-matched PA vs. NT-proBNP 0.630 0.523 − − − − PA+NT-proBNP vs. PA 2.521 0.012 0.2603 0.019 0.0037 0.049 PA+NT-proBNP vs. NT-proBNP 0.538 0.591 0.3645 0.001 0.0057 < 0.001 Note. IDI, integrated discrimination improvement; PA, prealbumin; NRI, net reclassification improvement; NT-proBNP, N-terminal pro brain natriuretic peptide. 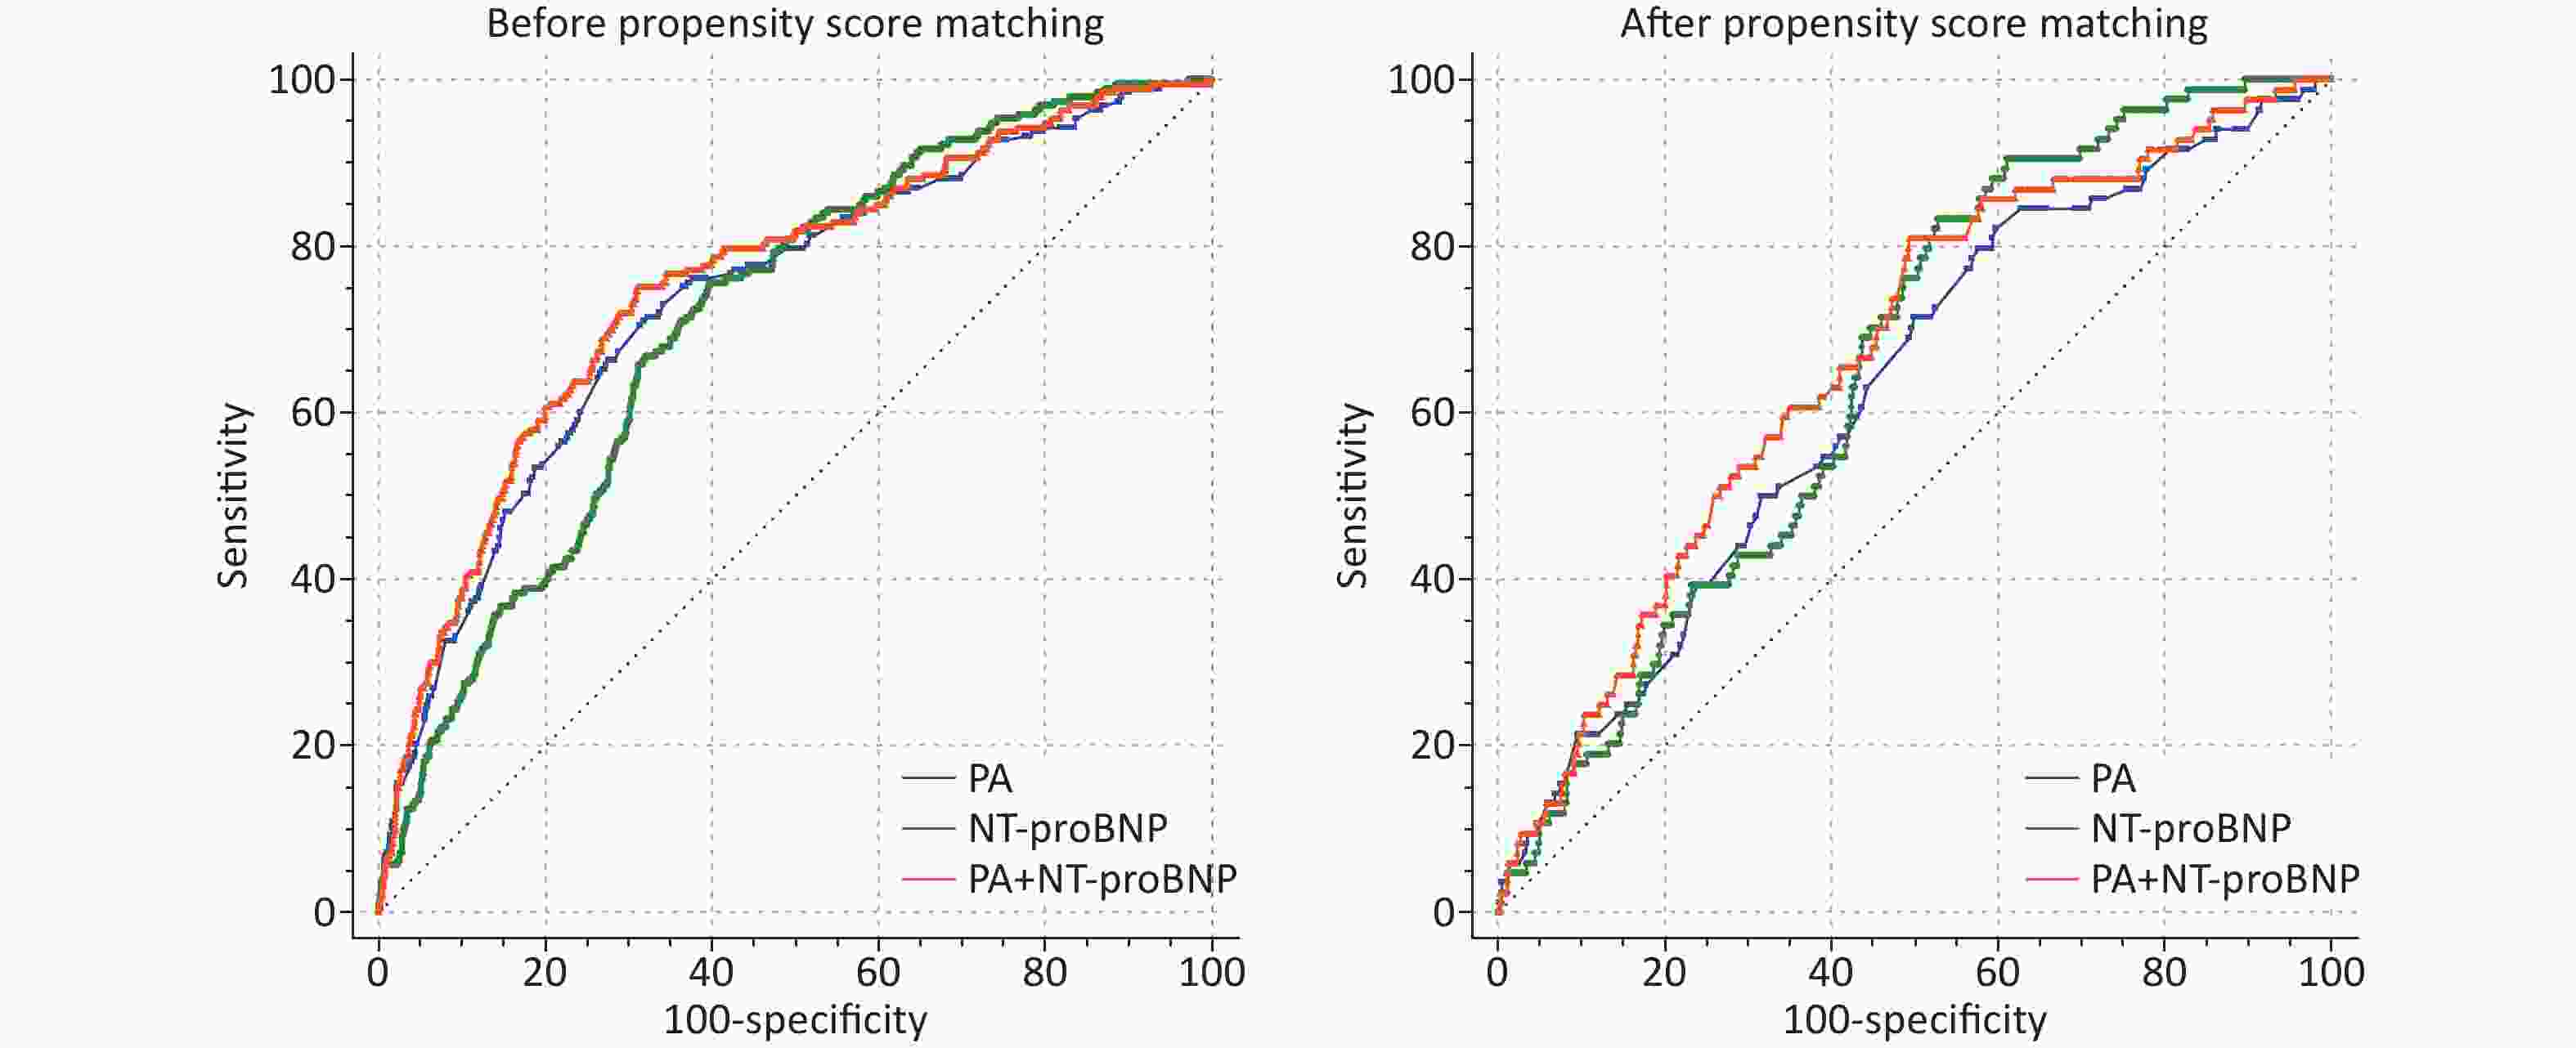
Figure S2. Receiver operating characteristic curves of PA, NT-proBNP and PA+ NT-proBNP for in-hospital mortality prediction.
Table S1. PA, PA+NT-proBNP and NT-proBNP performance for the prognosis prediction
Variables Pre-match Propensity-Matched C-statistic P value 95% CI C-statistic P value 95% CI PA 0.736 < 0.001 0.699–0.763 0.626 < 0.001 0.568–0.684 PA+NT-proBNP 0.756 < 0.001 0.720–0.792 0.667 < 0.001 0.612–0.723 NT-proBNP 0.710 < 0.001 0.677–0.743 0.651 < 0.001 0.603–0.700 While the pathophysiological association between malnutrition and HF requires further investigation, numerous mechanisms may underlie this association. A continuous vicious cycle of malnutrition, inflammation, and cachexia syndrome in patients with HF exacerbates disease progression[2]. Under conditions of malnutrition, skeletal muscle loss and cytokine activation eventually affect the body’s energy supply. This state of malnutrition represents the initiation and continuation of fat and fat-free mass loss. The result affects left ventricular function and produces a mismatch between protein and energy needs, affecting the heart’s energy supply until it is depleted. Therefore, the increase in PA in response to nutrition in the early acute phase in critically ill patients indicates that at least 65% of their nutritional needs are being met.
Despite the large sample size, this study had some limitations. First, we used PSM to eliminate confounding factors and selection bias; however, we did not include substantial real-world data. Second, PA data were obtained only at admission with no dynamic monitoring; therefore, we could not assess the extent of the PA increase in terms of improving patient prognosis. Finally, potential confounders likely remained despite including as many clinically relevant variables as possible in the multivariate analysis. Undernutrition in HF is multifactorial, and the chronic low-grade inflammatory state is considered to result from bowel wall edema because of hyperhydration and bacterial translocation. We only included C-reactive protein levels to represent inflammation and did not include indicators such as procalcitonin, which may have led to a selection bias.
The results obtained through PSM confirmed that PA is a potential prognosticator of in-hospital mortality in patients with HF. PA did not have a lower predictive performance than NT-proBNP. The addition of PA could enhance the predictive significance of NT-proBNP.
doi: 10.3967/bes2023.139
The Value of Prealbumin and its Combination with NT-proBNP for Predicting in-hospital Mortality in Patients with Heart Failure: Real-World Research Based on Propensity Score Matching
-
There was no conflict of interest.
注释:1) Conflict of Interest: -
S2. Receiver operating characteristic curves of PA, NT-proBNP and PA+ NT-proBNP for in-hospital mortality prediction.
Table 1. Baseline characteristics of patients in the low and high prealbumin groups before and after propensity matching
General information Pre-match Propensity-matched* The overall
(n = 8,335)Prealbumin ≤ 15 mg/dL
(n = 2,274)Prealbumin
> 15 mg/dL
(n = 6,061)P-value Prealbumin
≤ 15 mg/dL
(n = 1,485)Prealbumin
> 15 mg/dL
(n = 1,485)Age (year) 68.4 (13.6) 71.5 (13.5) 67.3 (13.4) < 0.001 71.1 (13.4) 71.0 (13.2) Male [n (%)] 4,477 (53.7) 1,134 (49.9) 3,343 (55.2) < 0.001 749 (50.4) 717 (48.3) NYHA grading [n (%)] < 0.001 II 2,165 (26.0) 262 (11.5) 1,903 (31.4) 211 (14.2) 220 (14.8) III 3,506 (42.1) 954 (42.0) 2,552 (42.1) 639 (43.0) 634 (42.7) IV 2,664 (31.9) 1,058 (46.5) 1,606 (26.5) 635 (42.8) 631 (42.5) Admission HR (bpm) 87.1 (22.8) 91.3 (24.1) 85.5 (22.0) < 0.001 90.3 (24.0) 89.6 (24.2) Admission SPs (mmHg) 134.9 (22.2) 131.0 (22.2) 136.3 (21.9) < 0.001 133.6 (22.0) 132.5 (22.5) PA (mg/dL) 0.19 (0.07) 0.11 (0.03) 0.22 (0.05) < 0.001 12.2 (2.3) 19.9 (3.6) Albumin (g/L) 37.5 (4.4) 33.9 (4.2) 38.8 (3.7) < 0.001 35.5 (3.6) 35.6 (3.5) ALT (μ/L) 26.1 (11.9) 25.8 (11.6) 26.1 (11.9) 0.221 25.6 (10.6) 25.9 (12.8) TBIL (μmol/L) 15.9 (10.5) 19.6 (14.2) 14.6 (8.4) < 0.001 17.0 (10.6) 16.7 (11.5) LDL (mmol/L) 2.5 (0.9) 2.2 (0.8) 2.6 (0.9) < 0.001 2.3 (0.8) 2.4 (0.8) BUN (mmol/L) 7.7 (3.5) 8.5 (4.4) 7.3 (3.1) < 0.001 8.1 (4.0) 8.1 (3.6) eGFR
(mL·min-1 ·1.73 m-2)81.8 (27.3) 81.1 (31.1) 82.1 (25.8) 0.180 80.7 (28.6) 79.2 (28.0) UA (mmol/L) 430.1 (140.5) 441.8 (163.1) 425.7 (130.7) < 0.001 437.7 (157.9) 438.3 (138.9) Hgb (g/L) 130.0 (20.9) 121.6 (22.7) 133.1 (19.3) < 0.001 124.3 (20.5) 124.3 (21.3) Serum Na (mmol/L) 138.9 (3.8) 137.6 (4.5) 139.5 (3.3) < 0.001 138.4 (4.1) 138.5 (4.1) CRP (mg/dL) 15.6 (7.8) 18.4 (8.1) 13.2 (6.9) 0.005 25.4 (19.6) 26.1 (19.7) FBG (mmol/L) 6.5 (1.5) 6.4 (1.4) 6.5 (1.5) < 0.001 6.5 (1.4) 6.5 (1.6) HbA1c (%) 6.5 (1.2) 6.5 (1.3) 6.5 (1.2) 0.106 6.5 (1.3) 6.5 (1.3) cTNI
(ng/mL, M [P25, P75])0.03 (0.01, 0.14) 0.04 (0.02, 0.2) 0.03 (0.01, 0.11) < 0.001 0.04 (0.02, 0.18) 0.04 (0.01, 0.20) NT-proBNP
(pg/mL, M [P25, P75])3,934 (1,192, 4,362) 4,362 (2,792, 7,132) 2,978 (858, 4,361) < 0.001 4,362 (2,545, 5,724) 4,363 (1,910, 6,041) LVEF (%) 49.7 (11.7) 48.1 (11.7) 50.2 (11.7) < 0.001 48.4 (11.8) 48.3 (11.9) Accompanies [n (%)] CHD 5,217 (62.6) 1,329 (58.4) 3,888 (64.1) < 0.001 913 (61.5) 914 (61.5) Hypertension 4,984 (59.8) 1,152 (50.7) 3,832 (63.2) < 0.001 831 (56.0) 813 (54.7) AF 2,958 (35.4) 727 (31.9) 2,231 (36.8) < 0.001 482 (32.5) 461 (31.0) DM 2,503 (30.0) 661 (29.1) 1,842 (30.4) 0.240 454 (30.6) 447 (30.1) In-hospital mortality 193 (2.3) 124 (64.2) 69 (35.8) < 0.001 58 (3.9) 26 (1.8) Note. AF, atrial fibrillation; ALT, alanine transaminase; BUN, blood urea nitrogen; CHD, coronary heart disease; CRP, C-reactive protein; cTNI, cardiac troponin I; DM, diabetes mellitus; eGFR, estimated glomerular filtration rate; FBG, fasting blood glucose; Hgb, hemoglobin; HR, heart rate; LDL, low-density lipoprotein; LVEF, left ventricular ejection fraction; NT-proBNP, N-terminal pro brain natriuretic peptide; NYHA, New York Heart Association; SBP, systolic blood pressure; PA, prealbumin; TBIL, total bilirubin; UA, uric acid. *Differences among all groups were P > 0.05, except for prealbumin and in-hospital mortality group.  下载: 导出CSV
Table 2. Effects of multiple variables on clinical outcomes in multivariate analysis
Variables Pre-match Propensity-matched OR 95% CI P-value OR 95% CI P-value NT-proBNP (100 pg/mL) 1.002 1.001–1.003 < 0.001 1.005 1.002–1.008 < 0.001 PA (1 mg/dL) 0.920 0.888–0.954 < 0.001 0.905 0.861–0.951 < 0.001 PA as a categories variable Low PA Reference − Reference − High PA 0.443 0.305–0.642 < 0.001 0.438 0.274–0.700 0.001 Note. CI, confidence interval; NT-proBNP, N-terminal pro brain natriuretic peptide; OR, odds ratio; PA, prealbumin.
下载: 导出CSV
Table 3. Comparisons of the predictive performance of PA, PA +NT-proBNP, and NT-proBNP for the prognosis prediction
Variables z for C-statistic P for C-statistic NRI P for NRI IDI P for IDI Pre-match PA vs. NT-proBNP 1.148 0.251 − − − − PA+NT-proBNP vs. PA 3.903 < 0.001 0.2573 < 0.001 0.0060 0.007 PA+NT-proBNP vs. NT-proBNP 2.368 0.018 0.6526 < 0.001 0.0176 < 0.001 Propensity-matched PA vs. NT-proBNP 0.630 0.523 − − − − PA+NT-proBNP vs. PA 2.521 0.012 0.2603 0.019 0.0037 0.049 PA+NT-proBNP vs. NT-proBNP 0.538 0.591 0.3645 0.001 0.0057 < 0.001 Note. IDI, integrated discrimination improvement; PA, prealbumin; NRI, net reclassification improvement; NT-proBNP, N-terminal pro brain natriuretic peptide.
下载: 导出CSV
S1. PA, PA+NT-proBNP and NT-proBNP performance for the prognosis prediction
Variables Pre-match Propensity-Matched C-statistic P value 95% CI C-statistic P value 95% CI PA 0.736 < 0.001 0.699–0.763 0.626 < 0.001 0.568–0.684 PA+NT-proBNP 0.756 < 0.001 0.720–0.792 0.667 < 0.001 0.612–0.723 NT-proBNP 0.710 < 0.001 0.677–0.743 0.651 < 0.001 0.603–0.700
下载: 导出CSV
-
[1] Ma LY, Chen WW, Gao RL, et al. China cardiovascular diseases report 2018: an updated summary. J Geriatr Cardiol, 2020; 17, 1−8. [2] Springer J, Springer JI, Anker SD. Muscle wasting and sarcopenia in heart failure and beyond: update 2017. ESC Heart Fail, 2017; 4, 492−8. doi: 10.1002/ehf2.12237 [3] Lourenço P, Silva S, Friões F, et al. Low prealbumin is strongly associated with adverse outcome in heart failure. Heart, 2014; 100, 1780−5. doi: 10.1136/heartjnl-2014-305747 [4] Ingenbleek Y, Young V. Transthyretin (prealbumin) in health and disease: nutritional implications. Annu Rev Nutr, 1994; 14, 495−533. doi: 10.1146/annurev.nu.14.070194.002431 [5] Aimo A, Januzzi Jr JL, Mueller C, et al. Admission high-sensitivity troponin T and NT-proBNP for outcome prediction in acute heart failure. Int J Cardiol, 2019; 293, 137−42. doi: 10.1016/j.ijcard.2019.06.005 [6] Savarese G, Dahlström U, Vasko P, et al. Association between renin-angiotensin system inhibitor use and mortality/morbidity in elderly patients with heart failure with reduced ejection fraction: a prospective propensity score-matched cohort study. Eur Heart J, 2018; 39, 4257−65. doi: 10.1093/eurheartj/ehy621 [7] McKee PA, Castelli WP, McNamara PM, et al. The natural history of congestive heart failure: the Framingham study. N Engl J Med, 1971; 285, 1441−6. doi: 10.1056/NEJM197112232852601 [8] Saitoh M, Dos Santos MR, Emami A, et al. Anorexia, functional capacity, and clinical outcome in patients with chronic heart failure: results from the Studies Investigating Co-morbidities Aggravating Heart Failure (SICA-HF). ESC Heart Fail, 2017; 4, 448−57. doi: 10.1002/ehf2.12209 [9] Nishi I, Seo Y, Hamada-Harimura Y, et al. Geriatric nutritional risk index predicts all-cause deaths in heart failure with preserved ejection fraction. ESC Heart Fail, 2019; 6, 396−405. doi: 10.1002/ehf2.12405 [10] Zoair AM, Abdel-Hafez MA, Mawlana W, et al. Serum levels of N- terminal-pro B-type natriuretic peptide as a diagnostic marker for left ventricular dysfunction in children with end-stage renal disease on hemodialysis. Saudi J Kidney Dis Transpl, 2016; 27, 1114−22. doi: 10.4103/1319-2442.194593 -
 23161+Supplementary Materials.pdf

-

 点击查看大图
计量
- 文章访问数: 134
- HTML全文浏览量: 60
- PDF下载量: 22
- 被引次数: 0

 Quick Links