


HTML
-
In China, cardiovascular diseases (CVD) have become the leading cause of deaths for the past decades. In 2013, 40.7% of deaths were linked to CVD. Although the overall age-standardized mortality rate of CVD declined by over 20% from 1990 to 2013, the age-standardized mortality rate for ischemic stroke significantly increased by 28.8%, and that for ischemic heart disease remained the same[1]. In the recent decades, the prevalence of many CVD-related risk factors has been increasing rapidly. Several studies have examined these factors, such as high energy intake from dietary fat[2], physical inactivity[3], obesity[4-5], hypertension[5-7], diabetes mellitus[5, 8-9], and dyslipidemia[10-11]. The prevalence of other risk factors, such as smoking[12] and high sodium intake[13], remained consistent. At these risk levels, population growth alone may increase the prevalence of cardiovascular events by 50% per year between 2010 and 2030[14].
Population-based strategies on CVD risk assessment play an important role in CVD prevention and control. The National Cholesterol Education Program (NCEP) Adult Treatment Panel Ⅲ (ATP Ⅲ) recommends the use of Framingham risk scoring (FRS), which is derived from an update of the Framingham database and methodology reported by Wilson et al., [15] to determine the 10-year coronary heart disease (CHD) risk. This risk assessment tool is often used to assess the 10-year CHD risk. However, a previous study found that FRS might overestimate the CHD risk among the Chinese population[16]. Additionally, FRS cannot predict the 10-year rish for stroke, which is the predominant CVD in China. Wu et al.[17] developed sex-specific optimal 10-year risk prediction models for ischemic cardiovascular disease (ICVD, including ischemic stroke and coronary events) that are suitable for the Chinese population. The models were modified and recommended by the Chinese Guidelines for Prevention of Cardiovascular Disease to help health professionals predict the combined CHD and ischemic stroke risks (Chinese model). In 2013, the American College of Cardiology and American Heart Association (ACC/AHA) published a new guideline on the assessment of cardiovascular risk. The guideline recommends that assessments in determining the 10-year atherosclerotic cardiovascular disease (ASCVD) risk can be performed using pooled cohort equations (PCEs)[18]. These new equations are aimed at estimating the 10-year risk of all hard ASCVD, including nonfatal myocardial infraction (MI), CHD-related death, or nonfatal and fatal stroke, and are applicable for African-American and non-Hispanic white men and women aged 40-79 years. Previous studies have shown that the FRS and NCEP/ATP Ⅲ guidelines have been adopted worldwide. The new ACC/AHA guidelines may influence the global treatment and prevention strategies as well. However, researchers have shown concerns about the accuracy of the PCEs in determining ASCVD events, especially in contemporary and ethnically diverse populations[19]. Furthermore, the distribution patterns of the 10-year ASCVD risk estimates in other populations, such as among Chinese, remains unknown. The examination of the predicted ASCVD risk can result in better prevention and control of ASCVD in the years to come.
In this study, we investigated the distribution of the predicted 10-year ASCVD risk among adults in China using PCEs. Subsequently, we compared the difference between the predicted ASCVD risk and ICVD risk, which was calculated through the Chinese model using data from the 2010 China Chronic Disease and Risk Factor Surveillance (CCDRFS).
-
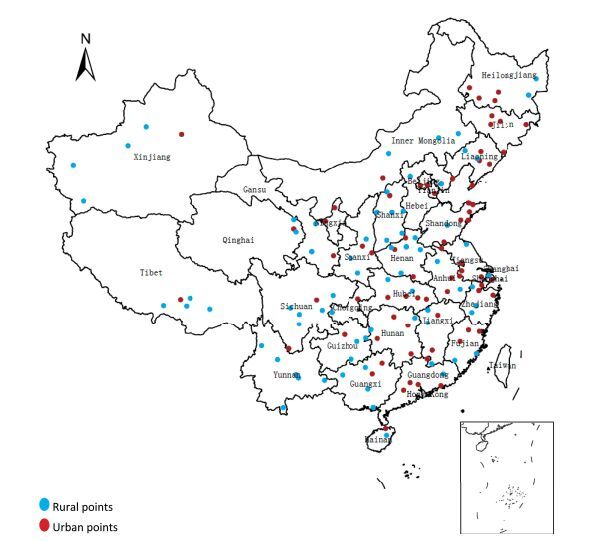
This surveillance was conducted by the Chinese Center for Disease Control and Prevention (China CDC) based on the disease surveillance points (DSPs) system covering 161 districts/counties in the whole country, with the 2010 CCDRFS serving as the database. The establishment, history, and representativeness degree of the DSPs are explained elsewhere[20]. Figure 1 shows the national geographical distribution of DSPs.
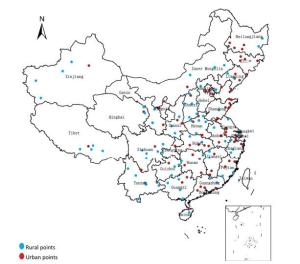
Figure 1. Geographical distribution of the disease surveillance point (DSP) system in China
The CCDRFS is an ongoing population-based, cross-sectional study that is conducted once every 3 years since 2004. The CCDRFS aims to monitor trends in major chronic diseases and their related risk factors. Furthermore, the CCDRFS uses a multistage clustered random sampling method to identify a nationally representative and population-based sample. People who have lived at their current address for 6 months or longer within the previous 12 months are eligible to participate in the survey[9]. In 2010, 109, 023 people were selected from the DSPs, of whom 98, 658 participated in the survey. The overall response rate was 90.5% (replacement rate: 9.3%). The PCEs and Chinese model were proposed for people aged 40-79 and 35 years and above, respectively. Consequently, considering the purposes of ASCVD risk prediction and comparison of two risk assessment methods, we excluded individuals who were younger than 40 years or older than 79 years. We also excluded those with stroke or MI histories and missing risk factor information. Our final sample included 27, 837 men and 33, 704 women (total N = 61, 541). The Ethical Review Committee of China CDC approved the study protocol. Written informed consent was obtained from all study participants.
-
The serum total cholesterol (TC), low-density lipoprotein cholesterol (LDL-C), and high-density lipoprotein cholesterol (HDL-C) concentrations of the participants were measured using an auto analyzer (ARCHITECT ci16200, Abbott Laboratories, Abbott Park, Illinois, USA). Three blood pressure readings per participant were obtained by a trained interviewee using a calibrated automatic electronic device (Omron HEM-7071, Omron Co., Kyoto, Japan) in a separate examination room after at least a 5 min rest. The average of the second and third systolic blood pressure (SBP) and diastolic blood pressure (DBP) readings was used in our analysis. Participants with self-reported hypertension were asked whether they were currently taking an antihypertensive medication. Those without a self-reported history of diabetes mellitus were given a standard 75 g glucose solution, and the plasma glucose was measured at 0 and 2 h after administration during the oral glucose tolerance test. The plasma glucose was locally measured using glucose oxidase or hexokinase methods within 24 h in local laboratories. All study laboratories successfully completed the standardization and certification program. Diabetes mellitus was defined as follows based on the 1999 World Health Organization criteria[21]: (1) a self-reported previous diagnosis by health care professionals, (2) ≥ 7.0 mol/L fasting plasma glucose level, (3) ≥ 11.1 mol/L 2 h plasma glucose level. The body weight and height were measured based on a standard protocol, and the body mass index (BMI) was calculated as the weight in kilograms divided by the square of height in meters. To determine the presence of ASCVD and ICVD, data on myocardial infarction and stroke histories were derived using an individual questionnaire. Other sociodemographic data, including age, sex, smoking status, drinking status, and physical activity level were obtained based on the participants' answers from the individual questionnaire.
-
The age-and sex-specific groups in our analysis include men and women aged 40-49, 50-59, 60-69, and 70-79 years. The educational levels of the participants were divided into the following: below primary school, primary school graduate, junior school graduate, and senior school graduate or above. Each of the 161 study sites was categorized as either underdeveloped, intermediately developed, or developed economic zones based on the 2009 per capita gross domestic product. Participants were considered as current smokers if they reported that they were smoking currently and regular drinkers if they reported that they drank alcohol at least 5 days per week. The Global Physical Activity Questionnaire was used to assess the physical activity, with the participants subsequently categorized as either 'active, ' 'moderately active, ' or 'inactive'[22].
-
We calculated the 10-year ASCVD risk of each individual based on the age, SBP, antihypertensive medication use, TC and HDL-C levels, current smoking status, and diabetes mellitus history using the sex-specific parameters from PCEs. ASCVD events were defined as nonfatal myocardial infarction, CHD death, or fatal or nonfatal stroke. The 10-year fatal or nonfatal ICVD risk was calculated using the simplified scoring tables, which were developed by Wu et al.[17] and revised and recommended by the Chinese Guidelines for Prevention of Cardiovascular Disease[23]. These tables included age, sex, SBP, TC level, diabetes mellitus history, and current smoking status. ICVD events were defined as CHD events and ischemic stroke. The recommended 7.5%, 10%, and 20% risk thresholds were used for the categorization of ASCVD risks. The 10% and 20% risk thresholds were also utilized for the categorization of ASCVD risks while comparing the predicted risk distribution between the two assessment tools. Similarly, the 10% and 20% risk thresholds were also used for the categorization of ICVD risks. We calculated the risk using the weighted coefficients derived from the 2010 China population census data and the sampling scheme of the current survey so that the estimates were representative of the national population aged 40-79 years[24]. The complex sampling design was taken into account in the estimation of confidence intervals. The differences in the risk scores between groups were estimated using analysis of variance. Furthermore, the differences in the risk stratum distribution between groups were assessed using the Rao-scott chi-square test. A two-tailed probability value of < 0.05 was considered statistical significant. To account for the complex sampling design, all statistical analyses were conducted using SAS software, version 9.4 (SAS Institute Inc., Cary, North Carolina, USA).
Study Population
Variables Included in the 10-year ASCVD and ICVD Risk Estimation
Population Groups
Statistical Analysis
-
Table 1 shows the risk factors included in the 10-year ASCVD or ICVD risk estimation and those that were not included but considered as important risk factors for ASCVD. Men had lower TC, HDL-C, and LDL-C concentrations and higher DBP than women. Moreover, men were more likely to smoke, drink, have diabetes mellitus, and be physically inactive and less likely to take hypertensive medications than women.
Characteristics Men (N = 27, 837; weighted N = 263, 166, 099)b Women (N = 33, 704; weighted N= 256, 992, 553)b P Value Risk factors used to estimate ASCVD or ICVD risk Age, y 53.7 (53.3, 54.1) 53.9 (53.4, 54.3) 0.325 SBP (mmHg) 138.0 (137.0, 139.0) 137.8 (136.5, 139.0) 0.451 TC (mg/dL) 163.6 (160.9, 166.3) 166.7 (163.8, 169.6) < 0.001 HDL-C (mg/dL) 42.5 (41.6, 43.3) 44.2 (43.4, 45.0) < 0.001 < 40 mg/dL HDL-C, % 47.5 (44.7, 50.3) 38.4 (35.6, 41.3) < 0.001 BMI (kg/m2) 24.1 (23.9, 24.2) 24.5 (24.3, 24.6) < 0.001 Current smokers, % 56.0 (54.2, 57.8) 3.2 (2.5, 4.0) < 0.001 Diabetes mellitus, % 14.5 (13.5, 15.5) 12.9 (12.2, 13.6) < 0.001 Hypertension treatment, % 13.9 (13.0, 14.8) 17.4 (16.4, 18.4) < 0.001 Risk factors not used to estimate CVD risk DBP (mmHg) 83.9 (83.3, 84.5) 82.8 (82.3, 83.3) < 0.001 LDL-C (mg/dL) 92.7 (91, 94.4) 94.1 (92.1, 96.1) 0.002 Waist circumference (cm) 83.4 (82.8, 84.0) 80.8 (80.2, 81.3) < 0.001 Triglycerides (mg/dL) 60.0 (58.2, 61.8) 54.7 (53.3, 56.1) < 0.001 Regular drinkers, % 23.4 (10.7, 13.0) 2.2 (1.7, 2.7) < 0.001 Physically inactive, % 18.2 (16.5, 19.9) 13.5 (11.5, 15.6) < 0.001 Note. Abbreviations: ASCVD, atherosclerotic cardiovascular disease; ICVD, ischemic cardiovascular disease; SBP, systolic blood pressure; TC, total cholesterol; HDL-C, high-density lipoprotein cholesterol; LDL-C, low-density lipoprotein cholesterol; BMI, body mass index. aSelf-reported ASCVD, including stroke and myocardial infraction. bContinuous variables and categorical values are presented as mean [95% confidence intervals (CIs)] and percentage [95% confidence intervals (CIs)], respectively. All analyses were weighted, and the complex sampling design was taken into account upon CI estimation. Table 1. Descriptive Information on the Risk Factors for Cardiovascular Disease among Chinese Adults Aged 40-79 Years without Self-reported ASCVDa
-
The average 10-year ASCVD risk among adults aged 40-79 years and without self-reported stroke or MI was 12.6%. The average ASCVD risk increased with age but decreased with the educational level and physical activity. Furthermore, the average ASCVD risk was higher in men, smokers, and drinkers than in their counterparts. The risks were similar between residents living in urban and rural areas and those residing in different economic development zones (Table 2).
Characteristics Sample Number 10-year ASCVD Risk Mean, 95% CIsb P Value Total 61, 541 12.6 (12.1, 13) Age, y < 0.001 40-49 24, 038 4.2 (4.0, 4.3) 50-59 19, 970 9.8 (9.5, 10.0) 60-69 12, 044 20.6 (20.2, 21.1) 70-79 5, 489 41.4 (40.7, 42.1) Sex < 0.001 Male 27, 837 15.1 (14.7, 15.6) Female 33, 704 10.0 (9.4, 10.5) Residence 0.665 Urban 24, 493 12.7 (12.1, 13.3) Rural 37, 048 12.5 (11.9, 13.1) Educational level < 0.001 Below primary school 18, 748 17.2 (16.5, 17.9) Primary school graduate 13, 251 12.7 (12.1, 13.2) Junior school graduate 17, 463 9.8 (9.4, 10.2) Senior school graduate and above 12, 079 9.7 (9.3, 10.2) Site's economic development zone 0.09 Undeveloped 17, 811 12.0 (11.0, 12.9) Intermediately developed 21, 481 12.5 (11.8, 13.1) Developed 22, 249 13.3 (12.5, 14.0) Smoking status < 0.001 Nonsmoker 44, 872 11.0 (10.5, 11.5) Smoker 16, 669 16.3 (15.8, 16.8) Alcohol drinking habit < 0.001 Nondrinker/occasional drinkers 54, 303 12.1 (11.7, 12.6) Regular drinkers 7, 238 15.5 (14.9, 16.1) Physical activity level < 0.001 Active 32, 585 10.7 (10.3, 11.2) Moderately active 16, 176 13.7 (13.1, 14.4) Inactive 12, 780 15.7 (14.9, 16.5) Note. Abbreviations: ASCVD, atherosclerotic cardiovascular disease; CIs, confidence intervals. aSelf-reported ASCVD, including stroke and myocardial infraction. bAll analyses were weighted, and the complex sampling design was taken into account upon CI estimation. Table 2. Weighted Estimates of 10-year ASCVD Risk Based on Selected Sociodemographic Characteristics among Chinese Adults Aged 40-79 Years without Self-Reported ASCVDa
-
A total of 47.4% adults had ≥ 7.5% 10-year ASCVD risk, which was higher in men than in women (data not shown in table). Among these adults, 8.3%, 18.6%, and 20.6% had 10-year ASCVD risks of 7.5%-9.9%, 10%-20%, and > 20%, respectively. The proportion of men in every risk stratum subgroup was higher than that of women. The proportion of adults with > 20% risk significantly increased after 60 years of age but decreased with advancing educational and physical activity levels.
By applying the age-specific proportions of participants in each risk stratum to the 2010 Chinese population aged 40-79 years, we estimated that a total of 247 million, 43 million, 97 million, and 107 million people had ≥ 7.5%, 7.5%-9.9%, 10%-20%, and > 20% 10-year ASCVD risks, respectively (Table 3).

Table 3. Distribution of 10-year ASCVD Risk Based on Selected Sociodemographic Characteristics among Chinese Adults Aged 40-79 Years without Self-reported ASCVD a
-
Table 4 presents the cross-tabulation of the risk strata using the 10-year ICVD and ASCVD risks. Overall, 66.5% of men and women were included in the same risk strata by the two assessment tools (60.5%, 0.9%, and 4.1% of the < 10%, 10%-20%, and > 20% risks, respectively), and 29.0% of the participants were overclassified with the PCEs. The percentage of women included in the same risk strata by both methods was higher than that of women. A total of 40.9% and 1.1% of men categorized using the Chinese model were overclassified and underclassified with the PCEs, respectively.
10-year ICVD Risk (Chinese model) 10-year ASCVD Risk (PCEs) < 10% (95% CIs) 10%-20% (95% CIs) > 20% (95% CIs) Men < 10% 49.4 (47.9, 50.8) 22.2 (21.7, 22.8) 12.9 (12.2, 13.6) 10%-20% 0.4 (0.3, 0.5) 1.3 (1.1, 1.5) 5.8 (5.3, 6.2) > 20% 0.1 (0.0, 0.1) 0.6 (0.4, 0.7) 7.4 (6.8, 7.9) Women < 10% 71.9 (70.3, 73.4) 12.5 (11.8, 13.1) 10.2 (9.5, 10.9) 10%-20% 0.0 (0.0, 0.0) 0.5 (0.4, 0.6) 4.3 (3.7, 4.8) > 20% - - 0.7 (0.5, 0.8) Men and women < 10% 60.5 (59.1, 61.9) 17.4 (16.9, 17.9) 11.6 (11.0, 12.2) 10%-20% 0.2 (0.1, 0.3) 0.9 (0.8, 1.0) 5.0 (4.6, 5.5) > 20% 0.0 (0.0, 0.1) 0.3 (0.2, 0.4) 4.1 (3.7, 4.4) Note. Abbreviations: CIs, confidence intervals. All analyses were weighted, and the complex sampling design was taken into account upon CI estimation. Table 4. Comparison of 10-year Risk Calculated Using PCEs and Chinese Model
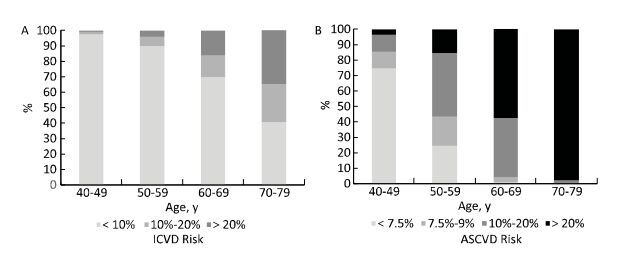
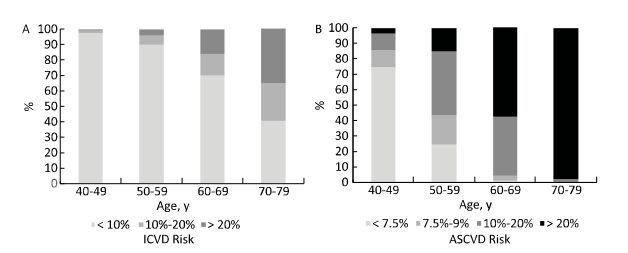
The difference between the two assessment tools was more apparent in men than in women. The risk stratum distribution derived from the two assessment tools was similar only in women aged 40-49 years. Based on the PCEs, more than 90% of men and women aged 70-79 years and more than 50% and 20% of men and women aged 60-69 years, respectively, had a > 20% 10-year ASCVD risk. However, among the same age groups, less than 40% and 10% of men and women aged 70-79 years, respectively, had a > 20% 10-year ICVD risk and less than 20% and 5% of men and women aged 60-69 years, respectively, had a 10%-20% 10-year ICVD risk (Figures 2 and 3). Furthermore, 27.0% of women categorized using the Chinese model were overclassified with the PCEs, but almost none were underclassified.
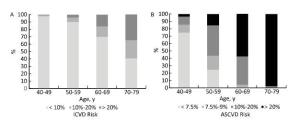
Figure 2. Age-specific distribution of 10-year ICVD and ASCVD risks in Chinese men aged 40-79 years without self-reported ASCVD
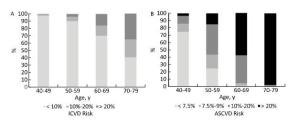
Figure 3. Age-specific distribution of 10-year ICVD and ASCVD risks in Chinese women aged 40-79 years without self-reported ASCVD
Profiles of Cardiovascular Disease-related Risk Factors among Chinese Adults
Average Risk Level for ASCVD
Distribution of 10-year ASCVD Risk
Comparison of the Distribution of ASCVD Risk Calculated Using PCEs and ICVD Risk Calculated Using the Chinese Model
-
The results of our study could help to better define the distribution of 10-year ASCVD risk among Chinese adults without ASCVD. This study is the first to use PCEs in the assessment of the 10-year ASCVD risk and compare the differences in the predicted CVD risks between the PCEs and Chinese ICVD risk prediction model among Chinese population using a nationally representative sample.
The average likelihood that Chinese adults will have ASCVD (12.6%) was classified under the intermediate-density risk category based on the PCEs. Overall, 20.6%, 18.6%, and 8.3% of the participants had > 20%, 10%-20%, and 7.5%-9.9% 10-year ASCVD risks, respectively, which were identified through PCEs. These findings indicate that approximately half of Chinese adults aged 40-79 years had moderate or high ASCVD risk. Few studies have provided estimates of the distribution of CVD risk among the population in China. Based on our previous study, about 8.5% of adults aged 35 and above in China had 10-year ICVD risk of over 10%[25]. Wu et al.[26] reported that 2.5% of Chinese adults aged 35-59 years had a ≥ 12.2% 10-year ICVD risk, which was lower than that observed in our study. We thought that the difference might be caused by the following: first, Wu et al. used simplified tools derived from the USA-People's Republic of China Collaborative Study of Cardiovascular Epidemiology Cohort and were proposed for people aged 35-59 years without ICVD. The Chinese model we used were based on the tools mentioned above but were revised and recommended for people aged 35 years old and above by the Chinese Guidelines for Prevention of Cardiovascular Disease. Some differences in the absolute risk values between the two tools were observed. Hence, an individual with the same risk score might be assigned different absolute risk values by the two tools. Second, all risk factors included in the prediction tools were more common in participants included in our study than in those of Wu et al.'s study.
The previous CVD guidelines in the USA, Europe, and China recommended statin treatment for primary CVD prevention along with risk evaluation and blood LDL-C concentration examination. The new ACC/AHA guideline indicated that statin treatment could be solely administered only when the 10-year ASCVD risk is > 7.5%. This new guideline resulted in a large 'treatment-recommended' group in our population. Based on our results, 47.4% of adults aged 40-79 years have ≥ 7.5% 10-year ASCVD risk, which means that these individuals may potentially receive statin treatment to prevent CVD development. This proportion was higher than that observed for the American[27] and Korean[28] populations. We believe the difference mentioned above was reasonable considering that the previous cohort study reported that the risk prediction models for the Western population might overestimate the CVD risk for the Chinese population[16].
The large difference in the risk distribution between the sexes observed in our analysis was consistent with that found among other ethnic populations by other studies[28-29]. Individuals who were less educated and smoke or drink regularly had higher 10-year ASCVD risk than their counterparts. Additionally, Chinese who were physically inactive had significantly higher risk than those who were active. Most risk equations, including the FRS, PCEs, and Chinese model, are based on a limited set of variables, such as age, smoking status, TC level, SBP, or hypertension treatment. The factors that were still not included were physical inactivity, sedentary lifestyle, triglyceride and homocysteine levels, air pollution exposure, and C-reactive protein concentrations[30-34]. We expect that more studies will focus on the relationship between these potential factors and CVD development. Moreover, additional risk factors might also be considered or incorporated in future prediction equations.
We found a significant difference in the distribution of the predicted 10-year risk by using two methods to assess the 10-year CVD risk among Chinese, especially among men and elderly individuals. Furthermore, the indicators included have different degree of importance to the two tools, and the HDL-C level and hypertension treatment were included in PCEs but not in the Chinese model. We believe that these two risk factors might affect the predicted risk, considering that we found more than one third of Chinese adults who had < 40 mg/dL HDL-C and only less than 20% of adults who had high blood pressure were taking antihypertensive medication. A past study also reported that 44.3% of Chinese adults aged 35 years were suffering from hypertension based on the hypertension diagnosis criterion, but only 17% of whom reported a previous hypertension diagnosis[35]. Hence, the CVD risk level among the Chinese population was supposed to increase based on the future risk models that were applicable for Chinese if the HDL-C level and hypertension treatment were included in the analysis.
Our study has several strengths. First, the distribution of 10-year ASCVD risk among Chinese adults was evaluated for the first time using PCEs, and the differences in the predicted CVD risks between the new PCEs and Chinese ICVD risk prediction model were also compared. Second, a nationally representative sample of participants selected from all 31 provinces, autonomous regions, and municipalities in China were included to better define the CVD risk profiles among Chinese adults. Age-sex poststratification adjustment in weight calculation was adopted to minimize the potential selection bias caused by the oversampling of older and female residents. A high response rate was achieved owing to the considerable efforts of the local investigating team. Additionally, a strict replacement regulation was stipulated for nonrespondents to ensure an adequate sample size and similar characteristics between the respondents and nonrespondents. Only a family who had a similar household structure to the originally sampled family could be chosen as a substitute. For example, if the nonrespondent was a middle-aged man, the respondent who will replace him should also be a middle-aged man and not a woman or elderly. Finally, the overall sample replacement rate was relatively small (9.3%). Therefore, the effect of the replacement method on the parameter estimations should be minimal.
Despite the strict, complex sampling design of our study and the wide geographical distribution of the study population, several limitations might affect the accuracy of our results. First, the evaluation of the 10-year CVD risk is usually conducted using prospective study design. Additionally, the use of cross-sectional design data during risk assessment was considered as a limitation. However, several studies have already evaluated the 10-year CHD or ASCVD risks among the American[27], Canadian[36], and Korean adults[28], which also provided valuable information in the development of CVD-related guidelines in their respective countries. Second, few participants who already have ASCVD except for stroke and myocardial infraction might be included in our analysis because only the histories of these diseases were collected. Third, smoking status was self-reported, which might underestimate the true smoking prevalence, especially among women. Such data may result in an underestimation of the proportion of population with middle or high 10-year ASCVD risk.
In conclusion, individuals who smoke, regularly drink, have low physical activity, and are less educated had higher 10-year ASCVD risk than their counterparts. Moreover, the 10-year ASCVD and ICVD risks predicted using the two assessment methods differed, especially among men and adults aged 50 years and above. Considering that the risk factor patterns and CVD profile have changed and the prevalence of ASCVD risk factors have increased significantly during the past years and because stroke is much more prevalent than CHD in China, further follow-up studies are necessary to establish more appropriate risk assessment methods for the prediction of ASCVD risk among the Chinese population.
-
Advisory Group KONG Ling Zhi, YANG Gong Huan, CHEN Yu De, LI Guang Wei, LI Ke Ji, ZHAO Dong, CHEN Jia Lun, PAN Chang Yu, ZENG Zheng Pei, NING Guang, MU Yi Ming, TENG Wei Ping, LIAO Er Yuan, ZHAO Jia Jun, WANG Wei Qing, GUO Xiao Hui, HONG Tian Pei, QIU Ming Cai, LI Cai Ping, SHAN Zhong Yan, LIU Zhi Min, GAO Xin, LIU Chao, CHEN Lu Lu, YAN Li, TONG Nan Wei, SHI Bing Yin, GE Jia Pu, XING Xiao Ping, LIU Jie, DENG Hua Cong, CHEN Biao, CHEN Chun Ming, CHEN Jun Shi, LI Hui, LIU Li Sheng, PENG Dan Tao, SHI Xiao Ming, WANG Wen Zhi, WANG Yong Jun, WU Zheng Lai.
Working Group ZHAO Wen Hua, NING Guang, BI Yu Fang, LAI Jian Qiang, JIANG Yong, WANG Li Min, DAI Meng, HU Nan, HUANG Zheng Jing, LI Jian Hong, LI Xiao Yan, LI Yi Chong, WANG Zhi Hui, ZHANG Mei, YIN Peng, XU Yu, ZHOU Wen Zhong, BAI Ya Min, CAI Xiao Ning, CAO Guo Ping, CHEN Xiao Rong, DONG Wen Lan, DUAN Lei Lei, FENG Ya Jing, HE Yuan, HUANG Yun, LI Mian, LI Bo Ren, MI Sheng Quan, SHI Xiao Qian, WANG Bao Hua, WANG Chun Xiao, WANG Tian Ge, WANG Yi Long, WANG Zhuo Qun, WU Hong Xi, XING Dan, YANG Jing, ZHAO Xing Quan, ZHENG Tao, YANG Jing Ren, ZHANG Di, WU Yu Bei.

 Quick Links
 DownLoad: