


HTML
-
Serum uric acid is the catabolic end-product of human purine nucleosides, which are mainly synthesized from hypoxanthine and xanthine. An increase in serum uric acid can lead to deposition of monosodium urate crystals in tissues, such as joints, soft tissues, and renal parenchyma, which cause gout, gouty tophi, and nephropathy[1].
The association between increased serum uric acid levels and cardiovascular disease (CVD) risk is controversial. It is unclear whether high serum uric acid level promotes or protects against the development of CVD, or if it simply acts as a passive marker of increased risk[2]. Serum uric acid levels differ in diabetics and non-diabetics, and decrease with an increased duration of diabetes[3, 4]. Moreover, previous studies have reported that elevated serum uric acid could be a risk factor for cardiometabolic diseases in patients with type 2 diabetes[5, 6]. However, the association between serum uric acid level and CVD risk in non-diabetic subjects remains controversial[7-10]. A meta-analysis showed that hyperuricemia may increase the risk for cardiovascular events, independently of traditional cardiovascular risk factors[11]. In contrast, the Framingham Heart Study did not find a significant association between serum uric acid level and CVD events and mortality when diabetes status was adjusted[12].
Gender difference exists between serum uric acid level and metabolic disorders. Serum uric acid levels in women tend to be lower than those in men, probably due to the uricosuric effect of estrogens[1]. Chou et al. reported that serum uric acid levels are more strongly associated with hyperinsulinemia and plasma glucose levels in women than in men[13]. Moreover, Tuttle et al. found that serum uric acid level is linearly related to coronary artery disease severity in women but no such relationship was observed in men[14].
The Dongfeng-Tongji Cohort study from China reported that that higher serum uric acid levels are independently associated with a dose-response increased risk of incident coronary heart disease[15]. However, sex-specific analysis and evaluation of cardiovascular risk score were not performed in this study. Thus, evidence on the gender difference and the association between serum uric acid levels and cardiovascular risks among Chinese non-diabetics is limited at present. We investigated the association between serum uric acid level and the risk of prevalent cardiometabolic diseases, the 10-year Framingham risk for coronary heart disease, and the 10-year risk for atherosclerotic cardiovascular diseases (ASCVD) in a large population of middle-aged and elderly Chinese adults without concurrent diabetes. The analysis was performed among men and women, respectively.
-
A population-based cross-sectional survey was conducted in Jiading district, Shanghai, China from March 2010 to August 2010. During the recruiting phase, a total of 10, 569 inhabitants aged ≥ 40 years in these 10 communities were invited by telephone or door-to-door visits to participate in this study. Among them, 10, 375 residents signed a consent form and agreed to take part in the study, with a participation rate of 98.2%. This protocol was approved by the Institutional Review Board of Ruijin Hospital affiliated with Shanghai Jiao Tong University School of Medicine[16]. All participants provided written informed consent. Individuals > 79 years (n = 260) and those missing uric acid, body mass index (BMI), blood glucose, blood pressure, and serum lipid (n = 49), or diabetes (n = 1, 814) information were excluded. Finally, 8, 252 participants were included in the current study.
-
Information about demographic characteristics, lifestyle, and medical histories was obtained from a standard questionnaire completed by trained investigators through face-to-face interviews[16]. Body weight, height, waist circumference, and blood pressure were measured by experienced nurses according to standard protocols. Smoking and drinking status was defined as 'current' if a subject had smoked cigarettes or consumed alcohol regularly in the past 6 months[17]. Physical activity at leisure time was estimated using the short form of the International Physical Activity Questionnaire. Physical activity was classified as active (highest quartile) or inactive (all others)[17]. Information on CVDs was collected using an interviewer-assisted questionnaire. The question was open-ended: 'Has a doctor or other health professional ever told you that you have coronary heart disease, stroke, or myocardial infarction'. We grouped the CVDs (reported coronary heart disease, stroke, or myocardial infarction) in the analysis. The medical records from the relevant hospitalizations were reviewed by two physicians, who were blinded to the self-reported data, and classified the cases as definite, questionable, or misdiagnosed. Coronary heart disease was identified by hospitalization or an emergency department visit requiring treatment, and this information was verified by two physicians. The criteria for myocardial infarction included information about ischemic chest pain, cardiac enzymes, and electrocardiogram. Myocardial infarction was defined by characteristic changes in levels of troponin T and the creatine-kinase-MB isoform, symptoms of ischemic chest pain, changes in electrocardiogram results, or a combination of these. Stroke was defined as an acute fixed neurological deficit diagnosed by a physician and thought to be of vascular origin (without other origins, such as brain tumor) with signs and symptoms lasting ≥ 24 hours[18, 19].
Blood pressure was recorded with an automated electronic device (OMRON Model HEM-752 FUZZY, Omron Co., Dalian, China) in triplicate with a 1-min interval after the subject sat for 5-min. The mean of the three readings was used for analysis. BMI was calculated as weight (kg) divided by squared height (m2). Waist circumference was measured at the umbilical level. All participants underwent a 75-g oral glucose tolerance test, with blood samples collected at 0 and 2 h to test fasting blood glucose (FBG) and postprandial blood glucose (PBG), respectively[16]. FBG and PBG were determined by the glucose oxidase method using an autoanalyzer (Modular P800; Roche, Basel, Switzerland). Glycated hemoglobin (HbA1c) levels were determined by high performance liquid chromatography (Bio-Rad, Hercules, CA, USA). Serum uric acid, fasting serum insulin, triglycerides, total cholesterol, high-density lipoprotein cholesterol (HDL-C), low-density lipoprotein cholesterol (LDL-C), serum alanine amino-transferase, γ-glutamyl transpeptidase, and creatinine were all determined by a chemiluminescence method using an autoanalyzer (Modular E170; Roche)[16]. Serum insulin levels were determined by an immunoradiometric assay (RIABEADII; Abbott, Tokyo, Japan). The homeostasis model assessment of insulin resistance (HOMA-IR) index was calculated according to the formula: HOMA-IR = fasting insulin concentration (mIU/L) × fasting plasma glucose concentration (mmol/L)/22.5[17].
-
Screened diabetes was defined as FBG ≥ 7.0 mmol/L or 2-h plasma glucose ≥ 11.1 mmol/L according to 1999 World Health Organization definitions[18]. Participants with self-reported diabetes or use of anti-diabetic medications were considered to have diabetes. Overweight was defined as (BMI of 25.0-29.9 kg/m2 and obesity was defined as BMI ≥ 30.0 kg/m2 according to World Health Organization definitions[19]. Hypertension was defined as systolic blood pressure (SBP) ≥ 140 mmHg, or diastolic blood pressure ≥ 90 mmHg, or a self-reported previous diagnosis of hypertension by a physician and taking an antihypertensive medication. Dyslipidemia was defined according to the modified National Cholesterol Education Program-Adult Treatment Panel Ⅲ as: hypercholesterolemia, total cholesterol ≥ 6.22 mmol/L (240 mg/dL), hypertriglyceridemia, triglycerides ≥ 2.26 mmol/L (200 mg/dL), high LDL-C, LDL-C ≥ 4.14 mmol/L (160 mg/dL), and low HDL-C, HDL-C < 1.04 mmol/L (40 mg/dL)[19].
The Framingham risk score was calculated based on coronary risk factors, including age, sex, total cholesterol, HDL-C, SBP, and smoking habit according to the National Cholesterol Education Program-Adult Treatment Panel Ⅲ algorithm[20]. The calculated total scores were used to estimate the 10-year coronary heart disease risk in participants without previous CVD, and Framingham risk > 20% was identified as high for 10-year coronary heart disease risk[18].
Estimated 10-year ASCVD risk score was calculated using the new Pooled Cohort Risk Assessment Equations according to the recommendation of American College of Cardiology/American Heart Association Task Force on Practice Guidelines, and an ASCVD score ≥ 7.5% was considered high risk for 10-year ASCVD in participants without previous CVD[21].
-
All statistical analyses were performed with SAS version 9.3 (SAS Institute, Cary, NC, USA) separately for men and women. Data are given as mean ± standard deviation (median) and interquartile range for continuous variables, or numbers (percentages) for categorical parameters. Uric acid was categorized into gender-specific quartiles. The relationships between serum uric acid with cardiometabolic risk factors, previous CVDs, 10-year coronary heart disease risk, and 10-year ASCVD risk were determined with a logistic regression models. Two sets of models were used: model 1 was adjusted for age only and model 2 was adjusted for demographic characteristics and traditional risk factors of CVDs, including age, education (high school education or above or not), current cigarette smoking (no/yes), current alcohol consumption (no/yes), MET-min/week, BMI, HbA1c, SBP, and total cholesterol. The results are expressed as odds ratios (ORs) and 95% confidence intervals (CIs).
Study Population
Data Collection
Classification and Definition
Statistical Analysis
-
The study included 8, 252 participants with a mean age of 57.3 ± 9.0 years, and 36.97% were men. The mean serum uric acid level was 350.97 ± 88.42 μmol/L in men and 267.21 ± 78.24 μmol/L in women, respectively. The prevalence rates of obesity, hypertension, and dyslipidemia were 5.87% (5.67% in men and 5.98% in women), 55.84% (59.39% in men and 53.76% in women), and 37.59% (40.28% in men and 36.01% in women). A total of 6.81% of the participants reported having CVDs, 423 (5.50%) had an increased estimated 10-year Framingham risk for coronary heart disease, and 3, 050 (39.66%) had an increased estimated 10-year risk for a first hard ASCVD event.
The basic characteristics of the participants according to serum uric acid quartiles in men and women are shown in Table 1. Men and women with increased serum uric acid levels tended to be older, obese, and had significantly higher levels of blood pressure, total cholesterol, triglycerides, LDL-C, HOMA-IR, waist circumference, and a lower estimated glomerular filtration rate and HDL-C levels (all P < 0.001). Men with a higher serum uric acid level had higher proportions of current smokers and current drinkers.
Characteristics UA (μmol/L) P for Trend Q1 Q2 Q3 Q4 Men Number/percentage, % 764 (25.0%) 762 (25.0%) 763 (25.0%) 762 (25.0%) Uric acid, μmol/L 258.5 (232.3-278.9) 319.8 (307.8-332.2) 371.2 (359.1-387.7) 451.5 (424.8-495.1) < 0.0001 Age, years 58.3 ± 9.2 57.0 ± 9.2 57.6 ± 9.1 58.4 ± 9.6 0.0081 High school education or above, % 175 (22.9%) 201 (26.4%) 193 (25.3%) 198 (26.0%) 0.72 Current smoker, % 454 (60.0%) 419 (55.7%) 426 (56.4%) 367 (48.9%) 0.0001 Current drinker, % 157 (20.8%) 188 (25.3%) 207 (27.5%) 223 (30.1%) 0.0001 Physically active during leisure time, % 105 (13.7%) 94 (12.3%) 104 (13.6%) 106 (13.9%) 0.93 BMI, kg/m2 23.9 ± 2.8 24.8 ± 3.0 25.5 ± 3.0 26.2 ± 3.0 < 0.0001 Waist circumference, cm 81.1 ± 7.7 84.0 ± 8.3 86.2 ± 8.0 88.4 ± 8.1 < 0.0001 SBP, mmHg 136.7 ± 18.4 138.6 ± 18.2 140.3 ± 18.6 141.1 ± 17.8 < 0.0001 DBP, mmHg 82.0 ± 10.3 84.0 ± 9.9 85.3 ± 10.0 86.0 ± 10.0 < 0.0001 FBG, mmol/L 5.1 ± 0.6 5.1 ± 0.6 5.1 ± 0.6 5.2 ± 0.6 0.0008 PBG, mmol/L 6.0 ± 1.8 6.3 ± 1.8 6.4 ± 1.8 6.9 ± 1.8 < 0.0001 HbA1c, % 5.5 (5.3-5.7) 5.5 (5.3-5.7) 5.5 (5.3-5.7) 5.6 (5.3-5.8) 0.0072 Total cholesterol, mg/dL 4.88 ± 0.82 5.08 ± 0.96 5.11 ± 0.84 5.23 ± 0.97 < 0.0001 Triglyceride, mg/dL 1.03 (0.77-1.41) 1.25 (0.95-1.73) 1.41 (1.02-1.98) 1.73 (1.22-2.50) < 0.0001 HDL-C, mg/dL 1.33 ± 0.31 1.25 ± 0.30 1.22 ± 0.29 1.19 ± 0.29 < 0.0001 LDL-C, mg/dL 2.85 ± 0.69 3.04 ± 0.76 3.06 ± 0.75 3.11 ± 0.86 < 0.0001 HOMA-IR 0.97 (0.56-1.38) 1.23 (0.83-1.81) 1.49 (0.96-2.14) 1.67 (1.10-2.44) < 0.0001 Women Number/percentage % 1301 (25.0%) 1300 (25.0%) 1301 (25.0%) 1299 (25.0%) Uric acid, μmol/L 183.0 (160.8-197.8) 232.30 (222.05-243.45) 277.4 (265.8-289.9) 347.8 (324.5-390.2) < 0.0001 Age, years 54.6 ± 8.8 56.1 ± 8.3 57.5 ± 8.8 59.7 ± 8.5 < 0.0001 High school education or above, % 295 (22.7%) 284 (21.9%) 281 (21.6%) 225 (17.3%) 0.0034 Current smoker, % 5 (0.4%) 4 (0.3%) 6 (0.5%) 9 (0.7%) 0.50 Current drinker, % 7 (0.6%) 9 (0.7%) 15 (1.2%) 10 (0.8%) 0.32 Physically active during leisure time, % 161 (12.4%) 203 (15.6%) 210 (16.1%) 209 (16.1%) 0.02 BMI, kg/m2 23.6 ± 3.0 24.4 ± 2.9 25.1 ± 3.2 26.1 ± 3.3 < 0.0001 Waist circumference, cm 76.5 ± 8.0 79.0 ± 7.4 80.9 ± 8.2 83.7 ± 8.3 < 0.0001 SBP, mmHg 133.6 ± 18.7 137.4 ± 19.4 139.5 ± 20.3 145.0 ± 20.3 < 0.0001 DBP, mmHg 79.6 ± 9.9 81.0 ± 9.9 82.0 ± 10.0 83.6 ± 10.3 < 0.0001 FBG, mmol/L 5.0 ± 0.5 5.1 ± 0.5 5.1 ± 0.6 5.2 ± 0.6 < 0.0001 PBG, mmol/L 6.4 ± 1.5 6.7 ± 1.6 6.9 ± 1.7 7.3 ± 1.7 < 0.0001 HbA1c, % 5.5 (5.3-5.7) 5.5 (5.3-5.7) 5.6 (5.4-5.8) 5.6 (5.4-5.9) < 0.0001 Total cholesterol, mg/dL 5.24 ± 0.96 5.41 ± 0.90 5.45 ± 1.03 5.67 ± 1.10 < 0.0001 Triglyceride, mg/dL 1.03 (0.78-1.41) 1.24 (0.93-1.74) 1.39 (1.03-1.90) 1.66 (1.25-2.36) < 0.0001 HDL-C, mg/dL 1.49 ± 0.33 1.41 ± 0.30 1.36 ± 0.30 1.30 ± 0.29 < 0.0001 LDL-C, mg/dL 3.08 ± 0.83 3.24 ± 0.80 3.29 ± 0.91 3.45 ± 0.92 < 0.0001 HOMA-IR 1.28 (0.89-1.73) 1.46 (1.02-2.01) 1.68 (1.17-2.38) 2.02 (1.42-2.92) < 0.0001 Note. UA, uric acid; BMI, body mass index; SBP, systolic blood pressure; DBP, diastolic blood pressure; FPG, fasting plasma glucose; PBG, postprandial blood glucose; HbA1c, hemoglobin A1; LDL-C, low density lipoprotein cholesterol; HDL-C, high density lipoprotein cholesterol. Table 1. Characteristics of the Study Populations according to Serum Uric Acid Quartiles (N = 8, 252)
A multivariate logistic regression analysis indicated that increased serum uric acid level was associated with an increased risk of prevalent obesity, hypertension, and dyslipidemia in men and women (all P for trend < 0.001; Table 2).
Variables UA (μmol/L) P for Trend Q1 Q2 Q3 Q4 Obesity Men (n = 3, 051) Case percentage (%) 19 (2.49%) 37 (4.86%) 48 (6.29%) 69 (9.06%) < 0.0001 Age-adjusted OR (95% CI) 1.00 1.98 (1.13-3.47) 2.62 (1.52-4.50) 3.91 (2.33-6.56) < 0.0001 Multivariate adjusted OR (95% CI)* 1.00 1.88 (1.06-3.33) 2.34 (1.35-4.06) 3.42 (2.01-5.81) < 0.0001 Women (n = 5, 201) Case percentage (%) 34 (2.61%) 46 (3.54%) 76 (5.84%) 155 (11.93%) < 0.0001 Age-adjusted OR (95% CI) 1.00 1.36 (0.87-2.14) 2.29 (1.52-3.47) 4.98 (3.38-7.32) < 0.0001 Multivariate adjusted OR (95% CI)* 1.00 1.34 (0.85-2.12) 2.04 (1.33-3.13) 4.18 (2.80-6.24) < 0.0001 Hypertension Men (n = 3, 051) Case percentage (%) 390 (51.05%) 439 (57.61%) 464 (60.81%) 519 (68.11%) < 0.0001 Age-adjusted OR (95% CI) 1.00 1.44 (1.17-1.78) 1.60 (1.30-1.97) 2.16 (1.74-2.67) < 0.0001 Multivariate adjusted OR (95% CI)** 1.00 1.15 (0.92-1.43) 1.13 (0.90-1.41) 1.29 (1.02-1.63) 0.04 Women (n = 5, 201) Case percentage (%) 515 (39.58%) 640 (49.23%) 721 (55.42%) 920 (70.82%) < 0.0001 Age-adjusted OR (95% CI) 1.00 1.37 (1.17-1.62) 2.86 (2.42-3.40) 1.07 (1.06-1.08) < 0.0001 Multivariate adjusted OR (95% CI)** 1.00 1.16 (0.98-1.38) 1.30 (1.09-1.54) 1.96 (1.63-2.36) < 0.0001 Dyslipidemia Men (n = 3, 051) Case percentage (%) 188 (24.61%) 279 (36.61%) 330 (43.25%) 432 (56.69%) < 0.0001 Age-adjusted OR (95% CI) 1.00 1.72 (1.38-2.15) 2.32 (1.86-2.89) 4.11 (3.29-5.12) < 0.0001 Multivariate adjusted OR (95% CI)*** 1.00 1.49 (1.18-1.88) 1.89 (1.50-2.38) 3.16 (2.50-3.99) < 0.0001 Women (n = 5, 201) Case percentage (%) 273 (20.98%) 420 (32.31%) 491 (37.74%) 689 (53.04%) < 0.0001 Age-adjusted OR (95% CI) 1.00 1.75 (1.47-2.09) 2.17 (1.82-2.58) 3.88 (3.25-4.62) < 0.0001 Multivariate adjusted OR (95% CI)*** 1.00 1.66 (1.39-2.00) 1.99 (1.66-2.38) 3.23 (2.68-3.88) < 0.0001 Note. OR, odds ratio; CI, confidence interval; UA, uric acid; BMI, body mass index; *Multivariable model adjusted for age, education attainment, current smoking status, current alcohol consumption, MET-min/week, HbA1c, SBP, total cholesterol. **Multivariable model adjusted for age, education attainment, current smoking status, current alcohol consumption, MET-min/week, BMI, HbA1c, total cholesterol. ***Multivariable model adjusted for age, education attainment, current smoking status, current alcohol consumption, MET-min/week, BMI, HbA1c, SBP. Significant data in bold. Table 2. Association between Serum Uric Acid Concentrations and Cardiovascular Risk Factors in Middle-aged and Elderly Chinese Adults without Diabetes (N = 8, 252)
The association between serum uric acid level and prevalent CVD was further evaluated. A total of 221 (7.24%) men and 341 (6.56%) women had a history of CVD, including 141 (4.64%) with coronary heart disease, 10 (0.33%) with a myocardial infarction, and 80 (2.63%) with stroke in men, and 249 (4.82%) with coronary heart disease, three (0.06%) with myocardial infarction, and 101 (1.92%) with stroke in women. Elevated serum uric acid was associated with an increased risk of prevalent CVDs. The prevalence numbers of self-reported CVDs were 42 (5.50%), 45 (5.91%), 60 (7.86%), and 74 (9.71%) in men and 59 (4.53%), 78 (6.00%), 80 (6.15%), and 124 (9.55%) in women across quartiles of serum uric acid (all P for trend < 0.001). Multivariate adjusted ORs (95% CI) of prevalent cardiovascular disease risk associated with serum uric acid were 1.00, 1.16 (0.74-1.82), 1.51 (0.99-2.33), and 1.67 (1.09-2.55; P for trend < 0.001) for men, and 1.00, 1.21 (0.84-1.72), 1.13 (0.79-1.62), and 1.50 (1.06-2.12) (P for trend < 0.001) for women, respectively, Table 3.
Variables UA (μmol/L) P for Trend Q1 Q2 Q3 Q4 Cardiovascular diseases (n = 8, 252) Men (n = 3, 051) Case percentage (%) 42 (5.50%) 45 (5.91%) 60 (7.86%) 74 (9.71%) 0.0003 Age-adjusted OR (95% CI) 1.00 1.22 (0.78-1.89) 1.60 (1.06-2.44) 1.85 (1.24-2.77) 0.001 Multivariate adjusted OR (95% CI)† 1.00 1.16 (0.74-1.82) 1.51 (0.99-2.33) 1.67 (1.09-2.55) 0.009 Women (n = 5, 201) Case percentage (%) 59 (4.53%) 78 (6.00%) 80 (6.15%) 124 (9.55%) Age-adjusted OR (95% CI) 1.00 1.25 (0.88-1.77) 1.14 (0.80-1.62) 1.61 (1.16-2.23) 0.007 Multivariate adjusted OR (95% CI)† 1.00 1.21 (0.84-1.72) 1.13 (0.79-1.62) 1.50 (1.06-2.12) 0.03 Framingham risk score > 20%††† (n = 7, 690) Men (n = 2, 830) Case percentage (%) 61 (8.45%) 78 (10.88%) 105 (14.94%) 132 (19.19%) < 0.0001 Age-adjusted OR (95% CI) 1.00 1.54 (1.10-2.18) 2.14 (1.54-2.98) 2.83 (2.01-3.98) < 0.0001 Multivariate adjusted OR (95% CI)† 1.00 1.39 (0.92-2.12) 2.05 (1.37-3.06) 3.00 (2.00-4.50) < 0.0001 Women (n = 4, 860) Case percentage (%) 6 (0.49%) 5 (0.42%) 7 (0.58%) 29 (2.39%) < 0.0001 Age-adjusted OR (95% CI) 1.00 0.39 (0.11-1.41) 1.07 (0.42-2.74) 4.73 (1.70-11.25) 0.0005 Multivariate adjusted OR (95% CI)† 1.00 0.44 (0.10-1.83) 1.01 (0.33-1.75) 2.95 (1.08-8.43) 0.01 ASCVD risk score ≥ 7.5%†† (n = 7, 690) Men (n = 2, 830) Case percentage (%) 484 (67.04%) 487 (67.92%) 511 (72.69%) 509 (73.98%) 0.0004 Age-adjusted OR (95% CI) 1.00 1.49 (1.11-2.00) 1.98 (1.46-2.69) 2.08 (1.52-2.84) < 0.0001 Multivariate adjusted OR (95% CI)† 1.00 1.52 (0.97-2.41) 1.87 (1.17-2.99) 1.93 (1.17-3.17) 0.005 Women (n = 4, 860) Case percentage (%) 171 (13.77%) 190 (15.55%) 287 (23.51%) 411 (34.98%) < 0.0001 Age-adjusted OR (95% CI) 1.00 1.41 (0.97-2.04) 2.62 (1.83-3.74) 5.40 (3.71-7.87) < 0.0001 Multivariate adjusted OR (95% CI)† 1.00 1.06 (0.58-1.91) 2.48 (1.39-4.42) 4.53 (2.57-7.98) < 0.0001 Note. OR, odds ratio; CI, confidence interval; CVD, cardiovascular diseases; ASCVD, atherosclerotic cardiovascular diseases; HOMA-IR, homeostasis model assessment of insulin resistance. †Multivariable model adjusted for age, education attainment, current smoking status, current alcohol consumption, MET-min/week, BMI, HbA1c, SBP, total cholesterol. ††Analysis was carried out in participants ages 40-79 years old, free of CVD and diabetes (N = 7, 690) and individuals with ASCVD score ≥ 7.5% were identified as at high risks for 10-year ASCVD. †††Analysis was carried out in participants ages 40-79 years old, free of CVD and diabetes (n = 7, 690), and Framingham risk score > 20% were identified as at high risks for 10-year coronary heart disease. Significant data in bold. Table 3. Association between Serum Uric Acid Levels and Cardiovascular Disease in Middle-aged and Elderly Chinese Adults without Diabetes
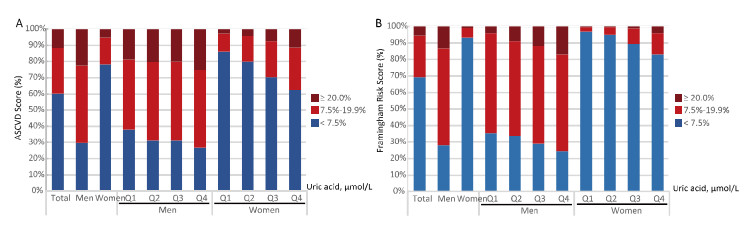
The estimated 10-year Framingham risk for coronary heart disease and estimated 10-year risk for a first hard ASCVD event were further calculated in participants free of CVDs (n = 7, 690, Table 3; Figure 1). Men had a significantly higher risk according to the Framingham risk score and ASCVD than women. The mean Framingham risk score was 13.63% ± 7.27% in men and 3.33% ± 3.86% in women. There were 376 (13.29%) men and 47 (0.97%) women who had a 10-year Framingham risk for coronary heart disease > 20%. The mean ASCVD risk score was 13.92% ± 9.7% in men and 5.53% ± 6.78% in women. A total of 70.35% of men and 21.79% of women had ASCVD risk ≥ 7.5%.
Figure 1. Distribution of estimated 10-year risk for a first hard atherosclerotic cardiovascular diseases (ASCVD) event (A) and 10-year Framingham risk for coronary heart disease (B) in middle-aged and elderly Chinese adults without diabetes or CVD, stratified by sex and serum uric acid concentration groups (N = 7, 690).
As shown in Figure 1, the distribution of the two estimated risk scores was stratified by sex and serum uric acid level. Serum uric acid was associated with increased 10-year Framingham risk for coronary heart disease and the 10-year risk for ASCVD after multivariate adjustments (P for trend < 0.001; Table 3, Figure 1) in men and women. Multivariate adjusted ORs (95% CI) of the high Framingham risk associated with serum uric acid were: 1.00, 1.39 (0.92-2.12), 2.05 (1.37-3.06), and 3.00 (2.00-4.50) in men and 1.00, 0.44 (0.10-1.83), 1.01 (0.33-1.75), and 2.95 (1.08-8.43) in women. Multivariate adjusted ORs (95% CI) of the ASCVD risk associated with serum uric acid were 1.00, 1.52 (0.97-2.41), 1.87 (1.17-2.99), 1.93 (1.17-3.17) in men and 1.00, 1.06 (0.58-1.91), 2.48 (1.39-4.42), 4.53 (2.57-7.98) in women (Table 3).
-
In the present cross-sectional study conducted among the middle-aged and elderly Chinese populations, we found that higher serum uric acid levels were significantly associated with an increased risk of prevalent cardiometabolic diseases, estimated from the 10-year Framingham risk for coronary heart disease and the 10-year risk for a first hard ASCVD event.
Our findings about the association between serum uric acid and cardiometabolic diseases are in accordance with previous studies[2, 6, 9, 15, 22]. In a restricted generalized study of 3, 073 highly selected middle-aged male participants without diabetes or metabolic syndrome, higher serum uric acid levels were significantly associated with an increased risk for hypertension[6]. However, data on the risks of 10-year Framingham risk for coronary heart disease or 10-year risk for ASCVD are limited, especially among female counterparts. In another small study of 581 elderly patients with type 2 diabetes, higher serum uric acid level independently predicted cardiovascular mortality, but the authors did not adjust for glycemic control[23]. In this respect, the effect of gender differences and HbA1c levels on serum uric acid concentration cannot be ignored[1]. In a large middle-aged and elderly Chinese population, Lai et al. reported that higher serum uric acid level was independently associated with a dose-response increased risk for coronary heart disease[15]. However, they did not exclude patients with diabetes, who have significantly lower urate levels, and they did not perform sex-specific analyses. Sex-specific analysis is needed when investigating the association between serum uric acid level and CVD risk, because serum uric acid level is higher in men than in women of all age groups[1]. In our study, we further explored the association between serum uric acid level and coronary heart disease risk factors. The highest quartile of serum uric acid was significantly associated with an increased risk of prevalent cardiovascular diseases, compared with the lowest uric acid quartile, and predicted cardiovascular risk in participants without obesity (Table S1, available at www.besjournal.com).
Variables UA (μmol/L) P for Trend Q1 Q2 Q3 Q4 Cardiovascular diseases (n = 8, 252) Age < 60 y (n = 5, 247) 40 (2.84%) 57 (4.07%) 36 (2.79%) 65 (5.66%) 0.002 Multivariate adjusted OR (95% CI)† 1.00 1.33 (0.87-2.02) 0.91 (0.57-1.45) 1.72 (1.12-2.66) 0.06 ≥ 60 y (n = 2, 641) 61 (9.28%) 66 (9.98%) 104 (13.42%) 133 (14.58%) 0.0001 Multivariate adjusted OR (95% CI)† 1.00 1.03 (0.71-1.49) 1.44 (1.02-2.02) 1.45 (1.03-2.04) 0.009 Obesity No (n = 7, 768) 97 (4.82%) 112 (5.66%) 127 (6.55%) 163 (8.87%) < 0.0001 Multivariate adjusted OR (95% CI)†† 1.00 1.13 (0.85-1.50) 1.22 (0.92-1.62) 1.43 (1.09-1.89) 0.009 Yes (n = 484) 4 (7.55%) 11 (13.25%) 13 (10.48%) 35 (15.63%) 0.07 Multivariate adjusted OR (95% CI)†† 1.00 2.05 (0.58-7.20) 1.53 (0.45-5.22) 2.13 (0.68-6.71) 0.29 Hypertension No (n = 3, 644) 33 (2.84%) 33 (3.36%) 30 (3.41%) 32 (5.14%) 0.01 Multivariate adjusted OR (95% CI)††† 1.00 1.12 (0.68-1.86) 1.13 (0.68-1.90) 1.68 (0.99-2.85) 0.08 Yes (n = 4, 608) 68 (7.51%) 90 (8.34%) 110 (9.28%) 166 (11.54%) 0.0003 Multivariate adjusted OR (95% CI)††† 1.00 1.16 (0.83-1.63) 1.18 (0.85-1.64) 1.28 (0.93-1.75) 0.15 Dyslipidemia No (n = 5, 150) 75 (4.68%) 73 (5.36%) 84 (6.76%) 89 (9.47%) < 0.0001 Multivariate adjusted OR (95% CI)†††† 1.00 1.09 (0.77-1.53) 1.27 (0.91-1.77) 1.56 (1.12-2.19) 0.006 Yes (n = 3, 102) 26 (5.64%) 50 (7.15%) 56 (6.82%) 109 (9.72%) 0.002 Multivariate adjusted OR (95% CI)†††† 1.00 1.27 (0.77-2.10) 1.10 (0.67-1.81) 1.28 (0.80-2.04) 0.45 Framingham risk score > 20% (n = 7, 690) Age < 60 y (n = 5, 049) 31 (2.27%) 41 (3.05%) 63 (5.03%) 51 (4.70%) < 0.0001 Multivariate adjusted OR (95% CI)† 1.00 0.96 (0.54-1.70) 1.75 (1.01-3.01) 1.25 (0.70-2.23) < 0.0001 ≥ 60 y (n = 2, 641) 36 (6.04%) 42 (7.06%) 49 (7.30%) 110 (14.12%) < 0.0001 Multivariate adjusted OR (95% CI)† 1.00 1.06 (0.63-1.79) 1.01 (0.61-1.66) 1.97 (1.23-3.15) 0.01 Obesity No (n = 7, 269) 64 (3.34%) 80 (4.28%) 105 (5.79%) 147 (8.78%) < 0.0001 Multivariate adjusted OR (95% CI)†† 1.00 1.32 (0.87-2.00) 1.59 (1.07-2.37) 2.12 (1.43-3.14) < 0.0001 Yes (n = 421) 3 (6.12%) 3 (4.17%) 7 (6.31%) 14 (7.41%) 0.23 Multivariate adjusted OR (95% CI)†† 1.00 0.59 (0.07-4.77) 0.89 (0.14-5.62) 1.13 (0.21-6.09) 0.62 Hypertension No (n = 3, 516) 9 (0.80%) 8 (0.84%) 17 (2.00%) 7 (1.19%) 0.05 Multivariate adjusted OR (95% CI)††† 1.00 0.82 (0.28-2.38) 1.49 (0.58-3.84) 0.71 (0.23-2.20) 0.92 Yes (n = 4, 174) 58 (6.93%) 75 (7.58%) 95 (8.84%) 154 (12.10%) < 0.0001 Multivariate adjusted OR (95% CI)††† 1.00 1.39 (0.90-2.17) 1.56 (1.02-2.38) 1.98 (1.31-3.00) 0.001 Dyslipidemia No (n = 4, 829) 28 (1.83%) 32 (2.48%) 32 (2.76%) 30 (3.53%) 0.01 Multivariate adjusted OR (95% CI)†††† 1.00 1.75 (0.95-3.20) 1.65 (0.90-3.04) 1.98 (1.04-3.77) 0.05 Yes (n = 2, 861) 39 (8.97%) 51 (7.86%) 80 (10.46%) 131 (12.94%) 0.001 Multivariate adjusted OR (95% CI)†††† 1.00 0.88 (0.50-1.54) 1.25 (0.74-2.10) 1.61 (0.97-2.66) 0.01 ASCVD risk score ≥ 7.5% (n = 7, 690) Age < 60 y (n = 5, 049) 204 (14.91%) 248 (18.45%) 279 (22.27%) 270 (24.91%) < 0.0001 Multivariate adjusted OR (95% CI)† 1.00 1.09 (0.81-1.47) 1.26 (0.94-1.70) 1.24 (0.91-1.69) 0.11 ≥ 60 y (n = 2, 641) 451 (75.67%) 429 (72.10%) 519 (77.35%) 650 (83.44%) < 0.0001 Multivariate adjusted OR (95% CI)† 1.00 0.77 (0.57-1.06) 1.00 (0.73-1.37) 1.43 (1.04-1.98) 0.007 Obesity No (n = 7, 269) 639 (33.21%) 644 (34.49%) 750 (41.37%) 825 (49.28%) < 0.0001 Multivariate adjusted OR (95% CI)†† 1.00 1.07 (0.82-1.40) 1.33 (1.02-1.73) 1.53 (1.17-2.00) 0.001 Yes (n = 421) 19 (38.78%) 33 (45.83%) 48 (43.24%) 95 (50.26%) 0.08 Multivariate adjusted OR (95% CI)†† 1.00 1.84 (0.57-5.94) 1.74 (0.57-5.28) 1.19 (0.41-3.43) 0.09 Hypertension No (n = 3, 516) 230 (20.41%) 203 (21.37%) 215 (25.32%) 155 (26.27%) 0.001 Multivariate adjusted OR (95% CI)††† 1.00 1.17 (0.79-1.72) 1.17 (0.79-1.73) 0.96 (0.62-1.48) 0.97 Yes (n = 4, 174) 425 (50.78%) 474 (47.93%) 583 (54.23%) 765 (60.09%) < 0.0001 Multivariate adjusted OR (95% CI)††† 1.00 1.02 (0.72-1.45) 1.18 (0.84-1.66) 1.36 (0.97-1.92) 0.04 Dyslipidemia No (n = 4, 829) 469 (30.67%) 412 (31.94%) 431 (37.19%) 374 (43.95%) < 0.0001 Multivariate adjusted OR (95% CI)†††† 1.00 1.14 (0.82-1.59) 1.14 (0.81-1.59) 1.30 (0.92-1.86) 0.17 Yes (n = 2, 861) 186 (42.76%) 265 (40.83%) 367 (47.97%) 546 (53.95%) < 0.0001 Multivariate adjusted OR (95% CI)†††† 1.00 0.81 (0.50-1.31) 1.12 (0.71-1.77) 1.17 (0.75-1.84) 0.15 Note. OR, odds ratio; CI, confidence interval; ASCVD, atherosclerotic cardiovascular diseases; †Multivariable model adjusted for education attainment, current smoking status, current alcohol consumption, MET-min/week, BMI, HbA1c, SBP, total cholesterol. ††Multivariable model adjusted for age, education attainment, current smoking status, current alcohol consumption, MET-min/week, HbA1c, SBP, total cholesterol. †††Multivariable model adjusted for age, education attainment, current smoking status, current alcohol consumption, MET-min/week, BMI, HbA1c, total cholesterol. ††††Multivariable model adjusted for age, education attainment, current smoking status, current alcohol consumption, MET-min/week, BMI, HbA1c, SBP. Significant data in bold. Table Table S1. Subgroup Analysis of the Association between Serum Uric Acid Levels and Cardiovascular Diseases in Middle-Aged and Elderly Chinese Adults without Diabetes
Endothelial dysfunction and oxidative stress in adipocytes are two potential mechanisms underlying the association between serum uric acid and cardiovascular risk. First, serum uric acid may harm the functions of platelets and endothelium[1]. Uric acid can induce oxidative stress, leading to attenuated nitric oxide bioavailability, which can promote proliferation of vascular smooth muscle[24]. Experimental studies in rats have reported that hyperuricemia induces endothelial dysfunction and that allopurinol improves endothelial function in patients with hyperuricemia, which supports the above mechanism[1]. Uric acid induces cellular proliferation, inflammation, oxidative stress, and activation of the local renin–angiotensin system in cultured vascular smooth muscle cells[1, 25, 26]. Microvascular changes still develop when blood pressure is controlled by a diuretic[1]. Furthermore, the mechanism of uric acid transport is still not completely understood. As the function of urate transport is essential for determining serum uric acid concentrations, further studies on the functional role of a uric acid transporter will provide a novel strategy to treat hyperuricemia-associated diseases[27, 28].
The main strength of our study was the large sample size, the exclusion of subjects with diabetes, and the gender specific analysis. Several limitations in our study should be mentioned. First, due to the cross-sectional design, no causal inferences can be drawn on the issue of serum uric acid and cardiovascular risks. Second, higher serum uric acid levels may indirectly contribute to increased cardiometabolic disease risk through a close association with established risk factors, such as older age, obesity, hypertension, dyslipidemia, dysglycemia, and chronic kidney disease. The exact mechanisms should be further investigated. Third, our study was conducted among a middle-aged and elderly Chinese population and should be carefully interpreted in other age and ethnical populations. Lastly, the information on cardiovascular diseases was collected through self-reported data, which might lead to inevitable recall bias.
To conclude, we found that serum uric acid was independently associated with an increased risk of obesity, hypertension, dyslipidemia, the 10-year Framingham risk for coronary heart disease, and the 10-year risk for ASCVD among the middle-aged and elderly Chinese population. As uric acid levels are effectively and safely modifiable with treatment, reducing serum uric acid might be preventive for cardiometabolic diseases and could be translated into large public heath gains. Further investigations are needed to confirm this association and the exact mechanisms.
-
The authors report no relationships that could be construed as a conflict of interest.
-
The authors thank the working field staff for their contributions and the participants for their cooperation.
LU Jie Li was supported by 'Chenxing Plan' of Shanghai Jiaotong University, Shuguang Program [15SG15], and Gaofeng Clinical Medicine Grant Support [20152202] from Shanghai Municipal Education Commission.
the Ministry of Science and Technology of the People's Republic of China 2016YFC1305601
the National Natural Science Foundation of China 81670795
the Ministry of Science and Technology of the People's Republic of China 2016YFC1304904
the Ministry of Science and Technology of the People's Republic of China 2016YFC0901201
the Ministry of Science and Technology of the People's Republic of China 2016YFC1305202

 Quick Links
 DownLoad: