


HTML
-
Lanthanum (La) is classified as an important rare earth element (REE) and has been widely used in many fields, such as agriculture, electronics, pharmacology, and biomedical domains, based on its physical and chemical characteristics. The commercial use of rare earth in Chinese agriculture began after the identification of the growth-enhancing characteristics of REEs at low doses in various plant species. Varying levels of REEs have been detected in agricultural products of mining areas or non-mining areas[1-3]. Outstanding growth-enhancing results of REE applications at low concentrations on various plant species were reported in China, and the commercial use of rare earth in agriculture was begun. REEs have been used at low concentrations as feed additives and fertilizers for decades. Due to the wide application of REE-enriched fertilizers, lanthanum has increasingly entered the environment and has been shown to accumulate in the human body when ingested via the food chain[4-6]. Sixteen REEs were measured in Chinese food products with average lanthanum concentrations of 29 and 48 μg/kg in principle food and fresh vegetables, respectively, and a maximum of 4 mg/kg[5]. Since lanthanum is not an essential element for humans, the element and its compounds warrant attention regarding food safety.
Previous studies have found that lanthanum exposure may be related to health problems such as decreased liver function[7-9]. Some researchers have shown that lanthanum chloride (LaCl3) accumulates in brain tissue[10], affects neurobehavioral development[11-13], and impairs learning and memory in animals[10]. Moreover, some studies have reported potential toxic effects of lanthanum, on bone[14, 15], kidneys[16], spleen[17], and the immune system[18]. Despite the potential risks cited above, these toxicity data have limited use in risk assessment as these studies were not conducted according to current, internationally accepted protocols and good laboratory practice (GLP).
Regulatory limits for REEs were established in China in 2005, but these levels were brought into question again in 2010. Some experts held the opinion that REEs were safe as they had been used for decades in fertilizer at low doses. This especially applies to lanthanum carbonate [La2(CO3)3], which has been used as a medicine for end-stage renal disease since it has been shown to be a safe and effective phosphate-binding agent[19]. On the other hand, it was noted that REEs can accumulate in food and human tissues, including bone, liver, and the gastrointestinal tract, although its bioavailability is extremely low[20].
Concerns regarding the effects of continuous exposure to low levels of lanthanum in food on human health have arisen since it has been demonstrated to accumulate in human tissues[21-25]. Since lanthanum has been commonly found in foods, it is important to estimate the potential for human health effects and establish an acceptable dietary intake (ADI) for lanthanum in food. To this end, a series of toxicity tests for REEs, including lanthanum, were carried out at the China National Center for Food Safety (CFSA). These toxicity tests, including nontoxicity[26], three 90-day, repeated oral dose tests[27], toxicokinetic evaluation, and a special toxicity (neurotoxicity, development toxicity) study[28, 29], were conducted according to internationally accepted protocols.
Therefore, the present study was carried out to determine the no observed adverse effect level (NOAEL) of lanthanum, which could be used to develop an ADI for the risk assessment of lanthanum. Using these data, we have estimated the 95% lower confidence value of the benchmark dose (BMDL) of lanthanum using the benchmark dose (BMD) method, which was applied to estimate a point of departure for the hazard risk assessment for lanthanum.
-
Lanthanum was provided by the General Research Institute for Nonferrous Metals (Beijing, China), and a lanthanum nitrate [La(NO3)3] solution was prepared as described by Yang[26] and verified by inductively coupled plasma-mass spectrometry (ICP-MS) (Varian 820-MS, USA) with a final concentration of 324.8 g/L (purity of 98.0% ± 1.9%). The stock solution was stable at room temperature for 6 months. Samples for gavage administration were diluted from stock solution with double-purified water and adjusted to pH 6.0-6.5 with 0.1 mol/L sodium hydroxide solution.
-
The study was conducted at the Animal Institute of Disease Control and Prevention laboratory, PLA (Beijing China), the (GLP)-certified laboratory, according to the Testing of Chemicals protocols under the 'Repeated-Dose 90-day Oral Toxicity Study in Rodents' (OECD Test No. 408)[30]. Specific-pathogen-free (SPF) weanling Sprague- Dawley (SD) rats (4 weeks, 50-60 g) were obtained from the laboratory Animal Center, Academy of Military Medical Sciences. Animals were quarantined 6 days before the start of the study and then randomly assigned to five groups. Male and female rats (n = 10/group per sex) were given lanthanum nitrate solution by gavage daily at dose levels of 0, 1.5, 6.0, 24.0, and 144.0 mg/kg BW per day for 13 weeks, and satellite groups (five rats in each sex and each group) in the highest group (144.0 mg/kg BW per day) and control group were followed by a recovery period of 4 weeks. The doses were designed according to the LD50 from a previous acute oral toxicity study, and the highest dose was set at approximately 10% of the LD50 (data not published). Each rat was kept in a PVC cage in an animal room with a barrier system, controlled temperature (20-26.0 ℃), humidity (40%-70%), ventilation approximately 15 exchanges/h, and a 12-h light/dark cycle. All aspects of this project involving animal care, use, and welfare were performed in compliance with the Food and Drug Administration (FDA) principles of GLP and in accordance with the FDA Guidance for Industry and Other Stakeholders, 'Toxicological Principles for the Safety Assessment of Food Ingredients Redbook 2000'[31]. This study was carried out in strict accordance with the recommendations in the Guide for the Care and Use of Laboratory Animals of the National Institutes of Health. The protocol for the study was reviewed and approved by the Animal Experimental Welfare & Ethical Inspection Committee of the China National Center for Food Safety Risk Assessment (Permit Number: 2013009). Ten rats per sex of each group were subjected to necropsy 1 day after the last administration (the end of the treatment period), and the remaining 5 rats per sex of the satellite group were subjected to necropsy 28 days after the last administration (the end of the recovery period). All surgery was performed under sodium pentobarbital anesthesia, and all efforts were made to minimize animal suffering.
-
Each rat was weighed at the beginning of the study, weekly during the administration and recovery periods, and at necropsy and observed daily for clinical signs and mortality. The food consumption of each rat was also measured weekly. Following 90 days of lanthanum exposure and a recovery period, all animals were euthanized by exsanguination from the abdominal aorta under sodium pentobarbital anesthesia.
-
At the end of the study, urine was collected overnight prior to necropsy from animals housed in metabolic cages and analyzed for leukocytes, nitrite, urobilinogen, bilirubin, protein, glucose (GLU), specific gravity, pH, and occult blood, using a Urit-55 urine analyzer Combi Scan 100 and Urit-13G test strip (Urit, China).
-
At the end of the study, the animals were fasted overnight prior to blood collection. The fasting rats were anesthetized, and blood was collected from the abdominal aorta. Red blood cell count (RBC), hemoglobin (HGB), red-blood-cell- specific volume (HCT), mean corpuscular hemoglobin (MCH), mean corpuscular hemoglobin concentration (MCHC), white blood cell count (WBC), platelet count (PLT), percentage of lymphocytes, percentage of neutrophils, and percentage of other leukocytes (including monocytes, eosinophils, and basophils) were analyzed using an automatic blood analyzer (MEK-6318K, Japan). Reticulocyte count (RET) was analyzed by microscopy. Prothrombin time (PT) and activated partial thromboplastin time (APTT) were analyzed using a blood coagulation analyzer (KHB202-4, PRC). Alanine aminotransferase (ALT), aspartate aminotransferase (AST), alkaline phosphatase (ALP), total protein (TP), albumin, total bilirubin (TBIL), cholesterol (CHOL), triglycerides (TG), glucose, creatinine (CREA), chloride (Cl), phosphorous (P), potassium (K), and calcium (Ca) were analyzed using an automatic chemical analyzer (Hitachi 7100, Japan).
-
A complete necropsy was conducted on all animals. The necropsies included examination of the external surface; all orifices; and the cranial, thoracic, abdominal, and pelvic cavities including viscera. At the time of necropsy, the following tissues and organs were collected and placed in 10% neutral- buffered formalin: adrenal glands, bone with marrow (femur), brain (cerebrum level 1, cerebrum level 2, and cerebellum with medulla/pons), gastrointestinal tract [esophagus, stomach, duodenum, jejunum, ileum (including Peyer's patch), cecum, colon, and rectum], Harderian gland, heart, kidneys, liver, lungs (including bronchi), lymph nodes (mandibular and mesenteric), mammary gland (females only), ovaries with oviducts, pancreas, peripheral nerve (sciatic), pituitary gland, prostate, salivary glands (mandibular), seminal vesicles, skeletal muscle (rectus femoris), skin, spinal cord (cervical, midthoracic, and lumbar), spleen, thymus, thyroid/parathyroid, trachea, urinary bladder, uterus with vagina and cervix, and gross lesions. The following organs were weighed: adrenals, brain, heart, kidneys, liver, spleen, thymus, testes, and epididymis. Paired organs were weighed together. Organ-to-final-body-weight ratios were calculated. All samples were sectioned and stained with hematoxylin and eosin.
-
Data were expressed as mean ± SD and analyzed by SPSS 11.5 statistical software (SPSS Inc., USA). Organ and body weight, hematological and blood biochemical data, and food consumption data were analyzed using analysis of variance, and the significance of intergroup differences was analyzed using a two-sided Dunnett's test. Urinalysis and histopathological data were analyzed using the Mann-Whitney U test. The threshold for significance was set at P < 0.05, comparing each test group to the control group by sex.
-
The US Environmental Protection Agency's (EPA) benchmark dose software (BMDS) version 2.4.0 was used to estimate the benchmark dose (BMD). Briefly, BMD analysis included selection of the benchmark response (BMR), selection of a set of appropriate models, assessing model fit, and data reporting. Use of BMD methods involve fitting mathematical models to dose-response data and using the different results to select a BMD that is associated with a predetermined BMR, such as a 10% increase in the incidence of a particular lesion or a 10% decrease in body weight gain. For continuous data modeling, 'one standard deviation' was used as the default BMR as recommended[32]. Estimations of BMDs and BMDLs were performed by applying the dose-response models (i.e., Exponential, Power, Polynomial, Linear, and Hill) available in the BMDS Software[33]. For model selection, if BMDLs were divergent, the model with lowest BMD (or BMDL) was used, and if BMDLs were not divergent, the model with lowest Akaike's Information Criterion (AIC) was used.
Results from all models include a reiteration of the model formula and model run options chosen by the user, goodness-of-fit information, the BMD, and the estimate of the lower-bound confidence limit of the BMDL. Model results are presented in textual and graphical output files, which can be printed or saved and incorporated into other documents. To avoid 'wavy' model responses on elevated biological changes in animals, the adverse direction was designated as 'up' in the Exponential, Linear, Power, and Hill models, and the coefficients were restricted as 'non-negative' (> 0) in the Polynomial model. BMDS facilitates these operations by providing simple data-management tools and an easy-to-use interface to run multiple models on the same dose-response data set.
Preparation of Lanthanum Nitrate Solution
Animals and Dosing
Clinical Observation and Mortality
Urinary Examination
Hematology and Blood Biochemistry Examination
Examination of Rat Organs and Tissues
Statistical Analyses
Benchmark Dose-response Modeling
-
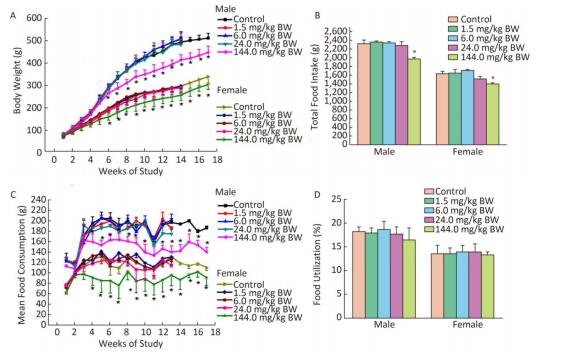
All rats survived to the end of the study, and no treatment-related adverse clinical appearances were found during the 90-day study. Compared with the controls, the body weights of both male and female rats in the 144.0 mg/kg BW treatment group showed a downward trend from the first week and decreased significantly from week 6 to the end of the administration and recovery periods (P < 0.05) (Figure 1A). The food intake of both male and female rats in the 144.0 mg/kg BW treatment group significantly decreased from the fourth week to the end of the administration and recovery periods. There were significant decreases in total food consumption of male and female rats in the 144.0 mg/kg BW treatment group compared with controls (Figure 1C). No significant differences in food utilization ratio were observed between the treatment groups and the control group of either sex (Figure 1D).
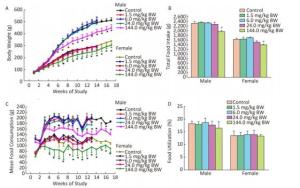
Figure 1. Weekly body weight (A) and total food intake (B), weekly food consumption (C) and food utilization (D) of rats gavaged by different dose of La for 90 days (13 weeks) or 119 days (4 weeks recovery period) (n = 10 in each test group and n = 5 in recovery group; mean ± SD). *P < 0.05, compared with control group.
-
Most of the hematological parameters were not significantly different between treatment groups and the control; however, significant differences were observed in some parameters, including an increase in PT in the 1.5 mg/kg BW dose group and a decrease in WBC and RET at the highest dose in male rats (Table 1). During the recovery period, a decrease in basophils (BAS)% in males and eosinophils (EOS)% in females, a decrease in RET at the 144.0 mg/kg BW dose both in male and female rats, and an increase in monocytes (MON)% and neutrophils (NEUT)% in males were observed.
Parameters Sex End of Treatment Period Dosage (mg/kg BW) End of Recovery Period Dosage (mg/kg BW) 0 1.5 6.0 24.0 144.0 0 144.0 WBC (109/L) F 2.3 ± 0.7 2.4 ± 0.7 2.2 ± 0.6 2.7 ± 0.6 3.0 ± 0.8 2.1 ± 0.2 2.7 ± 0.4 M 5.1 ± 0.9 5.0 ± 0.7 4.5 ± 0.6 5.0 ± 1.2 4.1 ± 0.5* 2.2 ± 0.4 3.3 ± 0.2 RBC (1012/L) F 6.8 ± 0.2 6.7 ± 0.3 6.8 ± 0.4 6.7 ± 0.3 6.7 ± 0.4 7.1 ± 0.2 7.7 ± 0.3 M 7.8 ± 0.4 8.5 ± 0.4* 8.1 ± 0.52 8.0 ± 0.5 8.0 ± 0.5 8.2 ± 0.4 8.3 ± 0.2 HGB (g/L) F 139.3 ± 5.6 140.4 ± 6.9 142.3 ± 8.6 136.7 ± 6.7 140.6 ± 6.8 138 ± 4.1 145.25 ± 4.9 M 157.3 ± 8.1 162.4 ± 8.9 158.2 ± 4.4 151.3 ±7.1 157.2 ± 7.6 149.1 ± 4.0 150.7 ± 4.6 HCT (%) F 39.4 ± 1.4 39.3 ± 2.0 39.6 ± 2.5 38.8 ± 1.6 39.1 ± 2.2 39.8 ± 1.5 42.1 ± 1.51 M 42.3 ± 2.6 44.7 ± 2.6 43.2 ± 1.7 42.2 ± 1.7 43.1 ± 2.4 42.9 ± 1.3 44.3 ± 1.08 MCH (pg) F 20.5 ± 0.9 21.0 ± 0.8 20.8 ± 0.9 20.5 ± 0.5 20.9 ± 0.8 19.1 ± 0.6 18.8 ± 0.4 M 20.1 ± 0.7 19.0 ± 0.5 19.6 ± 0.9 19.0 ± 0.9 19.8 ± 1.3 18.0 ± 1.2 18.0 ± 1.1 MCHC (g/L) F 353.8 ± 10.3 357.0 ± 8.9 359.0 ± 9.1 352.7 ± 7.7 359.6 ± 9.1 346.6 ± 5.8 344.5 ± 2.1 M 372.6 ± 10.0 363.7 ± 6.1 366.8 ± 9.5 358.3 ± 11.3 365.1 ± 11.4 347.8 ± 11.8 339.7 ± 3.5 PLT (109/L) F 801.8 ± 105.0 770.9 ± 89.9 747.6 ± 101.4 740.6 ± 102.1 743.8 ± 90.8 702.8 ± 62.2 726 ± 82.9 M 871.0 ± 118.6 964.2 ± 104.0 861.0 ± 122.8 837.7 ± 62.8 785.1 ± 79.2 867.6 ± 57.8 795.5 ± 127.0 RET (‰) F 9.3 ± 2.5 9.3 ± 4.5 9.0 ± 4.7 9.9 ± 5.0 11.9 ± 4.9 11.6 ± 3.6 7.0 ± 1.7* M 10.7 ± 5.3 10.4 ± 5.1 10.1 ± 3.2 6.6 ± 3.2* 7.7 ± 3.5* 15.6 ± 3.9 9.5 ± 3.6* PT (s) F 13.6 ± 0.6 13.4 ± 0.4 12.8 ± 1.4 13.3 ± 1.1 13.8 ± 0.7 14.7 ± 0.9 14.1 ± 0.3 M 14.0 ± 0.8 17.9 ± 6.1 13.8 ± 0.8 14.0 ± 0.6 14.6 ± 1.3 15.4 ± 0.5 15.4 ± 0.4 APTT (s) F 15.2 ± 1.5 18.0 ± 7.9 16.0 ± 2.2 15.6 ± 2.2 17.0 ± 4.3 14.4 ± 1.2 15.2 ± 1.5 M 22.1 ± 4.2 32.8 ± 18.2* 20.2 ± 3.0 19.8 ± 1.7 22.7 ± 8.9 14.7 ± 1.2 17.6 ± 1.5 LYM (%) F 90.6 ± 2.5 90.4 ± 2.3 90.5 ± 2.1 89.7 ± 3.7 88.5 ± 2.7 86.4 ± 1.8 87.4 ± 1.7 M 93.5 ± 1.9 93.7 ± 2.2 92.8 ± 2.2 91.1 ± 2.3 92.4 ± 2.2 89.2 ± 1.1 87.5 ± 1.3 MON (%) F 1.5 ± 1.0 1.3 ± 1.0 1.5 ± 0.9 1.1 ± 1.1 1.7 ± 1.3 0.6 ± 0.4 0.6 ± 0.3 M 1.3 ± 1.2 1.0 ± 0.7 1.1 ± 0.7 1.1 ± 0.6 1.0 ± 0.8 0.3 ± 0.16 0.5 ± 0.2* NEUT (%) F 6.9 ± 2.3 7.5 ± 2.2 7.4 ± 1.8 7.9 ± 3.3 8.6 ± 3.3 11.2 ± 1.6 11.0 ± 1.4 M 4.7 ± 1.8 4.6 ± 2.4 5.6 ± 2.2 6.8 ± 2.2 6.0 ± 2.6 9.6 ± 1.3 11.3 ± 1.3* BAS (%) F M 0.2 ± 0.3 0.3 ± 0.4 0.2 ± 0.3 0.3 ± 0.5 0.4 ± 0.6 1.4 ± 0.6 0.7 ± 0.3* 0.2 ± 0.1 0.3 ± 0.3 0.1 ± 0.2 0.3 ± 0.3 0.2 ± 0.1 0.6 ± 0.3 0.5 ± 0.2 EOS (%) F 0.8 ± 1.0 0.5 ± 0.3 0.5 ± 0.5 0.9 ± 0.9 0.8 ± 0.8 0.3 ± 0.4 0.2 ± 0.4 M 0.4 ± 0.3 0.4 ± 0.3 0.4 ± 0.2 0.6 ± 0.6 0.4 ± 0.2 0.1 ± 0.1 0.1 ± 0.0* Note. WBC, white blood cell; RBC, red blood cell; HGB, hemoglobin; HCT, red blood cell specific volume; MCH, mean corpuscular hemoglobin; MCHC, mean corpuscular hemoglobin concentration; PLT, platelet count; RET, reticulocyte count; PT, prothrombin time; APTT, activated partial thromboplastin time; LYM, lymphocytes; MON, monocytes; NEUT, neutrophils; EOS, eosinophils; BAS, basophils; F, female; M, male. *P < 0.05, significantly different from controls. Table 1. Hematological Findings in Rats Gavaged with Different Concentrations of Lanthanum Nitrate for 90 Days (n = 10/group; mean ± SD)
-
Compared with controls, there were some significant differences in blood biochemistry, including a decrease in TG at doses of 24.0 and 144.0 mg/kg, an increase in P at the 144.0 mg/kg dose in male rats, and an increase in ALT, AST, GLU, urea, CREA, and Ca in the female group given the highest dose. There were no significant differences in any other parameters (Table 2).
Parameters Sex End of Treatment Period Dosage (mg/kg BW) End of Recovery Period Dosage (mg/kg BW) 0 1.5 6.0 24.0 144.0 0 144.0 ALT (U/L) F 21.0 ± 5.2 21.5 ± 5.7 24.0 ± 6.5 24.2 ± 6.6 32.6 ± 9.9* 30 ± 4.65 34 ± 6.9 M 29.1 ± 3.0 30.9 ± 5.0 34.2 ± 2.6 30.9 ± 6.7 28.4 ± 6.4 29.6 ± 6.8 33.75 ± 7.2 AST (U/L) F 65.8 ± 22.1 64.0 ± 20.9 76.2 ± 13.8 72.2 ± 18.2 91.1 ± 17.8* 82.4 ± 4.1 98.2 ± 3.8 M 105.4 ± 20.2 103.1 ± 19.2 108.5 ± 24.5 104.9 ± 29.1 89.3 ± 22.2 99.8 ± 11.7 103.2 ± 19.0 TP (g/L) F 38.5 ± 17.5 48.0 ± 8.3 49.3 ± 14.2 48.5 ± 14.7 55.5 ± 8.6 58.1 ± 3.3 58.45 ± 1.9 M 50.7 ± 8.8 51.8 ± 5.4 52.8 ± 6.4 50.2 ± 9.9 47.4 ± 8.1 52.1 ± 1.9 52.95 ± 3.5 ALP (U/L) F 59.2 ± 30.3 41.7 ± 15.3 40.0 ± 4.5 42.8 ± 9.4 49.4 ± 14.3 34.4 ± 9.4 49.3 ± 9.3 M 79.3 ± 13.3 78.4 ± 12.7 82.5 ± 15.5 72.2 ± 17.7 74.6 ± 22.9 58.4 ± 14.0 68.25 ± 9.8 ALB (g/L) F 18.8 ± 6.6 21.9 ± 3.8 23.1 ± 5.9 22.5 ± 5.7 25.5 ± 4.1 28.6 ± 1.7 27.2 ± 0.2 M 21.3 ± 4.1 22.2 ± 2.5 22.8 ± 2.3 21.1 ± 3.1 20.5 ± 4.1 23.6 ± 0.6 23.2 ± 0.6 TBIL (μmol/L) F 0.8 ± 0.4 0.8 ± 0.3 0.8 ± 0.2 0.8 ± 0.2 0.8 ± 0.3 1.2 ± 0.3 1.3 ± 0.2 M 1.2 ± 0.4 1.1 ± 0.3 1.1 ± 0.3 1.1 ± 0.3 1.0 ± 0.4 1.0 ± 0.4 1.2 ± 0.3 GLU (mmol/L) F 5.7 ± 1.4 6.3 ± 0.6 6.2 ± 1.0 6.3 ± 1.3 7.0 ± 0.8* 6.3 ± 1.3 6.9 ± 1.2 M 6.7 ± 1.3 6.6 ± 1.2 7.1 ± 1.0 6.6 ± 1.3 6.9 ± 1.0 7.9 ± 1.2 6.7 ± 0.9 Urea (mmol/L) F 5.0 ± 0.7 5.1 ± 0.6 5.4 ± 0.6 5.8 ± 1.3 6.4 ± 1.1* 6.4 ± 1.0 5.7 ± 0.8 M 4.9 ± 0.5 5.3 ± 0.5 5.4 ± 0.3 5.3 ± 0.8 5.6 ± 1.1 5.2 ± 0.4 5.9 ± 0.3 Crea (μmol/L) F 28.8 ± 10.4 36.7 ± 11.2 37.1 ± 8.9 35.0 ± 12.2 41.6 ± 9.2* 26.4 ± 5.6 24.3 ± 2.4 M 35.5 ± 7.7 36.0 ± 4.2 37.6 ± 6.3 34.8 ± 8.4 35.0 ± 11.1 24.6 ± 3.6 21.5 ± 2.2 CHOL (mmol/L) F 1.3 ± 0.5 1.4 ± 0.4 1.5 ± 0.4 1.5 ± 0.5 1.6 ± 0.3 1.8 ± 0.1 1.8 ± 0.4 M 1.3 ± 0.5 1.5 ± 0.4 1.4 ± 0.3 1.5 ± 0.4 1.3 ± 0.3 1.5 ± 0.2 1.5 ± 0.5 TG (mmol/L) F 0.3 ± 0.2 0.3 ± 0.2 0.3 ± 0.2 0.3 ± 0.1 0.4 ± 0.1 0.3 ± 0.1 0.3 ± 0.1 M 0.7 ± 0.3 0.5 ± 0.2 0.5 ± 0.2 0.4 ± 0.2* 0.3 ± 0.3* 0.3 ± 0.07 0.3 ± 0.1 K (mmol/L) F 4.4 ± 0.7 4.3 ± 0.3 4.3 ± 0.2 4.3 ± 0.2 4.3 ± 0.2 4.6 ± 0.2 4.5 ± 0.1 M 4.5 ± 0.4 4.7 ± 0.3 4.4 ± 0.2 4.5 ± 0.3 4.3 ± 0.2 4.9 ± 0.2 4.6 ± 0.3 CL (mmol/L) F 106.8 ± 4.6 107.5 ± 3.2 112.9 ± 5.3 106.7 ± 3.4 105.7 ± 1.2 107.6 ± 0.9 108.2 ± 0.7 M 105.2 ± 6.3 107.0 ± 3.5 106.5 ± 1.3 109.1 ± 4.5 106.0 ± 2.9 107.8 ± 1.4 109.1 ± 0.7 P (mmol/L) F 2.2 ± 0.4 2.0 ± 0.3 2.1 ± 0.3 2.4 ± 0.5 2.5 ± 0.4 2.1 ± 0.2 2.4 ± 0.4 M 2.0 ± 0.3 2.1 ± 0.3 2.2 ± 0.3 2.1 ± 0.3 2.6 ± 0.7* 2.0 ± 0.3 2.3 ± 0.4 Ca (mmol/L) F 1.7 ± 0.4 1.7 ± 0.3 1.9 ± 0.4 1.9 ± 0.3 2.1 ± 0.3* 2.4 ± 0.02 2.3 ± 0.03 M 1.9 ± 0.3 1.9 ± 0.2 2.0 ± 0.2 1.9 ± 0.3 1.8 ± 0.3 2.2 ± 0.07 2.2 ± 0.06 Note. ALT, alanine aminotransferase; AST, aspartate aminotransferase; ALP, alkaline phosphatase; ALB, albumin; TP, total protein; TBIL, total bilirubin; GLU, glucose; Crea, creatinine; CHOL, cholesterol; TG, triglyceride; K, potassium; Cl, chloride; Ca, calcium, P, phosphorous; F, female; M, male. *P < 0.05, significantly different from controls. Table 2. Blood Biochemistry of Rats Gavaged with Different Doses of Lanthanum Nitrate for 90 Days (n = 10/group; mean ± SD)
-
In both male and female rats, there were no signi- ficant differences in any of the 9 urinary parameters between treatment groups and controls (data not shown).
-
The body weights before dissection of both male and female rats were significantly higher in controls versus the highest treatment group (Table 3). In male rats, the organ weights of the liver, spleen, kidney, heart, and thymus in the highest treatment group were significantly lower than those in the controls, and relative brain weight and epididymis weight in male rats increased significantly in the highest treatment group compared with the controls (Table 4). Except for body weight, there were no statistically significant gross pathological alterations in female animals.
Parameters Sex Dosage (mg/kg BW) 0 1.5 6.0 24.0 144.0 Liver (g) M 11.525 ± 0.96 11.208 ± 1.12 10.765 ± 0.95 10.576 ± 2.87 8.494 ± 1.35* F 7.314 ± 1.06 6.549 ± 0.76 6.500 ± 0.77 6.489 ± 1.42 6.338 ± 1.13 Spleen (g) M 0.810 ± 0.05 0.815 ± 0.10 0.790 ± 0.15 0.739 ± 0.79 0.637 ± 0.17* F 0.585 ± 0.06 0.577 ± 0.10 0.598 ± 0.14 0.591 ± 0.04 0.534 ± 0.07 Kidney (g) M 2.870 ± 0.20 2.876 ± 0.23 2.861 ± 0.29 2.718 ± 0.27 2.250 ± 0.30* F 1.608 ± 0.21 1.666 ± 0.15 1.732 ± 0.16 1.587 ± 0.19 1.598 ± 0.14 Heart (g) M 1.466 ± 0.11 1.495 ± 0.11 1.508 ± 0.18 1.386 ± 0.11 1.210 ± 0.07* F 0.977 ± 0.15 0.967 ± 0.09 0.938 ± 0.12 0.936 ± 0.11 0.915 ± 0.06 Brain (g) M 2.111 ± 0.16 2.115 ± 0.14 2.135 ± 0.15 2.122 ± 0.11 2.012 ± 0.07 F 1.997 ± 0.09 1.937 ± 0.07 2.024 ± 0.11 1.927 ± 0.13 1.969 ± 0.10 Thymus (g) M 0.370 ± 0.10 0.330 ± 0.07 0.358 ± 0.10 0.303 ± 0.07 0.269 ± 0.07* F 0.310 ± 0.16 0.304 ± 0.06 0.263 ± 0.07 0.312 ± 0.12 0.266 ± 0.09 Adrenals (g) M 0.053 ± 0.07 0.046 ± 0.07 0.052 ± 0.06 0.058 ± 0.07 0.044 ± 0.06 F 0.070 ± 0.01 0.062 ± 0.01 0.063 ± 0.01 0.065 ± 0.01 0.062 ± 0.00 Testes (g) M 3.266 ± 0.30 3.382 ± 0.36 3.297 ± 0.78 3.390 ± 0.39 3.034 ± 0.37 Epididymides (g) M 1.170 ± 1.37 1.286 ± 1.47 1.237 ± 1.51 1.226 ± 1.48 1.193 ± 1.39 Note. *P < 0.05, significantly different from control. F, female; M, male. Table 3. Absolute Organ Weights of Rats Gavaged with Different Dose of Lanthanum Nitrate for 90 Days (n = 10/group; mean ± SD)
Parameters Sex Dosage (mg/kg BW) 0 1.5 6.0 24.0 144.0 Liver/body weight (%) M 2.30 ± 0.08 2.24 ± 0.17 2.23 ± 0.12 2.11 ± 0.23 2.44 ± 0.62 F 2.49 ± 0.35 2.30 ± 0.14 2.22 ± 0.11 2.47 ± 0.56 2.49 ± 0.35 Spleen /body weight (%) M 0.16 ± 0.02 0.16 ± 0.01 0.16 ± 0.03 0.16 ± 0.02 0.16 ± 0.03 F 0.20 ± 0.02 0.20 ± 0.03 0.21 ± 0.05 0.22 ± 0.01 0.20 ± 0.02 Kidney/body weight (%) M 0.57 ± 0.04 0.58 ± 0.05 0.59 ± 0.06 0.57 ± 0.06 0.57 ± 0.04 F 0.58 ± 0.05 0.59 ± 0.05 0.60 ± 0.03 0.60 ± 0.08 0.58 ± 0.05 Heart/body weight (%) M 0.29 ± 0.01 0.30 ± 0.02 0.31 ± 0.03 0.30 ± 0.03 0.29 ± 0.01 F 0.33 ± 0.04 0.34 ± 0.03 0.32 ± 0.03 0.35 ± 0.05 0.33 ± 0.04 Brain/body weight (%) M 0.42 ± 0.02 0.44 ± 0.03 0.44 ± 0.04 0.45 ± 0.05 0.54 ± 0.02* F 0.70 ± 0.04 0.68 ± 0.05 0.73 ± 0.11 0.73 ± 0.06 0.70 ± 0.04 Thymus/body weight (%) M 0.07 ± 0.02 0.07 ± 0.01 0.07 ± 0.02 0.06 ± 0.03 0.07 ± 0.02 F 0.11 ± 0.02 0.11 ± 0.02 0.10 ± 0.03 0.12 ± 0.05 0.11 ± 0.02 Adrenals/body weight (%) M 0.01 ± 0.00 0.01 ± 0.00 0.01 ± 0.00 0.01 ± 0.00 0.01 ± 0.00 F 0.02 ± 0.00 0.02 ± 0.00 0.02 ± 0.00 0.03 ± 0.00 0.02 ± 0.00 Testes/body weight (%) M 0.65 ± 0.06 0.68 ± 0.05 0.67 ± 0.16 0.72 ± 0.11 0.65 ± 0.06 Epididymides/body weight (%) M 0.25 ± 0.03 0.28 ± 0.02 0.28 ± 0.04 0.29 ± 0.05 0.25 ± 0.03* Note. *P < 0.05, significantly different from control. F, female; M, male. Table 4. Effects of Repeated Oral Exposure to Lanthanum Nitrate for 90 Days on Relative Organ Weights (%) of Rats (n = 10/group; mean ± SD)
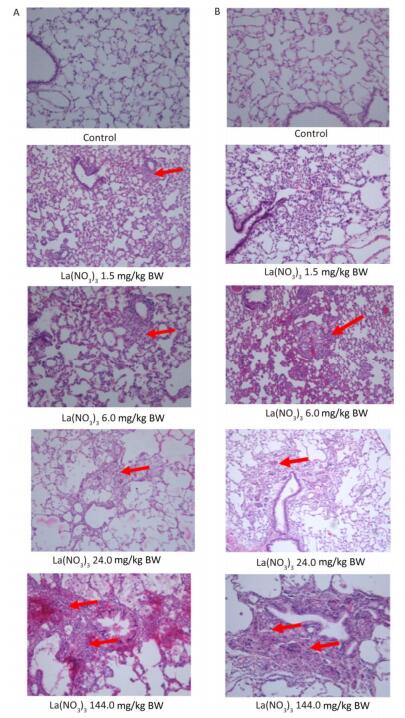
Most of the histopathological findings in all treatment groups were comparable with those in the controls (Table 5). Observations included hepatocyte spotty necrosis, renal interstitial inflammation, testicular atrophy, and the absence of mature sperm in the epididymal duct in individual male specimens, vaginitis in individual female specimens, myocardial cell necrosis, Rathke's cyst, prostatitis, and dacryoadenitis. Based on the historical occurrence rates of chronic inflammation in the heart, liver, kidneys, and lungs of control SD rats from our previous repeated oral exposure toxicological studies, we consider the chronic inflammation observed in the present study to be frequent, spontaneous background changes in SD rats, rather than treatment-related pathological changes. As shown in Figure 2, pulmonary macrophage accumulation and chronic interstitial inflammation were observed in the control animals and in the 1.5 and 6.0 mg/kg BW group, while macrophage accumulation and proliferation and foreign body granuloma was observed in alveolar tissues in the 24.0 and 144.0 mg/(kg·day) treatment groups (Figure 2, Table 5). No abnormalities were detected in other organs and tissues.
Microscopic Lesions Dosage (mg/kg BW) Male Female 0 1.5 6.0 24.0 144.0 0 1.5 6.0 24.0 144.0 Heart Myocardial cell necrosis 2(+) 1(+) -(+) -(+) -(+) -(+) 1(+) -(+) -(+) -(+) Kidney Renal interstitial inflammation -(+) -(+) 1(+) -(+) -(+) -(+) 1(+) -(+) -(+) -(+) Liver Spotty necrosis 4(+) 1(+) 1(+) -(+) 4(+) 3(+) 2(+) 1(+) 2(+) -(+) Testis Testicular atrophy -(+) 1(+) 1(+) -(+) -(+) - - - - - Epididymis No mature sperm -(+) 1(+) -(+) -(+) -(+) - - - - - Vagina Epithelial necrosis - - - - - 1(+) -(+) 1(+) -(+) 1(+) Prostate Prostatitis 2(+) 2(+) 1(+) 3(+) 2(+) - - - - - Harderian Gland Lymphocytic infiltration, dacryoadenitis 2(+) 1(+) 1(+) 1(+) 2(+) 2(+) 1(+) 2(+) 2(+) 0(+) Lung Macrophage accumulation 2(+) 4(+) 3(+) 4(+) 3(+) 3(+) 5(+) 7(+) 3(+) 4(+) -(++) -(+) -(+) 2(++) 2(++) -(+) 1(+) 2(++) 2(++) 0(+) Foreign body granuloma -(+) -(+) -(+) -(+) 1(+) -(+) -(+) -(+) -(+) 1(+) -(++) -(++) -(++) -(++) 1(++) -(++) -(++) -(++) (++) 2(++) -(+++) -(+++) -(+++) 1(+++) 1(+++) -(+++) -(+++) -(+++) 1(+++) 1(+++) -(++++) -(++++) -(++++) -(++++) 0(++++) -(++++) -(++++) -(++++) (++++) 1(++++) Note. Tissues from 10 animals were examined in each group. Numbers of + in the brackets indicate the degree of histopathologic changes: +-minimal; ++-mild; +++-moderate; ++++-severe. Numbers before the brackets indicate the incidence of histopathologic changes. '-' means no observed changes. Table 5. Histopathology Examination of Rats after Lanthanum Nitrate Administration

Figure 2. Pulmonary macrophage accumulation and foreign body granuloma in lung of rats gavaged at different concentrations of lanthanum nitrate for 90 days. Magnification: ×100. A: males; B: females. Arrows refer to macrophage accumulation in 1.5 and 6.0 mg/kg BW, and foreign body granuloma in 24.0 and 144.0 mg/kg BW groups.
-
Body weight was evaluated for BMD determination since the body weight appeared to be the most sensitive target for the effects of lanthanum toxicity. The calculations of BMD and BMDL values are summarized in Table 6. Since they were not divergent, the lowest AIC was used for model comparison, and the Hill model was chosen for BMDL calculations as recommended by the US EPA[32, 22]. Based on tests for goodness-of-fit, the Hill model was acceptable to describe the data for both male and female rats. The BMDLs were determined as 9.4 mg/kg BW (Figure 3A) and 19.3 mg/kg BW (Figure 3B) for female and male animals, respectively. To protect the health of the entire population, BMDL = 9.4 mg/kg could be use conservatively as the point of departure to estimate the health-based guidance values such as a Reference Dose (RfD) or ADI.
Test Models Male Female P for Fit* BMD BMDL P for Fit* BMD BMDL Exponential 2 0.6499 -41.5631 Bad_Completion 0.5933 -78.1534 Bad_Completion Exponential 3 0.6499 -41.5631 Bad_Completion 0.5933 -78.1534 Bad_Completion Exponential 4 < 0.0001 Not_Computed 0 0.0001449 Not_Computed 0 Exponential 5 < 0.0001 Not_Computed 0 < 0.0001 Not_Computed 0 Hill 0.4087 25.0033 19.321 0.7899 32.2593 9.43561 Linear 0.6319 -9999 0.5717 90.8346 64.0651 Polynomial 0.6777 150.437 146.535 0.7729 32.2032 6.17507 Power 0.6319 50.4918 39.7307 0.5717 90.8346 64.0651 Note. *P > 0.1 implies that the model seems to adequately describe the data according to the US EPA BMDS Software. Table 6. BMDs and BMDLs of Lanthanum Nitrate Based on Body Weight from 90-day Repeated Dose Study
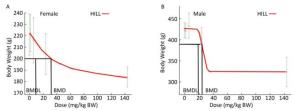
Figure 3. Benchmark dose modeling of lanthanum nitrate for the body weight of rats in the subchronic oral toxicity study. The fit and curve of Hill model with experimental data (A: females; B: males). For each graph, the experimental data are shown in gray (mean ± SD) with the model fit as the red line. The black lines represent the BMD and BMDL calculated based on BMR.
Mortality and Clinical Signs
Hematology
Blood Biochemistry
Urinalysis
Organ Weights and Histopathology
BMD Calculation
-
Lanthanum nitrate is the most common foliar fertilizer used in agriculture, and the highest levels have been found in vegetables and foods, especially in Chinese tea[34], which also is widely consumed on an international scale. Previous studies have shown the toxic potential of lanthanum, including neurobehavioral and cognitive behavioral dysfunctions[35], liver function decline[36], and effects on bone[14, 15], kidneys[16], the spleen[17], and the immune system[18]. Based on the findings that lanthanum may enter the human body through the food chain from agriculture products containing elevated levels of lanthanum residue[4-6] and its reported potential toxicity, more attention should be paid to the food safety risk posed by this element. However, there is very little data from oral repeated-dose toxicological studies to support the establishment of an ADI for lanthanum. As part of lanthanum safety evaluation studies, a 90-day, repeated oral gavage study in rats was conducted in our laboratory in accordance with the guidelines established by the OECD[30], for the testing of chemicals and in compliance with GLP regulations.
According to the Hodge-Sterner classification system, lanthanum is generally considered to be of low toxicity[37]. In animal experiments, it has been shown that prolonged feeding of several milligrams per kilogram body weight La2O3 at a dietary level of 0.5% to mice for three generations had no effect on growth, survival, development, or hematologic parameters, but the growth of some animals, such as rats and guinea pigs, was retarded by prolonged intake of lanthanum in large amounts (La2O3 < 1.0%)[37-39]. Several studies have demonstrated that REEs, like a number of other xenobiotics, follow hormetic concentration-related trends, implying stimulatory or protective effects at low levels, as opposed to adverse effects at higher concentrations[40]. Adverse outcomes of REE exposures include a number of endpoints, such as growth inhibition, cytogenetic effects, and organ-specific toxicity[41].
In the present study, significant decreases in body weight, weight gain, and food consumption were shown in the highest treatment group for both male and female animals. No significant change in food utilization was found between lanthanum treatment groups and controls in either sex, which indicated that there were no nutritional deficiencies in any of the groups. The results suggested that these significant decreases in body weight and food intake were due to long-term exposure to lanthanum, which was consistent with previous reports that chronic exposure to rare earths at high concentrations depresses growth[14, 37, 39]. The mechanism of the inhibitory effects of La remains unclear. Most physiological effects of lanthanides on cells, tissues, or organs are determined by interaction between Ln3+ and the external surfaces of plasmalemmae. Gao[42] demonstrated that La2O3 induced cellular membrane permeabilization through the sequestration of phosphates from membranes. A further mechanistic investigation established that membrane damage induced an increase in intracellular calcium and sustained the overload of mitochondrial calcium, which regulated cell necrosis[42].
As liver tissue sequesters a considerable amount of bioavailable lanthanum, hepatotoxic effects are to be expected and have been reported in previous studies.[13, 15, 33, 39, 40] Cheng found that liver function was disrupted when mice were orally exposed to LaCl3 at 20 mg/kg BW doses for 30 days, as evidenced by the increased ALT, AST, TBIL, total bile acid and TG, and decreased glucose and ratio of ALB to globulin[15]. Liver enzymes such as ALT and AST are important parameters of hepatic dysfunction and damage. Our data showed that ALT and AST activity was significantly elevated while the weight of livers decreased in the highest dose female group. However, a significant decrease was observed in TG in male rats, and no significant changes were observed in other indices. Therefore, it is inferred that liver function was affected by the high-dose La treatment, although it did not trigger the downstream toxic cascades in fat metabolism.
Cheng also reported that lanthanum affected cellular and humoral immunity in animals given 20 mg/kg BW doses for 30 days. Lanthanum reduced the white blood cell, platelet, and reticulocyte counts in mouse blood[18]. A similar phenomenon was observed in the present study. In the highest treatment group, the number of white blood cells and lymphocytes decreased significantly, and the spleen and thymus were significantly smaller than those in the control group; however, there were no consistent changes in relative weight or pathological observations.
Studies have shown that REEs accumulate in the brain[10, 12] and affect neurobehavioral development[36]. However, recent toxicological investigations of yttrium (another REE) revealed that oral exposure of rats to yttrium nitrate at doses up to 45 mg/kg daily had no adverse effects on their neurobehavioral development or cognitive ability[28, 29]. In the present study, a significant increase in the relative brain weights was seen in the highest dose treatment group; however, considering the lower body weights and absence of obvious changes in test animals' neurobehavior, we could not conclude that lanthanum nitrate exposure impaired brain or central nervous system function.
In the present study, pulmonary macrophage accumulation was observed in all the treatment groups, and foreign body granulomas were observed in the highest-dose group. A similar phenomenon was also shown where repeated oral doses of YC13 caused macrophage accumulation and foreign body granulomas in the lungs[27]. Since accidental intratracheal instillations or inhalations of lanthanum solution can lead to the crystallization of lanthanum nitrate and subsequent deposition in the lungs, pulmonary macrophage accumulation and foreign body granulomas could be induced in the lungs[27]. We observed that pulmonary lesions showed a bronchus-derived distribution but not a vascular-stemmed pattern; hence, the lesions were not considered to be related to the systematic distribution of lanthanum nitrate after intragastric administration. After a short-term, repeated intratracheal instillation exposure test was conducted to validate this possibility[27], Wang excluded the lungs as a direct toxic target for lanthanum oral exposure; therefore, we also could not conclude that the lungs were a direct toxic target for lanthanum oral exposure.
Taken together, the results indicate that significant toxicological effects occur from repeated oral dose administration of lanthanum nitrate to SD rats at an oral dose of 144.0 mg/(kg·day) over a 90-day period. Although some significant differences were observed in hematological and blood biochemistry parameters at lower doses (1.5, 6.0, or 24.0 mg/kg BW), these changes were inconsistent, showed no dose-related dependence, and were all within the normal reference ranges for SD rats in our laboratory. Therefore, these alterations were judged to be of no toxicological significance. Thus, the NOAEL is concluded to be 24.0 mg/(kg·day) for lanthanum nitrate in male and female rats (10.3 mg/kg for elemental lanthanum). Considering the vulnerability of developing children to food and environmental contaminants, we adopted a relative conservative uncertainty factor of 200 to estimate the ADI value for lanthanum. Accordingly, an ADI of 51.3 μg/kg BW per day for dietary lanthanum intake was derived by dividing the NOAEL of lanthanum nitrate by the uncertainty factor.
Given the recognized limitations of the conventional NOAEL or LOAEL approach, the BMD approach is now increasingly utilized for toxicological dose-response assessment in health risk evaluation[45]. In this study, BMD modeling with body weight data produced a BMDL for lanthanum nitrate of 9.4 mg/kg BW per day (approximately 40% of the NOAEL value), i.e., 4.04 mg/kg for lanthanum, to ensure an adequate safety margin. Therefore, a default uncertainty factor of 100 was applied to extrapolate the results from rats to humans, and the ADI for lanthanum can be estimated as 40.4 μg/kg. A total diet study showed that the dietary intakes of lanthanum for Chinese adults (BW = 60 kg) was 29.1 μg/d (equivalent to 0.485 μg/kg BW per day), which is significantly lower than the derived ADI of lanthanum[46]. This study should provide basic data the toxicity evaluation and risk assessment of lanthanum thereby facilitating lanthanum and REEs control strategies.

 Quick Links
 DownLoad: