


-
The mortality attributed to organophosphorus (OP) pesticide self-poisoning is an estimated 200, 000 people a year, largely in the Asia-Pacific region[1]. According to the National Management Information System of Public Health Emergencies of China, the total number of OP poisoning incidences reported in China from 2004 to 2014 resulted in 1, 930 people poisoned, with a fatality rate of 6.32%[2]. There were many more OP pesticide poisoning case reports than public health emergencies reported by the system.
Highly toxic OP pesticides were banned from production, sale, and use by the Chinese government since 2008, due to the high toxicity and mortality rate. Chlorpyifos (CPF) was the first recommended alternative OP, its production and use is becoming more common; as a result, poisoning has also increased.
Recently, hemoperfusion (HP) has been used to treat OP poisonings. Activated charcoal and adsorption resin are the two most widely used adsorbents in HP for poisonings. Previous studies used canines[3] or rabbits[4] as the experimental animal model by encheiresis under general anesthesia. However, the procedure is costly and has a low success rate, therefore, it is difficult to justify this type of HP experiment. In this study, we establish a convenient, stable, and economical in vitro model for HP, as well as evaluate the safety and effectiveness of absorbents.
The blood compatibility and nonspecific adsorption of the adsorbent (activated charcoal and adsorption resin) were evaluated by a batch test. Before the test, the adsorbent was equilibrated with a priming solution, which consisted of physiological saline mixed with 2 IU/mL of sodium heparin. We enlisted 16 healthy volunteers (male 9, female 7, age: 23-52) for the batch test. Prior to the experiments, 15 mL of whole blood was taken from each volunteer and anticoagulated with 0.5 IU/mL of sodium heparin and equally and randomly divided into three groups. In the activated charcoal group, 5 mL of whole blood was mixed with 0.5 mL of the activated charcoal adsorbent (YTS-180, Langfang Aier Blood Purification Equipment Factory, Langfang, China) in a polypropylene tube; in the adsorption resin group, 5 mL of whole blood was mixed with 0.5 mL of the adsorption resin adsorbent (HA, Jafron Biomedical Co., Ltd Zhuhai, China) in a polypropylene tube; in the control group, 5 mL of whole blood was drawn and was not mixed with any adsorbent. The polypropylene tubes were incubated at 37 ℃ for 2 h with inversion 30 times/min.
After incubation, the supernatant blood was separated from the adsorbent. Cytometry parameters and the components in the plasma (Table 1) were measured. From the parameters in the blood after incubation with the adsorbent (Ctest) and those in the plasma of the control group (Cctrl), the recovery rate of each component was calculated according to Equation 1.
$$ {\rm{Recovery}}\;{\rm{rate}}\left( {{\rm{ }}\% {\rm{ }}} \right){\rm{ = (}}{{\rm{C}}_{{\rm{test}}}}{\rm{/}}{{\rm{C}}_{{\rm{ctrl}}}}{\rm{)}} \times {\rm{100}} $$ (1) Class Parameters Control Activated Charcoal Adsorption Resin F P Cytometry parameters RBC (×1012/L) 5.20 ± 0.73 5.12 ± 0.75 4.94 ± 0.72 0.524 0.596 HGB (g/L) 148.25 ± 17.33 145.81 ± 17.71 140.69 ± 17.78 0.769 0.469 HCT 0.42 ± 0.04 0.42 ± 0.04 0.41 ± 0.04 0.340 0.713 MCV (fL) 82.34 ± 7.89 82.00 ± 7.81 84.09 ± 8.13 0.320 0.727 MCH (pg) 28.78 ± 3.18 28.78 ± 3.26 28.73 ± 3.15 0.001 0.999 MCHC (g/L) 349.19 ± 10.91 350.19 ± 11.51 341.44 ± 10.80 2.991 0.060 RDW-CV (%) 13.25 ± 0.98 13.25 ± 1.00 13.31 ± 0.95 0.018 0.982 RDW-SD (fL) 39.67 ± 2.30 39.53 ± 2.26 40.84 ± 2.35 1.554 0.222 WBC (×109/L) 5.30 ± 1.53 5.12 ± 1.40 5.01 ± 1.42 0.168 0.846 NEUT# (×109/L) 2.71 ± 0.98 2.53 ± 0.90 2.51 ± 0.90 0.233 0.793 LYMPH# (×109/L) 2.24 ± 0.69 2.25 ± 0.67 2.17 ± 0.63 0.059 0.942 MONO# (×109/L) 0.22 ± 0.10 0.21 ± 0.08 0.20 ± 0.09 0.216 0.806 PLT (×109/L) 204.13 ± 49.72 182.19 ± 45.12 158.81 ± 46.97 3.671 0.033* MPV (fL) 10.24 ± 0.82 10.14 ± 0.81 10.08 ± 0.90 0.125 0.883 PDW (fL) 12.24 ± 1.39 12.01 ± 1.40 11.84 ± 1.41 0.287 0.752 PCT (%) 0.21 ± 0.06 0.18 ± 0.05 0.16 ± 0.05 2.887 0.068 P-LCR (%) 26.62 ± 6.43 26.24 ± 6.16 25.69 ± 6.72 0.075 0.928 Plasma components GLU (mmol/L) 2.92 ± 0.44 2.29 ± 0.58 3.05 ± 0.48 10.564 0.000* TP (g/L) 76.57 ± 5.41 73.86 ± 5.27 72.22 ± 5.31 2.717 0.077 Alb (g/L) 45.25 ± 2.68 43.63 ± 2.63 42.18 ± 2.72 5.239 0.009* Glb (g/L) 31.32 ± 3.85 30.23 ± 3.85 30.03 ± 4.26 0.483 0.620 CHOL (mmol/L) 4.74 ± 0.85 4.55 ± 0.84 4.71 ± 0.87 0.221 0.803 TG (mmol/L) 1.46 ± 1.35 1.41 ± 1.34 1.47 ± 1.37 0.010 0.990 HDL-C (mmol/L) 1.35 ± 0.26 1.32 ± 0.26 1.30 ± 0.27 0.134 0.875 LDL-C (mmol/L) 2.53 ± 0.49 2.44 ± 0.49 2.48 ± 0.49 0.157 0.855 K (mmol/L) 3.87 ± 0.35 3.67 ± 0.25 3.88 ± 0.33 2.287 0.113 Na (mmol/L) 137.88 ± 5.02 138.50 ± 4.72 137.86 ± 5.54 0.081 0.922 Ca (mmol/L) 2.13 ± 0.37 2.13 ± 0.34 2.14 ± 0.39 0.008 0.994 Mg (mmol/L) 0.82 ± 0.13 0.81 ± 0.11 0.78 ± 0.12 0.601 0.553 Cl (mmol/L) 104.05 ± 2.02 104.42 ± 2.52 102.61 ± 3.05 2.229 0.119 TBIL (μmol/L) 12.28 ± 5.75 11.22 ± 5.05 11.31 ± 5.64 0.173 0.842 DBIL (μmol/L) 2.11 ± 1.20 2.26 ± 1.06 2.09 ± 0.76 0.108 0.898 IBIL (μmol/L) 10.17 ± 4.91 9.09 ± 3.89 9.18 ± 5.25 0.245 0.784 UREA (mmol/L) 5.15 ± 1.41 4.46 ± 1.16 4.87 ± 1.28 1.187 0.315 UA (μmol/L) 332.25 ± 74.74 255.31 ± 58.05 263.13 ± 55.14 7.175 0.002* CREA (μmol/L) 70.57 ± 12.88 53.64 ± 10.59 46.13 ± 6.32 23.673 0.000* ALT (U/L) 26.31 ± 16.32 25.25 ± 16.29 24.06 ± 15.15 0.080 0.923 AST (U/L) 26.94 ± 7.89 26.44 ± 7.69 26.38 ± 8.45 0.024 0.977 GGT (U/L) 23.44 ± 11.36 22.81 ± 11.06 22.56 ± 10.74 0.027 0.974 ALP (U/L) 67.81 ± 17.27 65.94 ± 17.36 64.25 ± 16.24 0.177 0.839 ChE (U/L) 8321.88 ± 1660.90 7951.88 ± 1720.70 7963.75 ± 1828.21 0.234 0.792 CK (U/L) 89.06 ± 33.00 85.88 ± 33.61 81.06 ± 32.07 0.240 0.788 LDH (U/L) 245.38 ± 72.33 243.81 ± 44.80 251.56 ± 64.98 0.070 0.932 HBDH (U/L) 145.75 ± 47.88 147.44 ± 19.29 160.75 ± 38.41 0.783 0.463 TSH (mIU/L) 1.70 ± 0.95 1.65 ± 0.90 1.44 ± 0.81 0.380 0.686 T4 (nmol/L) 92.93 ± 10.67 91.78 ± 11.62 83.96 ± 10.76 3.134 0.053 T3 (nmol/L) 1.60 ± 0.24 1.60 ± 0.19 1.31 ± 0.15 11.161 0.000* FT4 (pmol/L) 18.82 ± 2.56 18.31 ± 2.63 17.29 ± 2.07 1.630 0.207 FT3 (pmol/L) 5.01 ± 0.62 5.01 ± 0.55 4.24 ± 0.49 10.256 0.000* Note. *Statistically significant. RBC: red blood cell; HGB: hemoglobin; HCT: hematocrit; MCV: mean corpuscular volume; MCH: mean corpuscular hemoglobin; MCHC: mean corpuscular hemoglobin concentration; RDW-CV: blood cell distribution width-CV; RDW-SD: blood cell distribution width-SD; WBC: write blood cell; NEUT#: neutrophil count; LYMPH#: lymphocyte count; MONO#: monocyte count; PLT: platelet; MPV: mean platelet volume; PDW: platelet distribution width; PCT: platelet crit; P-LCR: platelet-large cell rate. GLU: glucose; TP: total protein; Alb: albumin; Glb: globulin; CHOL: cholesterol; TG: triglyceride; HDL-C: high-density lipoproteincholesterol; LDL-C: low-density lipoproteincholesterol; TBIL: total bilirubin; DBIL: direct bilirubin; IBIL: indirect bilirubin; UA: uric acid; CREA: creatinine; ALT: alanine aminotransferase; AST: alanine aminotransferase; GGT: gamma-glutamyl transpeptidase; ALP: alkaline phosphatase; ChE: cholinesterase; CK: creatine kinase; LDH: lactate dehydrogenase; HBDH: hydroxybutyrate dehydrogenase; TSH: thyroid stimulating hormone; T4: thyroid hormones; T3: triiodothyronine; FT4: free thyroid hormones; FT3: free triiodothyronine. Table 1. ANOVA of Cytometry Parameters and Plasma Components Influenced by Adsorbent (x ± s, n = 16)
In addition, a blood smear image was examined with a microscopic imaging system before and 2 h after the incubation test for the three groups.
An additional 15 mL of whole blood was taken from the same 16 healthy volunteers, 150 μg CPF was dissolved in DMSO and mixed with the whole blood so that the final blood CPF concentration was 10 mg/L. Then, 15 mL of whole blood was grouped and incubated according to the nonspecific adsorption experiment mentioned before.
After incubation, the supernatant blood was separated from the adsorbent. The blood concentration of CPF was measured by gas chromatography (GC). From the parameters in the blood after incubation with the adsorbent (Ctest) and those in the plasma of the control group (Cctrl), the absorption rate of each component was calculated according to Equation 2.
$$ {\rm{Absorption}}\;{\rm{rate}}\left( {{\rm{ }}\% {\rm{ }}} \right){\rm{ = (}}{{\rm{C}}_{{\rm{ctrl}}}}{\rm{ - }}{{\rm{C}}_{{\rm{test}}}}{\rm{)/}}{{\rm{C}}_{{\rm{ctrl}}}}{\rm{ }} \times {\rm{ 100}} $$ (2) The experimental apparatus was set up as shown in Figure 1. Four acrylic resin columns were packed with 20 mL adsorbents. The whole blood used in the following tests was taken from healthy cattle and anticoagulated with 0.5 IU/mL of sodium heparin. A dose of CPF was dissolved in DMSO and mixed with the whole blood. The whole blood contained with CPF was pooled (100 mL) in a thermoregulated (37 ℃) reservoir and then infused into the adsorbent column by roller pump. The effluent was returned to the blood pool (circulated). Samples for the CPF concentrate analyses were taken from the blood pool before perfusion and every 20 min during the perfusion time, and then measured by GC. From the concentrate of CPF in the plasma before perfusion (C0) and that in the plasma at different times during the perfusion time (Cx), the absorption rate of each component was calculated according to Equation 3:
$$ {\rm{Absorption\ rate}}\left( {\rm{\% }} \right){\rm{ = (}}{{\rm{C}}_{\rm{0}}}{\rm{ - }}{{\rm{C}}_{\rm{x}}}{\rm{)/}}{{\rm{C}}_{\rm{0}}}{\rm{ \times 100}} $$ (3) 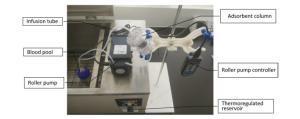
Figure 1. Picture of in vitro model for HP.
All in vitro tests were repeated three times.Taking the blood CPF concentrate (1 mg/L, 10 mg/L, and 100 mg/L), blood flow velocity (2 mL/min, 5 mL/min, and 10 mL/min), adsorbent (no adsorbent, activated charcoal, and adsorption resin), and perfusion time (0 min, 20 min, 40 min, 60 min, 80 min, 100 min, and 120 min) as indices, the absorption rate of CPF was screened by an L27 (71 × 33) orthogonal design.
Blood cell counts were measured using a blood cell counter (XE-5000, Sysmex Corporation, Kobe, Japan). Other plasma components were measured with an automatic biochemistry analyzer (DXC800, Beckman Coulter Inc, USA). Measurement of blood concentration of CPF was according to the methods of reference by GC-ECD[5].
The data analysis was performed with SPSS Ver. 16.0 software for Windows (SPSS Inc., Chicago, USA). Parameters among multiple groups were compared with one-way analysis of variance (ANOVA).
The platelet (PLT) count among the three groups was statistically significant (Table 1). Other types of cells incubated with the adsorbent were smoothly, and there was no statistical significance among the three groups. Supplmentary Figure S1 (available in www.besjournal.com) show that there was no distinct change in hemocyte morphology in the incubation test among the three groups.
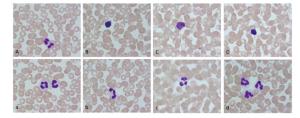
Figure Supplementary Figure S1. Change of hemocyte morphology in incubation test (Wright-Giemsa Stain, 10×100). (A and a) Before incubation; (B and b) After 2 h incubation in control group; (C and c) After 2 h incubation in active charcoal group; (D and d) After 2 h incubation in adsorption resin group.
The glucose (GLU), albumin (Alb), uric acid (UA), creatinine (CREA), triiodothyronine (T3), free triiodothyronine (FT3) among the three groups were statistically significant. There was no statistically significant difference among the three groups for the other plasma components (Table 1).
CPF concentrations among the three groups were statistically significant (F = 798.110, P = 0.000). Supplmentary Figure S2 (available in www.besjournal.com) shows the absorption rate of CPF among the three groups during the batch test.

Figure Supplementary Figure S2. Bar chart of absorption rate of CPF in incubation test.
The orthogonal test results for the absorption rate of CPF are shown in Supplmentary Table S1 (available in www.besjournal.com). All the factors including perfusion time (F = 378.477, P = 0.000), adsorbent (F = 860.742, P = 0.000), blood CPF concentrate (F = 134.321, P = 0.000), and blood flow velocity (F = 89.044, P = 0.000) significantly influenced the absorption rate of CPF. The order of factors affecting the absorption rate was perfusion time > adsorbent > blood CPF concentrate > blood flow velocity. Orthogonal experiments also indicated the optimal prescription as follows: C1V1H2T7.
No. C V H T Absorption Rate (%) 1 2 3 Mean 1 2 3 3 6 84.34 83.98 82.58 83.63 2 2 3 2 2 10.01 20.69 9.42 13.37 3 1 3 2 3 76.46 77.89 82.78 79.04 4 1 3 3 4 71.94 71.95 70.69 71.53 5 3 1 3 7 78.55 78.79 77.58 78.31 6 1 2 2 7 92.34 93.28 97.80 94.47 7 3 2 2 1 0.00 0.00 0.00 0.00 8 3 3 1 2 24.17 11.66 7.84 14.56 9 1 1 1 1 0.00 0.00 0.00 0.00 10 3 3 3 5 75.55 74.40 70.67 73.54 11 3 1 1 2 22.17 13.64 9.84 15.22 12 3 2 3 3 60.54 56.03 56.84 57.80 13 2 2 1 5 14.14 14.74 9.48 12.79 14 2 1 3 1 0.00 0.00 0.00 0.00 15 1 2 3 2 43.50 44.70 46.60 44.93 16 3 2 1 4 13.13 16.21 12.26 13.87 17 1 2 1 6 11.09 8.76 7.32 9.06 18 1 3 1 1 0.00 0.00 0.00 0.00 19 2 1 2 4 83.20 82.38 82.99 82.86 20 2 2 2 2 32.81 37.50 31.66 33.99 21 2 2 3 1 0.00 0.00 0.00 0.00 22 2 3 1 7 4.65 11.63 16.80 11.03 23 1 1 3 2 43.50 44.70 47.60 45.27 24 2 1 1 3 19.97 15.91 9.11 15.00 25 3 3 2 1 0.00 0.00 0.00 0.00 26 1 1 2 5 85.72 86.51 85.45 85.89 27 3 1 2 6 74.73 76.27 80.61 77.20 $ \overline {{K_1}} $ 47.80 44.42 10.17 0.00 $ \overline {{K_2}} $ 31.66 29.66 51.87 27.89 $ \overline {{K_3}} $ 28.07 38.52 50.56 50.61 $ \overline {{K_4}} $ 56.08 $ \overline {{K_5}} $ 57.41 $\overline {{K_6}} $ 56.63 $ \overline {{K_7}} $ 61.27 R 19.73 14.76 41.70 61.27 Note.C: Blood CPF concentrate; V: Blood flow velocity; H: Adsorbent; T: Perfusion during time. Table Supplementary Table S1. Results of Orthogonal Test
Hemoperfusion is an adsorption therapy widely applied to clinical practice. In 1948, Muirhead was the first to use a resin adsorbent, and began experimenting on dogs to perform blood perfusion[6]. HP experiments are also performed on rabbits through catheterization[4]. The animal experiment not only complex but also against animal ethics rules and the principles of '3R'. The study and practice of alternative methods (the in vitro test) are important to balance the conflict between animal protection and animal experimentation. In the current study, we used whole blood from volunteers and cattle instead of living animals for evaluation of activated charcoal and adsorption resin used in whole blood HP for CPF poisoning.
Common HP adsorbents include activated carbon and adsorption resin. The surface of activated charcoal absorbents is coated with an envelope, and the adsorption resin itself has good mechanical strength and chemical stability. In this in vitro experimental study, although the platelet count of the adsorption resin group after the incubation test decreased more than 10%, there was no statistical significance for the other cytometry parameters between the experimental groups and the control group. The blood smear image also shows that there was no distinct change in the hemocyte morphology among the three groups, indicating that both types of materials have good histocompatibility.
The activated carbon and adsorption resin possess abundant middle and large holes, large specific surface area, and relatively specific adsorption of fat-soluble middle molecular and macromolecular toxins, as well as protein-bound drugs. Therefore, it has no obvious effect on electrolyte ions with small particle size. The current study found that there were no changes in the ions Na+, K+, Cl-, Mg2+, and Ca2+ after a 2 h incubation with the absorbents. Both absorbents engage in non-specific physical absorption, and not only effectively reduced the concentration of CPF, but additionally, endogenous metabolites such as CREA and UA and thyroid hormones such as T3 and FT3 were eliminated. In addition, in a batch test, the adsorbent did clear plasma proteins, particularly plasma albumins with small molecular weight (approx. 66 kD). Compared with the control group, the plasma albumin level decreased after 2 hours of incubation. HP has less effect on globulins with large molecular weights (approx. 150 kD), which may be explained by the specific bore diameter of the absorbents. They did not affect the concentration of major blood components such as enzymes, bilirubin, electrolytes, and lipoproteins. These results indicate that the adsorption characteristics of both adsorbents are almost the same as other adsorbents that can selectively adsorb external toxins without causing major changes to the concentration of useful components.
It is generally believed that the slower the blood flow speed, the higher the adsorption rate and the shorter the time required reach adsorption equilibrium. This in vitro study showed that an infusion speed of 2 mL/min could effectively eliminate CPF, and a higher infusion speed (5 mL/min or 10 mL/min) will do little to improve the elimination rate. The same as the bath test, in vitro HP also indicated that absorbents could eliminate CPF; however, the difference in adsorbability of both absorbents was not obvious. Our study and other research indicate that in vitro HP apparatus has a high adsorption rate. For perfusion that is completed within 60 min, the adsorption rate increased even though the adsorption rate was stabilized, which may have occurred because the adsorbent is saturated within 60 min[9].
Theoretically, to prove that HP therapy has an obvious curative effect on poison intoxication, one must decrease the concentration of toxins to a point that enables the changes in blood parameter levels and the decrease of toxicant concentration in the peripheral blood, target organs, and histiocytes to shorten the course of the disease for a full recovery. Previous research focused on whether HP could accelerate the recovery of cholinesterase activity and decrease the fatality rate of severe OP poisoned patients through animal experiments and clinical studies[9]. In the current study, we developed an in vitro bath test and HP test for evaluation of the effectiveness and safety of whole blood HP. These in vitro tests were more convenient and economical than animal experiments and clinical research. Nonetheless, it is obvious that it would not suffice if an in vitro test was performed instead of an in vivo test because it cannot modify the metabolism and physiological response of organisms.
In conclusion, activated charcoal and adsorption resin for whole-blood HP were successful in adsorbing CPF directly from whole blood without causing undesirable changes in the concentration of major blood components. Furthermore, the adsorbents showed the appropriate characteristics in terms of good blood cell passage, sufficient structural strength, and absence of globulicidal behavior. The parameters for in vitro HP were confirmed by orthogonal test. The results will be used for further clinical research.
The authors declare that no potential conflicts of interest exist.
HTML
the Research Project of Health and Family Planning Commission of Shenzhen Municipality SZFZ2017026
Research Project of Shenzhen Commission on Innovation and Technology JCYJ20170307145400143

 Quick Links
 DownLoad:

