

-
Cirrhosis and other chronic liver diseases are significant public health burdens worldwide. Liver cirrhosis, the end-stage of different chronic liver diseases, is often neglected until complications occur[1,2]. Globally, current estimates indicate that more than 50 million adults have chronic liver disease[3-5]. According to the Global Burden of Disease Study 2010 (GBD 2010), liver cirrhosis caused approximately 1 million or 2% of global deaths and 31 million or 1.2% of total disability-adjusted life-years (DALYs)[6,7]. In GBD 2016, there were approximately 1.6 million incidence cases of cirrhosis and other chronic liver diseases, 45.8 million prevalence cases, and 1.3 million deaths, contributing to 38.9 million DALYs[8-10]. In China, approximately 300 million people are affected by liver disease, and China accounts for 11% of global cirrhosis deaths[11,12]. Thus, China plays an important role in the global burden of liver disease.
Several types of liver diseases, including chronic hepatitis B virus (HBV) and hepatitis C virus (HCV) infection, alcoholic liver disease (ALD), non-alcoholic fatty liver disease (NAFLD), and other liver diseases, potentially threaten a large percentage of the global population, especially in China, where HBV and HCV infections are endemic, and ALD and NAFLD have become leading causes of chronic liver diseases[11]. HBV and HCV are leading causes of liver cirrhosis[13]. Globally, approximately 257 million people were living with chronic HBV infection in 2015, accounting for 3.5% of the population worldwide [14]. China had the highest burden of chronic HBV[15]. An estimated 150 million people were infected by HCV, and China had greatest HCV-infected population, with an absolute number of 9.8 million[11,16,17]. Alcohol consumption also represents an important cause of the development of cirrhosis. Globally, liver cirrhosis attributable to alcohol use in 2010 led to an estimated 493,300 deaths and 14,544,000 DALYs, accounting for 47.9% of all liver cirrhosis deaths and 46.9% of all liver cirrhosis DALYs[18]. The trend in alcohol consumption has considerably increased in China over the last three decades [19]. Because of increased alcohol consumption, alcohol-attributable liver disease has gradually become the second leading cause of late-stage liver disease in China[19].
Despite the importance of chronic liver disease, epidemiological data remain scarce in China. Thus, this study aims to describe the current trends in the health burden of cirrhosis and other chronic liver diseases in China through estimates of prevalence, mortality, and DALYs on the basis of the GBD 2016 study, which will provide information for decision-makers.
-
In this study, all age-sex-province-specific data in China were obtained from GBD 2016. The GBD 2016 study provided a comprehensive and up-to-date evaluation of related health metrics for all major diseases and injuries in 195 countries from 1990 to 2016[5,8]. We assessed the burden of cirrhosis and chronic liver diseases due to various causes by collecting data on prevalence, mortality, and DALYs by sex, age groups, and provinces in China. A total of 33 provinces were analyzed, including 31 mainland regions and the Hong Kong and Macao Special Administrative Regions. Moreover, these provinces were classified into 3 levels on the basis of the Socio-demographic Index (SDI), including low-middle (Gansu, Guizhou, and Tibet), middle (other provinces except low-middle and high-middle areas), and high-middle (Hong Kong, Beijing, Guangdong, Jiangsu, Macao, Shanghai, Tianjin, and Zhejiang). The SDI is a summary indicator of income per capita, average years of education in people older than 15 years, and total fertility rate[20].
The general methodologies used in GBD 2016, as well as specific methodology used for cirrhosis and other chronic liver diseases in China, have been described elsewhere[8,9,21]. In belief, the Bayesian meta-regression tool DisMod-MR 2.1 was applied to address the challenge in estimating epidemiological measurement indicators[8]. DALYs were calculated by adding years of life lost (YLLs) and years lived with disability (YLDs), and age-standardized results were calculated based on the GBD reference population in the GBD 2016 study, which can be found in the appendix of the reference paper[10]. The 95% uncertainty interval (UI) was calculated using the 25th and 975th values from 1,000 estimated values[8]. Moreover, the combination of cross-sectional and birth cohort analysis of mortality better reflected the effects of age, time, and risk factors on disease. Linear correlation analysis, which was conducted using SPSS 21.0, was used to verify the relationship between SDI values and age-standardized mortality and DALY rates by provinces. P values were based on two-tailed tests with a significance level of less than 0.05.
-
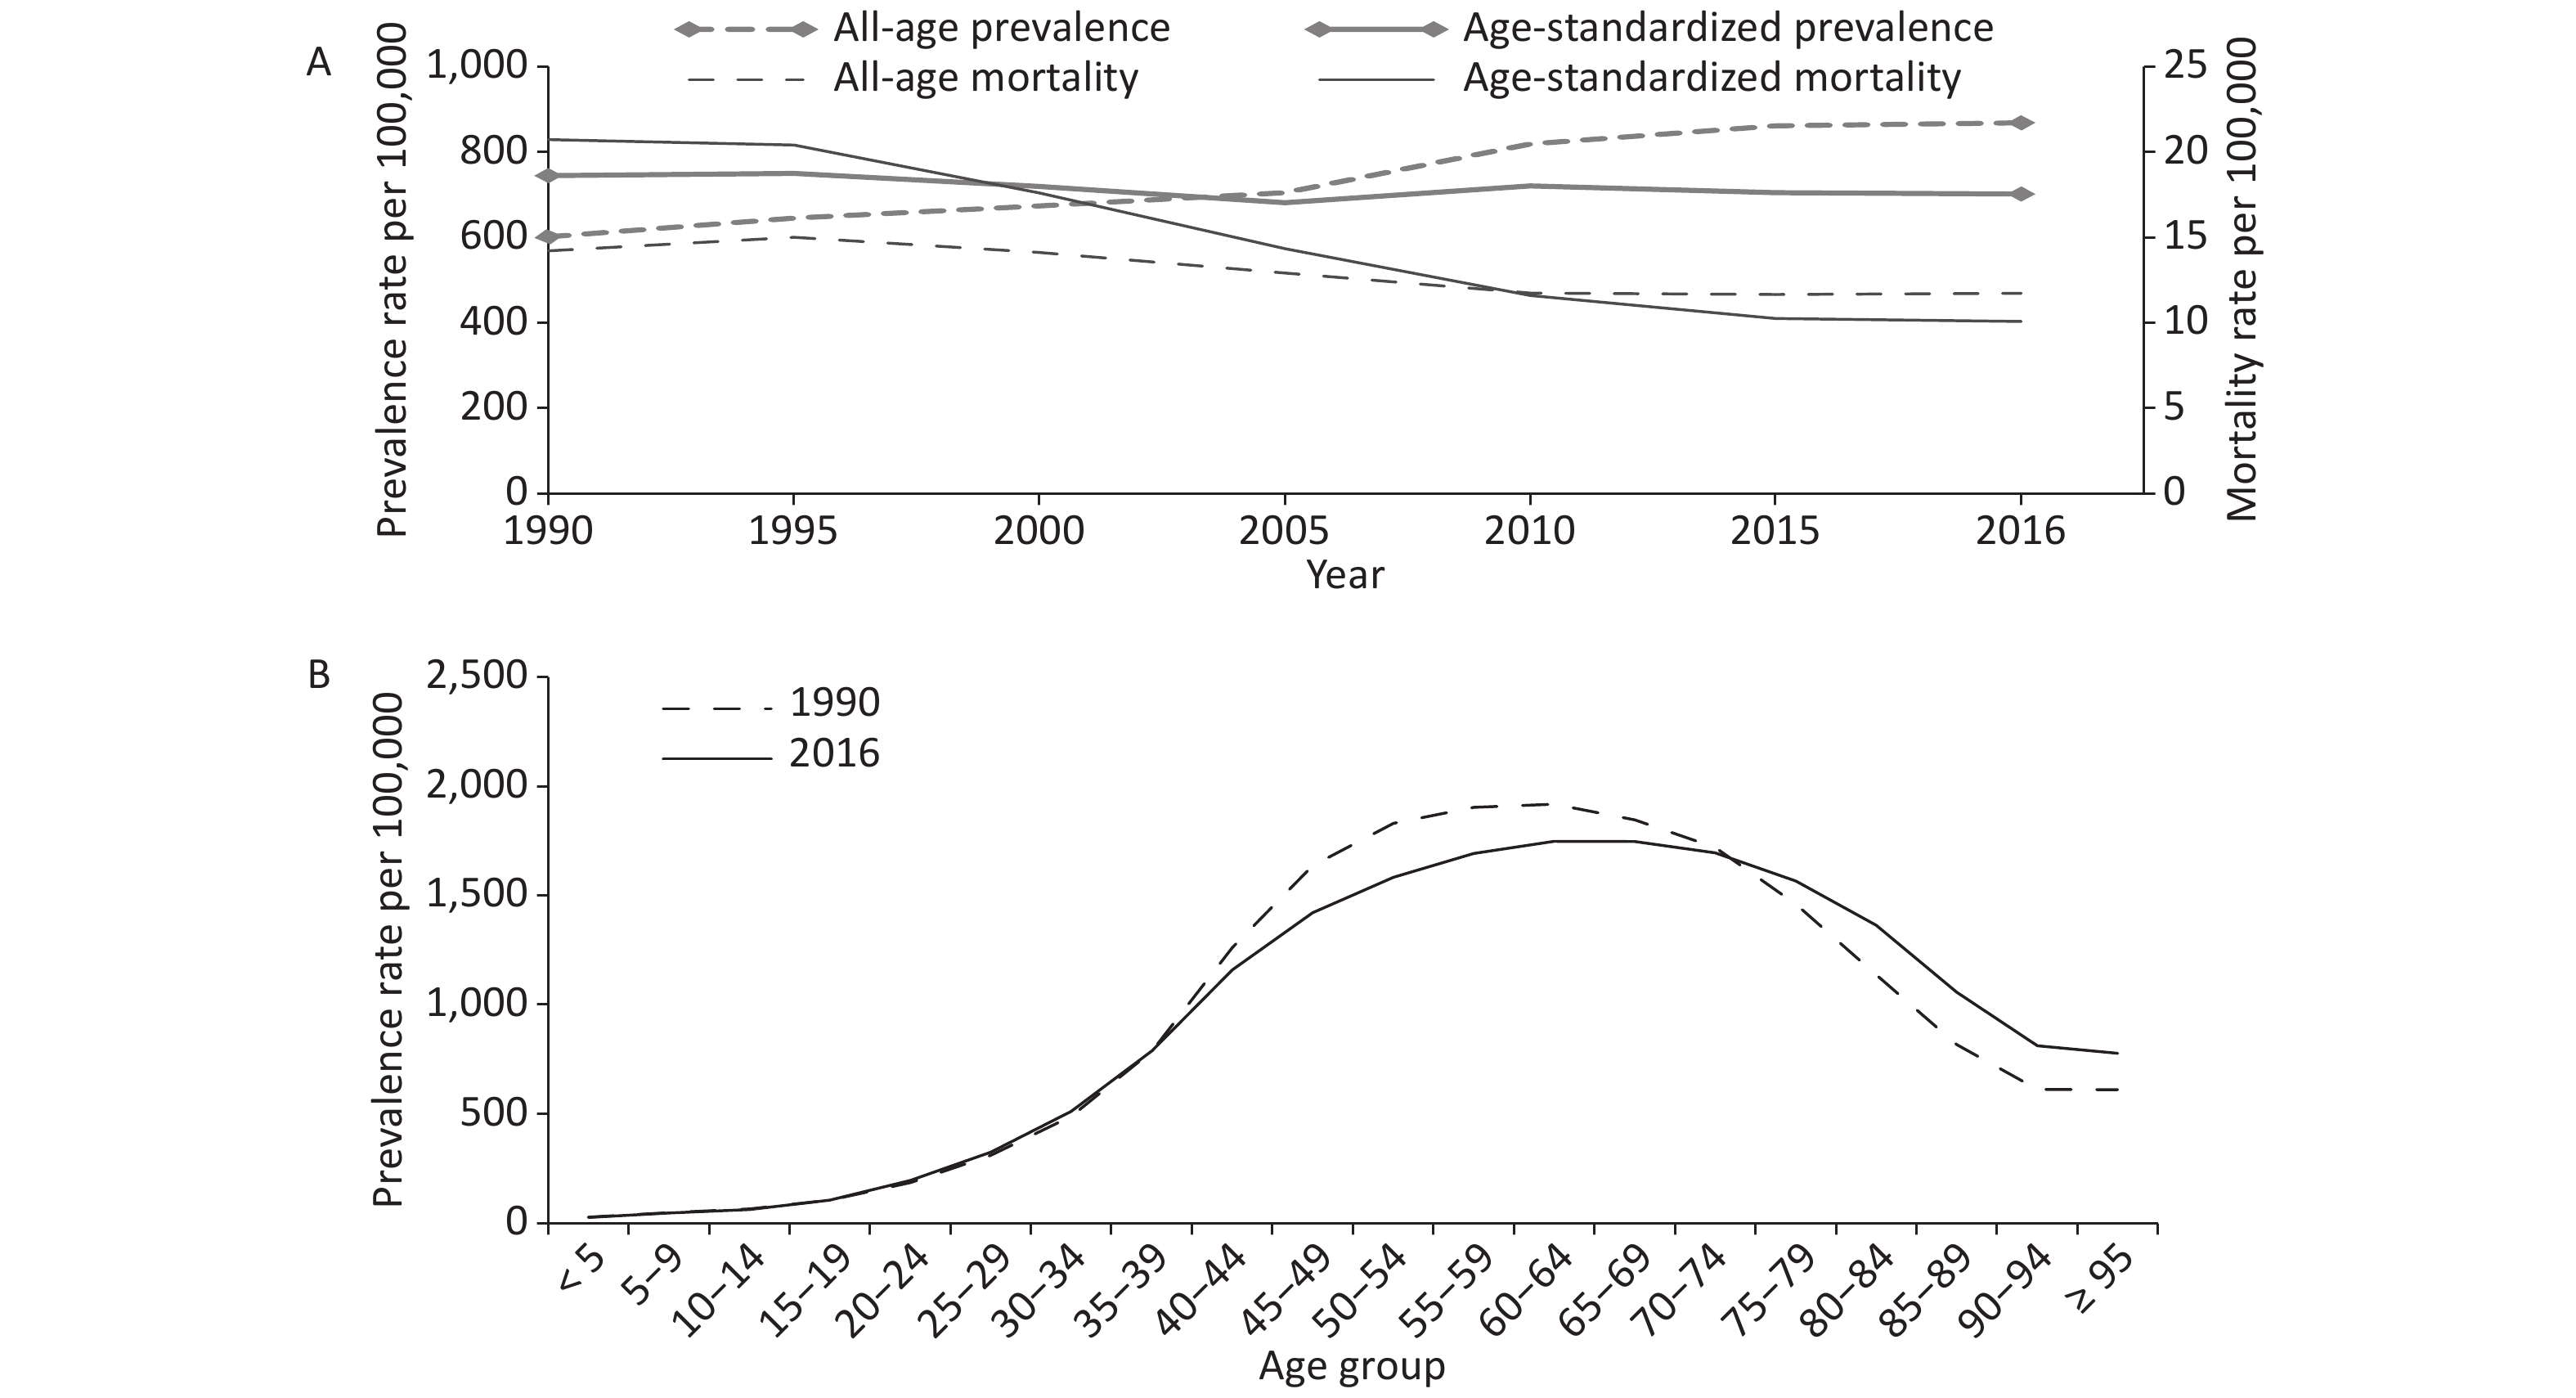
From 1990 to 2016, the prevalence cases in thousands of cirrhosis and other chronic liver diseases increased by 73.7% from 6833.3 (95% UI: 6498.0–7180.6) to 11869.6 (95% UI: 11274.6–12504.7). And it was estimated that there were 161.4 thousand (95% UI: 141.4–171.8) deaths in 1990, falling to 160.3 thousand (95% UI: 149.2–191.4) in 2016, a decrease of 0.7%. Sex-specific analysis suggested that males had more prevalence cases and deaths than females, and age-standardized prevalence and mortality rates among males were higher than females in 1990 and 2016 (Table 1). All-age prevalence rates per 100,000 displayed gradually upward trends, rising by 44.4% from 601.5 (95% UI: 572.0–632.1) in 1990 to 868.3 (95% UI: 824.8–914.7) in 2016. In contrast, age-standardized prevalence rates per 100,000 declined by 5.8% from 744.6 (95% UI: 708.1–783.0) to 701.7 (95% UI: 667.3–737.2). From 1990 to 2016, the all-age mortality rate per 100,000 population declined by 17.6% from 14.2 (95% UI: 12.4–15.1) to 11.7 (95% UI: 10.9–14.0). Likewise, the age-standardized mortality rate per 100,000 decreased considerably by 51.2% from 20.7 (95% UI: 18.4–22.0) to 10.1 (95% UI: 9.4–11.9) (Figure 1A).
Characteristics Prevalence Mortality Number in thousands Age-standardized
rate per 100,000Number in thousands Age-standardized
rate per 100,0001990 2016 1990 2016 1990 2016 1990 2016 Overall 6833.3
(6498.0−7180.6)11869.6
(11274.6−12504.7)744.6
(708.1−783.0)701.7
(667.3−737.2)161.4
(141.4−171.8)160.3
(149.2−191.4)20.7
(18.4−22.0)10.1
(9.4−11.9)Sex Male 5423.0
(5144.6−5701.9)9659.3
(9154.5−10197.4)1177.6
(1116.4−1241.5)1121.6
(1064.8−1180.8)107.9
(83.7−117.5)120.4
(110.0−150.6)27.2
(21.1−29.6)15.1
(13.8−18.8)Female 1410.3
(1338.9−1486.7)2210.2
(2087.9−2333.8)299.7
(284.9−316.0)278.3
(263.2−294.3)53.5
(49.8−58.9)39.9
(37.4−42.1)14.3
(13.3−15.8)5.2
(4.9−5.5)Specific etiologies Hepatitis B 3230.2
(3003.8−3459.1)5802.2
(5400.0−6207.8)360.7
(336.6−386.3)339.7
(317.1−362.7)79.3
(69.2−85.5)81.2
(74.1−98.2)10.3
(9.1−11.1)5.1
(4.7−6.2)Hepatitis C 848.3
(766.5−938.4)1583.0
(1425.5−1746.3)94.5
(85.6−104.5)90.4
(81.7−99.3)18.4
(15.0−20.7)20.0
(17.6−25.0)2.3
(1.9−2.6)1.2
(1.1−1.5)Alcohol use 958.5
(876.9−1045.7)1788.4
(1630.4−1955.8)109.7
(100.2−119.6)102.1
(93.4−111.2)23.5
(20.1−25.9)24.6
(22.1−29.9)3.1
(2.7−3.4)1.5
(1.4−1.8)Other causes 1796.2
(1603.5−2006.5)2696.0
(2367.1−3061.9)179.7
(159.7−203.6)169.5
(150.7−190.9)40.3
(35.2−46.0)34.5
(29.5−41.3)5.1
(4.4−5.8)2.2
(1.9−2.7)Note. Data in parentheses are 95% uncertainty intervals. Table 1. Prevalence cases and deaths and age-standardized rates of cirrhosis and other chronic liver diseases by gender, by specific etiologies in China, 1990 vs. 2016
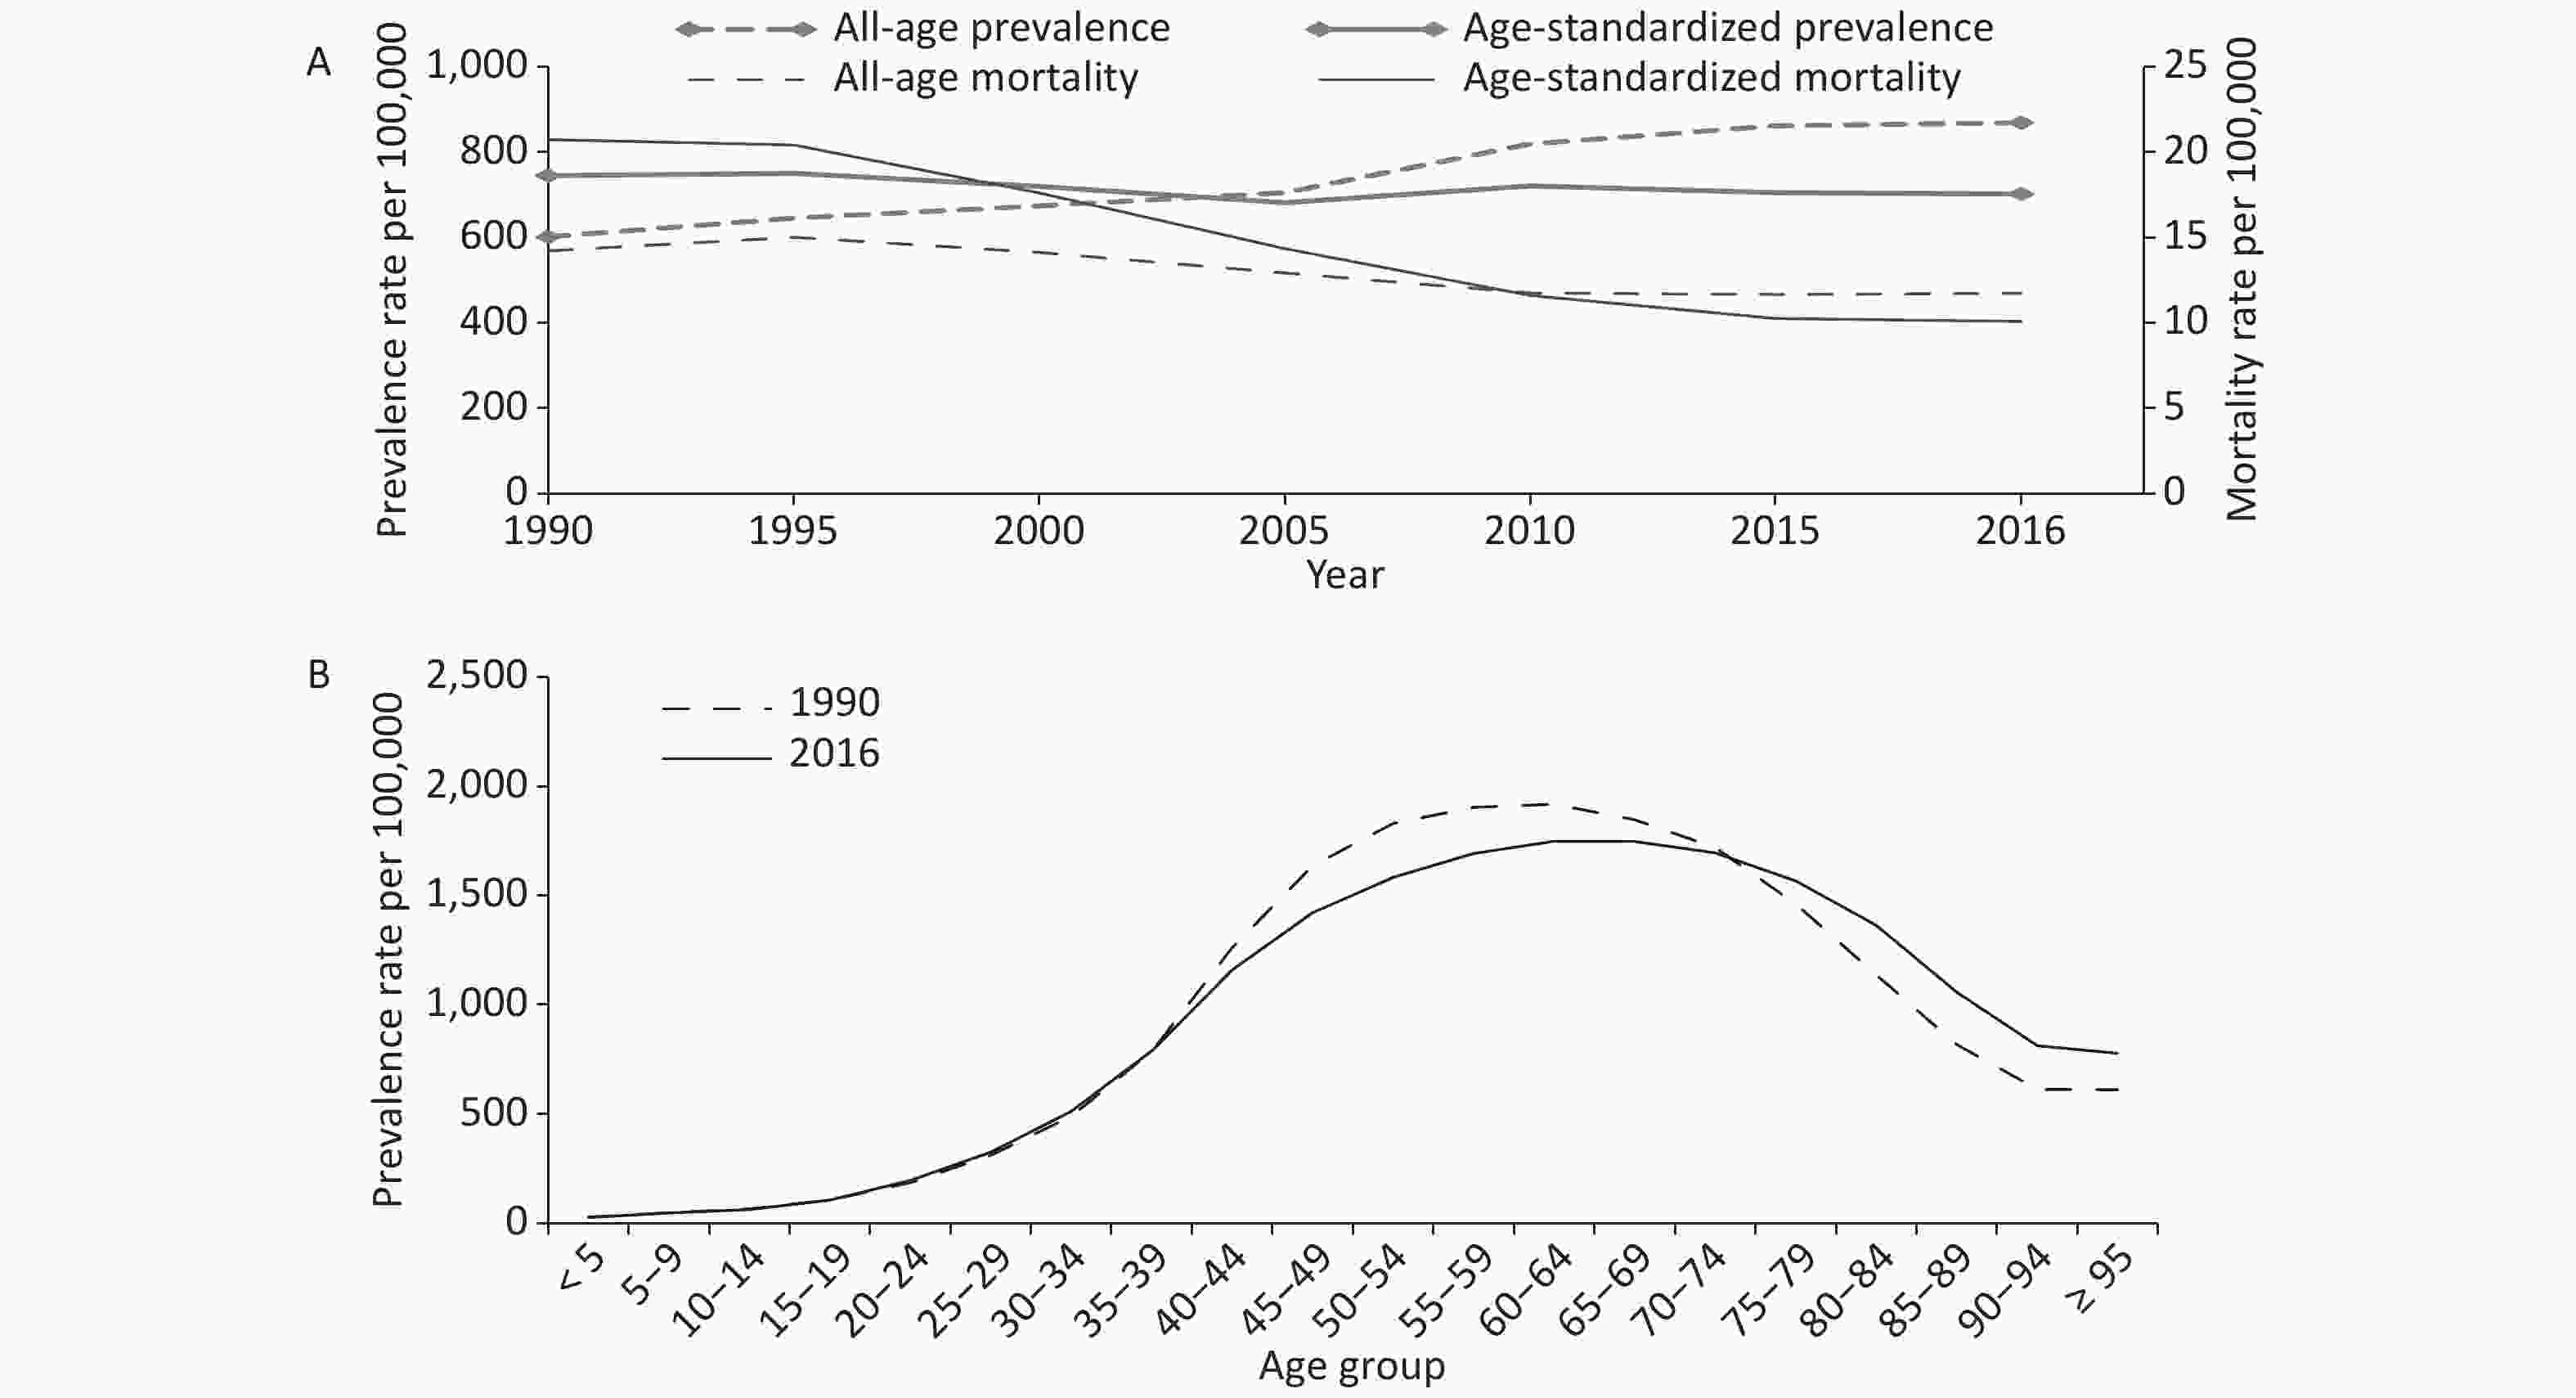
Figure 1. Trends in China from 1990 to 2016 for (A) all-age and age-standardized prevalence and mortality rates of cirrhosis and other chronic liver diseases, and (B) prevalence rates of cirrhosis and other chronic liver diseases by age groups
From 1990 to 2016, the prevalence of cases due to HCV and alcohol consumption increased markedly (86.6%). However, the age-standardized prevalence per 100,000 cases of cirrhosis and other chronic liver diseases attributable to alcohol use declined by 6.9% from 109.7 (95% UI: 100.2–119.6) to 102.1 (95% UI: 93.4–111.2), followed by HBV (5.8%), other causes (5.7%), and HCV (4.3%). The number of deaths due to HCV increased by 8.7%, followed by alcohol use (4.7%) and HBV (2.4%). In contrast, the number of deaths due to other causes decreased by 14.4%. Age-standardized mortality rates per 100,000 attributable to other causes declined by 56.9% from 5.1 (95% UI: 4.4–5.8) to 2.2 (95% UI: 1.9–2.7), followed by alcohol use (51.6%), HBV (50.5%), and HCV (47.8%) (Table 1).
All-age prevalence rates increased by 44.4% from 1990 to 2016, especially in people aged ≥ 75 years, whereas a downward trend occurred in those aged 40–74 years (Figure 1B). Figure 2A shows that with increased age, the total number of deaths increased first and then decreased between 1990 and 2016, and the largest number of deaths was observed in the 60–64 year age range. Compared with 1990, deaths among most age groups increased except for those aged ≤ 44 years and 55–59 years in 2016. Figure 2B presents the cross-sectional analysis of mortality by age group from 1990 to 2016. Mortality rates in all age groups decreased gradually from 1990 to 2016. Moreover, in the same period, mortality increased gradually with age, and those aged ≥ 95 years had the highest mortality rate. Figure 2C depicts the estimated mortality of cirrhosis and other chronic liver diseases varied significantly by birth year. The mortality rates were greater for people born in the earlier years than those born in the later years. Mortality rates increased with age in most birth cohorts, while in three birth cohorts (1905–, 1910–, and 1915–) decreased significantly in those aged 90–94 years. To some extent, the analysis of people born in the same period could provide more objective and valid information.
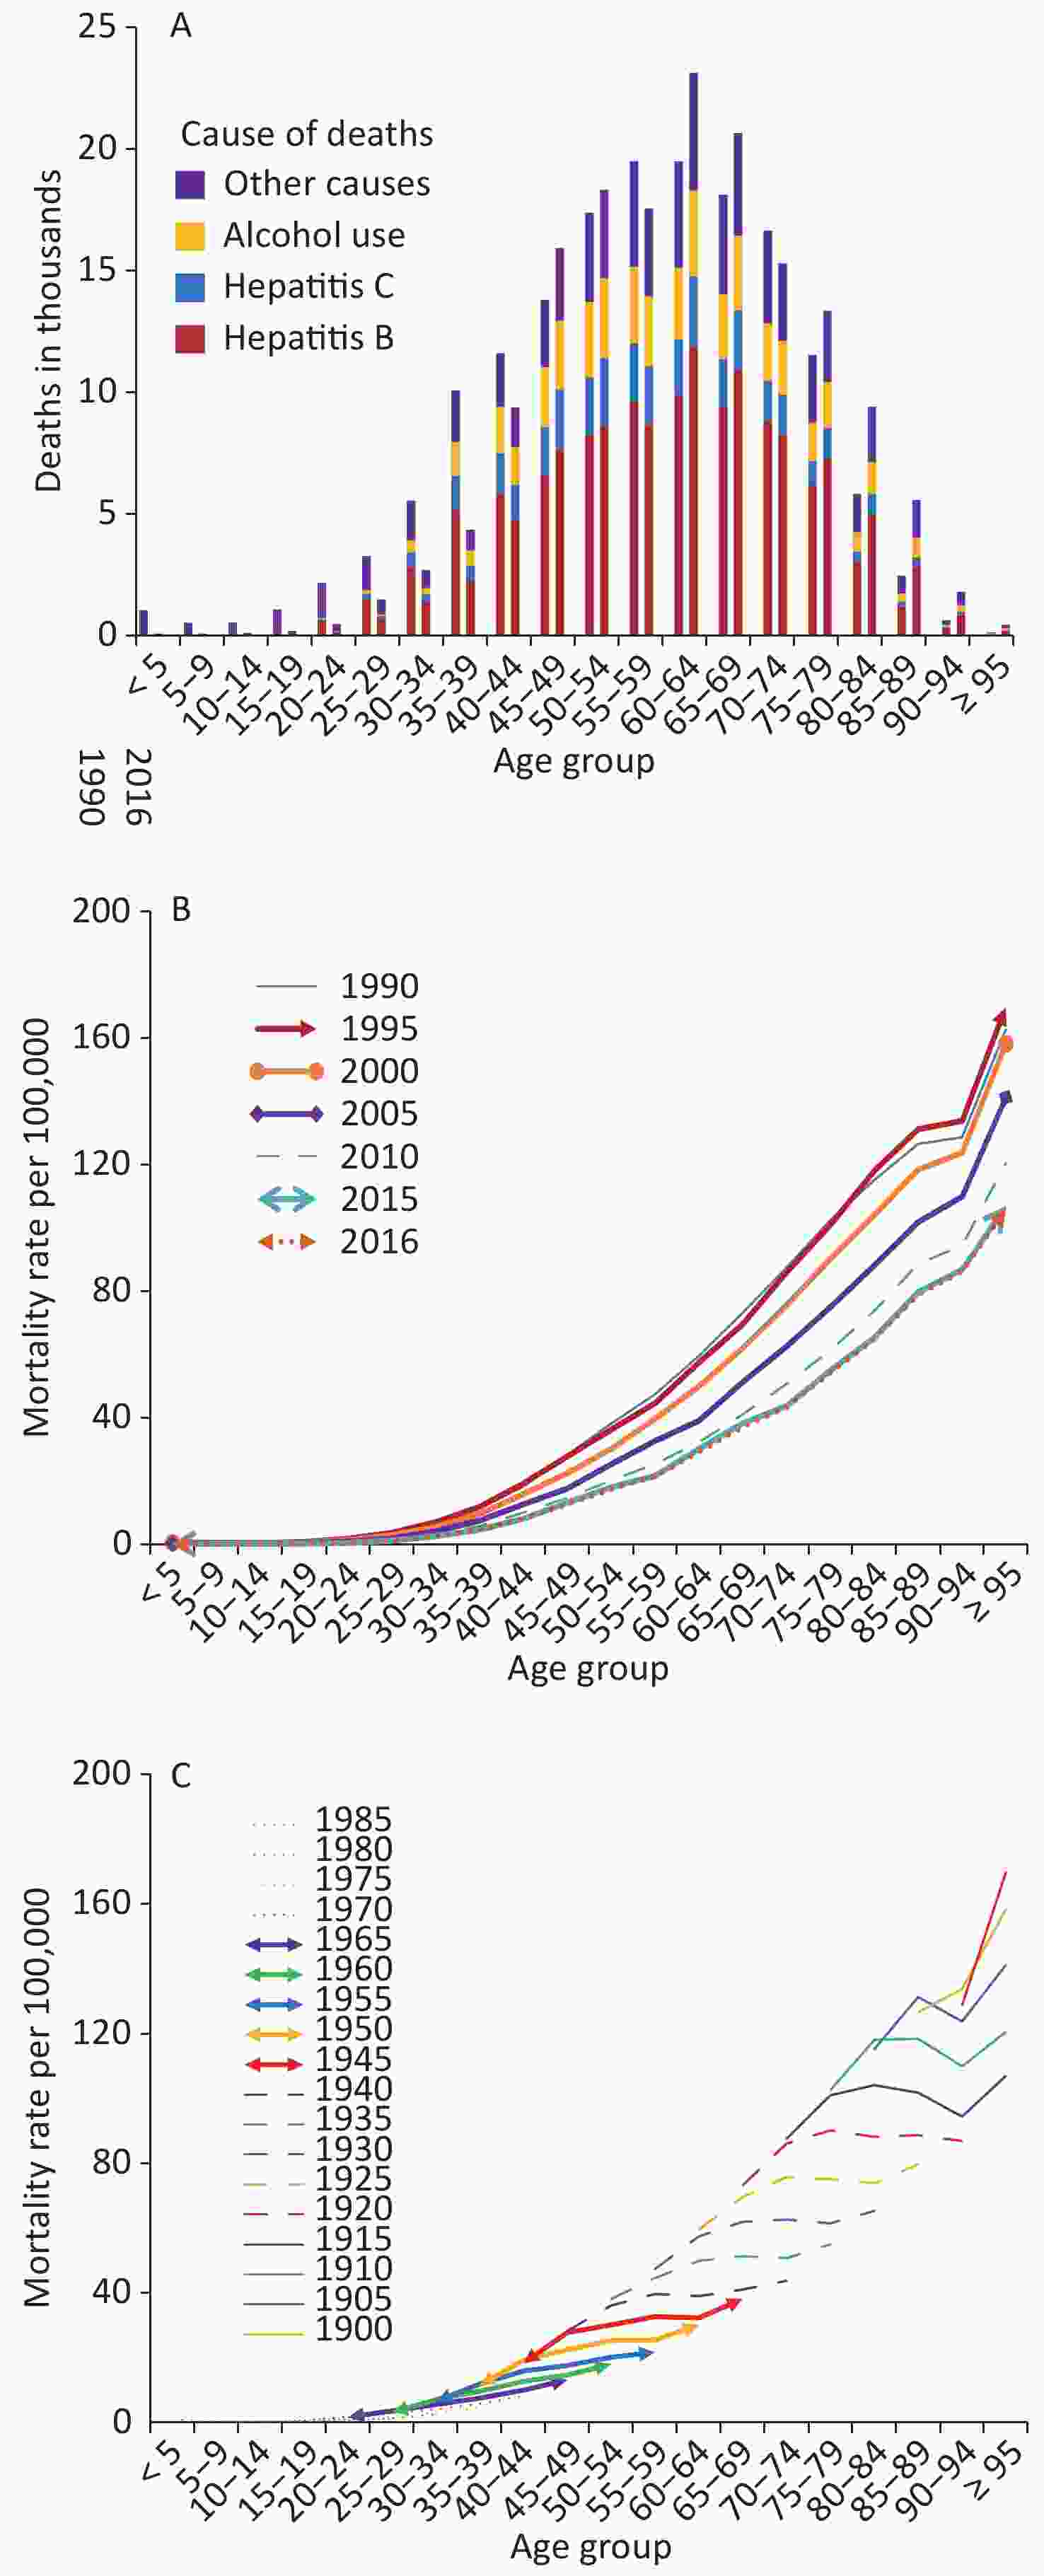
Figure 2. (A) Deaths for four etiologies of cirrhosis and other chronic liver diseases by age groups for both sexes combined in 1990 and 2016; Trends in China from 1990 to 2016 for (B) cross-sectional analysis of mortality of cirrhosis and other chronic liver diseases by age groups, and (C) birth cohort analysis of mortality rates of cirrhosis and other chronic liver diseases by age groups
Among 33 provinces in China, almost all provinces apart from Yunnan and Shandong showed decreasing age-standardized prevalence rates from 1990 to 2016. In 2016, Beijing had the highest age-standardized prevalence (816.3, 95% UI: 779.4–858.0) per 100,000, whereas Shanxi had the lowest age-standardized prevalence (560.7, 95% UI: 528.3–595.3) per 100,000. The age-standardized mortality rates in all provinces displayed downward trends. Hong Kong of China had the lowest age-standardized mortality rate, with 11.2 (95% UI: 10.0–12.6) per 100,000 in 1990 and 5.6 (95% UI: 4.8–7.7) in 2016, whereas Qinghai had the highest age-standardized mortality rate, with 44.6 (95% UI: 33.7–51.0) per 100,000 in 1990 and 24.2 (95% UI: 19.9–28.0) in 2016 (Supplementary Table S1 available in www.besjournal.com). In the SDI regions, age-standardized prevalence and mortality rates displayed decreasing trends from 1990 to 2016. In 2016, the average highest age-standardized prevalence was detected in the middle SDI region (704.6 per 100,000), and the average highest age-standardized mortality was observed in low-middle SDI region (17.7 per 100,000). Moreover, the age-standardized prevalence and mortality rates attributable to HBV were higher than other etiologies in three SDI regions (Table 2). We used a linear correlation analysis to demonstrate the relationship between the SDI values and the age-standardized mortality rates by provinces in 2016. The SDI values were negatively correlated with the age-standardized mortality rates, with a correlation coefficient of –0.817.
Characteristics Prevalence Mortality DALY Number in thousands Age-standardized rate per 100,000 Number in thousands Age-standardized rate per 100,000 Number in thousands Age-standardized rate per 100,000 1990 2016 1990 2016 1990 2016 1990 2016 1990 2016 1990 2016 Hong Kong 42.6
(40.4−44.9)65.7
(62.0−69.8)763.5
(723.4−803.3)633.4
(598.1−670.6)0.6
(0.5−0.6)0.7
(0.6−0.9)11.2
(10.0−12.6)5.6
(4.8−7.7)14.8
(13.1−17.0)14.2
(12.0−20.1)275.1
(245.1−315.2)128.0
(108.4−184.0)Macao 2.3
(2.2−2.4)5.2
(4.9−5.6)797.0
(752.8−844.7)701.3
(659.4−746.1)0.0
(0.0−0.0)0.0
(0.0−0.1)12.5
(11.0−14.2)6.9
(5.4−8.7)0.9
(0.8−1.0)1.2
(0.9−1.5)315.9
(278.7−365.1)164.5
(129.3−206.2)Anhui 311.0
(295.1−327.9)478.7
(453.2−507.6)702.9
(666.0−741.4)660.3
(626.4−698.1)6.3
(5.5−7.4)5.4
(4.6−8.3)17.0
(14.9−19.8)7.7
(6.5−11.7)204.7
(177.0−239.2)154.6
(130.2−232.2)477.9
(416.5−556.1)210.9
(178.6−318.8)Beijing 87.0
(83.0−91.3)237.9
(226.3−250.2)849.1
(810.2−891.4)816.3
(779.4−858.0)1.3
(1.1−1.5)1.7
(1.4−2.1)15.2
(12.6−17.4)6.5
(5.4−7.9)42.5
(33.9−49.3)52.8
(43.9−65.1)421.8
(342.1−484.5)181.4
(152.5−223.0)Chongqing 109.3
(103.3−115.3)253.6
(240.9−267.9)779.0
(738.1−822.0)708.2
(673.0−745.1)2.7
(2.2−3.1)4.4
(3.7−5.2)22.2
(18.1−25.6)11.6
(9.9−13.6)87.9
(67.8−102.3)117.5
(98.8−138.3)637.7
(503.8−739.8)314.5
(265.1−368.5)Fujian 166.4
(158.1−175.4)319.9
(302.1−337.8)751.5
(712.9−793.3)713.5
(675.5−752.1)3.6
(3.0−4.1)3.4
(2.8−4.2)19.0
(16.0−21.9)8.5
(7.1−10.4)115.6
(96.0−134.7)99.1
(83.5−124.7)536.8
(446.9−624.9)226.6
(191.6−282.4)Gansu 131.0
(123.5−139.2)204.6
(193.1−216.7)773.4
(728.2−820.9)674.3
(638.4−711.6)3.9
(2.8−4.5)3.9
(3.3−4.5)29.5
(22.2−34.0)14.1
(12.1−16.3)132.5
(94.5−153.1)113.9
(97.4−132.7)815.2
(591.9−940.5)379.0
(325.0−438.7)Guangdong 335.5
(317.4−354.8)854.3
(806.2−902.6)753.5
(712.4−797.4)693.6
(657.1−732.7)8.1
(6.8−9.3)9.3
(7.8−12.0)20.7
(17.4−23.9)8.9
(7.5−11.5)252.4
(207.8−294.1)283.2
(236.2−371.0)580.7
(480.7−675.2)239.9
(202.0−313.7)Guangxi 253.7
(239.0−268.4)410.9
(386.9−436.7)817.90
(770.45−864.42)762.9
(719.3−809.3)8.2
(6.1−9.5)8.8
(7.3−10.4)30.3
(22.9−35.1)17.0
(14.2−20.0)257.4
(190.4−298.7)247.7
(204.0−295.8)849.0
(630.1−985.3)461.4
(382.1−548.8)Guizhou 183.9
(172.6−196.1)280.2
(262.5−298.4)780.0
(731.0−831.6)722.4
(678.4−767.3)7.4
(5.0−8.6)8.5
(6.4−10.1)37.7
(26.4−43.4)23.1
(17.4−27.4)245.7
(158.9−284.3)233.9
(178.4−280.5)1063.4
(700.8−1231.3)605.9
(461.5−724.3)Hainan 40.8
(38.3−43.4)80.0
(75.3−85.1)848.3
(795.6−907.3)761.5
(719.0−807.7)1.4
(0.9−1.6)1.5
(1.2−1.8)32.8
(22.5−38.0)16.0
(12.3−19.2)43.0
(28.3−50.1)43.7
(34.1−52.4)916.1
(609.8−1064.0)428.0
(336.1−514.5)Hebei 296.4
(281.1−312.5)511.4
(481.7−545.3)598.0
(566.6−632.3)572.4
(539.5−607.7)5.3
(4.5−6.3)5.5
(4.5−9.1)12.6
(10.8−14.8)6.5
(5.4−10.8)172.2
(147.6−204.7)166.1
(137.0−268.9)354.0
(303.8−419.9)182.1
(151.1−294.8)Heilongjiang 229.7
(218.3−240.8)437.8
(414.2−461.1)871.4
(828.9−914.7)791.1
(751.9−830.5)4.6
(3.8−5.3)4.9
(4.1−6.7)22.2
(18.3−25.6)9.5
(8.1−13.1)163.1
(132.1−187.6)153.5
(129.1−201.8)630.1
(514.6−724.1)273.0
(231.2−358.3)Henan 450.5
(427.0−473.9)687.9
(648.8−728.0)677.7
(641.4−711.8)653.3
(617.3−689.5)9.9
(8.5−11.4)8.1
(6.8−13.8)17.2
(14.9−20.0)8.2
(6.9−13.8)319.0
(275.4−372.5)237.7
(199.7−406.6)490.2
(422.5−572.7)224.0
(189.1−381.2)Hubei 325.0
(308.7−341.4)552.0
(523.7−581.7)763.1
(725.3−802.6)761.5
(724.2−799.4)6.8
(5.8−8.0)6.5
(5.6−9.2)19.3
(16.8−22.6)9.6
(8.3−13.4)219.2
(188.2−256.2)183.1
(157.2−262.9)534.6
(460.4−623.6)250.5
(216.1−356.2)Hunan 361.1
(341.9−380.7)571.9
(540.6−605.1)742.6
(703.7−784.6)700.7
(663.2−738.4)9.6
(8.1−11.0)9.6
(8.4−12.0)23.0
(19.6−26.4)12.1
(10.6−14.9)317.7
(265.9−369.6)265.9
(229.5−331.4)664.3
(560.5−768.4)322.3
(279.5−398.4)Inner Mongolia 123.1
(116.3−129.5)238.1
(225.0−251.2)777.8
(735.5−819.7)709.0
(672.5−746.6)2.8
(2.1−3.2)2.8
(2.3−3.3)22.0
(17.3−25.5)9.3
(7.8−11.0)96.0
(73.6−111.5)86.8
(72.1−104.8)621.2
(481.3−718.6)257.2
(215.8−309.3)Jiangsu 429.2
(406.7−452.6)676.6
(636.0−716.4)721.4
(683.5−762.0)650.8
(613.9−688.1)8.6
(7.5−9.9)6.3
(5.3−9.7)16.8
(14.6−19.4)6.1
(5.2−9.3)264.5
(228.5−304.2)173.5
(147.5−268.0)458.1
(397.7−526.4)164.4
(140.5−251.9)Jiangxi 213.4
(202.2−225.8)394.8
(373.5−417.4)783.6
(741.1−830.2)758.0
(719.2−799.8)5.9
(4.6−6.8)6.4
(5.3−7.4)25.8
(20.8−29.6)13.6
(11.4−15.7)196.3
(151.9−227.4)187.7
(158.4−218.0)731.1
(572.9−846.7)364.1
(307.4−421.2)Jilin 157.8
(148.6−166.8)275.5
(259.9−292.5)820.5
(774.3−868.0)712.0
(672.8−752.0)4.3
(3.3−5.1)4.3
(3.7−5.1)28.2
(22.3−32.7)12.2
(10.6−14.3)147.0
(111.0−172.1)131.2
(111.7−156.9)781.2
(604.8−911.8)334.9
(288.7−396.2)Liaoning 261.0
(246.7−276.4)448.3
(422.2−474.2)774.8
(732.0−819.2)689.6
(652.6−727.6)5.4
(4.5−6.2)5.8
(4.9−7.4)19.1
(15.9−22.0)9.0
(7.7−11.6)174.0
(144.6−203.0)173.9
(147.9−217.7)526.9
(437.7−609.7)256.7
(220.7−317.9)Ningxia 23.6
(22.3−25.0)52.4
(49.4−55.5)765.7
(722.0−809.7)701.6
(663.5−740.8)0.6
(0.4−0.7)0.9
(0.7−1.0)25.6
(18.7−29.2)13.6
(11.5−15.8)21.1
(15.7−24.2)26.5
(22.3−31.2)704.6
(520.6−806.4)366.2
(308.4−427.8)Qinghai 26.0
(24.4−27.8)50.6
(47.5−53.8)823.3
(771.6−882.8)745.2
(702.6−790.8)1.1
(0.7−1.2)1.3
(1.1−1.5)44.6
(33.7−51.0)24.2
(19.9−28.0)37.9
(26.1−43.9)41.4
(34.0−48.3)1248.5
(894.6−1439.5)645.2
(527.8−749.2)Shaanxi 180.8
(170.6−191.2)298.8
(281.6−317.4)703.5
(662.8−745.8)634.9
(599.4−672.2)5.6
(4.3−6.5)5.2
(4.5−6.2)26.7
(20.9−30.6)12.3
(10.5−14.4)183.3
(142.3−214.8)153.4
(131.0−181.9)740.0
(577.3−861.1)326.2
(279.8−386.1)Shandong 539.6
(514.5−565.5)979.4
(927.7−1032.9)769.6
(732.5−807.9)783.4
(744.2−824.2)7.9
(6.8−9.5)7.1
(5.9−13.0)13.0
(11.3−15.5)5.8
(4.8−10.6)251.1
(216.5−299.3)213.7
(176.6−377.5)367.7
(316.5−436.4)166.7
(138.5−293.3)Shanghai 114.4
(108.7−120.3)261.5
(247.7−275.4)807.6
(768.0−849.2)739.9
(702.2−779.7)2.0
(1.7−2.3)2.3
(1.9−3.1)16.0
(14.0−18.3)6.8
(5.7−9.1)58.2
(50.0−67.5)59.8
(50.2−84.6)418.6
(362.5−483.5)170.6
(143.2−239.0)Shanxi 136.5
(128.7−144.3)249.0
(234.1−264.8)601.0
(565.8−635.9)560.7
(528.3−595.3)3.2
(2.7−3.6)3.1
(2.6−4.5)17.0
(14.6−19.4)7.8
(6.6−11.2)102.9
(87.2−120.1)91.0
(76.5−135.7)468.3
(399.1−544.4)206.2
(174.5−302.7)Sichuan 685.6
(647.9−726.1)751.8
(711.8−792.5)773.7
(731.3−819.8)750.0
(711.4−788.4)19.6
(15.9−22.6)15.1
(12.5−17.7)26.2
(21.6−30.1)14.8
(12.3−17.3)650.4
(521.5−752.7)411.7
(342.7−485.1)750.5
(609.7−864.5)400.8
(333.6−473.8)Tianjin 55.1
(52.1−58.0)122.3
(114.9−129.9)687.6
(650.9−724.6)657.8
(618.9−696.9)0.9
(0.8−1.1)1.0
(0.9−1.6)13.3
(11.4−15.6)6.1
(5.1−9.6)28.9
(24.6−33.7)32.9
(27.0−49.2)367.2
(313.9−425.5)175.6
(145.8−264.6)Tibet 9.9
(9.3−10.5)17.6
(16.5−18.8)618.0
(580.1−657.3)565.5
(531.1−603.3)0.4
(0.3−0.5)0.4
(0.3−0.5)30.0
(23.1−37.0)15.9
(13.0−19.6)13.4
(9.6−16.8)13.2
(10.2−16.7)865.1
(630.3−1083.7)451.9
(357.7−561.1)Xinjiang 66.8
(63.1−70.4)157.0
(147.7−167.0)620.5
(588.6−655.9)598.8
(565.0−634.4)2.0
(1.7−2.3)2.1
(1.7−3.2)22.6
(19.6−26.0)9.6
(8.1−14.8)67.1
(57.8−77.0)67.0
(56.2−101.7)637.6
(546.9−733.1)264.5
(223.6−400.1)Yunnan 205.2
(193.3−216.8)416.9
(393.7−442.0)749.8
(705.8−792.8)773.2
(732.0−817.0)6.5
(5.1−7.5)9.2
(7.2−10.8)28.3
(22.4−32.6)19.3
(15.3−22.4)216.5
(164.6−250.7)273.6
(216.1−322.2)803.6
(617.6−930.5)521.9
(416.3−611.4)Zhejiang 279.1
(264.5−293.8)526.7
(496.2−556.0)770.4
(730.4−811.6)701.6
(662.4−739.0)5.3
(4.5−6.1)4.8
(4.0−6.2)16.7
(14.3−19.3)6.8
(5.7−8.9)161.0
(136.2−187.0)135.9
(113.4−182.0)457.2
(388.9−532.5)181.4
(152.1−242.6)Note. Data in parentheses are 95% uncertainty intervals; DALY, disability-adjusted life-year. Table S1. Prevalence, mortality and DALYs and age-standardized rates of cirrhosis and other chronic liver diseases by provinces in China, 1990 versus 2016
SDI Cause Age-standardized prevalence rate per 100,000 Age-standardized
death rate per
100,000Age-standardized
DALY rate per
100,0001990 2016 Change
(%)1990 2016 Change
(%)1990 2016 Change
(%)High-middle Cirrhosis and other chronic liver diseases 768.8 699.3 −9.0 15.3 6.7 −56.2 411.9 175.7 −57.3 Cirrhosis and other chronic liver diseases due to hepatitis B 378.1 338.5 −10.5 7.7 3.4 −55.8 200.6 85.9 −57.2 Cirrhosis and other chronic liver diseases due to hepatitis C 86.9 83.6 −3.8 1.5 0.8 −46.7 44.3 21.2 −52.1 Cirrhosis and other chronic liver diseases due to alcohol use 115.6 103.6 −10.4 2.3 1.0 −56.5 61.1 26.8 −56.1 Cirrhosis and other chronic liver diseases due to other causes 188.3 173.6 −7.8 3.8 1.6 −57.9 105.9 41.9 −60.4 Middle Cirrhosis and other chronic liver diseases 750.7 704.6 −6.1 23.4 11.7 −50.0 657.8 318.4 −51.6 Cirrhosis and other chronic liver diseases due to hepatitis B 359.6 337.9 −6.0 11.6 5.9 −49.1 312.4 155.6 −50.2 Cirrhosis and other chronic liver diseases due to hepatitis C 97.7 93.9 −3.9 2.6 1.4 −46.2 77.2 41.2 −46.6 Cirrhosis and other chronic liver diseases due to alcohol use 111.6 102.6 −8.1 3.5 1.8 −48.6 95.3 47.4 −50.3 Cirrhosis and other chronic liver diseases due to other causes 181.8 170.2 −6.4 5.8 2.6 −55.2 172.9 74.1 −57.1 Low-middle Cirrhosis and other chronic liver diseases 723.8 654.1 −9.6 32.4 17.7 −45.4 914.6 478.9 −47.6 Cirrhosis and other chronic liver diseases due to hepatitis B 353.0 319.6 −9.5 16.2 9.0 −44.4 438.3 237.3 −45.9 Cirrhosis and other chronic liver diseases due to hepatitis C 90.4 82.4 −8.8 3.4 2.0 −41.2 101.6 58.5 −42.4 Cirrhosis and other chronic liver diseases due to alcohol use 104.8 93.3 −11.0 4.7 2.6 −44.7 128.0 69.9 −45.4 Cirrhosis and other chronic liver diseases due to other causes 175.6 158.7 −9.6 8.1 4.0 −50.6 246.7 113.2 −54.1 Note. SDI, Socio-demographic Index; DALY, disability-adjusted life-year. Table 2. The average age-standardized prevalence, death and DALY rates per 100,000 cases of cirrhosis and other chronic liver diseases by SDI regions in China, 1990 vs. 2016
-
From 1990 to 2016, the absolute number in thousands of DALYs for cirrhosis and other chronic liver diseases decreased by 11.7% from 5258.0 (95% UI: 4526.4–5610.4) to 4641.1 (95% UI: 4312.9–5533.0). Sex-specific analysis found the DALYs and age-standardized DALY rates were higher in males than females (Table 3). All-age DALY rates per 100,000 dropped from 462.9 (95% UI: 398.5–493.9) in 1990 to 339.5 (95% UI: 315.5–404.7) in 2016, and age-standardized DALY rates per 100,000 declined considerably by 53.3% from 585.6 (95% UI: 508.7–624.2) to 273.5 (95% UI: 254.7–324.9) (Figure 3A).
Characteristics DALY Number in thousands Age-standardized rate per 100,000 1990 2016 1990 2016 Overall 5258.0 (4526.4−5610.4) 4641.1 (4312.9−5533.0) 585.6 (508.7−624.2) 273.5 (254.7−324.9) Sex Male 3667.3 (2850.9−3995.2) 3631.2 (3312.7−4484.8) 792.1 (619.4−861.6) 420.1 (383.6−517.8) Female 1590.7 (1484.2−1728.0) 1009.9 (944.2−1071.1) 368.6 (343.6−402.8) 124.8 (116.5−132.6) Specific etiologies Hepatitis B 2458.1 (2108.5−2661.7) 2297.5 (2094.5−2771.7) 280.6 (244.3−303.2) 134.7 (123.1−162.2) Hepatitis C 604.5 (490.0−683.2) 610.1 (536.5−764.7) 67.9 (55.6−76.8) 34.8 (30.8−43.4) Alcohol use 724.3 (608.5−801.1) 712.5 (633.8−886.4) 84.3 (71.5−93.2) 40.8 (36.5−50.6) Other causes 1471.1 (1280.4−1657.9) 1020.9 (873.5−1220.7) 152.9 (133.8−173.6) 63.2 (55.1−75.1) Note. Data in parentheses are 95% uncertainty intervals; DALY, disability-adjusted life-year. Table 3. DALYs and age-standardized DALY rates of cirrhosis and other chronic liver diseases by gender, specific etiologies in China, 1990 vs. 2016
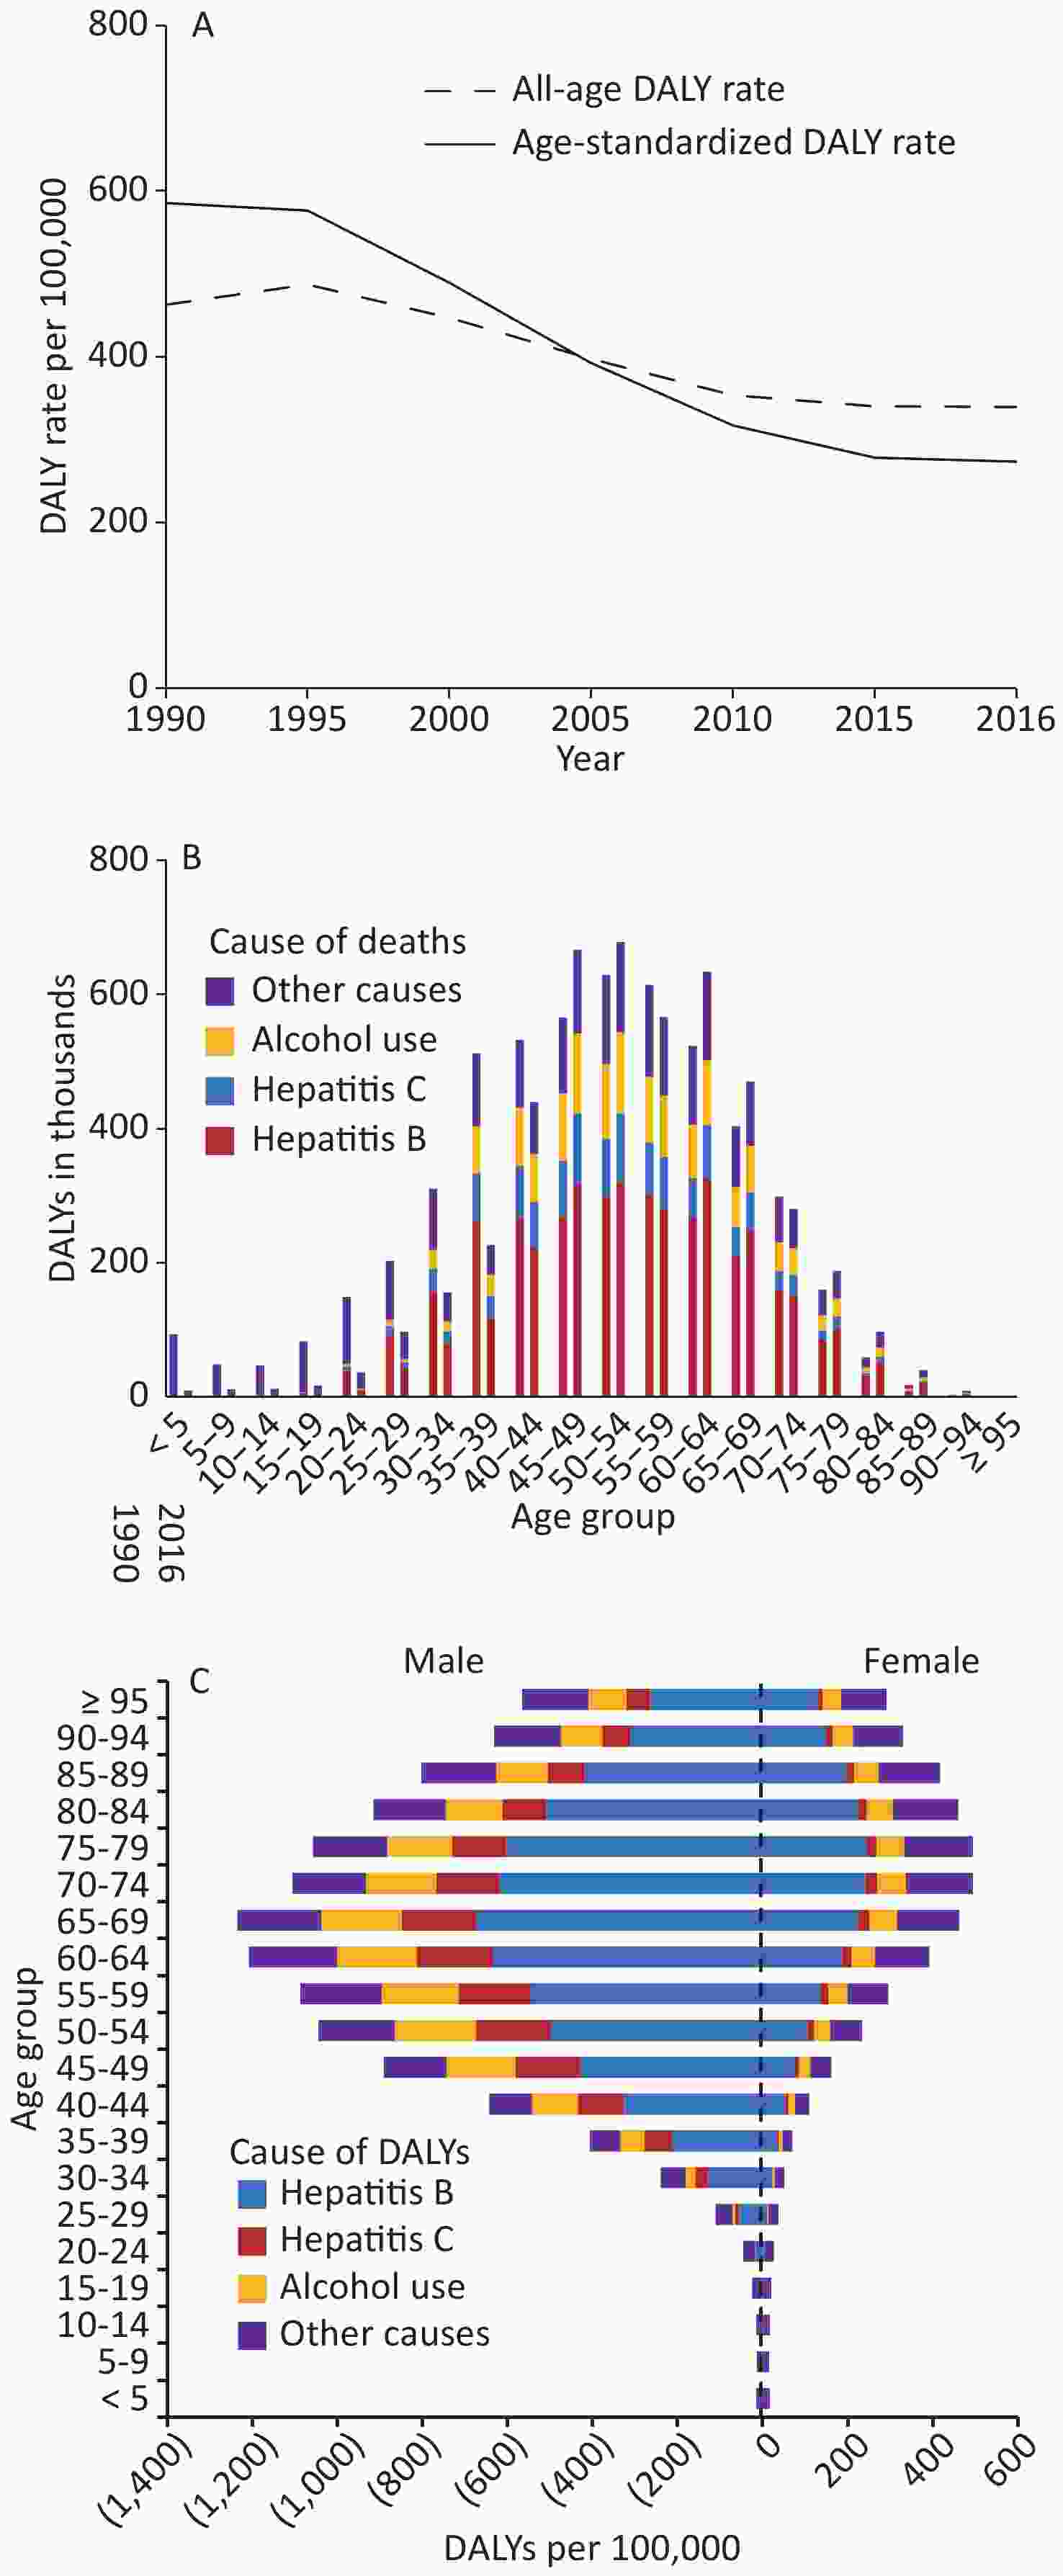
Figure 3. (A) All-age and age-standardized DALY rates of cirrhosis and other chronic liver diseases from 1990 to 2016; (B) DALYs for four etiologies of cirrhosis and other chronic liver diseases by age groups for both sexes combined in 1990 and 2016; and (C) Sex difference in DALY rates per 100,000 for four etiologies of cirrhosis and other chronic liver diseases by age groups, 2016
From 1990 to 2016, the number of DALYs due to HCV increased by 0.9%, whereas other etiologies showed decreased trends. In 2016, DALYs of cirrhosis and other chronic liver diseases induced by HBV accounted for 49.5% of all DALYs, followed by other causes (22.0%), alcohol use (15.4%), and HCV (13.1%). Age-standardized DALY rates per 100,000 attributable to other causes declined by 58.7% from 152.9 (95% UI: 133.8–173.6) in 1990 to 63.2 (95% UI: 55.1–75.1) in 2016, followed by HBV (52.0%), alcohol use (51.6%), and HCV (48.7%) (Table 3).
Figure 3B shows that with increased age, the DALYs increased first and then decreased between 1990 and 2016. The largest number of DALYs was observed in the 50–54 year age range. Other causes were the largest contributors to DALYs in 0–24 year age range, while at older ages, hepatitis B was the most cause. Figure 3C shows that DALY rates were higher in females than in males at ages under 14 years. At all other ages, DALY rates were higher in males. The highest rates of DALYs occurred in men aged 65–69 years and in women aged 75–79 years.
In 1990, age-standardized DALY rates per 100,000 ranged from 275.1 (95% UI: 245.1–315.2) to 1248.5 (95% UI: 894.6–1439.5) in different provinces. Qinghai had the highest age-standardized rate of DALYs at 645.2 per 100,000 in 2016, whereas Hong Kong had the lowest age-standardized rate of DALYs at 128.0 per 100,000 (Supplementary Table S1). With respect to the SDI regions, age-standardized rates of DALYs showed downward trends from 1990 to 2016, and a pronounced decrease was observed in the high-middle SDI region. Relatively higher average age-standardized rates of DALYs were observed in the low-middle SDI region between 1990 and 2016 (914.6 and 478.9 per 100,000, respectively). Age-standardized DALY rates due to HBV were highest in three SDI regions between 1990 and 2016, followed by other causes, alcohol consumption, and HCV (Table 2). In addition, the SDI values were negatively correlated with the age-standardized DALY rates by provinces, with a correlation coefficient of –0.828.
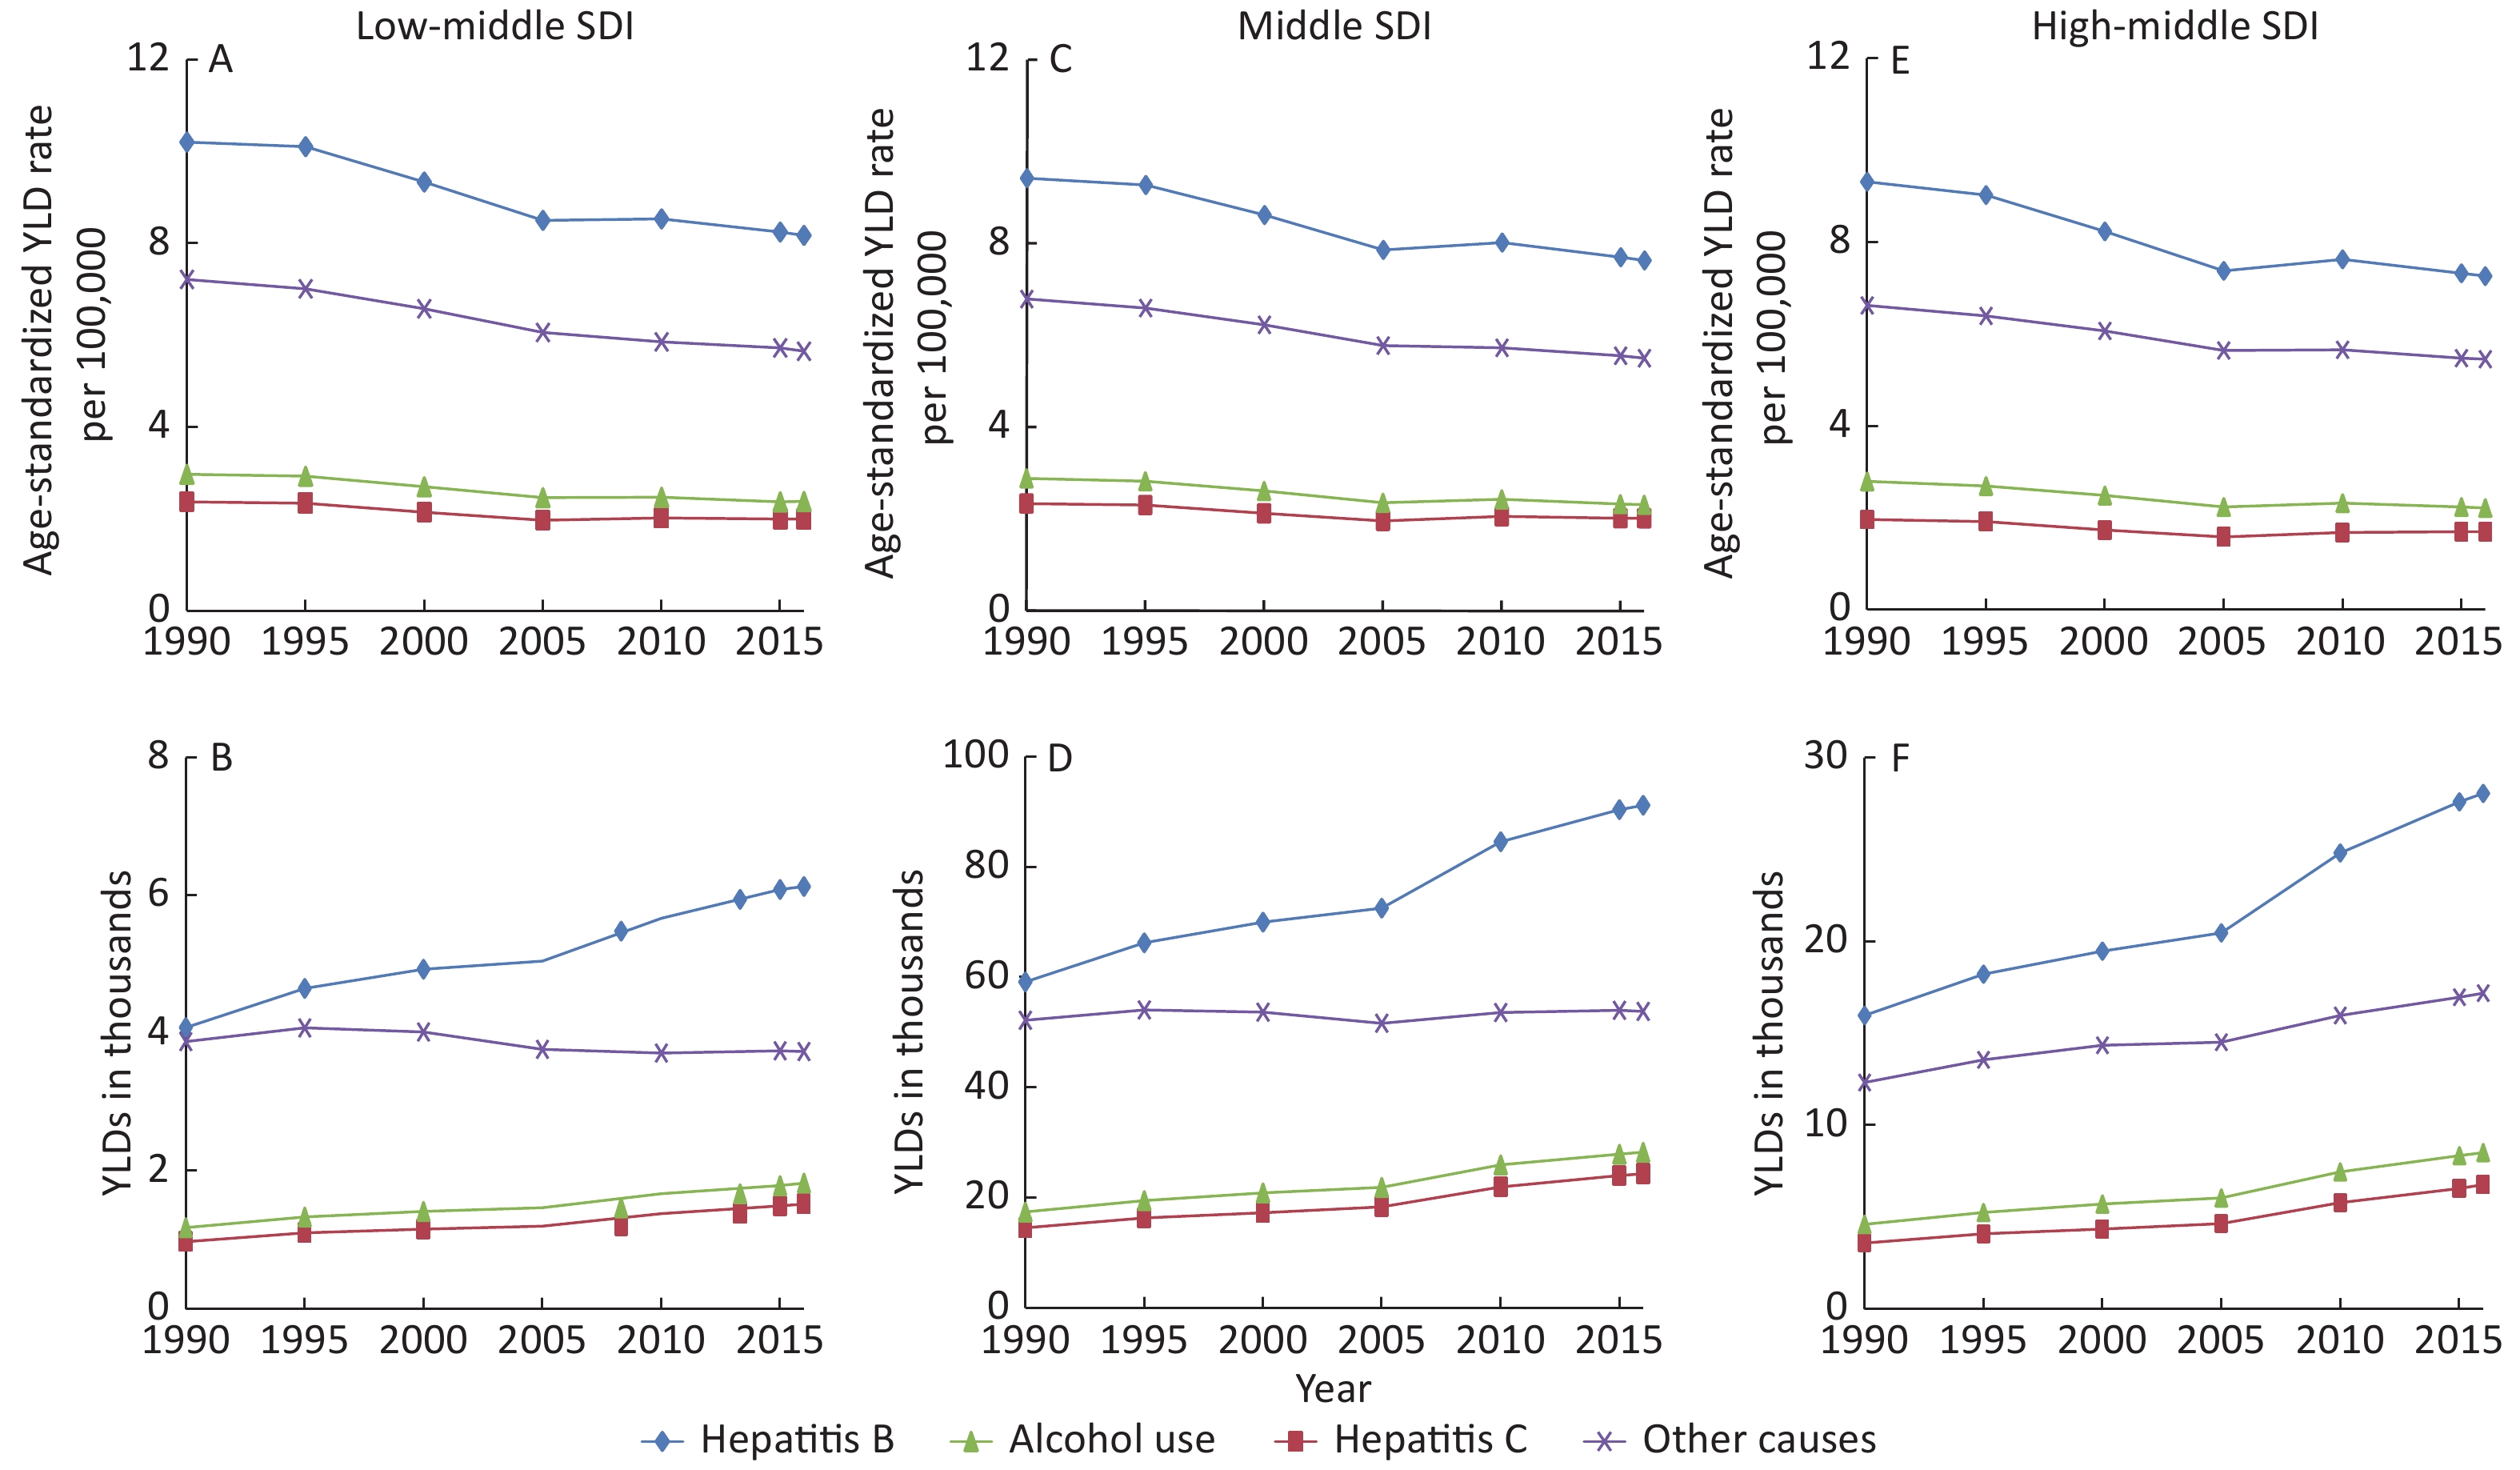
Trends for the number of YLDs and age-standardized YLD rates from 1990 to 2016 at specific causes are shown by SDI regions in Supplementary Figure S1 (available in www.besjournal.com). Generally, there were decreasing slightly trends in the age-standardized rates of YLDs for four causes from 1990 to 2016 in each SDI region. However, the number of YLDs showed increasing trends except for cirrhosis and other chronic liver diseases due to other causes in low-middle region. Hepatitis B contributed the most YLDs at all SDI regions, followed by other causes, alcohol use and hepatitis C.
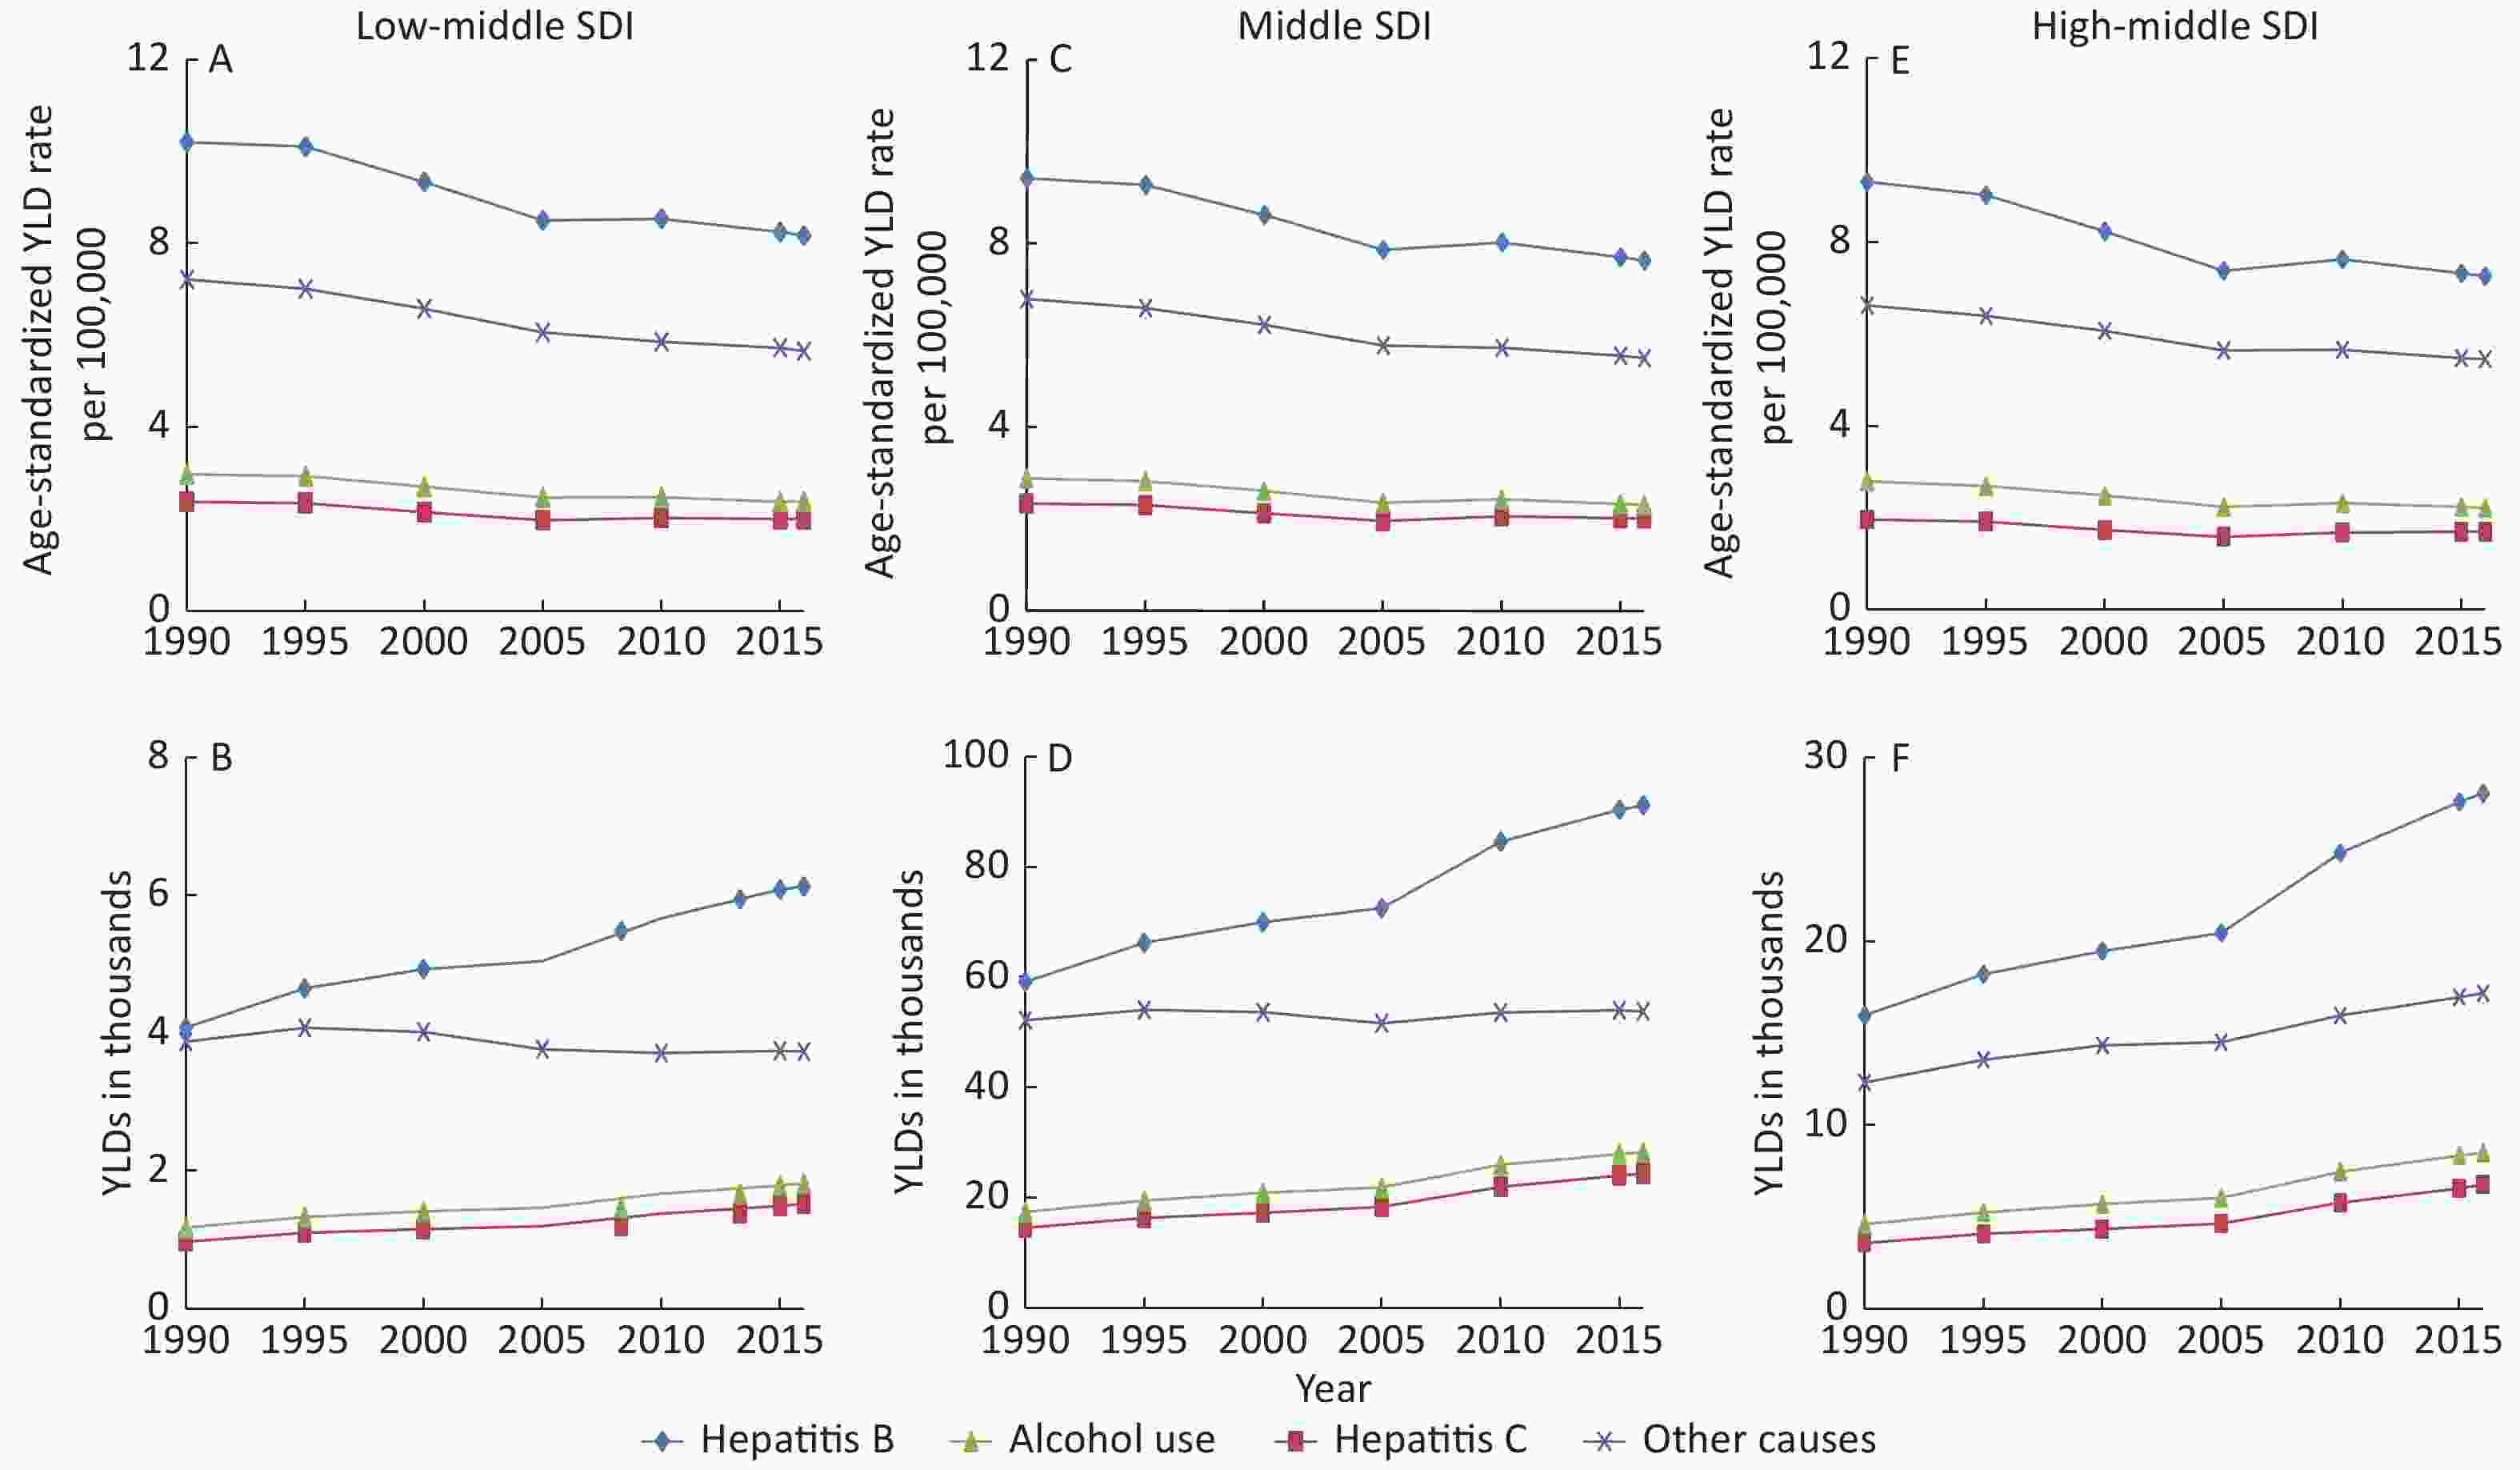
Figure S1. Trends of age-standardized YLD rates per 100,000 and YLDs of cirrhosis and other chronic liver diseases from 1990 to 2016, by specific etiologies, by SDI regions
-
In the present study, we comprehensively evaluated the temporal health burden of cirrhosis and other chronic liver diseases caused by several of the most common etiologies in China. In 2016, China had approximately 6833.3 thousand prevalence cases, accounted for 14.9% of global cases[8]. From 1990 to 2016, the all-age prevalence rate increased by 44.4%, but the age-standardized prevalence slightly decreased by 5.8%, partly because of the increased population size and longer life expectancy in China. In 1990, life expectancy at birth in China is 69.2 years for females and 65.0 years for males, improved to 79.9 years for females and 73.4 years for males in 2016[10]. The all-age mortality rate per 100,000 population declined by 17.6%, but the age-standardized mortality rate per 100,000 decreased considerably by 51.2%. Globally, age-standardized mortality rates of liver cirrhosis decreased 21.6% from 20.0 per 100,000 in 1980 to 15.8 per 100,000 in 2010, and this trend was largely driven by countries in East Asia, particularly in China[12]. This may coincide with a series of chronic disease prevention and control strategies implemented by the Chinese government over the past few decades[22]. From 1990 to 2016, even though the age-standardized DALY rate declined more rapidly in China (53.3%) compared with the overall global decline rate (19.4%)[10], the all-age DALY rate declined by 26.7%. This was mainly due to three main factors of population growth, longer life expectancy, and epidemiological trends in China.
Male preponderance was observed in prevalence, mortality, and DALYs. Previous studies have reported that males with chronic hepatitis B and C had greater progression rate to fibrosis compared with females[23, 24]. Although women tended to develop ALD after exposure to the same amount of alcohol than men, the higher proportion of high alcohol consumption was observed in men in China[24,25]. On average, there were twice as many cirrhosis deaths in men than in women [12]. Moreover, the burden of cirrhosis and other chronic liver diseases in elderly individuals (aged ≥ 60 years) showed an increase from 1990 to 2016. On the one hand, older individuals may be more easily infected with HBV-related diseases because of the lack of vaccine protection when they were young[26]. On the other hand, this situation may be significantly related to the natural history of cirrhosis and other chronic liver diseases. Cirrhosis has an asymptomatic and longer compensated phase than the decompensated phase, and the median is more than 12 years and about 2 years respectively[2]. Birth cohort effect on mortality showed a downward trend from earlier birth cohorts to later birth cohorts. The possible reason was that later birth cohorts obtained better education and had stronger awareness of health protection and disease prevention than earlier birth cohorts[27]. Therefore, health education and interventions dealing with cirrhosis and other chronic liver diseases should be implemented among males and older people.
From 1990 to 2016, the epidemiological patterns varied considerably by provinces. For example, age-standardized prevalence rates in most provinces displayed decreasing trends, whereas the opposite occurred in Yunnan and Shandong. Yunnan was an important epidemic center for blood-borne viruses such as hepatitis C virus[28]. Shandong was a low incidence area of hepatitis B and C, but the prevalence of ALD was 8.55% in 2011, which was higher than the median prevalence of ALD (4.5%) in Chinese people[29-31]. In 2016, Beijing had the highest age-standardized prevalence and Shanxi had the lowest age-standardized prevalence. This could be explained by demographic structure of each province. As the capital city of China, Beijing has been experiencing a rapid growth in the number of floating population[32]. A study demonstrated that floating population had higher HBV prevalence than local residents, which may be the reason for the high prevalence of cirrhosis and other chronic liver diseases in Beijing[33]. Qinghai had the highest age-standardized mortality and DALY rates between 1990 and 2016, whereas Hong Kong had the lowest age-standardized mortality and DALY rates. Several nationwide surveys showed that Qinghai province had the highest incidence of viral hepatitis, especially HBV and HCV[26,34]. On the other side, high burden in Qinghai could be significantly attributed to undeveloped economy, low healthcare accessibility and low awareness of public health[35]. However, Hong Kong has the opposite situation, along with the developed economy and excellent performance of public medical system[36]. In the SDI regions, average highest age-standardized prevalence rates were detected in the middle SDI region, and low-middle SDI region had the highest age-standardized mortality and DALY rates between 1990 and 2016. In addition, the SDI values were negatively correlated with the age-standardized mortality and DALY rates by provinces. These regional differences may be not only due to significant differences in economic development levels and healthcare, but also due to different distributions of risk factors for cirrhosis and other chronic liver diseases in each province. Consequently, the level of risk factors should be estimated at the provincial level to better explain the different patterns in the burden of cirrhosis and other chronic liver diseases. Given the limited health resources in China, effectively oriented intervention and prevention strategies are essential.
-
Chronic viral hepatitis, mainly for HBV and HCV, is a well-recognized risk factor for cirrhosis and other chronic liver diseases. In 2016, there were approximately 12 million people with cirrhosis and other chronic liver diseases in China, and 48.9% were caused by HBV infection. From 1990 to 2016, it was obvious that age-standardized prevalence rates due to HBV decreased, although the absolute number of cases increased. This decline could be primarily due to a series of vaccination campaigns, such as ‘free-of-charge HBV vaccination’ for all neonates since 1992 and a ‘catch-up HBV vaccination’ program for children aged 8–15[37]. These efforts had considerably reduced the HBsAg carrier rates of the general population, from 9.8% in 1992 to 7.2% in 2006[11]. In 2016, the age-standardized mortality rate per 100,000 induced by HBV was 5.1 (95% UI: 4.7–6.1), which was similar to the global rate of 5.2 (95% UI: 4.7–6.0)[9]. DALYs attributable to HBV accounted for 49.5% of all DALYs of cirrhosis and other chronic liver diseases in 2016. Thus, HBV remains the major cause of the burden of cirrhosis and other chronic liver diseases in China.
From 1990 to 2016, HCV had the most pronounced increase in prevalence cases, deaths, and DALYs, and the age-standardized prevalence, mortality, and DALYs rates per 100,000 had a lower decrease than other etiologies. Similarly, research showed that despite the decreasing prevalence, new cases of HCV recently increased in China, partly due to better diagnosis, new infection, as well as aging infected population[38]. HCV is an emerging healthcare issue in China.
A study demonstrated that a higher proportion of cirrhosis within a region was related to higher rates of alcohol use[39]. From 1990 to 2016, the age-standardized prevalence rates due to alcohol use showed a slightly decreasing trend, but the prevalence cases significantly increased. In China, the prevalence of ALD increased from 2.27% in 2000 to 8.74% in 2015[25].This study suggested that males had greater health burdens attributable to alcohol consumption than females. This is parallel with drinkers accounting for 56% of men and 15% of women in China[40]. The highest number of DALYs due to alcohol consumption was detected in those aged 50–54 years in 2016, consistent with a study in north-east China that the highest prevalence rates of ALD were in 40–49 age group in males and 50–59 age group in females[30]. Therefore, in China, alcohol consumption cannot be a neglected risk factor for cirrhosis and other chronic liver diseases.
Apart from HBV, HCV, and alcohol use, factors such as aflatoxin B1, diabetes, tobacco, obesity, and NAFLD were classified into ‘other causes’ and were considered common etiologies of liver cirrhosis and liver cancer[41-43]. With rapid economic development and improved living standards, the prevalence of metabolic liver diseases such as NAFLD displays gradually upward trends, which eventually leads to more cases of end-stage liver diseases[44]. In this study, although the age-standardized prevalence rates attributable to other causes showed decreasing trends from 1990 to 2016, the absolute number of prevalence cases increased by nearly 50%. The highest number of DALYs due to other causes was detected in those aged 50–54 years in 2016. Some epidemiological studies have shown that the prevalence of NAFLD in China is approximately 15% among adults[11]. Moreover, NAFLD is very prevalent in patients with HBV infection, and the prevalence rose from 8.2% to 31.8% between 2002 and 2011[45]. In the near future, other causes may replace HBV as a major concern of chronic liver diseases in China.
-
There are several strengths in this report. First, this study revealed the major epidemiological trends in cirrhosis and other chronic liver diseases by provinces, SDI regions, sex, and age groups. Second, the updated information was provided to precisely evaluate the health burden due to specific etiologies in China and to facilitate the government to develop oriented strategies. Finally, to improve the model validity and decrease uncertainty from various sources, GBD 2016 improved the method and available data sources.
However, this study presents some important limitations. First, the data from GBD 2016 retained methodological general limitations[5,6,8,9]. Second, there were inevitable measurement errors in estimating the disease burden of cirrhosis and other chronic liver diseases in China using the standard GBD method, which may increase the inaccuracy of the results. Finally, the interaction of several factors was not taken into account in this study. For example, HCV coinfection adversely affects liver fibrosis in HBV patients, increasing the number of decompensated cirrhosis patients[46].
-
Cirrhosis and other chronic liver diseases remain a substantial health burden in China, with the increase of population and the aging of population. HBV remains the major cause of the health burden of cirrhosis and other chronic liver diseases. HCV is also a recent factor that cannot be ignored. In addition, ALD and NAFLD are emerging as leading causes of chronic liver diseases. Fortunately, these etiologies are preventable and now more controllable. Thus, up-to-date information about the trends facilitates developing a targeted prevention and control strategy to effectively reduce the healthcare burden.
-
The authors would like to thank the epidemiologist at the National Center Chronic and Non-communicable Disease Control and Prevention (China), who helped explain the GBD study.
-
The authors disclose no conflicts.
Burden of Cirrhosis and Other Chronic Liver Diseases Caused by Specific Etiologies in China, 1990−2016: Findings from the Global Burden of Disease Study 2016
doi: 10.3967/bes2020.001
- Received Date: 2019-06-27
- Accepted Date: 2019-10-16
-
Key words:
- Cirrhosis /
- Chronic liver disease /
- China /
- Epidemiology /
- Global burden of disease study
Abstract:
| Citation: | LI Man, WANG Zhuo Qun, ZHANG Lu, ZHENG Hao, LIU Dian Wu, ZHOU Mai Geng. Burden of Cirrhosis and Other Chronic Liver Diseases Caused by Specific Etiologies in China, 1990−2016: Findings from the Global Burden of Disease Study 2016[J]. Biomedical and Environmental Sciences, 2020, 33(1): 1-10. doi: 10.3967/bes2020.001

|

 Quick Links
 DownLoad: