


-
Cardiovascular disease is the leading cause of morbidity and mortality worldwide. Metabolic syndrome (MetS) is characterized by a clustering of cardiovascular risk factors, including abdominal obesity, elevated triglyceride levels, low high-density lipoprotein (HDL) cholesterol levels, high blood pressure, and elevated fasting glucose levels[1]. MetS is associated with an increased burden of cardiovascular diseases and other chronic diseases, particularly among women[2-4]. In China, the age-standardized prevalence of MetS has been reported to be approximately 17.8% in women and 9.8% in men[5]. Studies have mentioned that it would be of great significance for female individuals to understand the role of childbearing and childrearing to prevent cardiovascular diseases[6,7].
Pregnancy is an important stage for women, which is accompanied by a series of changes in sex hormone levels, hemodynamics, and glycolipid metabolism that are associated with metabolic syndrome[8]. Parity is the total number of live births. Although previous studies have investigated the association between parity and MetS, the findings have been inconsistent, which might be limited by small sample size or particularly selected populations[9-10]. The aim of the present study was to evaluate the associations between parity and MetS and its components among a cohort of women in Northern China.
Furthermore, it is known that overweight is associated with an increased risk for chronic diseases; however, body weight is an important modifiable risk factor compared with other unmodifiable factors, such as age and gender. In Chinese women, the age-standardized prevalence of overweight was found to be approximately 31.1%[5], indicating that obesity would be another concern causing psychological and physical distress. In this study, we also performed subgroup analyzes according to body mass index (BMI) categories, aiming to investigate whether BMI had effects on the association between parity and MetS.
-
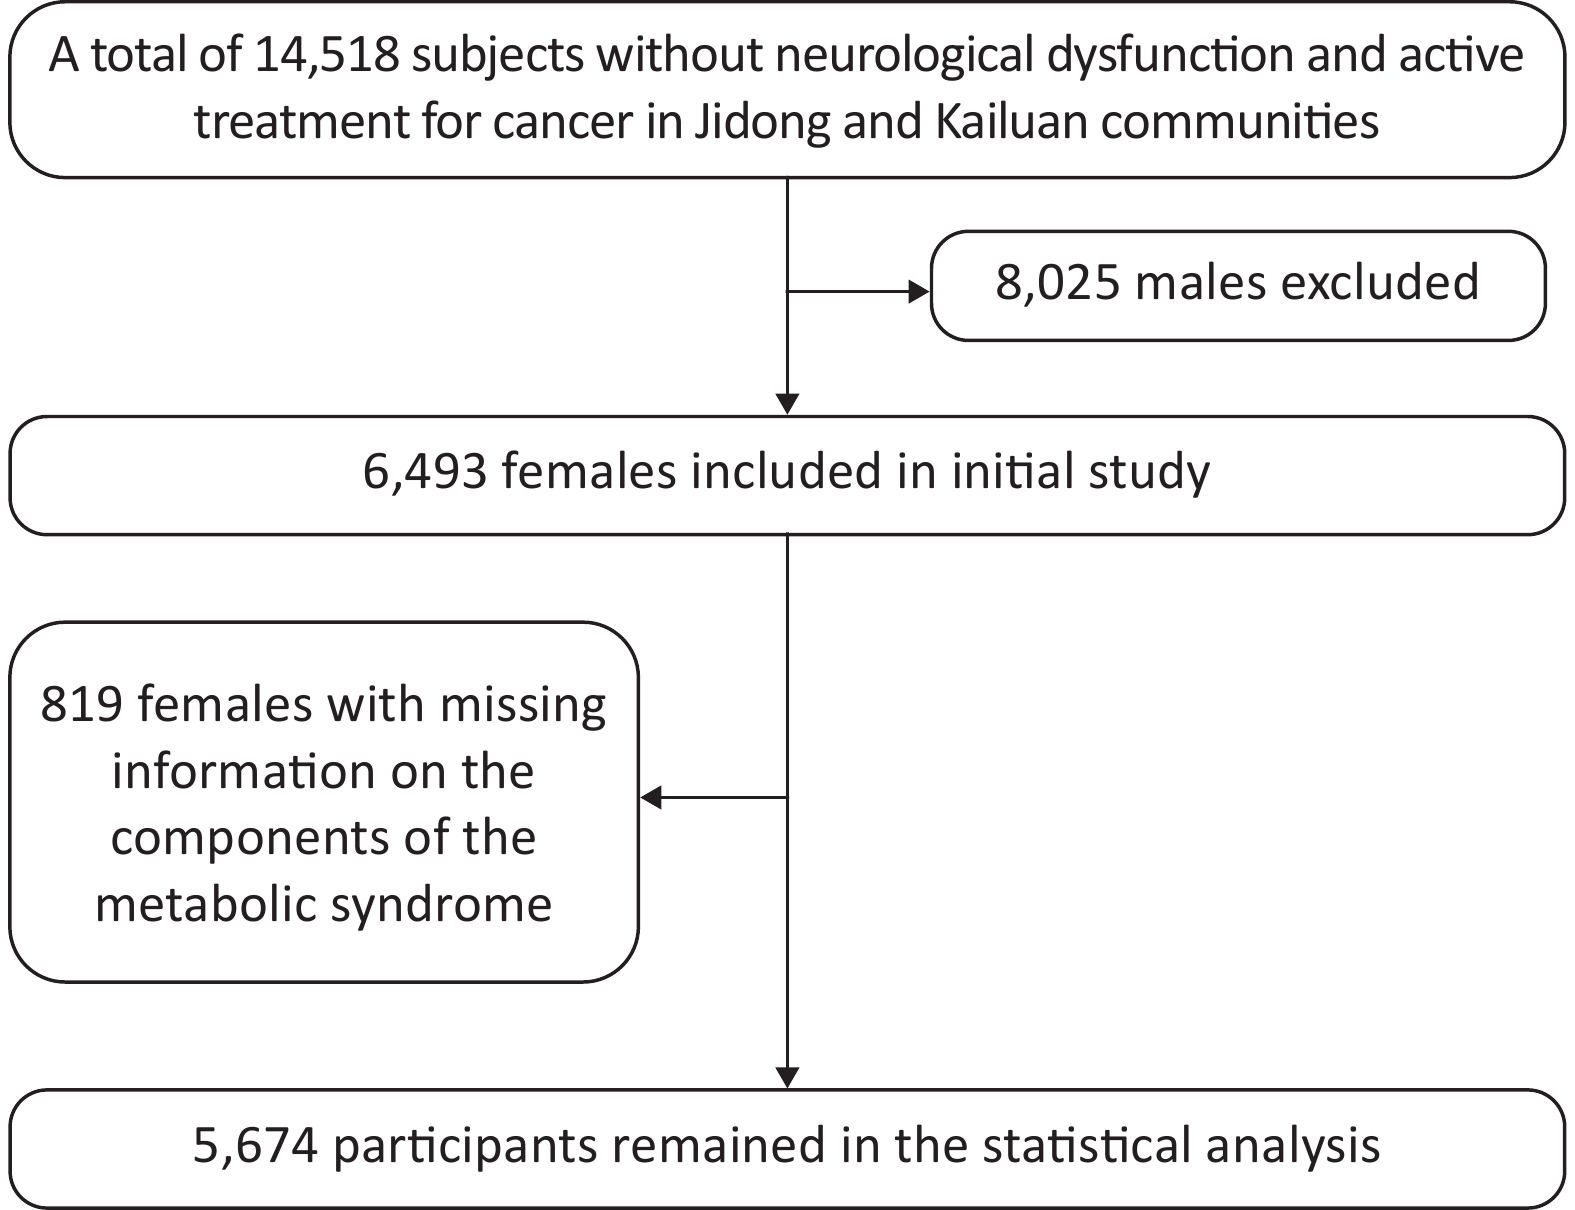
A total of 14,518 participants were recruited from Jidong and Kailuan communities (Tangshan city, Hebei, Northern China) from 2012 to 2014 as described in our previous studies[11-13]. The final study sample included 5,674 participants for statistical analysis after the exclusion of 8,025 male individuals and 819 female individuals with missing information on the components of MetS (Figure 1). This study was conducted according to the guidelines of the Declaration of Helsinki and was approved by the Ethics Committee of Jidong Oilfield Inc Medical Center and Kailuan General Hospital. Written informed consent was obtained from all participants. All the experiments described in this study were performed in accordance with the approved guidelines.

Figure 1. The flowchart of study design.
-
A standardized, structured questionnaire was administered by well-trained research staff to collect information about the subjects’ demographic characteristics, socioeconomic status, marital status, menopausal status, cardiovascular risk factors, and medical history.
During the clinical examination, anthropometric measurements were obtained by certified observers using standard protocols and techniques. Three blood pressure measurements were obtained from the subjects after a 5-min rest in the seated position using an automatic sphygmomanometer, and the second and third readings were averaged and recorded. Participants were advised to avoid cigaret smoking, consumption of alcohol and caffeinated beverages, and exercise for at least 30 min before their blood pressure measurements. Body weight and height were measured twice during the examination. Body weight was measured in light indoor clothing without shoes to the nearest 0.1 kg, and height was measured without shoes to the nearest mm using a stadiometer. BMI was calculated as body weight in kilograms divided by height in square meters. Obesity was defined as a BMI of ≥ 25.0 kg/m2, according to the WHO definitions[5,14,15]. Waist circumference was measured at 1 cm above the navel to the nearest mm[14]. The physical activity of the participants was divided into the following three categories: (1) inactive, nearly none; (2) moderately active, 1–149 min/week of moderate intensity or 1–74 min/week of vigorous intensity; and (3) active, ≥ 150 min/week of moderate intensity or ≥ 75 min/week of vigorous intensity.
Venous blood samples were collected after overnight fasting for 10–12 h. The levels of serum lipids, including triglycerides, total cholesterol, low-density lipoprotein cholesterol, and high HDL cholesterol, and plasma glucose were determined using an autoanalyzer (AU400; Olympus, Tokyo, Japan) according to the manufacturer’s instructions at the central laboratory of Jidong Oilfield Hospital and Kailuan General Hospital.
The components of MetS were defined according to the following guidelines from the US National Cholesterol Education Program and modified for Asian populations: (1) abdominal obesity (waist circumference ≥ 80 cm); (2) elevated triglyceride levels (≥ 1.7 mmol/L); (3) low HDL cholesterol levels (< 1.0 mmol/L); (4) high blood pressure (≥ 130 mmHg systolic or ≥ 85 mmHg diastolic or use of antihypertensive medications or previously diagnosed hypertension); and (5) elevated fasting glucose levels (≥ 6.1 mmol/L or use of antidiabetic medications or previously diagnosed type 2 diabetes). A combination of three or more of these factors was defined as MetS[5,16-17].
Parity was then classified into four categories as zero (nulliparity), one, two, and three or more, and women with three or more children were combined into one group. The detailed protocol was consistent with our previous research[18].
-
Comparisons among parity groups were made using one-way ANOVA for continuous variables and Chi-square test for categorical variables. Nonparametric methods were used to compare ordinal variables and variables with skewed distribution. The associations between parity and MetS and its components were investigated using logistic regression models. Subgroup analyzes according to BMI and age were also performed using logistic regression models. Results of the logistic regression models were presented as odds ratio (OR) with 95% confidence interval (CI). Potential confounders, including age, postmenopausal status, marital status, current smoking, alcohol use, oral contraceptive use, physical activity, education level, and income, were adjusted in the models. The parity of one was considered as the reference in all models. Associations with a P value of < 0.05 were considered to be statistically significant. All statistical analyzes were performed using SAS 9.4 (SAS Institute Inc, Cary, NC, USA).
-
Table 1 shows the baseline characteristics of participants stratified by parity. The study population consisted of women with parity of zero (9.1%), one (72.9%), two (13.0%), and three or more (5.0%). There was a significant increase in age with parity (P < 0.001). Multiple lifestyle factors, including current smoking, alcohol use, and physical activity, exhibited a significant difference across the parity groups (all with P < 0.001). Higher proportion of postmenopausal status and use of contraceptive drugs was associated with increasing parity (both with P < 0.001). Socioeconomic status, measured using education level and mean equivalent household income, also demonstrated a statistical difference among the parity groups (both with P < 0.001).
Characteristics Overall Parity group P value 0 1 2 ≥ 3 Number, n (%) 5,674 513 (9.1) 4,138 (72.9) 739 (13.0) 284 (5.0) Age, year 45.4 ± 12.7 28.2 ± 6.2 43.7 ± 9.7 58.5 ± 8.8 67.3 ± 8.0 < 0.001 Age at menopause, year 49.8 ± 4.0 44.4 ± 7.3 49.5 ± 4.0 50.3 ± 3.7 50.0 ± 4.3 < 0.001 Postmenopause, n (%) 1,844 (32.5) 5 (1.0) 1,024 (24.8) 564 (76.3) 251 (88.4) < 0.001 Married, n (%) 5,311 (93.6) 292 (56.9) 4,042 (97.7) 714 (96.6) 263 (92.6) < 0.001 Current smoking, n (%) 120 (2.1) 5 (1.0) 75 (1.8) 24 (3.3) 16 (5.6) < 0.001 Alcohol use, n (%) 203 (3.6) 29 (5.7) 154 (3.7) 19 (2.6) 1 (0.4) < 0.001 Antihypertensive medication, n (%) 659 (11.6) 2 (0.4) 336 (8.1) 214 (29.0) 107 (37.7) < 0.001 Insulin or oral hypoglycemic drug, n (%) 206 (3.6) 1 (0.2) 109 (2.6) 70 (9.5) 26 (9.2) < 0.001 Antilipemic agent, n (%) 81 (1.4) 0 45 (1.1) 19 (2.6) 17 (6.0) < 0.001 Oral contraceptives, n (%) 148 (2.6) 4 (0.8) 91 (2.2) 33 (4.5) 20 (7.0) < 0.001 Estrogen replacement therapy, n (%) 35 (0.6) 1 (0.2) 27 (0.7) 5 (0.7) 2 (0.7) 0.647 Physical activity, n (%) < 0.001 Inactive 2,017 (35.6) 178 (34.7) 1,513 (36.6) 238 (32.2) 88 (31.0) Moderate active 1,062 (18.7) 103 (20.1) 829 (20.0) 86 (11.6) 44 (15.5) Active 2,595 (45.7) 232 (45.2) 1,796 (43.4) 415 (56.2) 152 (53.5) Education level, n (%) < 0.001 Illiteracy/primary school 319 (5.6) 1 (0.2) 86 (2.1) 148 (20.0) 84 (29.6) Middle/high school 2,705 (47.7) 73 (14.2) 1,960 (47.4) 501 (67.8) 171 (60.2) College or above 2,650 (46.7) 439 (85.6) 2,092 (50.5) 90 (12.2) 29 (10.2) Income, ¥/month, n (%) < 0.001 ≤ 3,000 3,194 (56.3) 159 (31.0) 2,221 (53.7) 584 (79.0) 230 (81.0) 3,001–5,000 2,153 (38.0) 304 (59.3) 1,667 (40.3) 134 (18.1) 48 (16.9) > 5,000 327 (5.7) 50 (9.7) 250 (6.0) 21 (2.9) 6 (2.1) Table 1. Baseline characteristics of participants stratified by parity
-
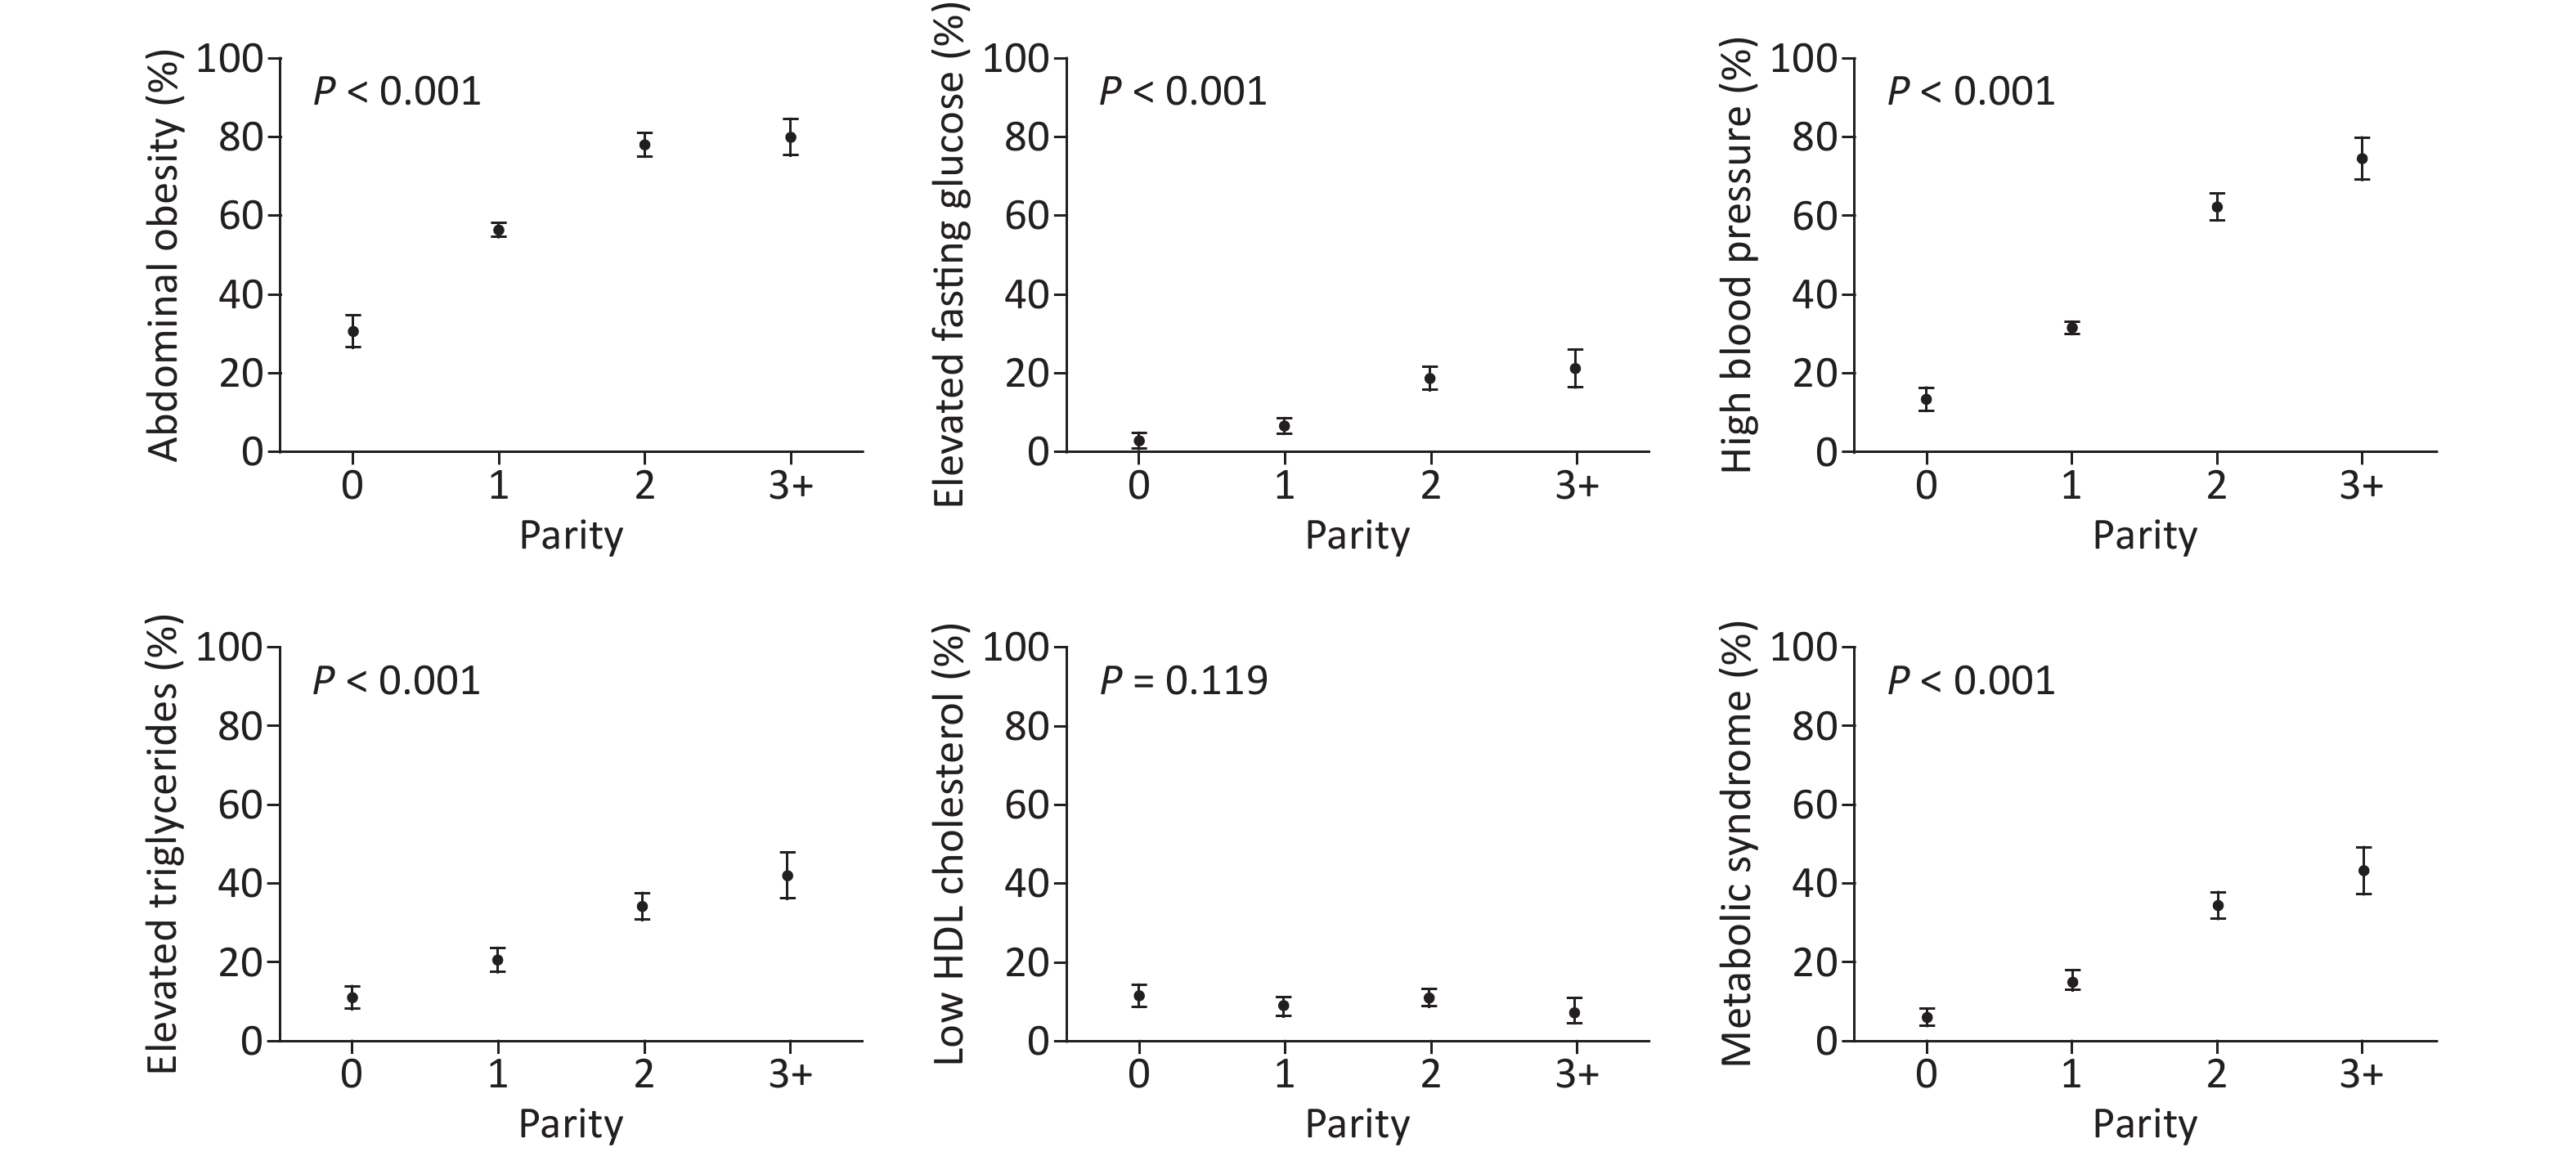
Figure 2 shows the prevalence of MetS and its components according to parity. Among the parity groups, nulliparous women had the lowest prevalence, and those with parity of three or more had the highest prevalence of abdominal obesity (81%), elevated fasting glucose levels (21%), high blood pressure (75%), elevated triglyceride levels (43%), and MetS (44%). The prevalence of MetS and its components appeared to increase progressively with parity (all with P < 0.001, Figure 2). However, a similar pattern was not observed for low HDL cholesterol levels (P = 0.119), where nulliparous women had the highest prevalence of 11.7%. Overall, an elevated fasting glucose level was the least prevalent component in our study cohort, and abdominal obesity was the most prevalent component.
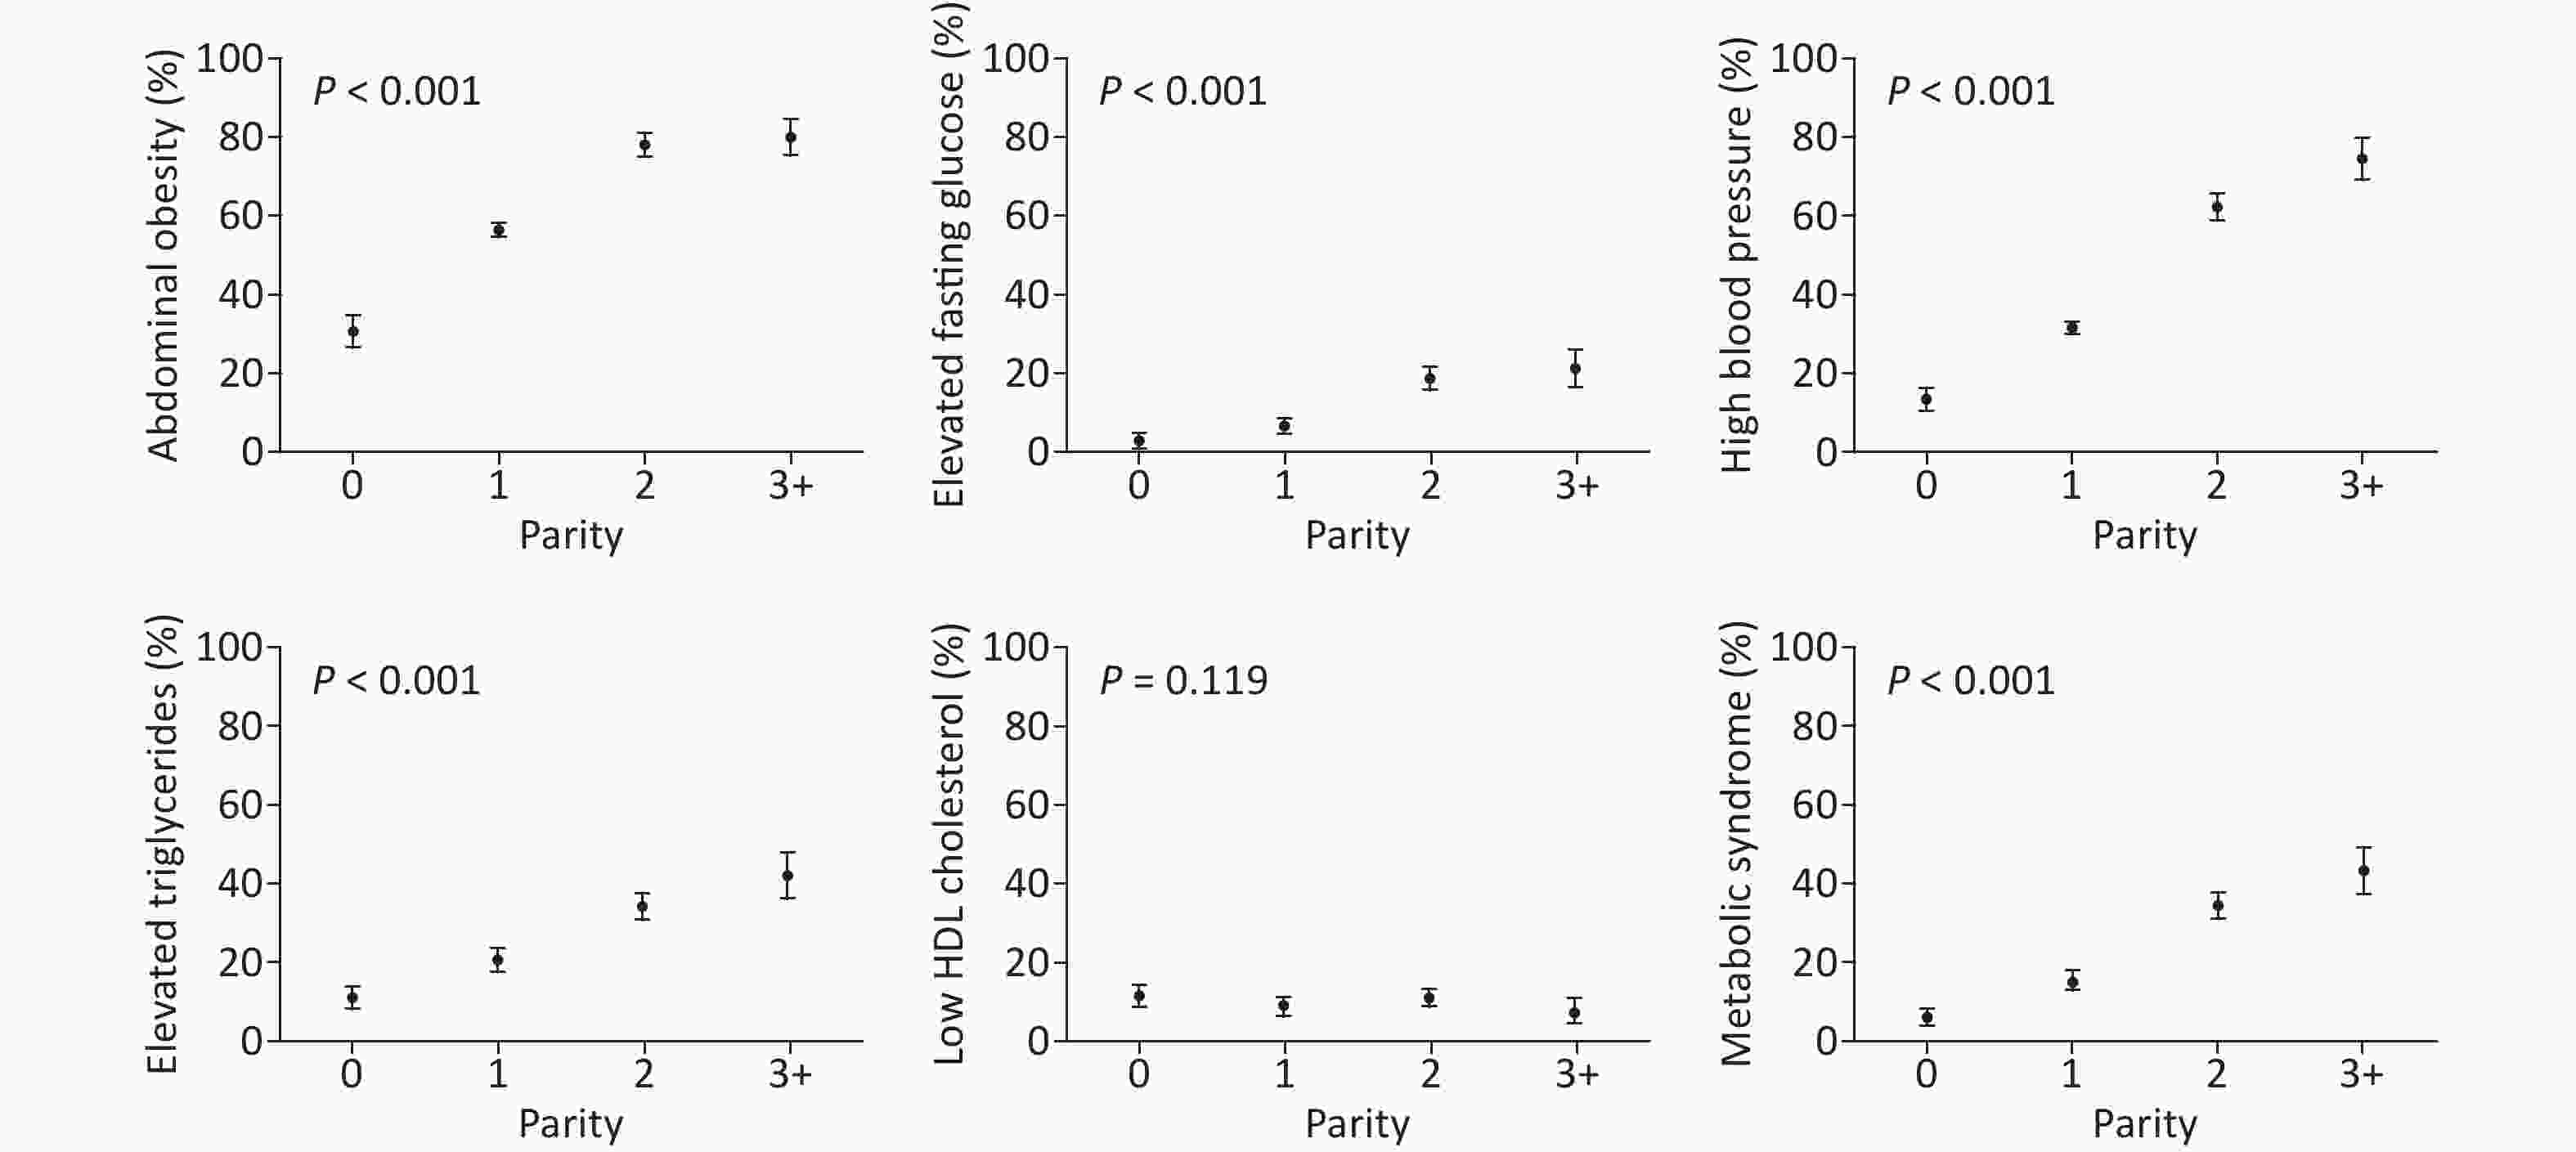
Figure 2. Prevalence of metabolic syndrome and individual components according to parity.
-
As depicted in Figure 3, there was no association between parity and low HDL cholesterol levels. Regarding the other four components and MetS, there was an increasing trend of ORs
among the parity groups. Compared with women with parity of one, nulliparous women had significantly decreased ORs in all models. Women with parity of two had statistically significant odds of abdominal obesity (OR = 1.45, 95% CI: 1.17–1.81, P < 0.001), high blood pressure (OR = 1.26, 95% CI: 1.03–1.54, P = 0.025), elevated fasting glucose levels (OR = 1.36, 95% CI: 1.03–1.79, P = 0.029), and MetS (OR = 1.39, 95% CI: 1.13–1.73, P = 0.002), and those with parity of three or more had statistically significant odds of elevated triglyceride levels (OR = 1.42, 95% CI: 1.04–1.94, P = 0.027) and MetS (OR = 1.50, 95% CI: 1.10–2.05, P = 0.011) after complete adjustment for age, postmenopausal status, marital status, current smoking, alcohol use, oral contraceptive use, physical activity, education level, and income (Supplementary Table S1 available in www.besjournal.com). 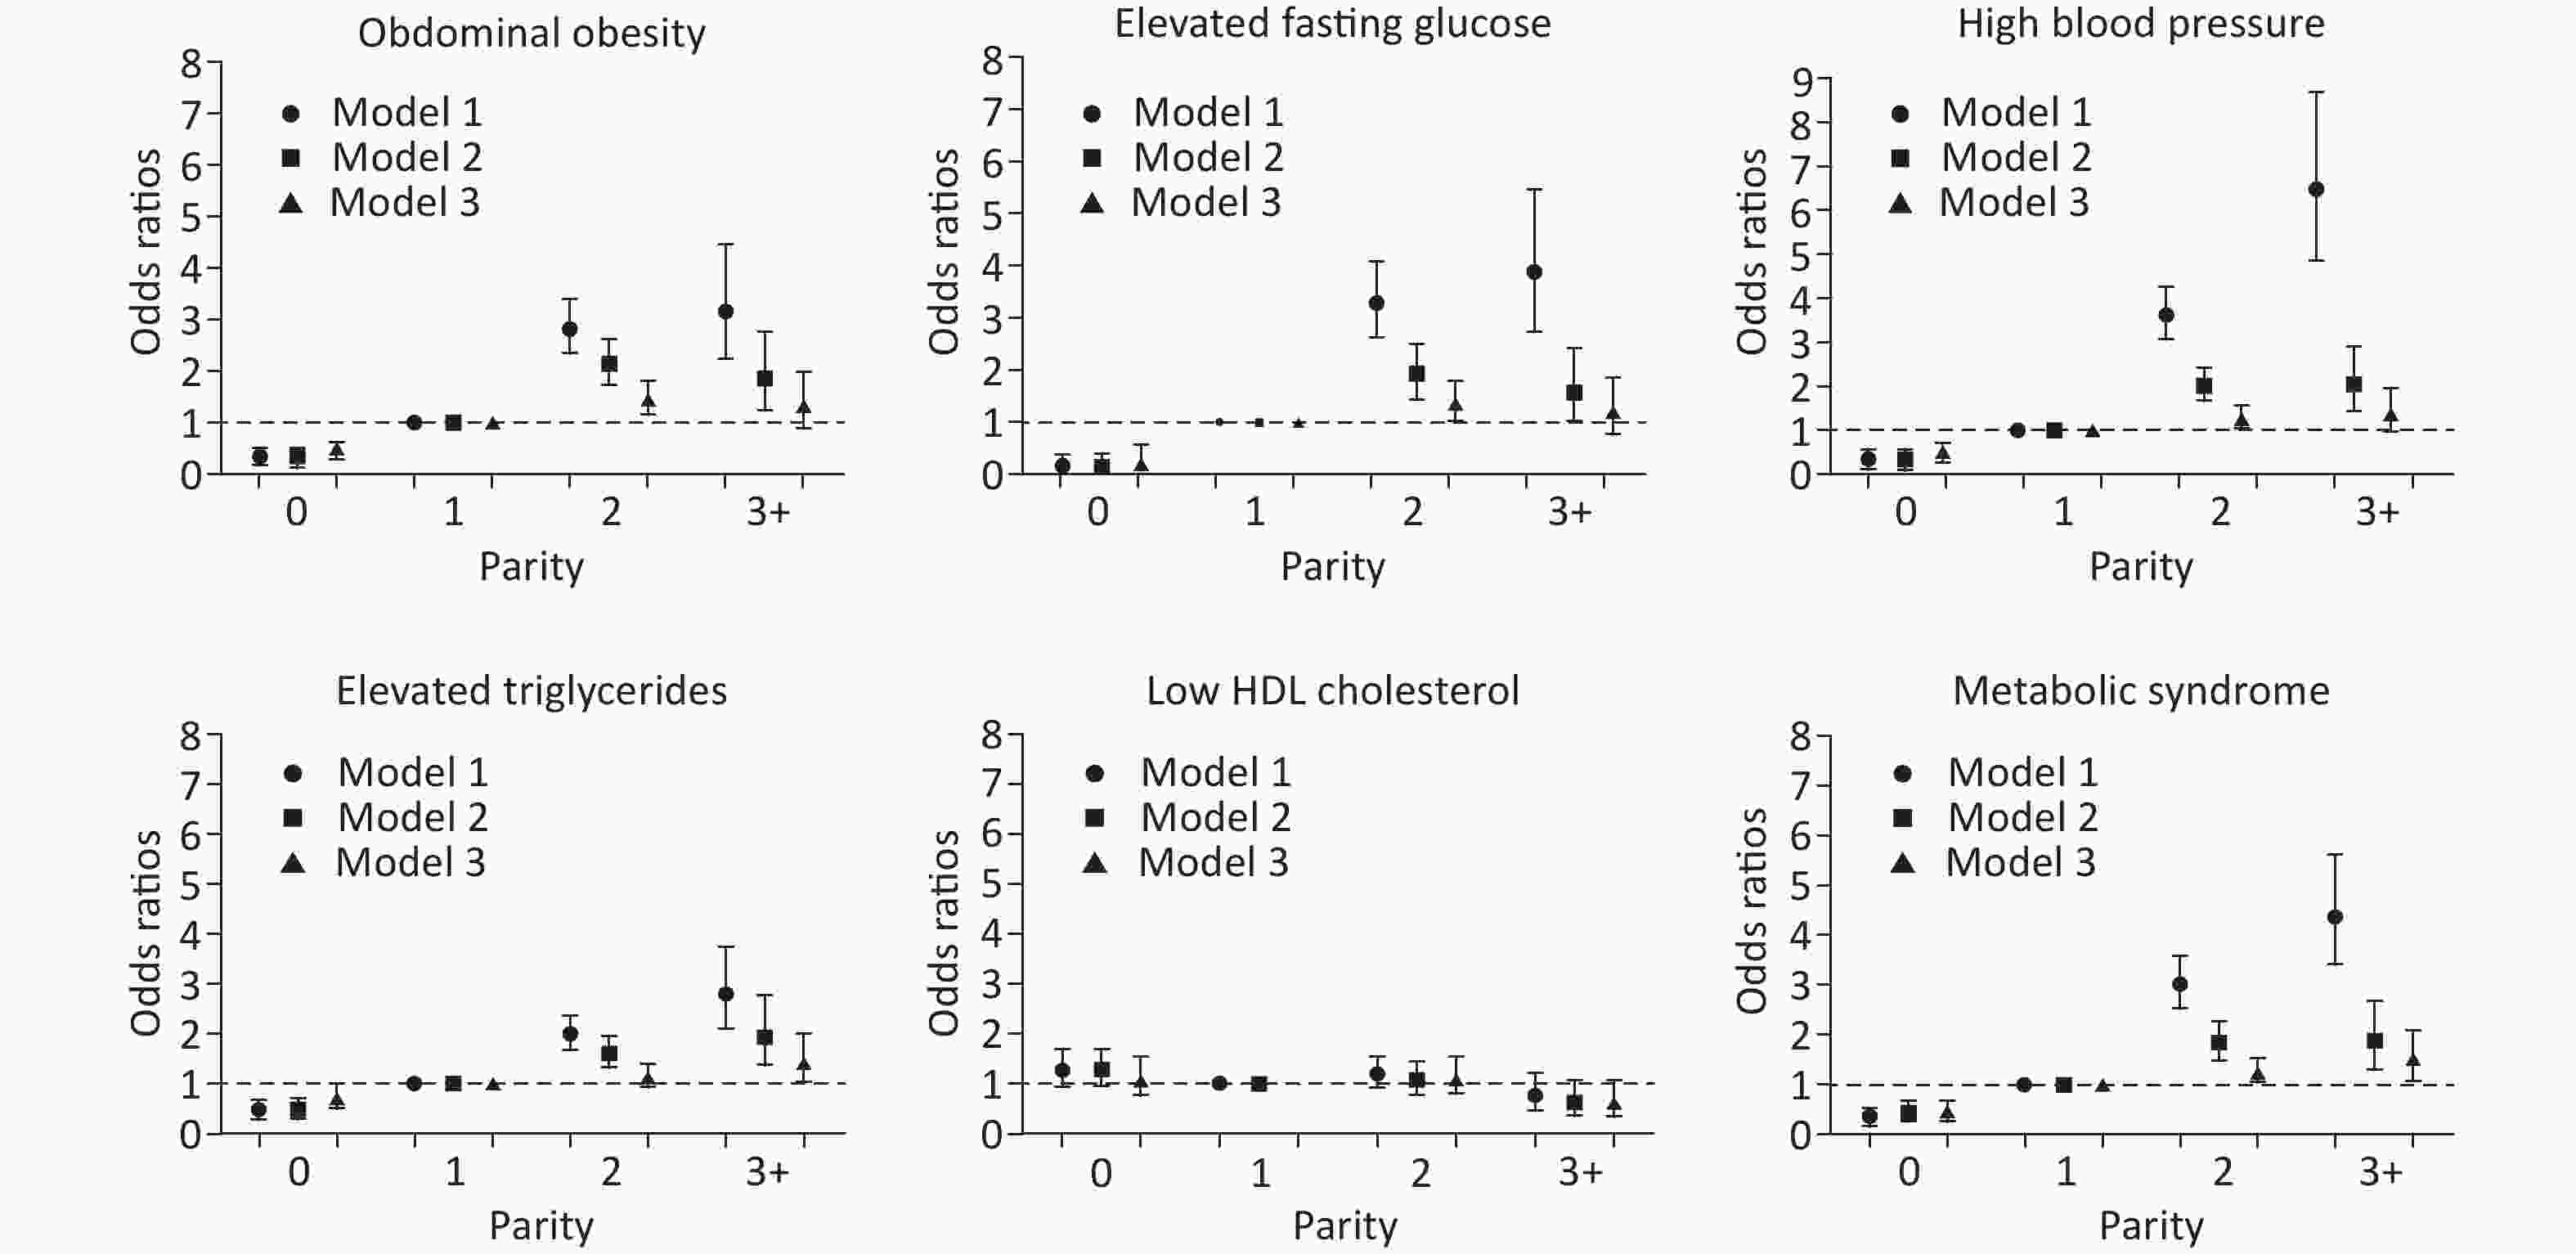
Figure 3. The associations between parity and metabolic syndrome and its components. Model 1: unadjusted. Model 2: adjusted for age. Model 3: adjusted for age, postmenopausal status, marital status, current smoking, alcohol use, oral contraceptive use, physical activity, education level, and income.
Parity Abdominal obesity Elevated triglycerides Elevated fasting glucose Low HDL cholesterol High blood pressure Metabolic syndrome OR
(95% CI)P OR
(95% CI)P OR
(95% CI)P OR
(95% CI)P OR
(95% CI)P OR
(95% CI)P Model 1 0 0.34
(0.28—0.41)< 0.001 0.47
(0.36—0.63)< 0.001 0.16
(0.07—0.37)< 0.001 1.27
(0.95—1.69)0.109 0.33
(0.25—0.43)< 0.001 0.35
(0.24—0.51)< 0.001 1 1 1 1 1 1 1 2 2.82
(2.34—3.39)< 0.001 2.00
(1.69—2.37)< 0.001 3.27
(2.63—4.08)< 0.001 1.19
(0.93—1.54)0.171 3.61
(3.07—4.25)< 0.001 3.01
(2.53—3.58)< 0.001 ≥ 3 3.16
(2.34—4.27)< 0.001 2.81
(2.19—3.59)< 0.001 3.80
(2.79—5.17)< 0.001 0.76
(0.48—1.21)0.246 6.47
(4.90—8.54)< 0.001 4.37
(3.41—5.61)< 0.001 Model 2 0 0.34
(0.28—0.42)< 0.001 0.48
(0.36—0.64)< 0.001 0.17
(0.08—0.39)< 0.001 1.28
(0.96—1.71)0.097 0.35
(0.27—0.45)< 0.001 0.37
(0.25—0.54)< 0.001 1 1 1 1 1 1 1 2 2.14
(1.74—2.63)< 0.001 1.62
(1.33—1.98)< 0.001 1.91
(1.45—2.51)< 0.001 1.07
(0.80—1.44)0.634 2.01
(1.67—2.42)< 0.001 1.84
(1.49—2.27)< 0.001 ≥ 3 1.83
(1.29—2.61)< 0.001 1.94
(1.43—2.63)< 0.001 1.57
(1.06—2.32)0.023 0.64
(0.37—1.08)0.093 2.03
(1.45—2.82)< 0.001 1.89
(1.38—2.56)< 0.001 Model 3 0 0.50
(0.40—0.63)< 0.001 0.72
(0.53—1.00)0.048 0.24
(0.10—0.57)0.001 1.09
(0.78—1.53)0.619 0.52
(0.38—0.70)< 0.001 0.45
(0.30—0.68)< 0.001 1 1 1 1 1 1 1 2 1.45
(1.17—1.81)< 0.001 1.15
(0.93—1.41)0.196 1.36
(1.03—1.79)0.029 1.11
(0.81—1.53)0.507 1.26
(1.03—1.54)0.025 1.39
(1.13—1.73)0.002 ≥ 3 1.30
(0.90—1.87)0.167 1.42
(1.04—1.94)0.027 1.20
(0.81—1.77)0.362 0.62
(0.36—1.07)0.084 1.37
(0.97—1.94)0.071 1.50
(1.10—2.05)0.011 Note. Model 1: unadjusted. Model 2: adjusted for age. Model 3: adjusted for age, postmenopause, marital status, current smoking, alcohol use, oral contraceptives, physical activity, education level and income. Table S1. Adjusted ORs for the associations between parity and the metabolic syndrome and its components
-
As shown in Table 2, subgroup analyses for the associations between parity and MetS and its components were performed according to BMI and age. BMI was subdivided by 25, age was subdivided by the median, and parity was included as a categorical variable.
Variables BMI* Age# ≤ 25 kg/m2 > 25 kg/m2 P-interaction ≤ 45 > 45 P-interaction Abdominal obesity 0.152 0.442 0 0.48 (0.37–0.64) 1.10 (0.45–2.70) 0.53 (0.41–0.69) 0.86 (0.30–2.46) 1 1 1 1 1 2 1.32 (1.02–1.72) 2.41 (1.19–4.89) 1.03 (0.61–1.75) 1.58 (1.26–1.99) ≥ 3 0.88 (0.56–1.38) 2.59 (0.97–6.92) 1.63 (0.27–9.88) 1.50 (1.07–2.09) Elevated triglycerides < 0.001 0.155 0 0.58 (0.37–0.91) 1.44 (0.85–2.44) 0.87 (0.60–1.26) 1.10 (0.34–3.51) 1 1 1 1 1 2 1.33 (0.98–1.81) 0.93 (0.70–1.25) 2.10 (1.15–3.83) 1.10 (0.90–1.34) ≥ 3 1.43 (0.88–2.32) 1.23 (0.81–1.87) 3.84 (0.63–23.45) 1.45 (1.15–1.91) Elevated fasting glucose 0.595 0.991 0 NA 0.64 (0.25–1.61) 0.46 (0.18–1.21) NA 1 1 1 1 1 2 1.23 (0.78–1.93) 1.34 (0.94–1.91) 1.82 (0.61–5.38) 1.08 (0.81–1.43) ≥ 3 0.91 (0.47–1.78) 1.23 (0.76–2.01) NA 0.73 (0.48–1.12) Low HDL cholesterol 0.034 0.359 0 1.29 (0.85–1.94) 1.19 (0.64–2.21) 1.01 (0.70–1.47) 2.69 (0.74–9.82) 1 1 1 1 1 2 1.35 (0.85–2.14) 0.89 (0.57–1.38) 0.88 (0.37–2.09) 1.34 (0.98–1.85) ≥ 3 0.54 (0.22–1.35) 0.60 (0.30–1.19) NA 0.81 (0.49–1.35) High blood pressure 0.078 0.523 0 0.48 (0.33–0.71) 0.81 (0.48–1.37) 0.69 (0.48–0.98) 1.13 (0.40–3.16) 1 1 1 1 1 2 1.22 (0.92–1.60) 1.21 (0.88–1.68) 1.33 (0.71–2.47) 1.66 (1.37–2.02) ≥ 3 0.96 (0.60–1.53) 1.73 (1.01–3.00) 5.88 (0.96–36.06) 2.54 (1.88–3.44) Metabolic syndrome < 0.001 0.497 0 0.35 (0.16–0.79) 0.89 (0.51–1.55) 0.65 (0.39–1.08) 1.01 (0.28–3.65) 1 1 1 1 1 2 1.28 (0.89–1.83) 1.17 (0.88–1.57) 1.93 (0.92–4.05) 1.45 (1.19–1.78) ≥ 3 0.90 (0.52–1.54) 1.53 (1.01–2.31) 6.48 (1.06–39.73) 1.90 (1.44–2.51) Note. *Adjusted for age, postmenopause, marital status, current smoking, alcohol use, oral contraceptives, physical activity, education level and income.
#Adjusted for postmenopause, marital status, current smoking, alcohol use, oral contraceptives, physical activity, education level and income. NA: not available.Table 2. Subgroup analyses for the association between parity and five components and metabolic syndrome according to BMI and age
After comparison of all the associations depicted between Figure 3 and Table 2, it appeared that BMI subgroups had no effects on the associations between parity and low HDL cholesterol levels, which showed no significant differences. BMI subgroups partially modified the associations between parity and other four components and MetS. Regarding MetS (Table 2), there were no more associations among women with parity of zero and BMI > 25 kg/m2 and among those with parity of two or with parity of three or more and BMI ≤ 25 kg/m2.
Similar to the above-described results, age subgroups had no effects on the associations between parity and low HDL cholesterol levels, whereas they partially modified the associations between parity and other four components and MetS. Regarding MetS (Table 2), the associations remained significant only among women with parity of three or more and among those with parity of two and age > 45 years.
-
In this study, we evaluated the prevalence and the associations between parity and MetS and its components among women in Northern China. We also explored the effects of BMI and age on these associations in subgroup analyzes. We found that there was a trend of increased prevalence of MetS and its four components with an increase in parity. Moreover, higher parity showed a positive association with MetS and select components, including abdominal obesity, high blood pressure, elevated fasting glucose levels, and elevated triglyceride levels. Furthermore, BMI and age subgroups modified the associations between parity and MetS.
Several cross-sectional studies have investigated the association between parity and MetS, with the majority of them reporting that multiparity was associated with an increased risk of developing MetS in different racial populations[9,19,20]. The longitudinal CARDIA (the Coronary Artery Risk Development in Young Adults) study also found that future development of MetS was associated with increasing parity and was independent of prior obesity and pregnancy-related weight gain[21]. In this study, we also found positive associations between high parity and MetS, which is consistent with past studies[9,19-21]. It is worth noting that the majority of subjects in our cohort were women with parity of one (72.9%), which is due to the specific one-child policy in China. Different birth control policies among countries would result in various sociodemographic confounders.
Regarding the associations between parity and MetS components, the most consistent finding across studies was the positive association between parity and abdominal obesity[9,19]. Some studies reported a linear association between increased parity and elevated triglyceride levels[19,20], which was similar to our results. Some studies found a significant association between increased parity and low HDL cholesterol levels[19,20], but another research found no association[22], and our findings were consistent with the latter. Although some studies have reported no associations between parity and high blood pressure[19,20], we found a positive association between parity and high blood pressure. Overall, results of the previous studies on the associations between parity and MetS components have been inconsistent. Several reasons might explain these discrepancies, including different ethnicities, components defined using different diagnostic criteria, women enrolled at different age groups, different adjusted confounders, and the proportion of nulliparous, parous, and multiparous women[9,21,23,24].
BMI, an important modifiable risk factor for a number of cardiovascular diseases, primarily represents the body weight. To our knowledge, this is the first study to perform an intensive assessment of the effect of BMI subgroups on the associations between parity and MetS and its components. We found that BMI subgroups partially modified the associations between parity and MetS and its four components, including abdominal obesity, high blood pressure, elevated fasting glucose levels, and elevated triglyceride levels, indicating that it might be important for women to control body weight to avoid the risk of MetS and the associated factors. Furthermore, there could be other potential factors mediating the development of MetS, such as the percentage of body fat and fat distribution pattern[9,25]. A study on a US Hispanic/Latina population showed that further adjustment for the percentage of body fat significantly influenced the relationships between parity and metabolic syndrome[9]. Moreover, age subgroups partially modified these associations similar to BMI subgroups, whereas age was an unmodifiable risk factor.
The mechanisms underlying the associations between parity and MetS remain unknown. However, previous studies have proposed a few possible biological mechanisms to understand these associations. First, pregnancy is associated with chronic metabolic alterations, including increase of lipid metabolism, insulin resistance, dysglycemia, obesity, and folate deficiency[26,27]. These effects can accumulate, especially for multiparous women. Second, the levels of sex hormones are modified during pregnancy, resulting in relatively lower protection by estrogen[28]. Reduced exposure to estrogen may promote the metabolic dysregulation of its components, including high blood pressure, hyperlipidemia, and hyperglycemia[29]. Furthermore, women have to go through a great deal of physiological, psychological, and social stress during childbearing and childrearing, which results in long-term variations in metabolic profiles[30,31]. All these biological alterations and lifestyle factors can facilitate the prevalence of MetS and its components.
Finally, it is necessary to consider several limitations of the present study. First, women in this cohort came from Northern China and had specific sociodemographic characteristics; thus, this could hinder the generalization of results to other provinces or other countries. In addition, there were particular family planning policies in China such as the one-child policy, so that the composition of the study population might be different from other cohorts. Moreover, this study did not assess reproductive factors, including age at gestation, miscarriage, abortions, and lactation, and perinatal complications such as gestational hypertension and gestational diabetes mellitus. Finally, we did not perform examinations for male individuals in this population, as their information could provide further insights into the role of childrearing.
In conclusion, this study suggested that multiparity was positively associated with MetS and select components in Northern Chinese women. BMI played a vital role in the associations between parity and MetS and its components. Regarding the high prevalence of MetS and its components in Chinese women, it is important to perform regular examinations, especially for multiparous women. Early detection of high-risk individuals can help in the primary prevention of MetS and cardiovascular diseases[32]. Further studies are required to identify whether there are causal relationships between parity and MetS and the underlying mechanisms.
-
We thank all the enrolled participants and their family members.
Funds:
This work was supported by grants from the National Natural Science Foundation of China [No.81670294, 81973138, 91749205, 81973112]

 Quick Links
 DownLoad: