


-
Hypertension has been a major risk factor for cardiovascular disease[1]. Hypertension overall prevalence in adults is 30%–45%, becoming > 60% in people aged above 60 years[2], with a worldwide age-standardised prevalence of 20 and 24% in women and men, respectively[3]. Hypertension high prevalence is consistent across the globe, regardless of countries income status[2]. It is expected that the percentage of hypertensive people will grow by 15% to 20% in 2025, achieving 1.5 billion[4]. Hypertension defined in adult as systolic and/or diastolic blood pressure equal to or above 140/90 mmHg[5]. It is usually classified as ‘primary’ or ‘secondary’ hypertension. A systolic blood pressure (BP) ≥140 mmHg contributes substantially for the mortality and disability burden (70%), mostly related too ischemic and hemorrhagic stroke (1.5 and 2 million, respectively), as well to ischemic cardiac disease (4.9 million)[6].
There are a series of ‘conventional’ risk factors for hypertension that include marital status, advanced age, behavioral factors[7], socioeconomic status (SES)[1]. Education, occupation, and income are the most commonly used indicators for the evaluation of SES of individuals. One meta-analysis indicated increased prevalence of hypertension among the low-income population in high-income countries including USA, Canada, and Europ[8]. In China, the rapid economic transformations including marketization, industrialization, urbanization, globalization, and informationalization resulted in aging demography, environmental changes, and unhealthy lifestyles, which led to significant increase in prevalence of cardiovascular disease[9]. Furthermore, the ‘three low’ including low awareness, low treatment, and low control increases the severity of hypertension in China. The awareness, treatment, and control rates of hypertension in Chinese in 2009−2010 were much lower than those in the American population in 1994−2004 (42.6% vs. 66.5%, 34.2% vs. 53.7%, and 9.3% vs. 33.1% for awareness, treatment, and control rates, respectively)[10].
Based on the above research the paper was ready to estimate whether there is a hypertension death difference in Inner Mongolia, China between low- and high-income regions. The results may serve as a basis for further hypertension research.
In the analysis, death data of hypertension in Inner Mongolia between 2008 and 2012 were determined using the Death Registry System (DRS). The DRS is maintained by the Ministry of Health of the People’s Republic of China and run by the Inner Mongolia Autonomous Region Centers for Disease Control and Prevention. The DRS uses a multistage cluster probability sampling strategy with stratification according to region, local gross domestic product, the proportion of rural dwellers, and the total populations of local areas to determine eight banners and countries as monitoring points. These banners and countries were from subordinate region of prefectures (The Inner Mongolia Autonomous Region is made up of twelve prefecture-level city). Eight monitoring points divided into high-income regions (≥ 10,000 RMB) and low-income regions (< 10,000 RMB) according to the per capita gross domestic product of economic index in Inner Mongolia. The income mentioned in our study was individual on average annual income of the monitoring point. The gross domestic product of the monitoring points was collected from the Inner Mongolia Statistical Yearbook (2010 and 2011), Global hypertension mortality as well as the total populations in different income areas were obtained from the World Health Organization[11].
Death data from DRS included age, ethnicity, location of residence, marital status, occupation, education level. Marital status was categorized as married or unmarried. Occupation was categorized as light and extensive manual work. Extensive manual work included service professional work, general work, and agriculture/livestock work. Light manual work included official and professional jobs, unemployed, and students. Education level was categorized as illiterate or primary school education (low), and middle school or higher (high). Area of residence was categorized as urban and rural, urban refers to in areas surrounding a city and under the jurisdiction of an urban government. Rural refers to a village or pastoral area. The Han nationality is the main nationality in China. Mongolia is the largest ethnic minority in Inner Mongolia Autonomous Region, and the number of other ethnic is small, such ethnic was categorized as Mongolia, Han and other. Population data from 2008–2012 were obtained from the Inner Mongolia Autonomous Region Centers for Disease Control and Prevention. The annual average population of the eight monitoring points was 2.4 million, accounting for approximately 10% of the total population of Inner Mongolia ADDIN EN.CITE .
Two methods are used for data quality control. The first one is an internal procedural check system, which evaluates timelines of death registration, completeness of entries in the registration form, and the accuracy of data entry. Errors detected from these checks are corrected through re-enquiry, which enhances the usability of the datasets. Second, the datasets are evaluated using statistical measures. The completeness and accuracy of population enumeration in the Disease Surveillance Points (DSP) system have been evaluated. Bias control measures, including training of staff and development of guidelines and regulations for death registration vary between different areas.
The all death of hypertension selected were coded according to the International Classifcation of Disease, 10th Revision (ICD–10), including essential hypertension (primary) (I10), hypertensive heart disease (I11), hypertensive renal disease (I12), hypertensive heart and renal disease (I13), and secondary hypertension (I15).
All-cause death data during the same period and monitoring points, except that due to circulatory system diseases, were used as controls. The all death in the control group selected were coded according to the ICD, 10th Revision (ICD–10), including malignant tumor (ICD–10 code of C00–C97), in situ tumor (D00–D09), benign tumor (D10–D36), undetermined or unknown tumor (D37–D48). All tumor deaths with having circulation system diseases (I0–I99) were excluded. The control group were matched with the hypertension deaths for age (± 1 years).
The average annualized hypertension mortality of 8 monitoring points in 2008–2012 (per 100,000 people) and the corresponding 95% confidence intervals (CIs) were calculated. Unconditional logistic regression analysis was used to determine the risk factors for hypertension mortality by income region. The proportions of hypertension death among total deaths in rural/urban areas and among extensive manual work/light manual work were calculated. The proportions of hypertension age-specific death among total deaths in rural and urban areas were calculated and plotted as line graphs by income region. The proportions of hypertension age-specific death between light and extensive manual workers were calculated and plotted in the same manner. Chi-square trend test was used about the increasing trend of mortality with age.
Microsoft Excel and SPSS version 22.0 (SPSS Inc., Chicago, IL, USA) were used for data management and analysis. The level of significance was set at P < 0.05.
Ethical approval was obtained from the Ethics Committee of Inner Mongolia.
There were 2,639 deaths due to primary hypertension and 0 death due to secondary hypertension which of the immediate causes of death include kidney failure, stroke, heart failure, myocardial infarction and other heart diseases. The crude hypertension mortality in Inner Mongolia was 23.1/105 people (95% CI: 22.7–23.6) which was 3.5 times higher than that worldwide (6.5/105 people, 95% CI: 6.3–6.7, P < 0.001) making up 8% of all circulatory system-related deaths according to the WHO in 2004. The hypertension mortality was 27.0/105 people in man and 16.6/105 people in woman, respectively (Table 1).
Characteristic n Mortality (1/105) χ2 P Inner Mongolia 2,639 23.12 Male 1,671 27.02 129.67 < 0.001 High income 175 12.86 Low income 1,496 31.02 Female 968 16.61 50.72 < 0.001 High income 113 9.23 Low income 855 18.57 World 986 6.47 1,048.67 < 0.001 High income 145 1.48 Low income 841 15.41 Note. n: death number; χ2: chi-square test value. Table 1. Hypertension mortality with respect to regional income in Inner Mongolia, China (2008–2012) and worldwide
The existing international research shows that the economic difference is one of the important factors that affect hypertension mortality[11]. Table 1 shows the hypertension mortality in low-income regions was 25.8/105, age-adjusted mortality was 24.9/105, and was 11.8/105 in high-income regions, age-adjusted mortality was 11.1/105. The hypertension mortality in low-income regions in Inner Mongolia was 2.2 times higher than that in high-income, and gender-specific mortality was also higher in low-income regions compared with high-income regions both in male (χ2 = 129.67, P < 0.001) and female (χ2 = 50.72, P < 0.001). Although our study prove the causal relationship between hypertension mortality rate and income is difficult, however, the results are consistent with most studies worldwide[4], such as the hypertension mortality in low-income regions in worldwide was approximately 10 times higher than that in high-income regions (χ2 = 1048.67, P < 0.001)[11]. Previous research showed that primary care physicians and other health care could substantially control hypertension[12, 13]. The contributors for the difference in hypertension mortality by income level include access to care, affordability for care and adherence to treatment. The data from Inner Mongolia Statistical Yearbook 2012 showed that in high-income regions, the average number of hospitals, the number of beds in hospital, and the number of medical technical personnel were 1.5 times higher than those in low-income regions[14], suggesting that access to care for hypertension in high income regions was higher than that in low income regions. Based on the results that the hypertension mortality rate in low-income regions was higher than that in high-income regions, we should increase the investment of health care facilities in low-income regions.
There were 8,420 death were selected in the control group. The average age of control group and hypertension death group were matched. The average age of death from hypertension were 71.5 ± 11 years and the control group were 70.8 ± 8 years, P > 0.1 by Chi-square test. In the death of hypertension the ratio of male to female is 1.72:1, the ratio of rural to urban is 0.87:1, the ratio of extensive manual work to light manual work is 3.51:1. In the control group the ratio of male to female is 1.77:1, the ratio of rural to urban is 0.89:1, the ratio of extensive manual work to light manual work is 3.50:1.
In our study, in high-income regions, the proportion of hypertension death in total death in rural (8.41%) a was significantly higher than that in urban (1.73%) (χ2 = 156.461, P < 0.001). Living in rural is a risk factor for hypertension death [odds ratio (OR) = 0.094, 95% CI: 0.063–0.139, P < 0.001] (Table 2). The level of health care and education in rural is lower than that in urban in China[10], which could lead to a lack of prevention and treatment of hypertension. Therefore, we consider that this may be the cause of higher hypertension death in rural of high-income regions. The regional differences in income on the relationship between labor intensity and results are only shown in low-income regions which was gotten from Table 2. In low-income regions, the proportion of hypertension death in total death in light manual work (10.91%) was higher than in extensive manual work (7.91%). Light manual work had a higher risk of hypertension death (OR = 2.577, 95% CI: 2.274−2.920, P < 0.001). Light manual work generally have little physical activity, most of them are engaged in mental work. Mental Laborers are more likely to suffer from cardiovascular diseases than manual workers in China[12].
Characteristic Low income High income P OR (95% CI) P OR (95% CI) Sex Women 1 1 Men 0.436 − 0.717 − Ethnic Han 1 1 Mongolian < 0.001 0.609 (0.482−0.770) 0.387 − Other 0.009 0.493 (0.290−0.838) 0.956 − Area Rural 1 1 Urban 0.595 − < 0.001 0.094 (0.063−0.139) Marital status Unmarried 1 1 Married < 0.001 0.673 (0.607−0.747) < 0.001 0.543 (0.382−0.771) Labor intensity Extensive manual 1 1 Light manual < 0.001 2.577 (2.274−2.920) 0.264 − Education level Illiterate and primary school 1 1 Middle school and high school 0.180 − 0.227 − Note. OR: odds ratio; CI: confidence interval; −: not available. Table 2. Logistic regression analysis of hypertension death in different income regions in Inner Mongolia
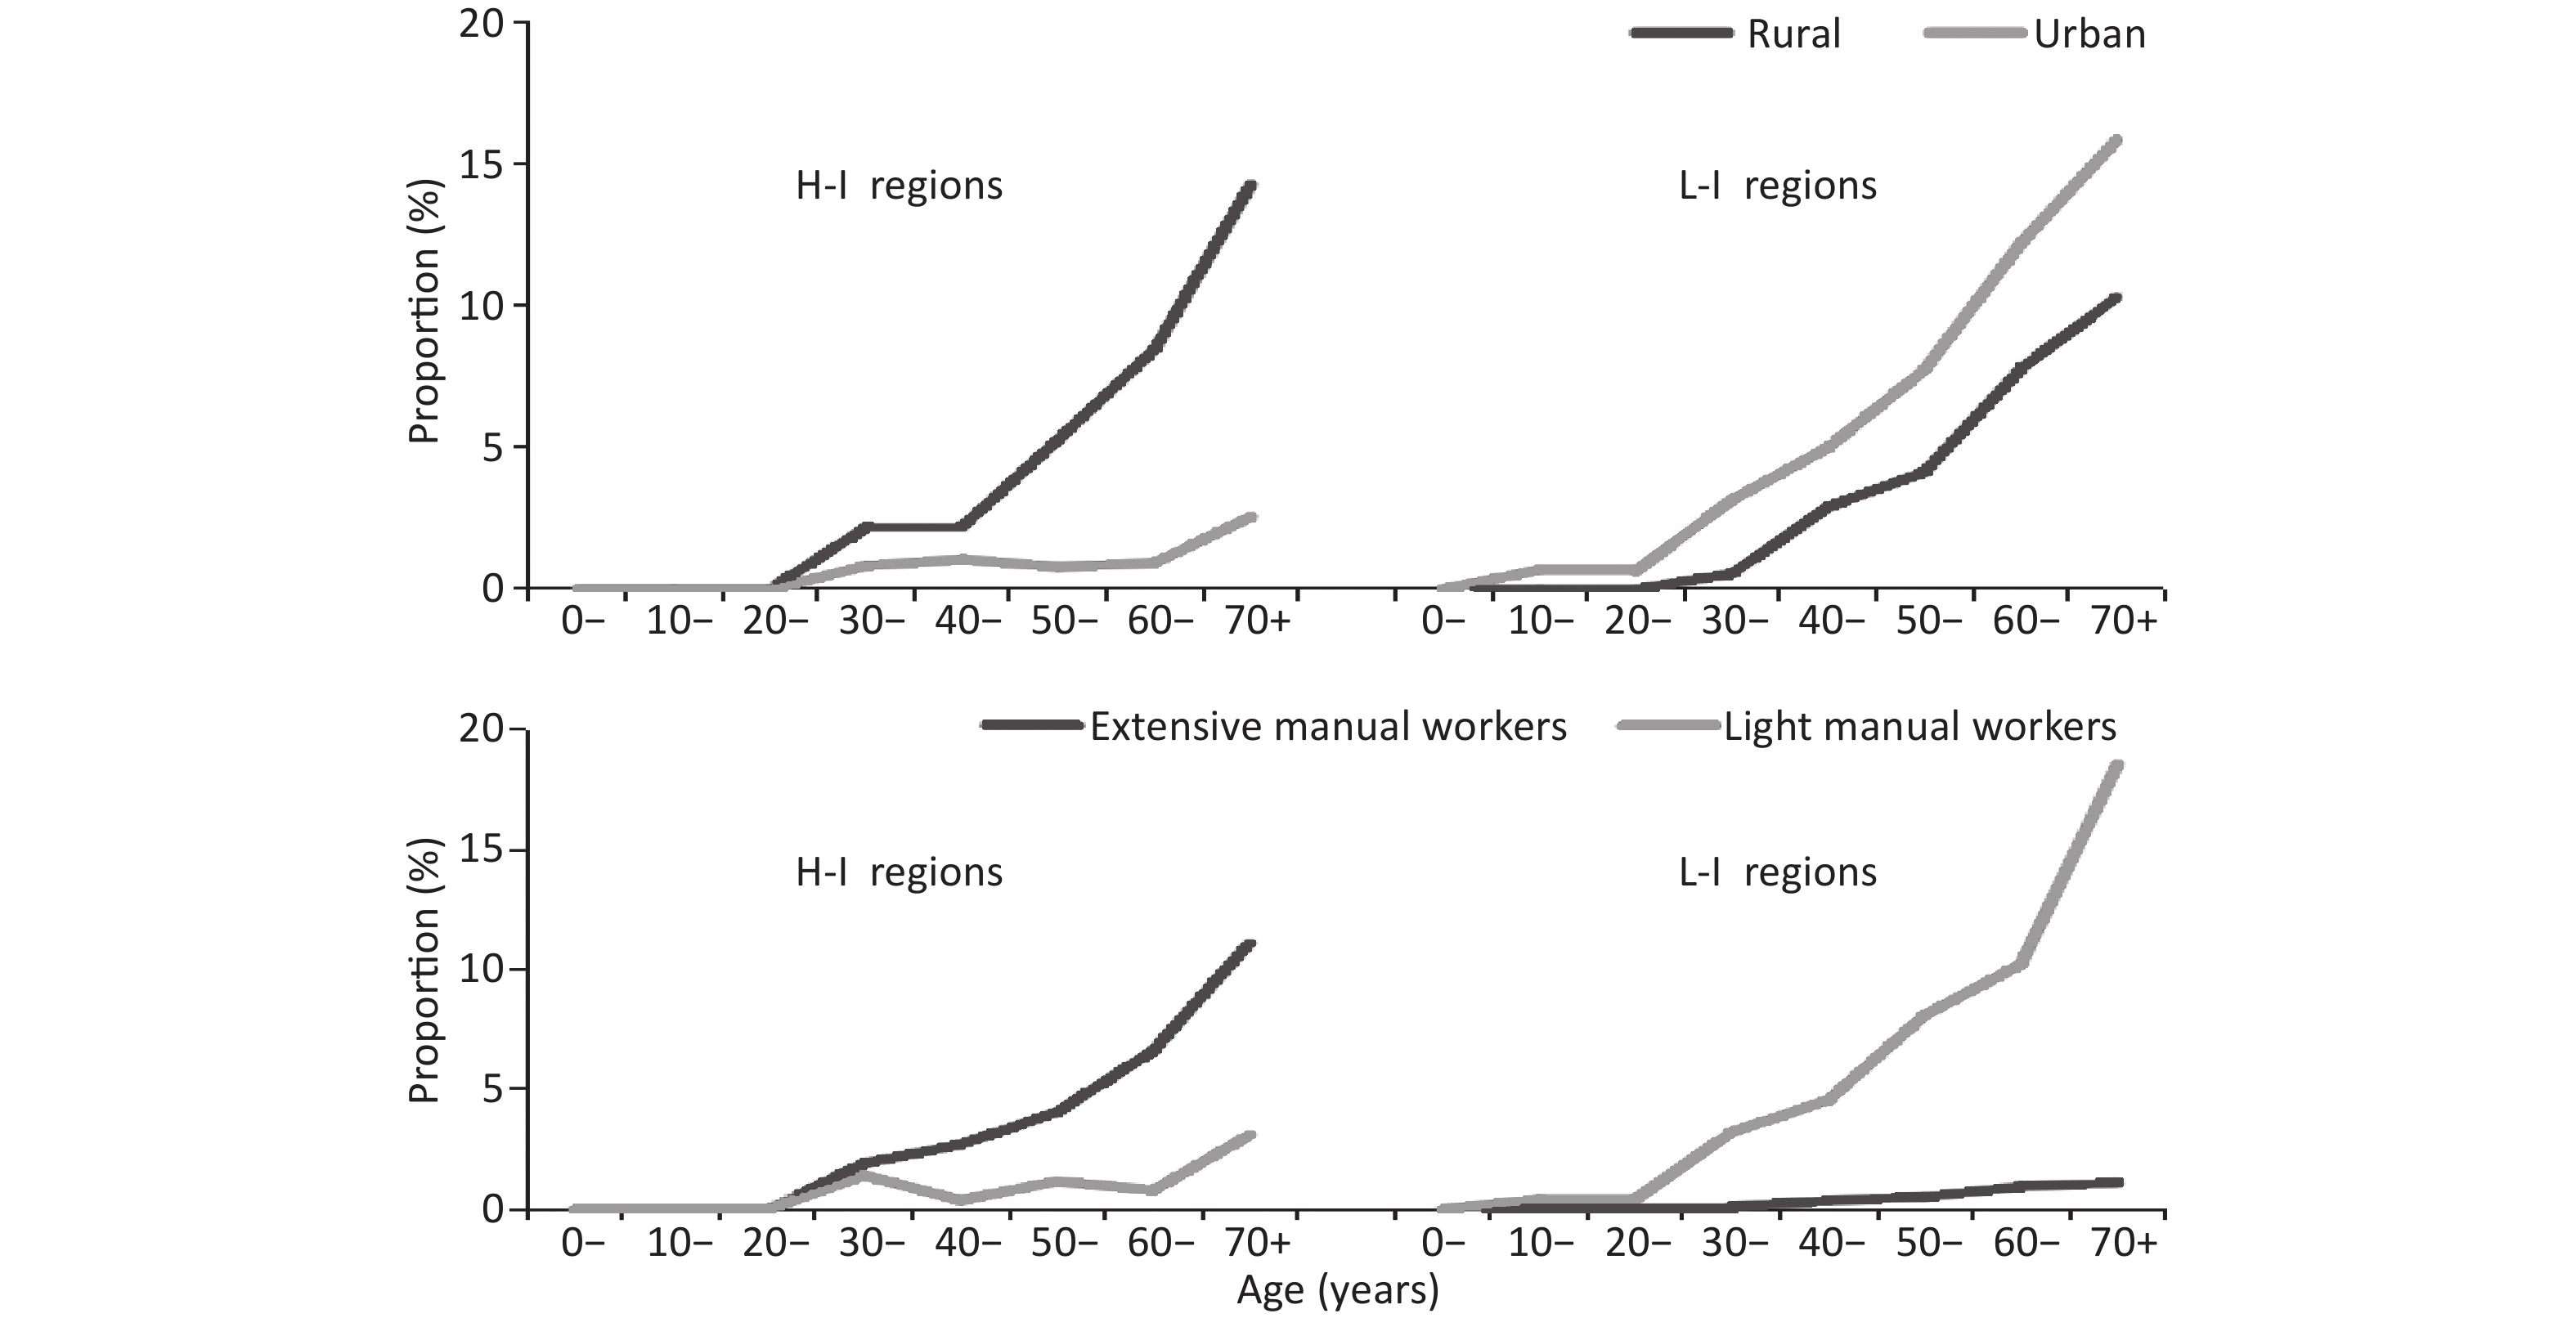
In over 30 age groups, the hypertension death increased with age and the highest deaths occurs in the highest age group ( > 70 age group) regardless of income, which is consistent with other cardiovascular disease death[11]. Hypertension death are very few under 30 years old, therefore we discussed followed in over 30 population (Figure 1).
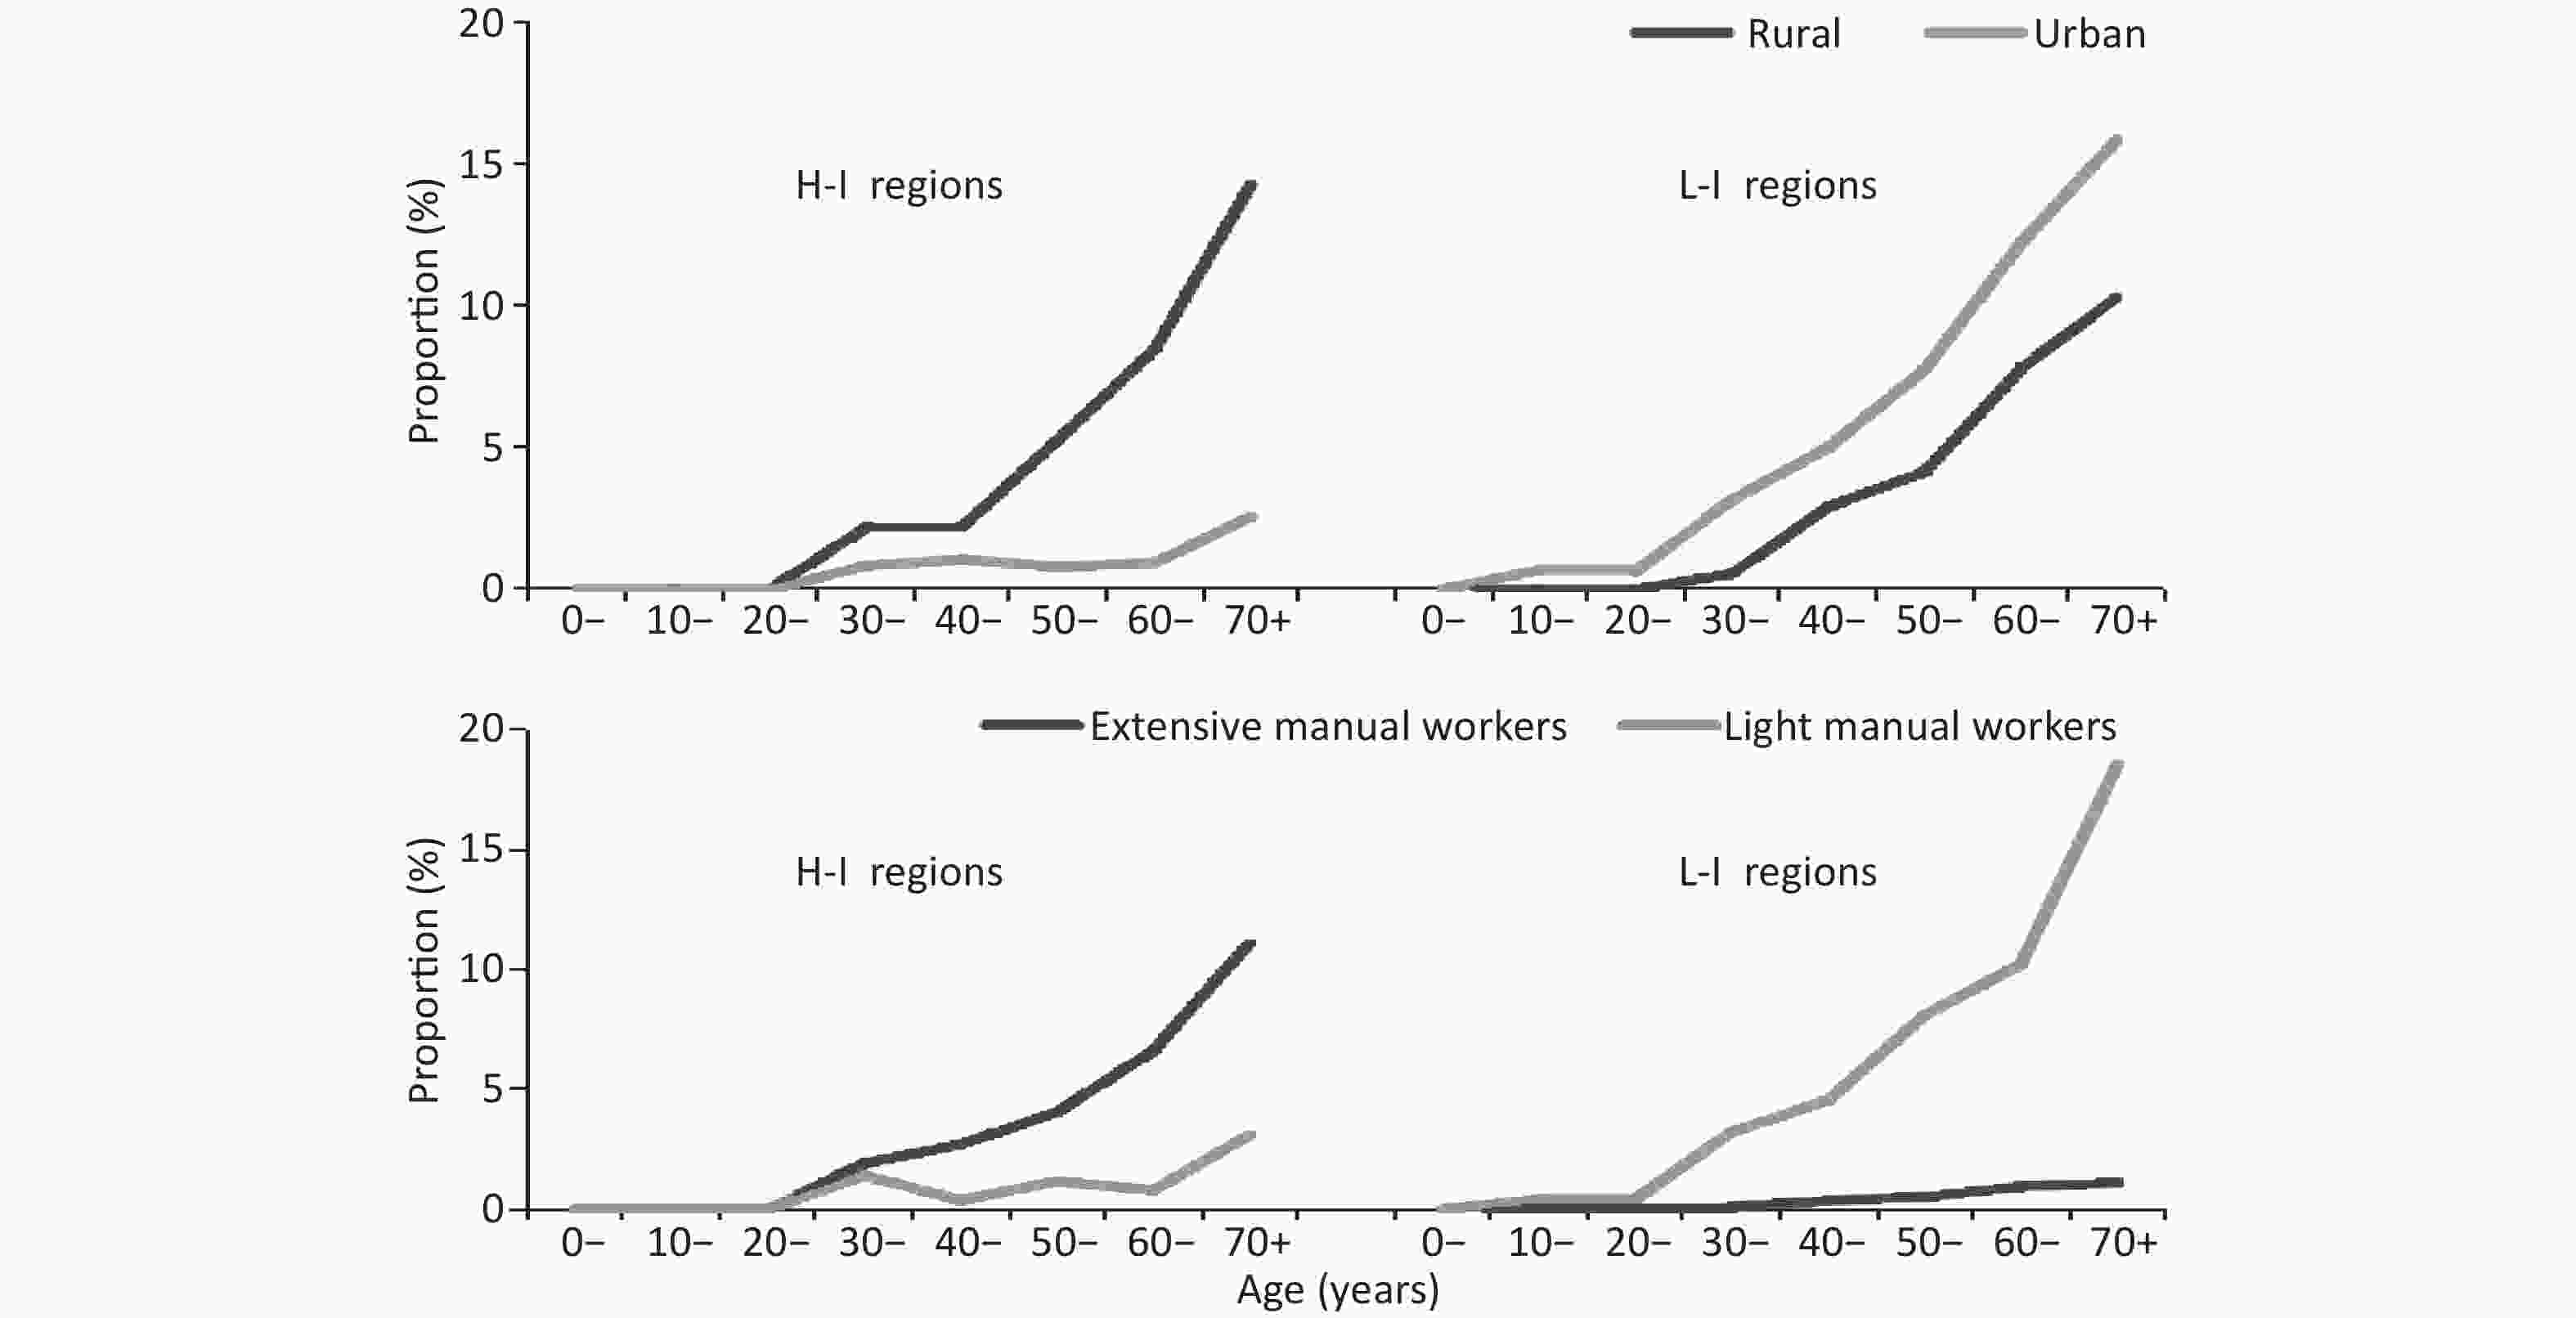
Figure 1. Age-specific proportion of hypertension death by area and labor intensity in different income regions; L-I regions: low-income regions; H-I regions: high-income regions.
In high-income regions, the hypertension death proportion in rural increased with age steeply, and the highest reached 14.30%. The case was different in urban, the proportions in each age group older in urban were lower than that in rural and the proportions in 30 to 59 age groups range from 0.79% to 1.06%. In the over 60 age group, the proportion increased with age and the highest reached 2.56%. In low-income regions, the difference of proportion between urban and rural in each age groups was similar which was approximately 2%, and the highest reached 15.87% and 10.31% respectively. In urban of low-income regions the proportions were highest regardless of in income and area of residence in each age group.
In high-income regions, the proportion of hypertension death in extensive manual work increased with age (χ2 = 50.390, P < 0.001) with the highest of 11.11%. The case was different in light manual work, the highest was only 3.11%, which less than 1/3 of the highest in extensive manual work. In low-income regions, the difference between light (highest: 18.55%) and extensive (highest: 1.10%) manual work increased with age range from 0.39% to 17.45%. In light manual work of low-income regions the proportions were highest regardless of income and labor intensity in each age group.
The authors declare that there are no conflicts of interest.
Funds:
This work was supported by the Natural Science Foundation of Inner Mongolia in China [2016MS0828]
Reference 
 Quick Links
 DownLoad: