


-
An outbreak of a novel coronavirus disease emerged in Wuhan, China, in December 2019[1]. The disease rapidly spread to many countries and regions and was later named as Coronavirus Disease 2019 (COVID-19) by WHO. As of July 1st , over 850,000 confirmed cases of COVID-19 and 4,600 deaths had been reported by the National Health Commission of China and a total of global 10,357,662 cases of COVID-19 had been reported by WHO[2]. Full-genome sequencing analysis has uncovered a novel coronavirus that is now named severe acute respiratory syndrome coronavirus 2 (SARS-CoV-2) by the International Committee on Taxonomy of Viruses. SARS-CoV-2 is related to Middle East respiratory syndrome coronavirus (MERS-CoV) and severe acute respiratory syndrome coronavirus (SARS-CoV)[3]. The SARS-CoV-2 is close to bat coronaviruses and bats are currently suggested to be the primary transmission source of SARS-CoV-2 and pangolins are the potential intermediate hosts[4, 5]. Meanwhile, human-to-human transmission and family-aggregated characteristics of the COVID-19 have been reported[6-10].
So far, there are no specific therapies or vaccines for the COVID-19. The current treatment is symptomatic and supportive treatment. Early diagnosis, early isolation and early treatment are effective strategies for COVID-19 management. At present, the majority of patients with COVID-19 in China are adult patients. In adults, common symptoms of COVID-19 include fever, dyspnea, dry cough, and fatigue, followed by headache and sore throat[11]. Laboratory tests for COVID-19 patients showed that they have normal or low leukocyte counts; and computed tomography scans of chest showed ground-glass opacity. Complication may develop with disease progression and underlying diseases are risk factors for death[1]. Chen reported that COVID-19 was more likely to affect older men with comorbidities, and could result in acute respiratory distress syndrome (ARDS)[2]. On January 20th, 2020, Shenzhen reported a confirmed pediatric case of COVID-19 in China, suggesting children is a susceptible group of COVID-19[6]. The immunity and development in children are unique in comparison to adults. Although the reported pediatric infection rate of COVID-19 is not high, the number of pediatric patients is increasing with the remaining rapid increase in global infected cases. However, data on the clinical characteristics and outcomes between children and adults with COVID-19 are limited[6, 12]. As for SARS and MERS, the clinical symptoms of pediatric patients were relatively mild and the prognosis is relatively good[13, 14]. In this study, we retrospectively compared the clinical characteristics of pediatric and adult patients with COVID-19, in perspectives of route of transmission, symptoms, laboratory and radiographic findings, treatment, and outcome.
-
Patients who were admitted to the departments of internal medicine of Shenzhen Third People’s Hospital from 11th January to 10th February 2020, and with a positive results of nucleic acid test for SARS-CoV-2 were included in this retrospective study. The study protocol was approved by the institutional ethics board of Shenzhen Third People’s Hospital. The ethics committee waived written consents because of the emergency of outbreak, and oral consents were acquired from patients at the time of admission. Shenzhen Third People’s Hospital is one of the major tertiary teaching hospitals of Guangdong province and is the government designated treatment center to treat all patients with COVID-19 in Shenzhen regions. All COVID-19 patients enrolled in this study were diagnosed according to World Health Organization interim guidance[15]. The clinical outcomes (Discharges, fatality, length of hospital stay) were monitored up to 15th March 2020, the final date of follow-up.
-
Patients who presented to the medical center with symptoms or contact history concerning for SARS-CoV-2 infection were triaged and subsequently subjected to nucleic acid test. Confirmed patients received treatment in accordance with the Chinese Programme for the Diagnosis and Treatment of Novel Coronavirus Infected Pneumonia under isolation[15]. All patients received antiviral therapy, including ribavirin, interferon, lopina veletonavir, favipiravir, abidal or choroquine. The symptoms, sign, leukocyte level, c-reactive protein (CRP) level, procalcitonin (PCT) level, and imaging performance of patients were fully taken into account to start antibiotic therapy. Patients were cared for by trained medical staff who recorded clinical data into the electronic medical records. All included patients were followed up until 15th March 2020.
-
Laboratory confirmation of the COVID-19 was made by the Shenzhen Center for Disease Control and Prevention (CDC). COVID-19 was confirmed by quantitative real-time polymerase chain reaction (qRT-PCR) using the same protocol established by the World Health Organization[16]. qRT-PCR detection reagents were provided by the Chinese CDC. Laboratory confirmation was defined as a positive result to next-generation sequencing analysis or reverse-transcriptase polymerase-chain-reaction (qRT-PCR) assay for blood, nasal and pharyngeal swab specimens.
-
Throughout hospitalization, patients were cared for by medical staffs and physicians, who rounded at least daily and recorded epidemiological data, vital signs, clinical data, laboratory results, radiological features, treatment and outcomes into the electronic medical records. At analysis, we retrieved the demographic data, medical history, exposure history, underlying comorbidities, symptoms, signs, laboratory findings, chest computed tomographic (CT) scans, and treatment measures (including antiviral therapy, antibiotics therapy, corticosteroid therapy, respiratory support, kidney replacement therapy). According to the Chinese Programme for the Diagnosis and Treatment of Novel Coronavirus Infected Pneumonia, the severity of patients were classified into mild, moderate, severe and critical[15]. The discharge criteria were: 1. Temperature returned to normal for more than 3 d; 2. Respiratory symptoms improved significantly; 3. Imaging of the lungs showed a marked improvement in acute exudative lesions; 4. Nucleic acid tests were negative for two consecutive respiratory specimens (sampling time interval at least 1 d)[15]. ARDS was defined in accordance with the Berlin definition[17] . Acute kidney injury and acute liver injury were defined according to the kidney disease: Improving Global Outcomes definition and ACG Clinical Guideline[18, 19]. Cardiac injury was defined according to the recognized standard[20]. Children are defined as under the age of 18 and adults are defined as 18 and above. Length of hospital stay was defined as the interval from the date of admission to the date of discharge, death or the last follow-up.
-
Continuous variables were presented as median and interquar tile range (IQR), and were compared using the Mann-Whitney test. Categorical variables were presented as frequ ency and percentage, and were compared using a chi-square test or Fisher’s exact test when appropriate. Bonferroni correction was used for multiple comparison of the same group. The Kaplan-Meier method was used to estimate the length of hospital stay, and then the differences between groups were assessed by a log-rank test using GraphPad Prism version 7.01 (GraphPad, Inc., LaJolla, CA, USA). Other data analyses were performed using SPSS (Social Science Statistics Package) version 23.0. All statistical tests were two-sided, and P < 0.05 was considered statistically significant.
-
As shown in Table 1, of 333 included patients with COVID-19, pediatric patients accounted for 9.9% (33/333) and adult patients accounted for 90.1% (300/333). The median age of adult patients was 47.0 (IQR, 33.0–66.0) years and of pediatric patients was 6 (IQR, 2.5–9.5) years. There were 51.5% female patients in total. No difference in sex was found between pediatric and adult patients (P = 0.451). One hundred and fifty (45.0%) patients had contacted with patients from Hubei province, 22 (6.6%) patients had contacted with patients from other provinces, 13 (3.9%) patients were residents of Shenzhen with no clear contact history, 122 (36.6%) patients were residents of Hubei province, and 26 (7.8%) patients had unknown contact history. There was difference in pandemic exposure (P = 0.025) between pediatric and adult patients. No cross-infection, medical staff infection or nosocomial infection occured in our center.
Clinical characteristics Count (%) P value* All patients (n = 333) Pediatric patients (n = 33) Adult patients (n = 300) Sex 0.451 Female 171 (51.4) 19 (57.6) 152 (50.7) Male 162 (48.6) 14 (42.4) 148 (49.3) Age, median (IQR) 47 (33.0–60.0) 6 (2.5–9.5) 50 (36.0–61.0) < 0.001 Epidemiological history 0.025 Contact with patients of Hubei province 150 (45.0) 23 (69.7) 127 (42.3) Contact with patients of other provinces 22 (6.6) 2 (6.1) 20 (6.7) Residents of Shenzhen with no clear contact history 13 (3.9) 0 (0.0) 13 (4.3) Residents of Hubei province 122 (36.6) 7 (21.2) 115 (38.3) Others 26 (7.8) 1 (3.0) 25 (8.3) Co-infection of other respiratory viruses (n = 323)† 0.014 No 317 (98.1) 29 (90.6) 288 (99.0) Yes 6 (1.9) 3 (9.4) 3 (1.0) Symptom onset to hospitalization, d (IQR) 3 (1.0–5.0) 1(1.0–1.0) 3 (2.0–6.0) < 0.001 Symptoms and signs Fever 257 (77.2) 11 (33.3) 246 (82.0) < 0.001 Cough 168 (50.5) 7 (21.2) 161 (53.7) < 0.001 Sputum 81 (24.3) 2 (6.1) 79 (26.3) 0.010 Dyspnea 15 (4.5) 1 (3.0) 14 (4.7) 1.000 Temperature, °C 0.078 < 37.3 215 (64.6) 28 (84.8) 187 (62.3) 37.3–38.0 86 (25.8) 4 (12.1) 82 (27.3) 38.1–39.0 31 (9.3) 1 (3.0) 30 (10.0) > 39.0 1 (0.3) 0 (0.0) 1 (0.3) Heart rate, median (IQR) 87 (80–96) 98 (88–114) 86 (79–95) < 0.001 Breathing rate, median (IQR) 20 (19–20) 22 (20–24) 20 (19–20) < 0.001 Systolic pressure, median (IQR), mmHg 125 (115.0–136.0) 103 (95.5–115.5) 126 (116.3–137.8) < 0.001 Severity < 0.001 Mild 33 (9.9) 13 (39.4) 20 (6.7) Moderate 271 (81.4) 20 (60.6) 251 (83.7) Severe and critical 29 (8.7) 0 (0.0) 29 (9.7) Underlying diseases 78 (23.4) 0 (0.0) 78 (26.0) 0.001 Hypertension 39 (11.7) 0 (0.0) 39 (13.0) 0.055 Diabetes 18 (5.4) 0 (0.0) 18 (6.0) 0.298 Heart disease 15 (4.5) 0 (0.0) 15 (5.0) 0.383 Chronic lung disease 11 (3.3) 0 (0.0) 11 (3.7) 0.545 Chronic liver disease 8 (2.4) 0 (0.0) 8 (2.7) 1.000 Malignant tumors 3 (0.9) 0 (0.0) 3 (1.0) 1.000 Cerebrovascular disease 2 (0.6) 0 (0.0) 2 (0.7) 1.000 Others 7 (2.1) 0 (0.0) 7 (2.3) 1.000 Note. Data are presented as n (%) and median (interquartile ranges, IQR).
*P values indicate differences between pediatric and adult patients. P < 0.05 was considered statistically significant.
†Number of patients for whom data were available.Table 1. Baseline clinical characteristics of COVID-19 patients
-
Pediatric patients had higher rate of co-infection of other respiratory viruses (including: respiratory syncytial virus and influenza B virus) compared to adult patients (9.4% vs. 1.0%, P = 0.014). They also had a shorter time of symptom onset to hospitalization than adults [median time, 1 (IQR, 1.0–1.0) d vs. 3 (IQR, 2.0–6.0) d, P < 0.001]. Some symptoms such as fever (33.3% vs. 82.0%, P < 0.001), cough (21.2% vs. 53.7%, P < 0.001), and sputum (6.1% vs. 26.3%, P = 0.010), are rarer in children than in adults. There was a significant difference in clinical severity classification that children had lower grades than adults (children: 39.4% mild, 60.6% moderate, 0.0% severe and critical vs. adults: 6.7% mild, 83.7% moderate, 9.7% severe and critical, P < 0.001). Underlying diseases were reported only by adults, including 39 (13.0%) cases of hypertension, 18 (6%) cases of diabetes, 15 (5%) cases of heart disease, 11 (3.7%) cases of chronic lung disease, 8 (2.7%) cases of chronic liver disease, 3 (1%) cases of malignant tumors, 2 (0.7%) cases of cerebrovascular disease, and 7 (2.3%) cases of other underlying diseases.
-
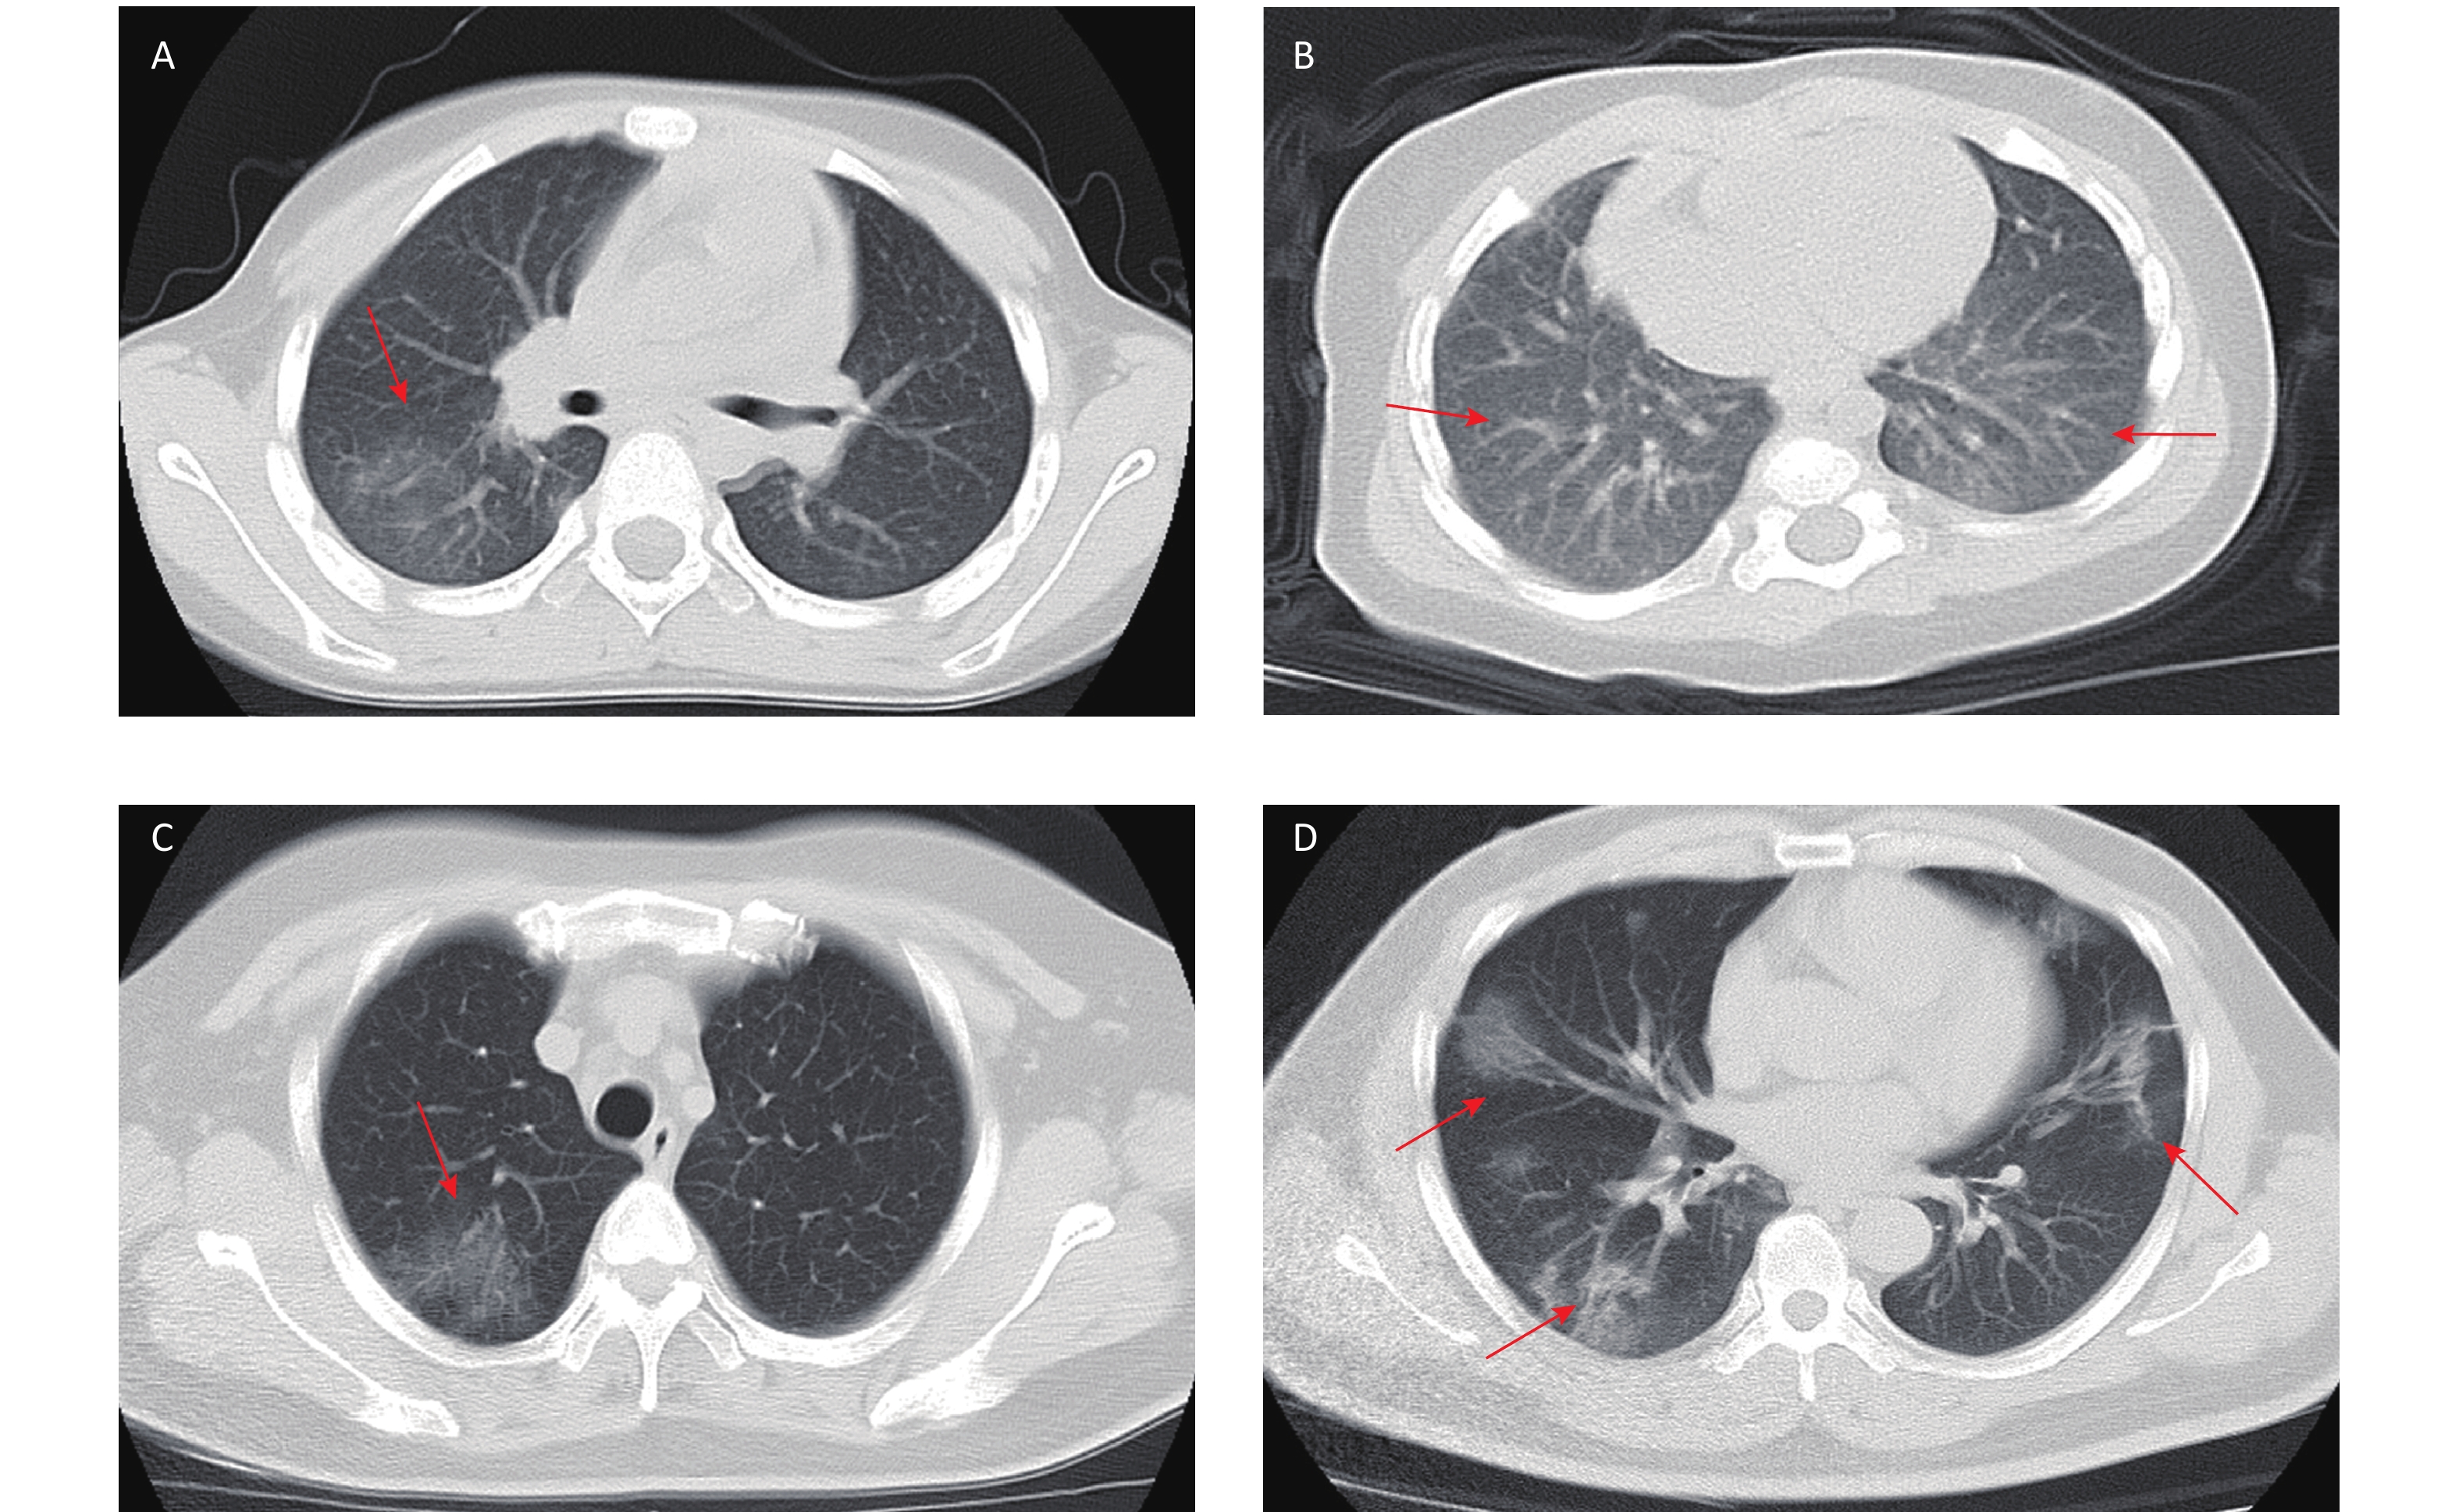
COVID-19 related laboratory examination data on admission were retrieved and summarized in Table 2. Compared with adult patients, pediatric patients had higher levels of white blood cell counts (P < 0.001), lymphocyte counts (P < 0.001), platelet counts (P < 0.001), aspartate aminotransferase (AST) (P = 0.001), alkaline phosphatase (ALP) (P < 0.001), lactic acid dehydrogenase (LDH) (P = 0.003), creatine kinase-MB (CK-MB) (P < 0.001), PaO2 (P < 0.001), PaO2/FiO2 (P < 0.001), T lymphocyte count (P < 0.001), CD4+ T lymphocytes counts (P < 0.001) and CD8+ T lymphocyte counts (P < 0.001). Compared with adult patients, pediatric patients had lower levels of hemoglobin (Hb) content (P = 0.001), total bilirubin (TBIL) (P = 0.001), alanine aminotransferase (ALT) (P = 0.017), gamma-glutamyltransferase (GGT) (P < 0.001), creatinin (Cr) (P < 0.001), C-reactive protein (CRP) (P < 0.001), interleukin 6 (IL-6) (P < 0.001), erythrocyte sedimentation rate (ESR) (P < 0.001), and arterial blood PH (P = 0.009). Chest CT imaging examination showed a significant difference between children and adults (Figure 1). In children, there were 13 (39.4%) cases with no obvious changes, 9 (27.3%) cases of unilateral lung lesions, and 11 (33.3%) cases of bilateral lung lesions; in adult patients, there were 20 (6.7%) cases with no obvious changes, 26 (8.7%) cases of unilateral lung lesions, and 254 (84.7%) cases of bilateral lung lesions. The results suggested that pediatric patients had milder or hidden lung lesions in the imaging findings (P < 0.001).

Figure 1. Chest computed tomographic iimages of pediatric patients and adult patients with coronavirus disease 2019 (COVID-19). (A) Chest CT showing unilateral lung lesions in children. (B) Chest CT showing bilateral lung lesions in children. (C) Chest CT showing unilateral lung lesions in adult. (D) Chest CT showing bilateral lung lesions in adult
Items Value (IQR) P value* All patients (n = 333) Pediatric patients (n = 33) Adult patients (n = 300) White blood cell count, × 109/L 4.6 (3.6−5.7) 5.6 (4.5−8.9) 4.5 (3.5−5.6) < 0.001 Neutrophil count, × 109/L 2.6 (1.9−3.5) 2.2 (1.4−3.8) 2.6 (1.9−3.5) 0.126 Lymphocyte count, × 109/L 1.3 (1.0−1.7) 2.5 (2.0−4.1) 1.2 (0.9−1.6) < 0.001 Hemoglobin, g/L 136 (126−146) 128 (123−138) 137 (127−147) 0.001 Platelet count, × 109/L 180 (143−224) 253 (214−322) 174 (141−209) < 0.001 Ferritin, pmol/L (n = 62) † 647.0 (258.9−883.7) 212.3 (155.5−835.3) (n = 5) † 658.7 (287.6−884.4) (n = 57) † 0.250 Total bilirubin, μmol/L 9.8 (7.6−14.6) 8.6 (5.3−11.0) 10.1 (7.8−15.2) 0.001 Alanine aminotransferase, U/L 20.0 (15.0−31.0) 16.0 (11.5−24.1) 21.0 (15.0−31.7) 0.017 Aspartate aminotransferase, U/L 27.0 (21.0−36.4) 38.0 (24.0−48.8) 26.0 (20.9−35.0) 0.001 Gamma-glutamyltransferase, U/L 24.0 (15.1−39.0) 12.8 (11.0−17.5) 26.0 (17.0−41.0) < 0.001 Alkaline phosphatase, U/L (n = 251) † 50.0 (50.0−78.0) 186.5 (154.0−222.8) (n = 24) † 59.0 (49.0−72.0) (n = 227) † < 0.001 Urea nitrogen, mmol/L 4.0 (3.2−4.9) 3.8 (3.1−4.8) 4.0 (3.2−5.0) 0.913 Creatinin, μmol/L 62.0 (49.9−75.2) 31.0 (26.0−38.4) 65.0 (53.0−78.0) < 0.001 C-Reactive protein, mg/L (n = 325) † 10.3 (3.9−27.4) 4.3 (0.5−5.5) (n = 31) † 12.4 (4.8−29.37) (n = 294) † < 0.001 Procalcitonin, ng/mL (n = 274) † 3.3 (0.1−5.3) 3.0 (0.1−5.7) (n = 27) † 3.3 (0.1−5.3) (n = 247) † 0.818 Interleukin 6, pg/mL (n = 231) † 10.7 (4.2−19.6) 3.3 (2.0−4.5) (n = 21) † 12.0 (5.0−21.4) (n = 210) † < 0.001 Erythrocyte sedimentation rate, mm/h
(n = 280) †30.0 (15.0−48.8) 10.0 (5.0−18.5) (n = 25) † 30.0 (15.0−50.0) (n = 255) † < 0.001 Lactic acid dehydrogenase (n = 296) † 223.0 (175.0−400.0) 278.0 (222.5−561.3) (n = 30) † 215.0 (170.0−387.3) (n = 266) † 0.003 cTnI, μg/L (n = 284) † 0.012 (0.012−6.000) 0.012 (0.012−6.000) (n = 30) † 0.012 (0.012−6.000) (n = 254) † 0.266 Creatine kinase-MB, ng/mL (n = 308) † 0.54 (0.22−1.07) 1.17 (0.40−2.85) (n = 32) † 0.52 (0.22−1.00) (n = 276) † < 0.001 Prothrombin time, s (n = 314) † 11.9 (11.3−12.5) 12.1 (11.6−11.7) (n = 31) † 11.8 (11.2−12.5) (n = 283) † 0.072 Activated partial thromboplastin time,
s (n = 316) †35.5 (32.5−38.7) 34.8 (33.0−38.9) (n = 31) † 35.6 (32.5−38.7) (n = 285) † 0.772 D-dimer, μg/mL (n = 313) † 0.37 (0.26−0.56) 0.31 (0.24−0.55) (n = 30) † 038 (0.26−0.56) (n = 283) † 0.261 pH (n = 316) † 7.42 (7.40−7.44) 7.39 (7.37−7.44) (n = 28) † 7.42 (7.40−7.44) (n = 288) † 0.009 PaCO2, mmHg (n = 317) † 39.0 (35.7−41.4) 38.8 (34.4−41.5) (n = 28) † 39.0 (36.0−41.4) (n = 289) † 0.340 PaO2, mmHg (n = 317) † 92.2 (79.1−106.0) 108.0 (103.3−124.0) (n = 28) † 90.5 (78.0−103.0) (n = 289) † < 0.001 PaO2 /FiO2, mmHg (n = 317) † 413 (355.0−476.5) 514 (491.3−585.3) (n = 28) † 401 (349.0−462.5) (n = 289) † < 0.001 T lymphocyte count,μL (n = 207) † 973 (627.0−1314.0) 1784.5 (1489.5−2857.8) (n = 22) † 894 (589.5−1191.0) (n = 185) † < 0.001 CD4 count, μL (n = 207) † 5,190 (344.0−714.0) 852 (740.8−1428.3) (n = 22) † 499 (335.5−652.5) (n = 185) † < 0.001 CD8 count, μL (n = 207) † 348 (207.0−515.0) 684 (593.8−1050.8) (n = 22) † 326 (194.5−439.5) (n = 185) † < 0.001 Lung lesions by CT < 0.001 None, n (%) 33 (9.9) 13 (39.4) 20 (6.7) Unilateral, n (%) 35 (10.5) 9 (27.3) 26 (8.7) Bilateral, n (%) 265 (79.6) 11 (33.3) 254 (84.7) Note. Data are presented as median (interquartile ranges, IQR) and n (%)
*P values indicate differences between pediatric and adult patients. P < 0.05 was considered statistically significant;
†Number of patients for whom data were available.Table 2. Summary on laboratory and radiographic data of COVID-19 patients
-
All children and adult patients were treated under isolation and in accordance with the Chinese Programme for the Diagnosis and Treatment of Novel Coronavirus Infected Pneumonia[15]. Treatments for patients were summarize in Table 3. All patients received antiviral therapy (ribavirin, interferon, lopina veletonavir, favipiravir, abidal, or chloroquine), and 99 (29.7%) patients received antibiotics (cephalosporins, quinolones, and carbapenems), including 9.1% (3/33) of the pediatric patients and 32.0% (96/300) of the adult patients. Hormonal therapy was received by 30.0% (90/300) of the adult patients and gamma globulin therapy was received by 27.0% (81/300) of the adult patients. No pediatric patients received hormonal or gamma globulin therapy. A total of 18.2% (6/33) pediatric patients and 77.7% (233/300) adult patients received oxygen therapy (P < 0.001). Of pediatricpatients, 5 (15.2%) received nasal cannula and 1 (3.0%) received mask oxygen; of adult patients, 177 (59.0%) received nasal cannula, 6 (2.0%) received mask oxygen, 10 (3.3%) received high-flow oxygen, 24 (8.0%) received noninvasive ventilation, 14 (4.7%) received invasive ventilation, and 2 (0.7%) received extracorporeal membrane oxygenation (ECMO). Of all patients, only 3 (1.0%) adult patients received continuous renal replacement therapy because of acute renal injury. Complications occurred only in adults, and no complications occurred in children; 13 complications in adults included 2 case of acute heart injury (0.6%), 3 cases of acute kidney injury (0.9%), 1 case of acute liver injury (0.3%), and 13 cases (3.9%) of ARDS, including 3 patients with multiple complications.
Items Count (%) P value* All patients (n = 333) Pediatric patients (n = 33) Adults patients (n = 300) Treatment Antiviral 333 (100) 33 (100) 300 (100) NA Antibiotics 99 (29.7) 3 (9.1) 96 (32.0) 0.006 Hormonal therapy 90 (27.0) 0 (0.0) 90 (30.0) < 0.001 Gamma globulin therapy 81 (24.3) 0 (0.0) 81 (27.0) 0.001 Renal replacement therapy 3 (0.9) 0 (0.0) 3 (1.0) 1.000 Oxygen therapy < 0.001 None 94 (28.2) 27 (81.8) 67 (22.3) Nasal cannula 182 (54.7) 5 (15.2) 177 (59.0) Face mask 7 (2.1) 1 (3.0) 6 (2.0) High flow 10 (3.0) 0 (0.0) 10 (3.3) Non-invasive ventilation 24 (7.2) 0 (0.0) 24 (8.0) Invasive ventilation 14 (4.2) 0 (0.0) 14 (4.7) Invasive + ECMO 2 (0.6) 0 (0.0) 2 (0.7) Complication 13 (3.9) 0 (0.0) 13 (4.3) 0.455 Acute heart injury 2 (0.6) 0 (0.0) 2 (0.7) 1.000 Acute kidney injury 3 (0.9) 0 (0.0) 3 (1.0) 1.000 Acute liver injury 1 (0.3) 0 (0.0) 1 (0.3) 1.000 Acute respiratory distress syndrome 13 (3.9) 0 (0.0) 13 (4.3) 0.455 Note. Data are presented as n (%);
*P values indicate differences between pediatric and adult patients. P < 0.05 was considered statistically significant.Table 3. Treatment and complications in pediatric and adult patients
-
As of the last follow-up time of 15th March 2020, 324 patients had recovered and been discharged, including 33 (100%) of pediatric patients and 292 (97.3%) of adult patients. Only 2 (0.7%) adult patients died, with an overall case fatality rate of 0.6%. Only 7 adult patients are still in hospital. The median length of hospital stay of 333 patients was 21 d (95% CI: 19.8–22.2) (Figure 2A). Pediatric patients had a median hospital stay of 19 (95% CI: 16.6–21.4) d and adult patients had a median length of hospital stay of 21 (95% CI: 19.9–22.1) d. Pediatric patients had a shorter length of hospital stay than adult patients (P = 0.024) (Figure 2B).
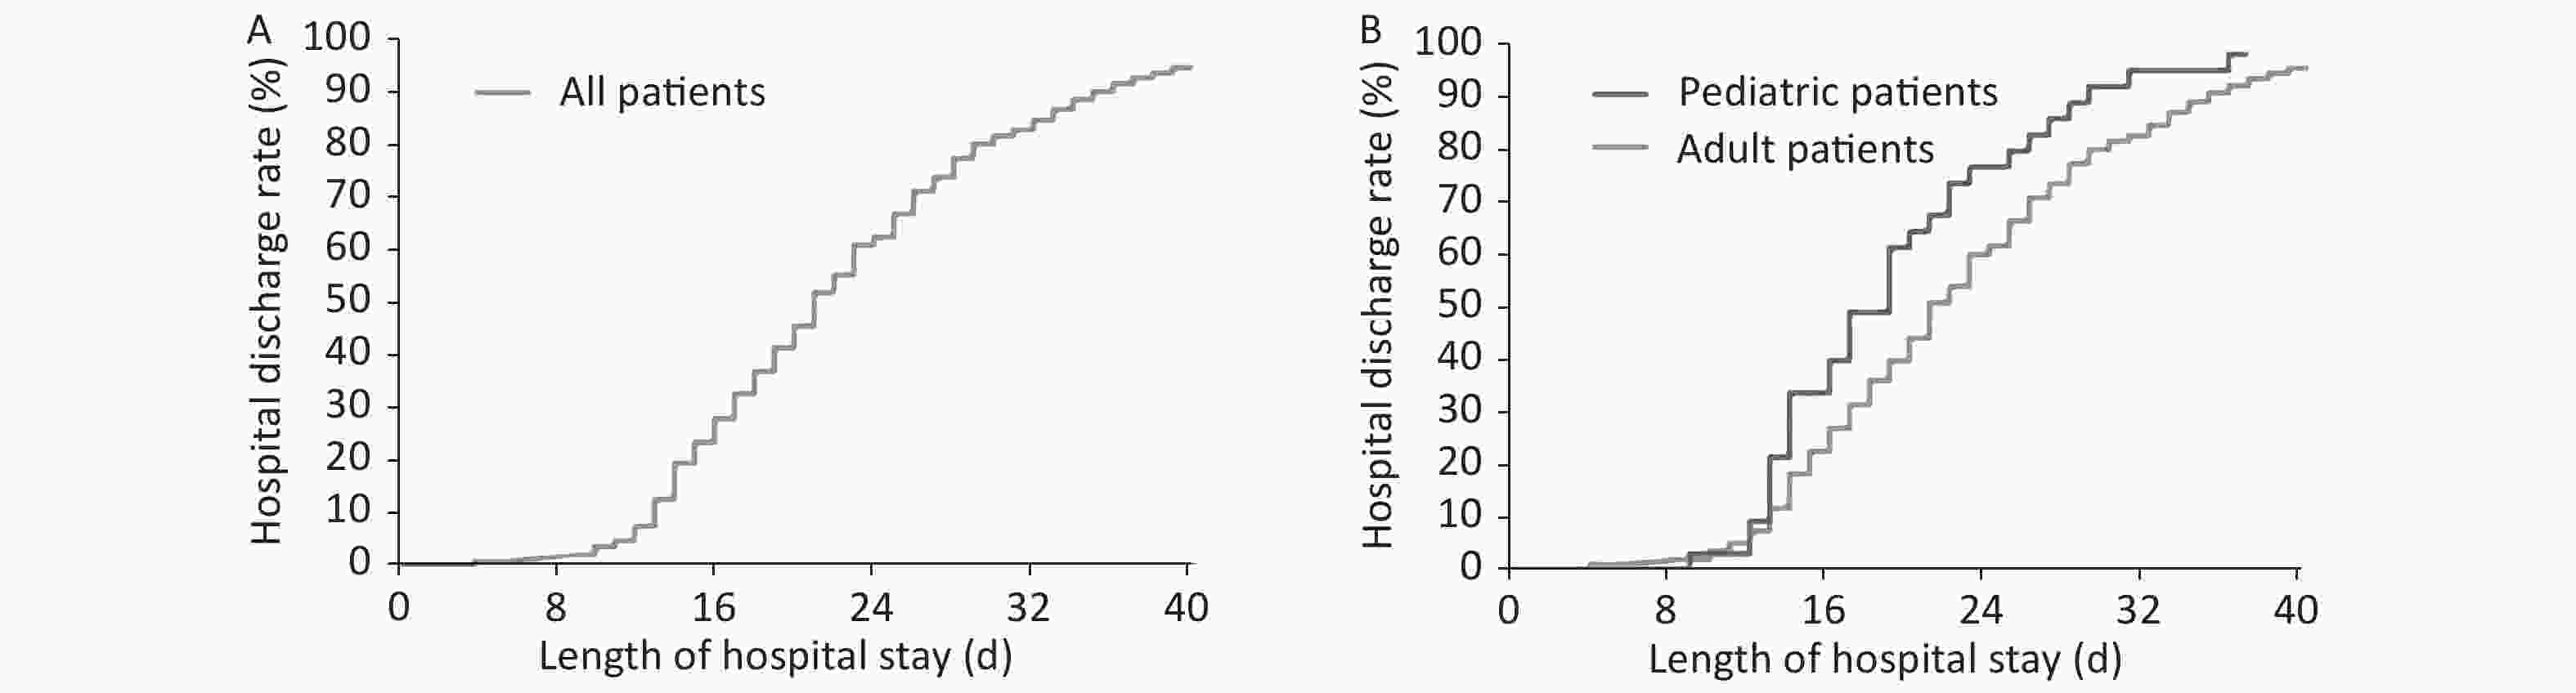
Figure 2. Analyses of length of hospital stay using Kaplan-Meier method. (A) Length of hospital stay in all the patients. (B) Comparison of length of hospital stay between children and adult.
-
The rapid spread of COVID-19 outbreak has attracted wide attention from society and academia. However, due to the limitation of clinical samples, data on COVID-19 in children are still rarely reported. As a southern province with a population of 11.346 million, Guangdong had confirmed a total of 1,361 cases (as of March 15th) of patients during the COVID-19 outbreak and became the province with the highest number of reported cases of COVID-19 outside Hubei province. Shenzhen, the second largest city in Guangdong province, had reported over 400 patients reported as of 15th March 2020, ranking the first among all cities in Guangdong province. Shenzhen Third People's Hospital is the designated hospital to treat all confirmed COVID-19 patients in Shenzhen. We therefore included a total of 333 cases of COVID-19 patients who were admitted to Shenzhen Third People's Hospital from January 11th to February 10th, 2020 in this report, and they were followed up until March 15th, 2020.
The data showed that pediatric patients accounted 9.9% of all infected patients, and the rate was much higher than the previous reported 0.9% by Guan et al.[11]. This difference is possibly because of that risk of viral exposure in children was lower at the early outbreak. Another reason may be that pediatric patients are prone to be missed in diagnosis at the early breakout when the pandemic control was not strengthened, because as shown by our data, children had milder or less clinical symptoms, and many confirmed pediatric patients were asymptomatic, they were screened or visited hospital because they had close contact with infected patient. The actual prevalence of SARS-CoV-2 infection in children requires further investigation. SARS-CoV-2 is the seventh coronavirus found to infect humans, and it belongs to the same family as MERS-CoV and SARS-CoV[3]. During SARS and MERS outbreaks, the number of pediatric patients were far less than the number of adult patients, and the clinical manifestations and symptoms of children were also milder than those of adults[14, 21]. Based on the epidemiological characteristics of SARS and MERS in the past and the current pandemic situation in China, it was speculated that the number of children infected will be less than that of adults. We did not find sex difference in the pediatric and adult subgroups (P = 0.451). Female patients were slightly more than male patients [171 (51.4%) vs. 162 (48.6%)], which was inconsistent with the results of previous studies reporting that COVID-19 patients were male-dominated[2, 22]. This can be explained by biased sampling because our sample size is relatively small. Our results agreed that COVID-19 has a clustered onset characteristic, rapid short-term transmission, and the population is generally susceptible[11].
Compared with adult patients, pediatric patients showed different laboratory results, milder clinical symptoms, less severe lung radiographic changes, lower grade in clinical severity classification, and better clinical outcome. The difference in laboratory tests and vital signs between the two groups may not completely come from SARS-CoV-2 infection, because these indicators and vital signs under physiological conditions are inherently different between children and adults. The overall case fatality rate in our study was 0.6%, and it was significantly lower than that in previous report[11]. No death occurred in pediatric patients. The length of hospital stay was shorter in children than in adults [19 (95% CI: 16.6–21.4) d vs. 21 (95% CI: 19.9–22.1) d, P = 0.024]. The evidence suggested that compared with adult patients, pediatric patients had better treatment outcomes. On the other hand, this milder clinical manifestations in children makes them easily missed out in diagnosis, bringing difficulties to the pandemic control.
This study had the following limitations. Firstly, this study was a single-center retrospective study, and the number of pediatric patients was relatively small. A limited sample size (only 33 pediatric patients), which would introduce selective bias to the results. It also made our exploration of the characteristics of COVID-19 disease in children limited. Secondly, although we described the clinical characteristics and outcomes of patients with COVID-19, effective treatment strategies remains to be further explored. Thirdly, viral load may be an important indicator of the severity of the disease, but this study failed to explore the difference between viral load in pediatric and adult patients. Fully understanding of the epidemiology, clinical characteristics, and disease prognosis of COVID-19 in children requires more in-depth studies.
-
Pediatric patients with COVID-19 had shorter hospital stays and better prognosis than adult patients. Pediatric patients showed milder or occult clinical symptoms and milder lung lesions at early infection, making pediatric patients prone to be missed in clinical diagnosis. The clinical management of pediatric patients with mild and asymptomatic infection should not be ignored to reduce sources of transmission. Therefore, it is necessary to conduct extensive nucleic acid screening for children who had a contact or exposure history.
-
LIU Lei and HE Qing had full access to all of the data in the study and take responsibility for the integrity of the data and the accuracy of the data analysis. WANG Fang, LAI Chang Xiang, HUANG Peng Yu, and LIU Jia Ming contributed equally and share first authorship. LIU Lei and HE Qing contributed equally to this article. Data acquisition: WANG Fang and LIU Lei had full access to and took the responsibility for the integrity of all data in the study. Concept and design: LIU Lei, HE Qing, WANG Fang, LAI Chang Xiang, Data analyses and interpretation: LAI Chang Xiang, HUANG Peng Yu, LIU Jia Ming, WANG Xian Feng, TANG Qi Yuan, ZHOU Xuan, XIAN Wen Jie, CHEN Rui Kun, LI Xuan, LI Zhi Yu, LIAO Li Qun. Manuscript drafting: WANG Fang, LAI Chang Xiang, HUANG Peng Yu, LIU Jia Ming.
Critical revision of the manuscript for important intellectual content: WANG Fang, LAI Chang Xiang, HUANG Peng Yu, LIU Jia Ming, LIU Lei, HE Qing.
Administrative, technical, or material support: WANG Fang, LAI Chang Xiang. Supervision: LIU Lei, HE Qing, WANG Fang.
-
The authors declare no competing interests.
Funds:
This study was supported by the National Clinical Research Center for Infectious Diseases, Funds for the Construction of Key Medical Disciplines in Shenzhen and the Sanming Project of Medicine in Shenzhen [SZSM201612014]
§These authors contributed equally to this work and are the co-first authors.
 Quick Links
 DownLoad:
