


-
In December 2019, the novel 2019 coronavirus disease (COVID-19) emerged in Wuhan and spread all over the country. The Zibo Central Hospital had set up a febrile clinic and isolation ward for confirmed and suspected patients since January 23, 2020. Suspected patients were hospitalized immediately to the isolation ward. Every healthcare staff was authorized to undergo low-dose computed tomography (LDCT) of the chest free of charge before and after their assignment in the isolation ward. If suspected lesions were found on the second computed tomography (CT), polymerase chain reaction (PCR) and nucleic acid tests were carried out. Isolation was finished 2 weeks later if all examination results remained normal. During this period, we found that the number of pulmonary nodules markedly increased in the second CT in most of the healthcare staff, so we performed a retrospective analysis of the second chest CT images in 46 healthcare workers (subjects). The prevalence, characteristics, size, density, and distribution of pulmonary nodules on the second CT were analyzed. We attempt to reveal this phenomenon and call attention to the harm that an isolation environment can contribute to health care workers and help establish treatment for pulmonary nodules scientifically and rationally.
This study was approved by the Institutional Ethics Committee for Human Subjects of Zibo Central Hospital, China. All study procedures were performed in accordance with the Fleischner Society guidelines. Although the hospital had a free policy, in consideration of radiation exposure, only 46 staff members had two LDCT examinations. All staff members were healthy and remained healthy during the observation period.
All chest CT examinations were performed using Toshiba Aquilion ONE. The imaging parameters were as follows: 120 Kvp, 30 mA, rotation time of 0.5 s, and pitch of 0.98. The slice thickness of reconstructed images was 1 mm. All subjects were examined by computer-aided diagnosis and artificial screening. CAD was set to display nodules with a diameter of more than 1 mm. Artificial screening was performed by three radiologists using a standard lung window [center, 500 Hounsfield units (HU); width, 1,500 HU]. For each pulmonary nodule, the longest axial diameter (mm), CT value (HU), and shortest distance from the pleural surface (mm) were recorded. SPSS 25.0 software (IBM Corp., Armonk, NY, USA) was used for statistical analysis.
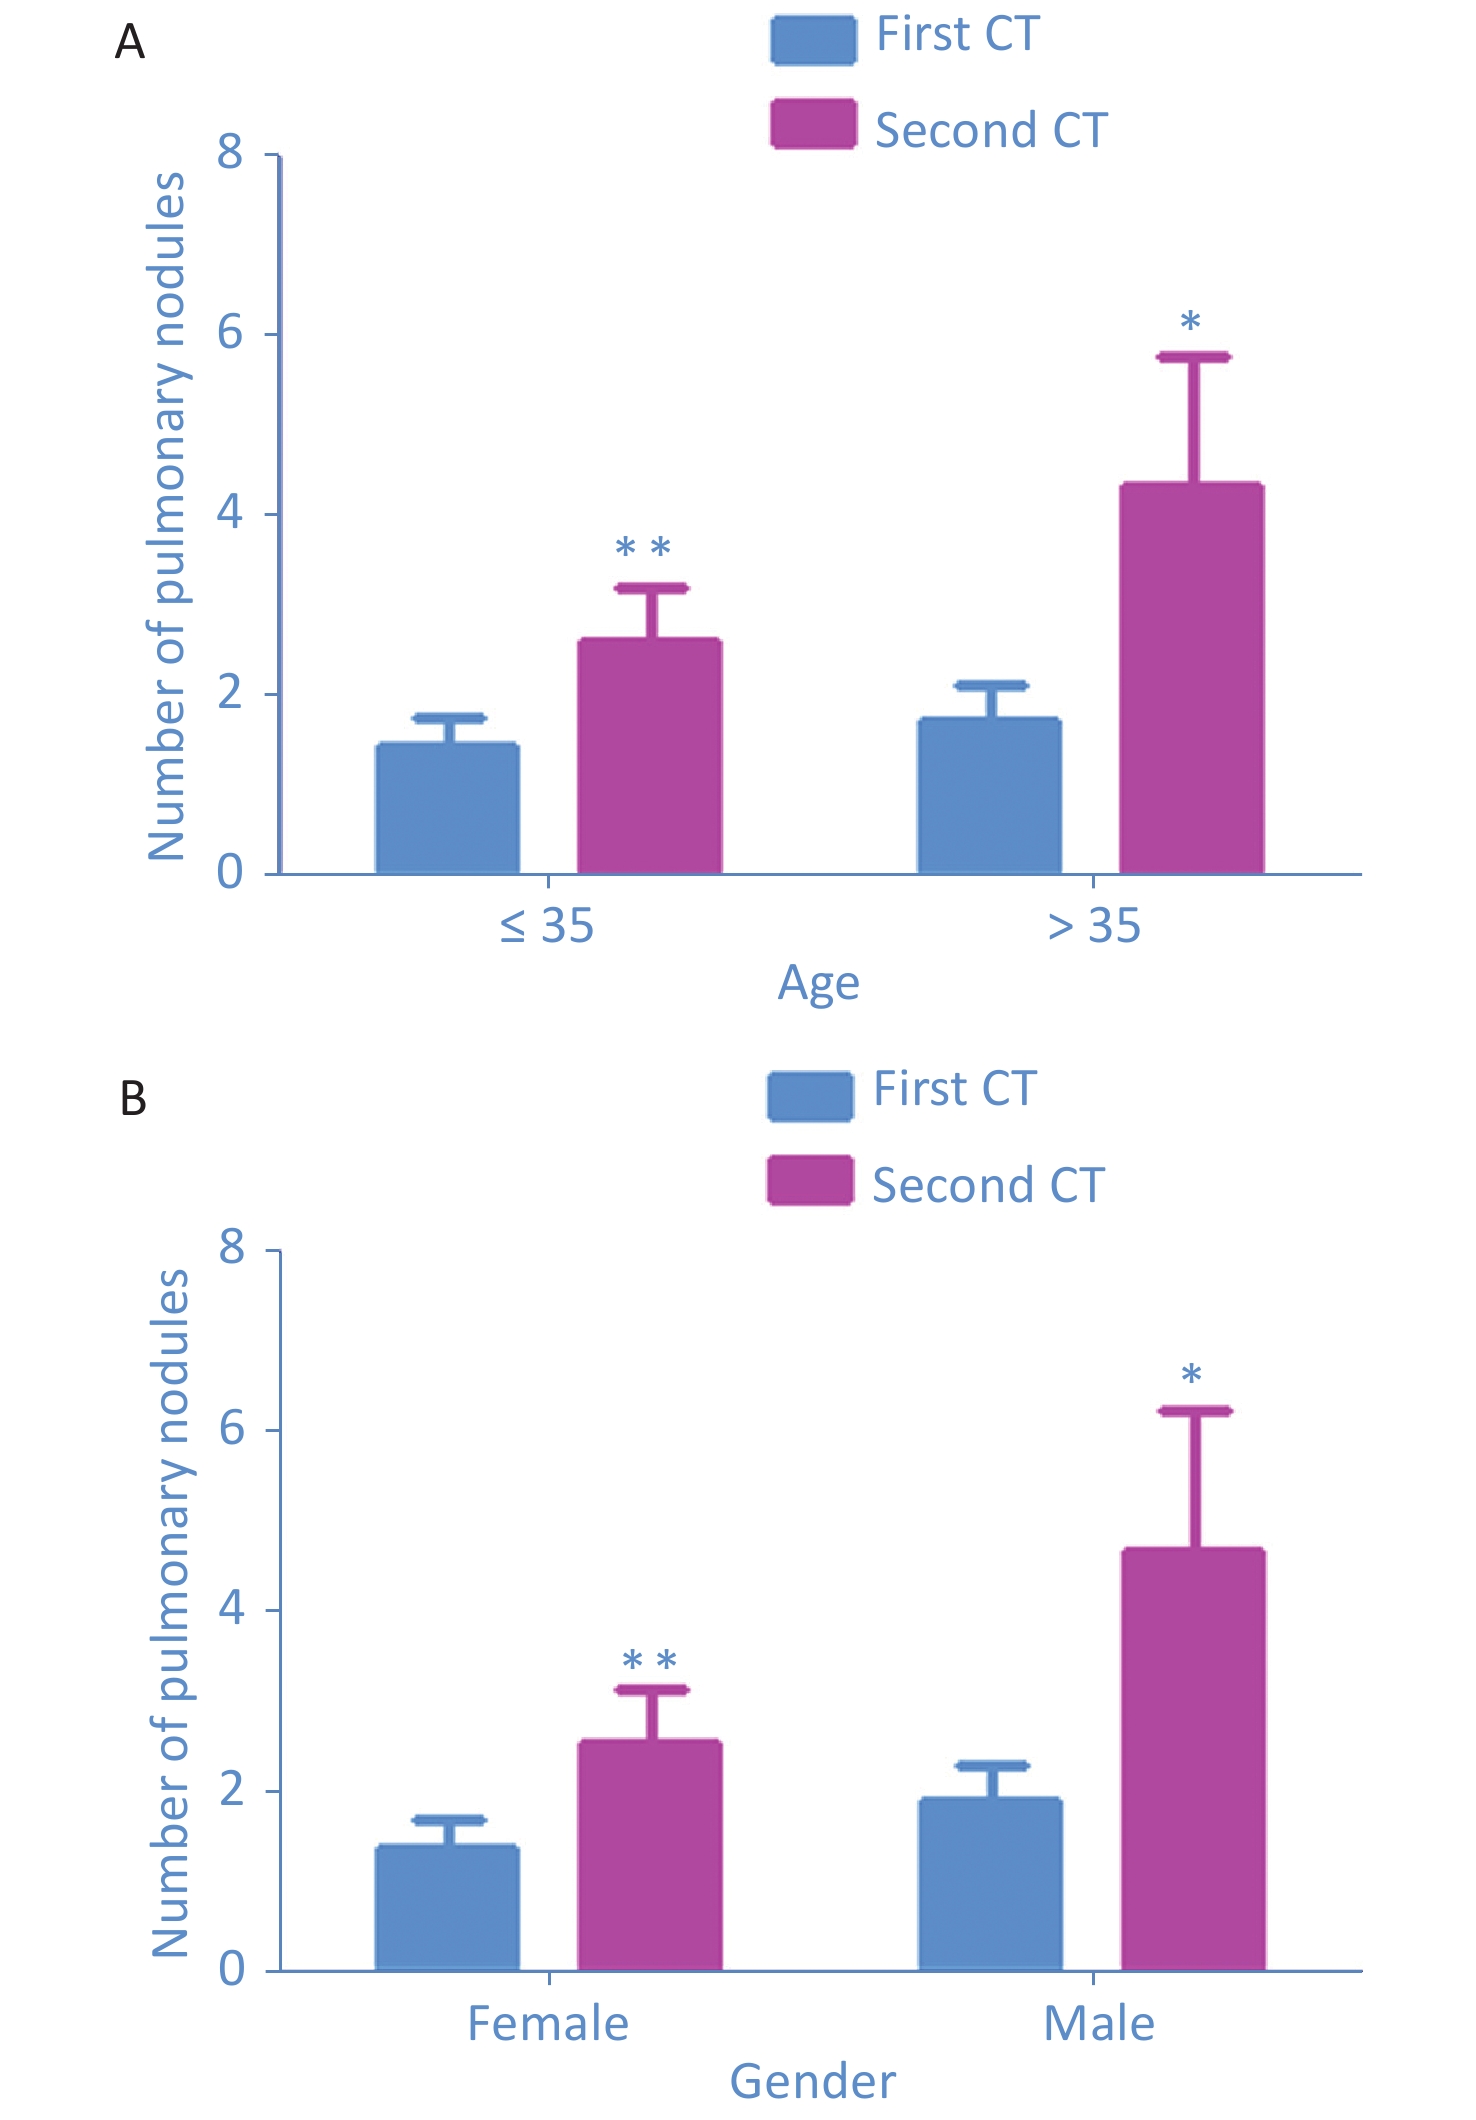
In this study, a total of 46 subjects were enrolled, including 27 (58.69%) with pulmonary nodule and 19 (41.31%) without nodule in the first CT. The second CT showed 16 (34.78%) subjects without nodules, 30 (65.22%) with nodules, 20 (43.48%) with new-onset nodules (Table 1). Compared with the first CT, the average number of nodules in the second CT increased from 1.46 ± 1.75 to 2.62 ± 3.18 in the ≤ 35-year-old group (n = 26, P = 0.002) and increased from 1.75 ± 1.83 to 4.35 ± 6.37 in the > 35-year-old group (P = 0.047) (Supplementary Figure S1A available in www.besjournal.com). The average number of pulmonary nodules increased from 1.89 ± 1.81 to 4.67 ± 6.54 in 18 male subjects (P = 0.049) and increased from 1.39 ± 1.75 to 2.54 ± 3.21 in 28 female subjects (P = 0.006) (Supplementary Figure S1B available in www.besjournal.com). As revealed by some studies, pathogenic factors of pulmonary nodules were age, environment, autoimmunity, toxic gas damage, infection, tumor history, etc. [1-3]. Once a suspected patient was confirmed to have COVID-19, he or she would be transferred immediately to Shandong Province Chest Hospital by a special vehicle. Because confirmed patients stay in the isolation ward for only a short time, under strict isolation and disinfection measures, the probability of COVID-19 infection was small, and PCR and nucleic acid test results were normal. After multiple laboratory examinations, these subjects were found to have no signs of respiratory virus infection. Except for two subjects with smoking history, none of the subjects had the abovementioned factors. We hypothesized that new-onset nodules may be related to the use of disinfectants containing chlorine.
Characteristics First CT (n = 46) Second CT (n = 46) Subjects without
nodules n (%)Subjects with
nodules n (%)Subjects without
nodules n (%)Subjects with
nodules n (%)Subjects with
new-onset
nodules n (%)Mean age 33.667 ± 1.777 35.704 ± 0.965 33.933 ± 1.876 35.156 ± 0.976 35.450 ± 1.184 Gender (male) 4 (21.05) 14 (51.85) 4 (25) 14 (46.67) 10 (50) Patients and nodules 19 (41.31) 27 (58.69) 16 (34.78) 30 (65.22) 20 (43.48) History of tumor 0 0 0 0 0 History of smoking 0 2 (4.35) 0 2 (4.35) 2 (4.35) Classification of nodule Solid nodules 46 (63.01) 62 (40) 16 (19.51) Subsolid nodules 2 (2.74) 40 (25.81) 38 (46.34) Ground glass nodules 11 (15.07) 39 (25.16) 28 (34.15) Calcified nodules 14 (19.18) 14 (9.03) 0 Longest axial diameter < 6 mm 69 (94.52) 151 (97.42) 82 (100) 6–8 mm 4 (5.48) 4 (2.58) 0 > 8 mm 0 0 0 Location Right upper lobe 18 (24.66) 34 (21.93) 15 (18.30) Right middle lobe 8 (10.96) 22 (14.19) 10 (12.20) Right lower lobe 15 (20.55) 35 (22.58) 22 (26.82) Left upper lobe 14 (19.17) 27 (17.42) 14 (17.07) Left lower lobe 18 (24.66) 37 (23.87) 21 (25.61) Distance from the pleura < 5 mm 24 (32.87) 62 (40.00) 38 (46.34) 5–10 mm 16 (21.92) 40 (25.81) 24 (29.27) 10–15 mm 12 (16.44) 21 (13.55) 9 (10.97) 15–20 mm 9 (12.33) 13 (8.38) 4 (4.88) > 20 mm 12 (16.44) 19 (12.26) 7 (8.54) Total nodules 73 155 82 Table 1. Characteristics and prevalence of pulmonary nodules in the health care staff

Figure S1. Comparison of the increase of the number of pulmonary nodules according to age and gender from the two CT scans. The number of pulmonary nodules increased significantly in all groups of age ≤ 35-year old group (n = 26, P = 0.002), > 35-year old group (n
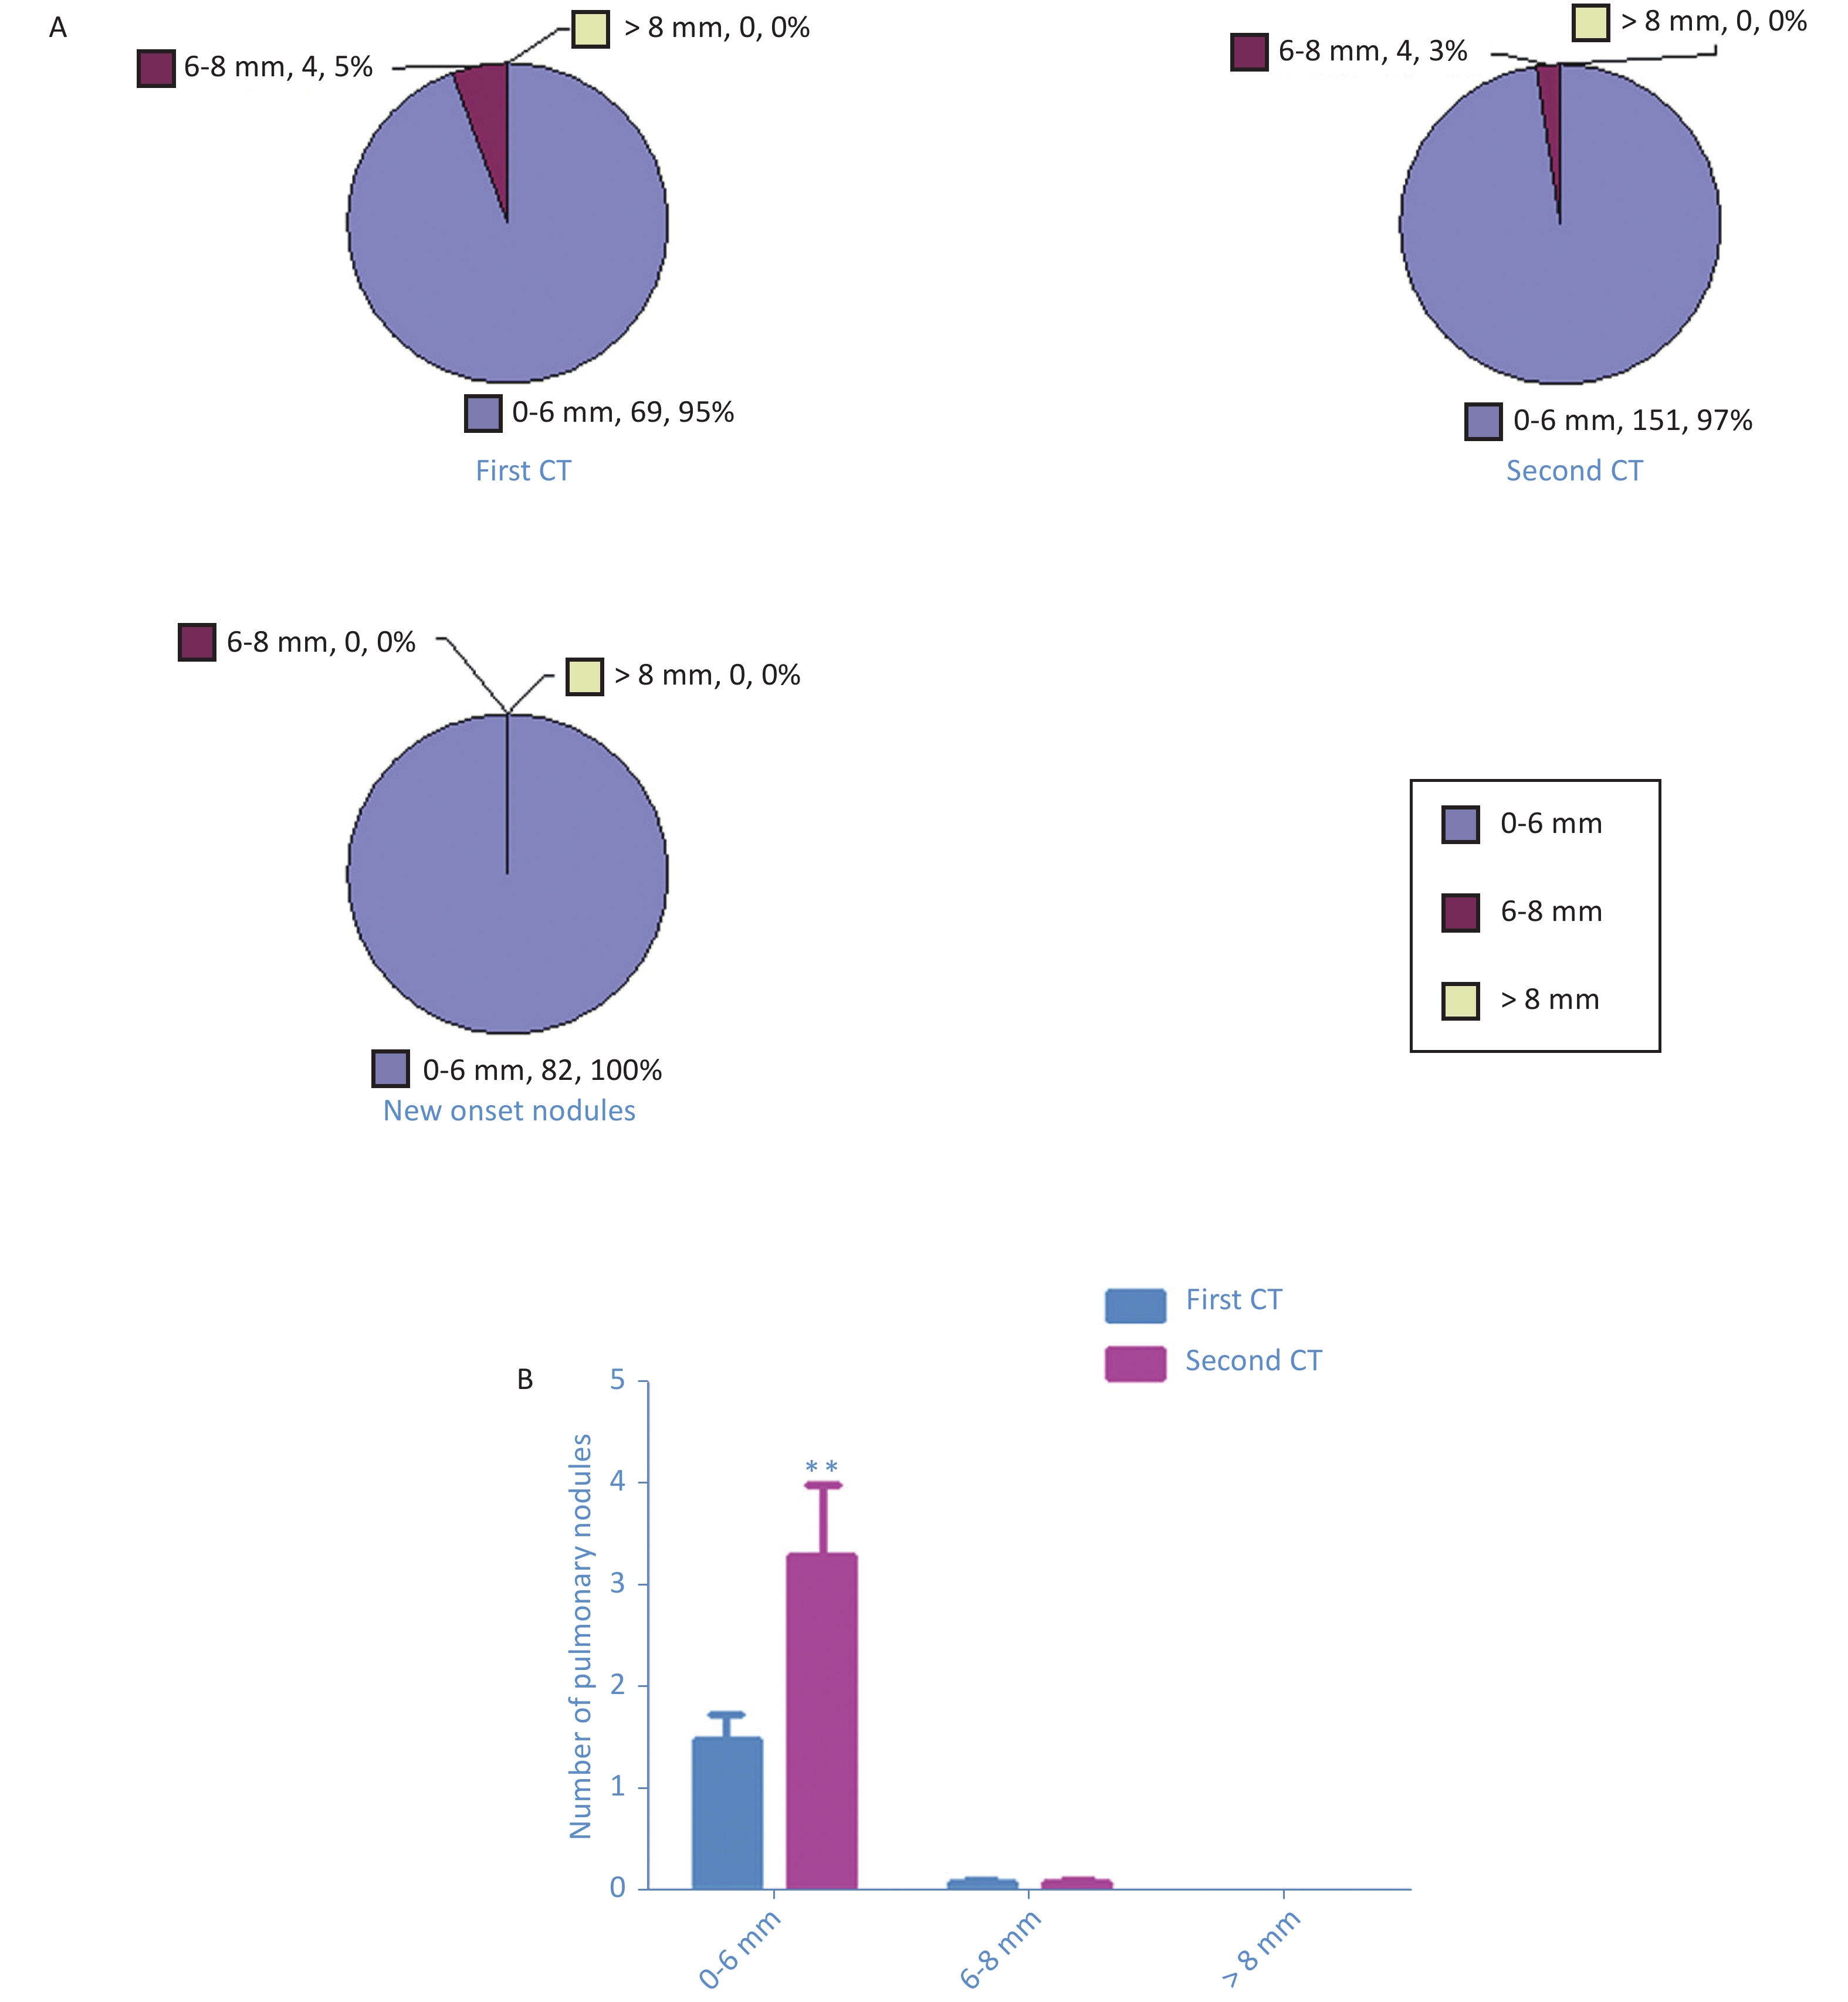
= 20, P = 0.047), the males (n = 18, P = 0.049), and the females (n = 28, P = 0.006) (A and B) As shown in the first CT, 69 nodules (95%) had diameter of < 6 mm, 4 nodules (5%) had diameter of 6–8 mm, but there was no nodule with diameter of > 8 mm. In the second CT, 151 nodules (97%) had diameter of ≤ 6 mm, 4 nodules (5%) had diameter of 6–8 mm, but there was no nodule with diameter of > 8 mm (Supplementary Figure S2A available in www.besjournal.com). Paired t-test showed a significant increase in the average numbers of nodules with diameter of ≤ 6 mm (1.50 ± 1.70 vs. 3.28 ± 4.75, P = 0.004) (Supplementary Figure S2B available in www.besjournal.com). The results demonstrated that all new-onset nodules were small. The 2017 Fleischner Society guidelines indicated that pulmonary nodules with diameter of < 6 mm do need not annual follow-up (4). The guidelines have no treatment guidance for short-term new-onset pulmonary nodules. We suggested that health care workers should not be anxious but pay attention to the occurrence of fever, cough, and other respiratory symptoms.

Figure S2. Pie chart showed the number of pulmonary nodules detected in the first CT scan, the second CT scan, as well as the new onset nodules (A). The number of pulmonary nodules increased significantly in all sizes of ≤ 6 mm, 6–8 mm, and > 8 mm. Paired t test showed significant increases of averaged numbers of nodules ≤ 6 mm (P = 0.004), with no change in nodules 6-8 mm and > 8 mm (B).
The distribution of new-onset nodules was as follows: 15 nodules in the right upper lobe, 10 nodules in the right middle lobe, 22 nodules in the right lower lobe, 14 nodules in the left upper lobe, and 21 nodules in the left lower lobe (Supplementary Figure S3A available in www.besjournal.com). Compared with the first CT, the average number of nodules in all lobes have increased significantly in the second CT: right upper lobe, 0.39 ± 0.68 vs. 0.74 ± 1.10 (P = 0.022); right middle lobe, 0.17 ± 0.38 vs. 0.48 ± 0.89 (P = 0.009); right lower lobe, 0.33 ± 0.60 vs. 0.76 ± 1.45 (P = 0.020), left upper lobe, 0.30 ± 0.66 vs. 0.59 ± 1.02 (P = 0.011), and left lower lobe, 0.39 ± 0.64 vs. 0.80 ± 1.07 (P = 0.002) (Supplementary Figure S3B available in www.besjournal.com).

Figure S3. Pie chart showed the number of pulmonary nodules detected in each pulmonary lobe in the first CT scan, the second CT scan, as well as the new onset nodules (A). Paired t test showed significant increases of averaged numbers of nodules in each pulmonary lobe: right upper lobe (P = 0.022), right middle lobe (P = 0.009), right lower lobe (P = 0.020), left upper lobe (P = 0.011), and left lower lobe (P = 0.002) (B).
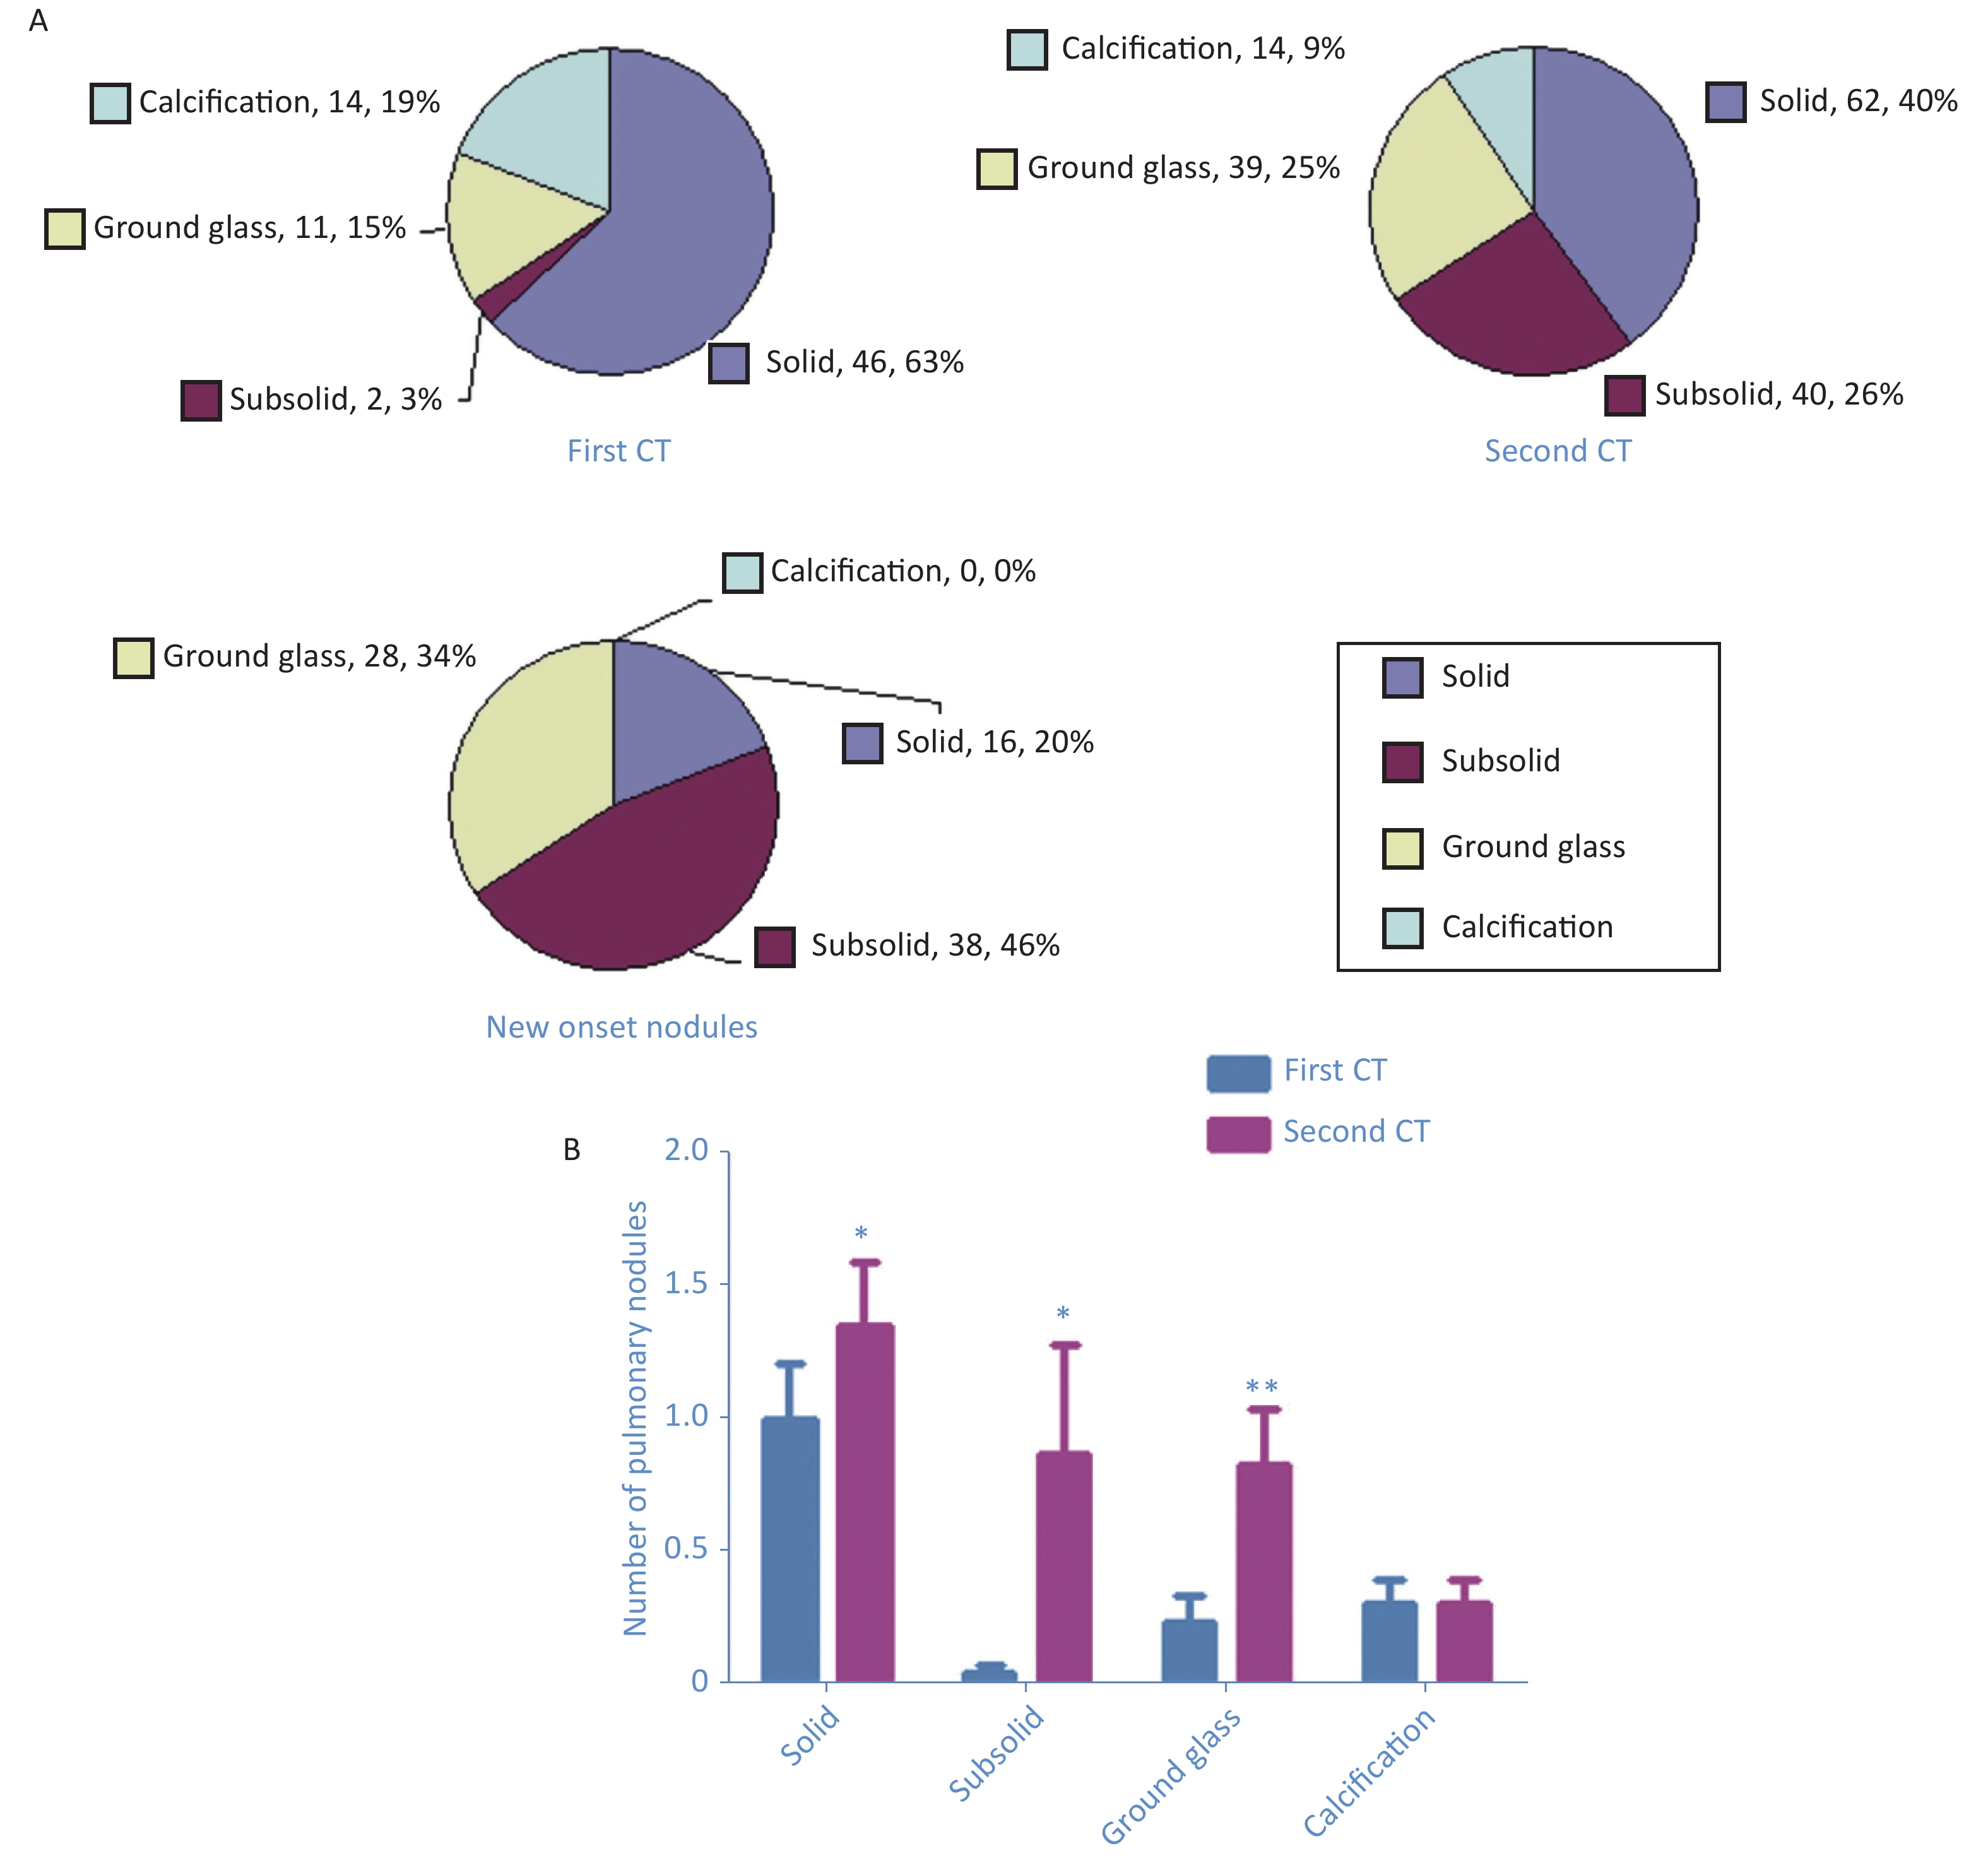
According to Fleischner Society guidelines, the pulmonary nodules were divided into four categories: solid nodules, subsolid nodules, ground glass nodules, and calcified nodules [4,5]. The first CT showed 46 (63%) solid nodules, 2 (3%) subsolid nodules, 11 (15%) ground glass nodules, and 14 (19%) calcified nodules (Figure 1A). The second CT detected 62 (40%) solid nodules, 40 (26%) subsolid nodules, 39 (25%) ground glass nodules, and 14 (9%) calcified nodules (Figure 1A). New-onset nodules included 16 (20%) solid nodules, 38 (46%) subsolid nodules, and 28 (34%) ground glass nodules (Figure 1A). Compared with the first CT, densities of nodules increased in varying degrees in the second CT: solid nodules, 1.00 ± 1.40 vs. 1.35 ± 1.64 (P = 0.019); subsolid nodules, 0.04 ± 0.21 vs. 0.87 ± 2.78 (P = 0.049); ground glass nodules, 0.24 ± 0.67 vs. 0.83 ± 1.43 (P = 0.002); and calcified nodules, 0.30 ± 0.63 vs. 0.30 ± 0.63) (Figure 1B).
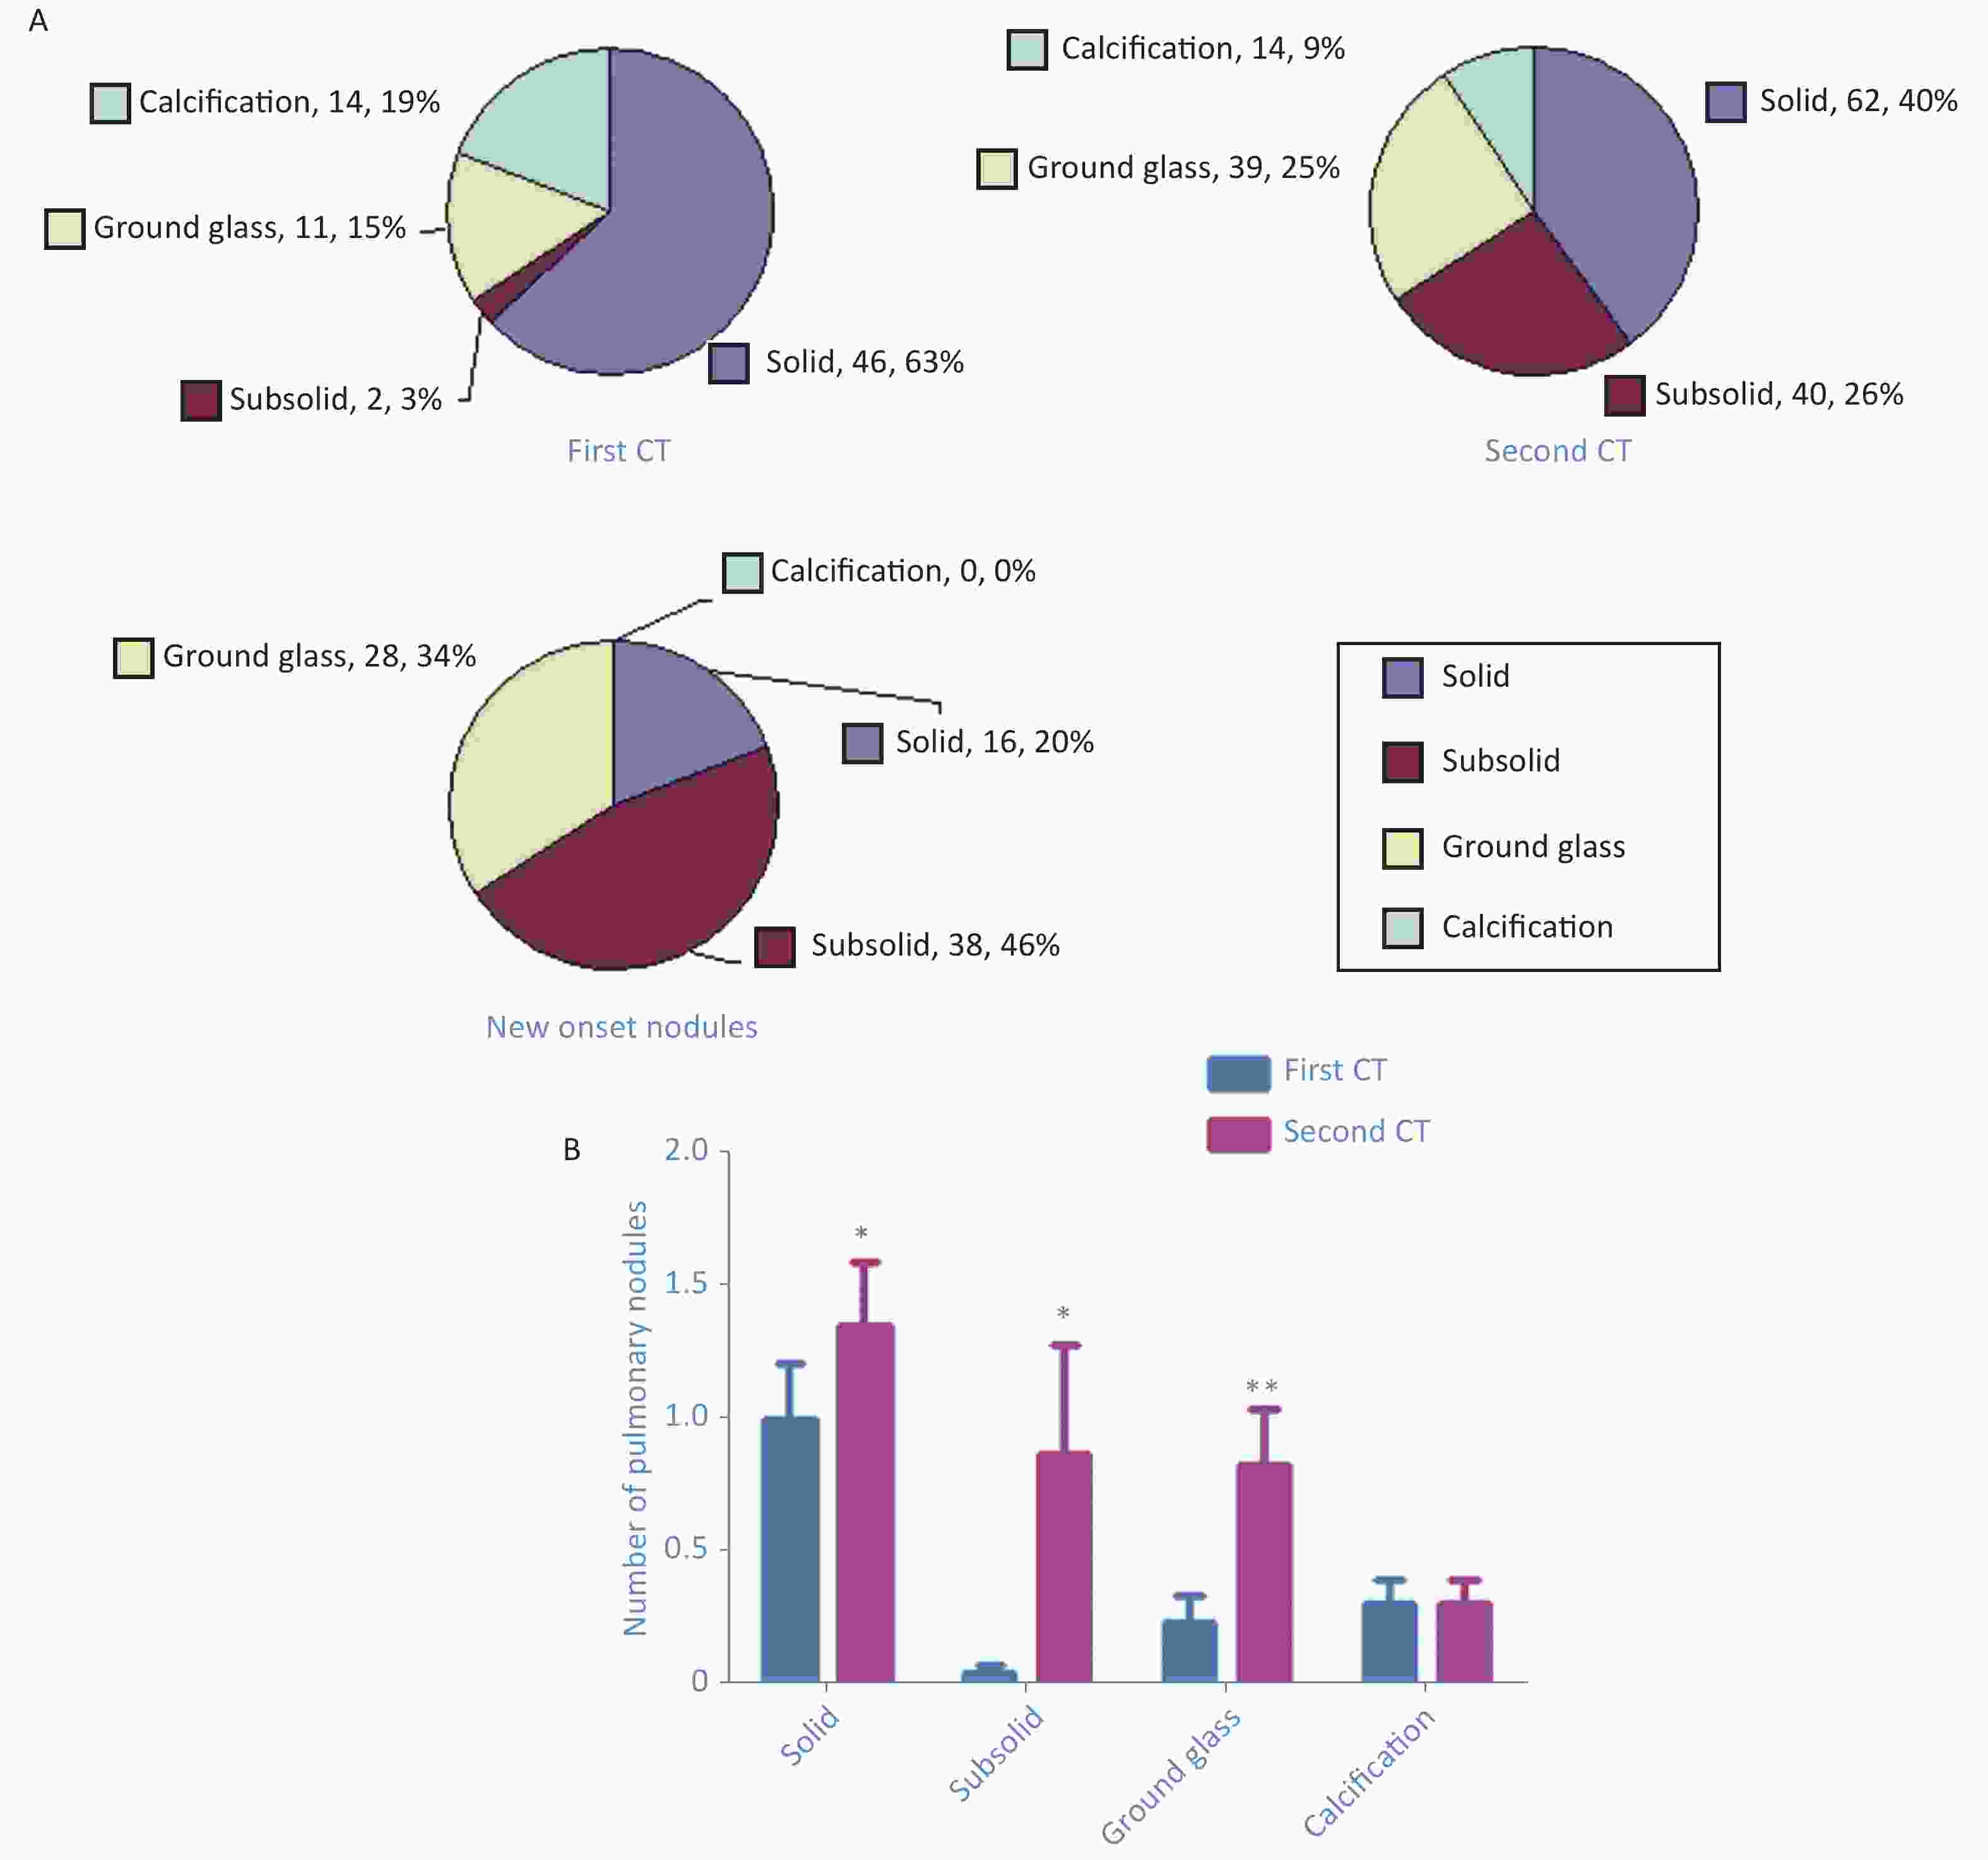
Figure 1. Number of pulmonary nodules of different densities detected in the first computed tomography (CT) and second CT as well as new-onset nodules (A). Paired t-test shows increases in the average number of nodules with different densities: solid nodules (P = 0.019), subsolid nodules (P = 0.049), ground glass nodules (P = 0.002), and calcified nodules (B).
The shortest distances to the pleural surface in the first CT scan were as follows: 24 nodules, < 5 mm; 16 nodules, 5–10 mm; 12 nodules, 10–15 mm; 10 nodules, 15–20 mm; and 12 nodules, > 20 mm (Supplementary Figure S4A available in www.besjournal.com). In the second CT, shortest distances to the pleural surface were as follows: 48 nodules, < 5 mm; 34 nodules, 5–10 mm; 19 nodules, 10–15 mm; 12 nodules, 15–20 mm; and 18 nodules, > 20 mm (Supplementary Figure S4A). The shortest distances for the new-onset nodules were as follows: 37 nodules, < 5 mm, 24 nodules, 5–10 mm; 9 nodules, 10–15 mm; 4 nodules, 15–20 mm; and 7 nodules, > 20 mm (Supplementary Figure S4A). Compared with the first CT, the distances of the pulmonary nodules to the pleura increased in different degrees in the second CT: 0–5 mm, 0.52 ± 0.91 vs. 1.35 ± 2.41 (P = 0.004); 5–10 mm, 0.35 ± 0.74 vs. 0.87 ± 1.60 (P = 0.014), 10–15 mm, 0.26 ± 0.53 vs. 0.46 ± 0.69 (P = 0.011); 15–20 mm, 0.20 ± 0.45 vs. 0.28 ± 0.58 (P = 0.103); and > 20 mm, 0.26 ± 0.49 vs. 0.41 ± 0.69 (P = 0.018) (Supplementary Figure S4B available in www.besjournal.com).
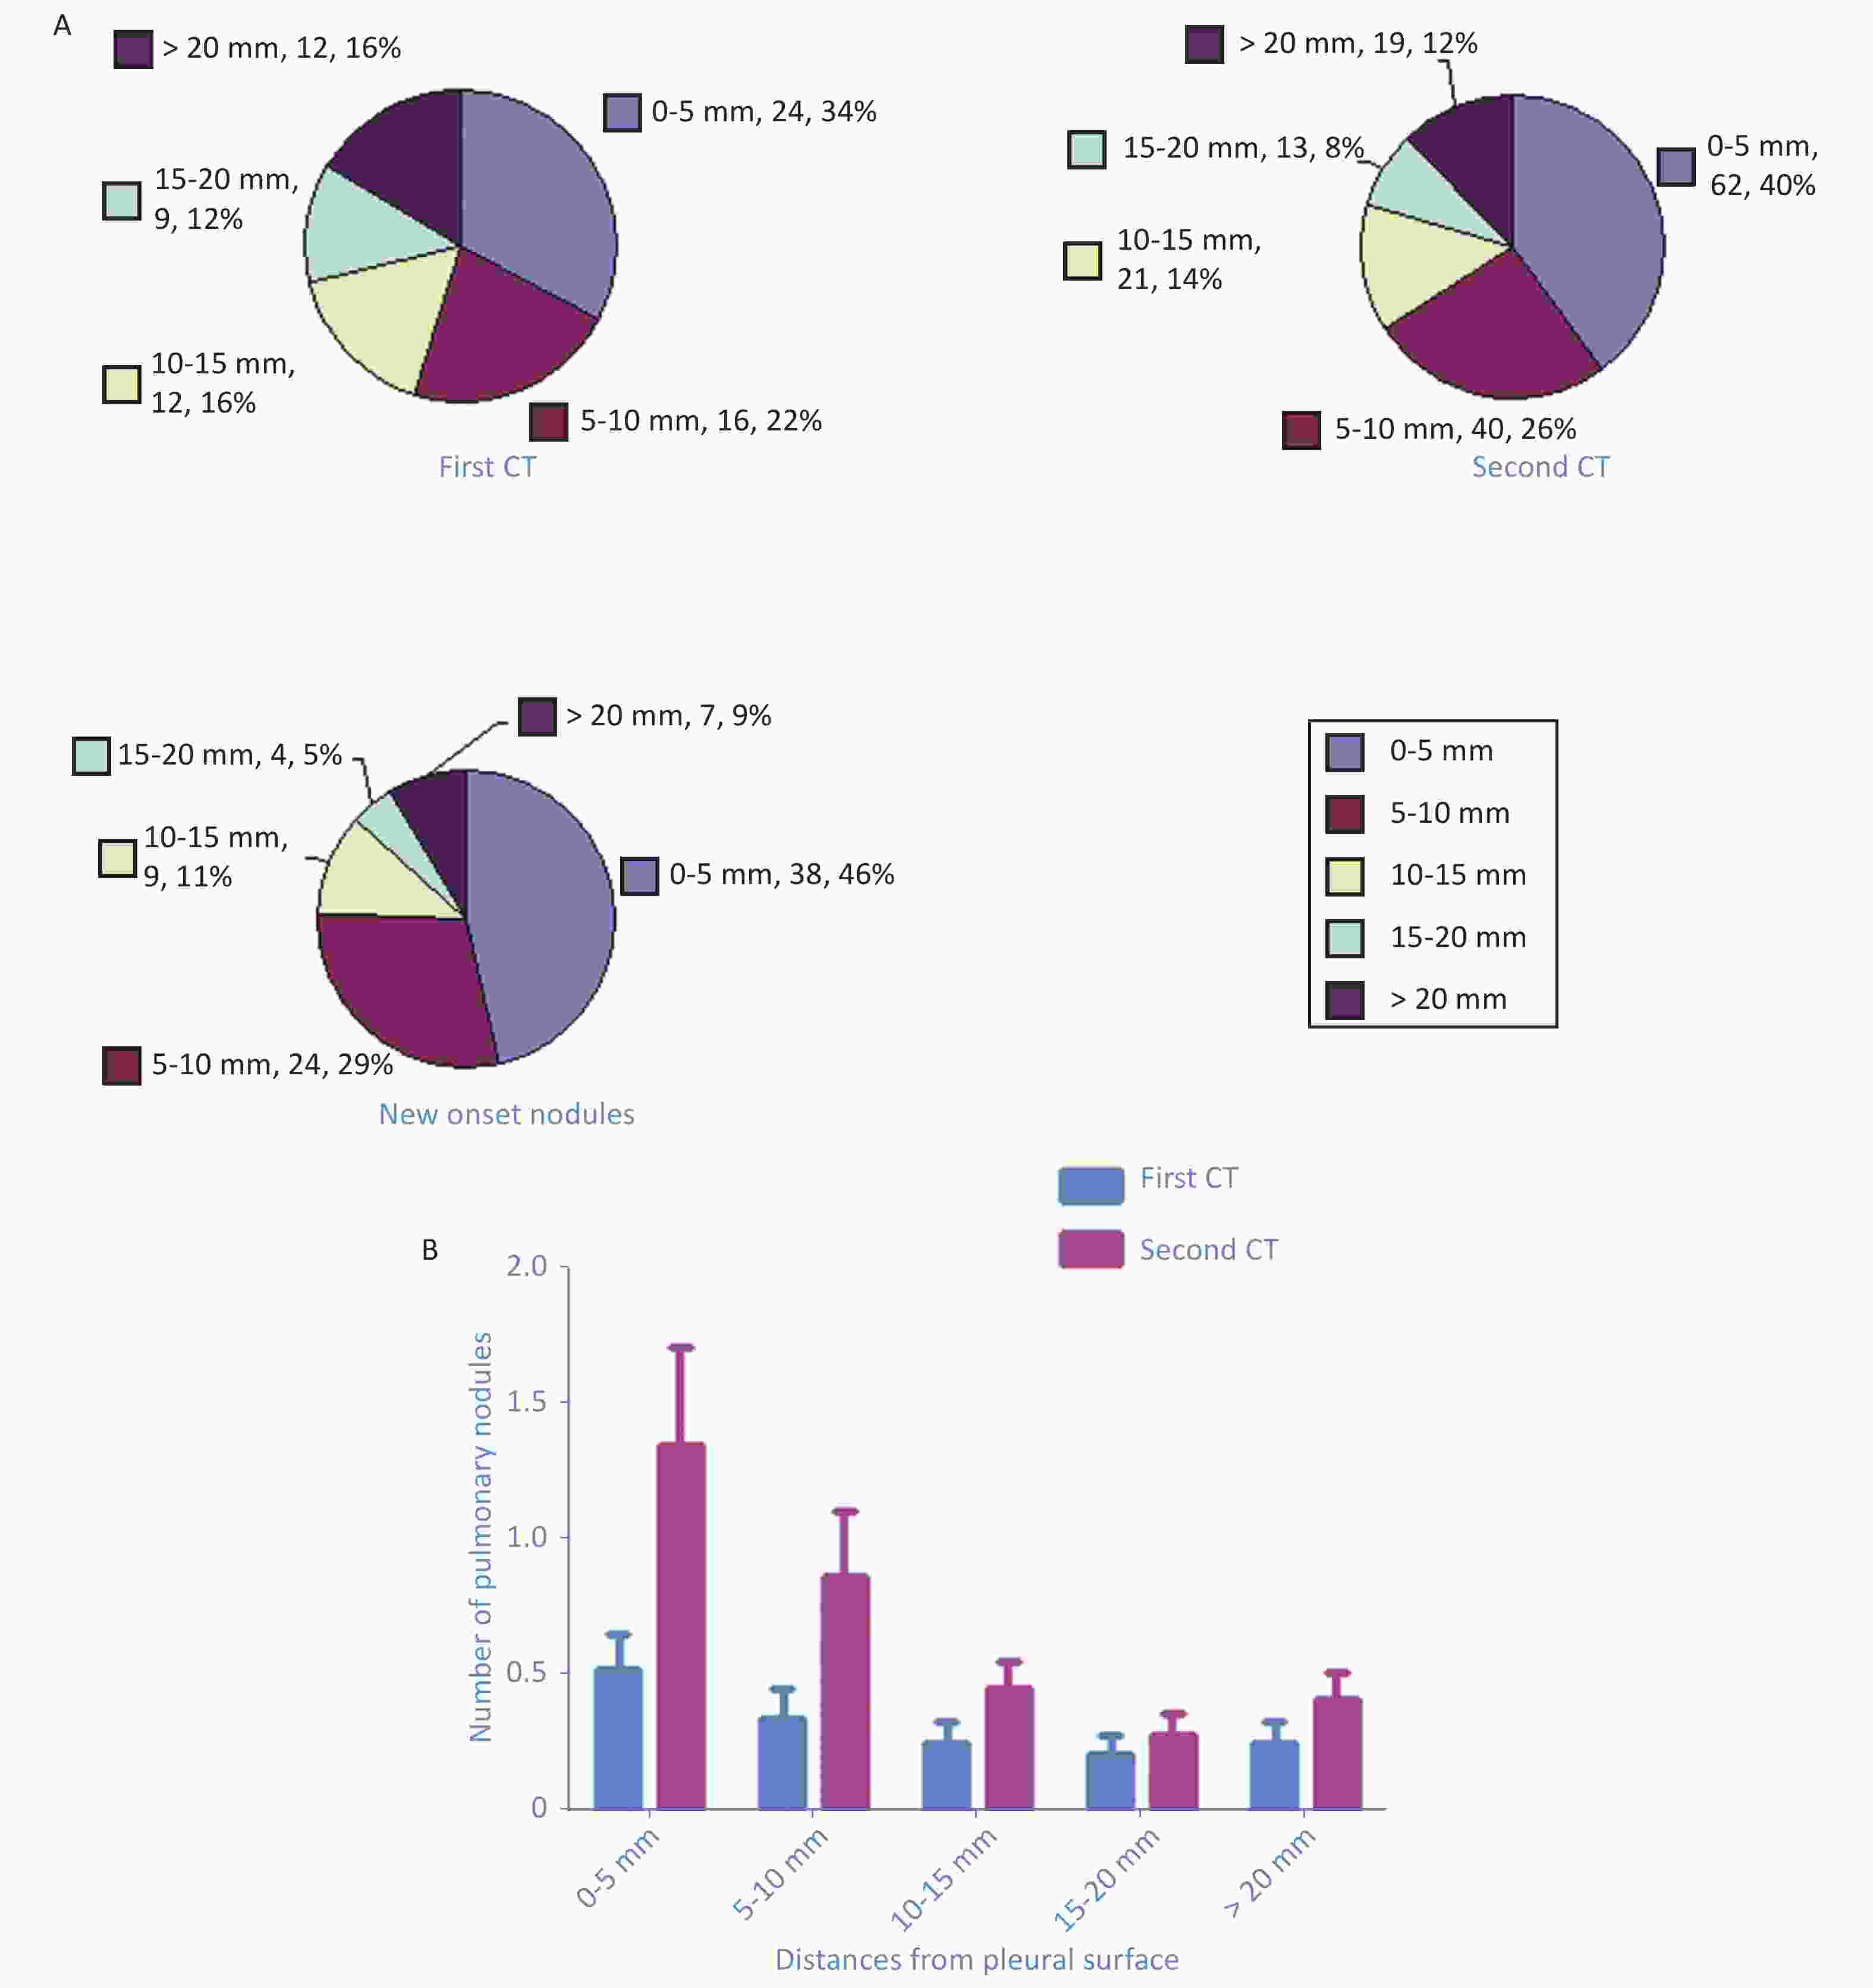
Figure S4. Pie chart showed the number of pulmonary nodules of different distances from the pleural surface detected in the first CT scan, the second CT scan, as well as the new onset nodules (A). Paired t test showed the increases of averaged numbers of nodules of different distances from the pleural surface: 0–5 mm (P = 0.004), 5–10 mm (P = 0.014), 10–15 mm (P = 0.011), 15–20 mm (P = 0.103), and > 20 mm (P = 0.018) (B).
During the COVID-19 epidemic, strict disinfection was carried out frequently. The floor of the isolation ward was disinfected four times a day using a disinfectant containing 500–1,000 mg/L of chlorine. Although the ward has regulated ventilation, some subjects said that the pungent smell of chlorine lingered in the air. It could be speculated that the chlorine content in the air in the isolation ward was higher than that in ordinary wards. Exposure of both humans and animals to chlorine causes lung injury, and chlorine was more likely to damage the alveolar[6]. Chlorine could induce various injuries (alveolar injury or airway injury) depending on the inhalation dose and concentration[7]. To our knowledge, no study has presented similar results, especially on the effect of long-term inhalation of small chlorine doses on human lungs. Previous studies have highlighted the potential importance of the maintenance of mitochondrial function in the recovery of the chlorine-damaged lung[8]. Differences in autoimmunity might explain why not all subjects had new-onset pulmonary nodules. With this immune regulatory mechanism, a mild lung injury caused by chlorine inhalation might heal itself [9]. In this study, one subject had undergone third CT at 1.5 months after the second CT, which revealed that most of the new-onset nodules disappeared (Figure 2) without therapy.
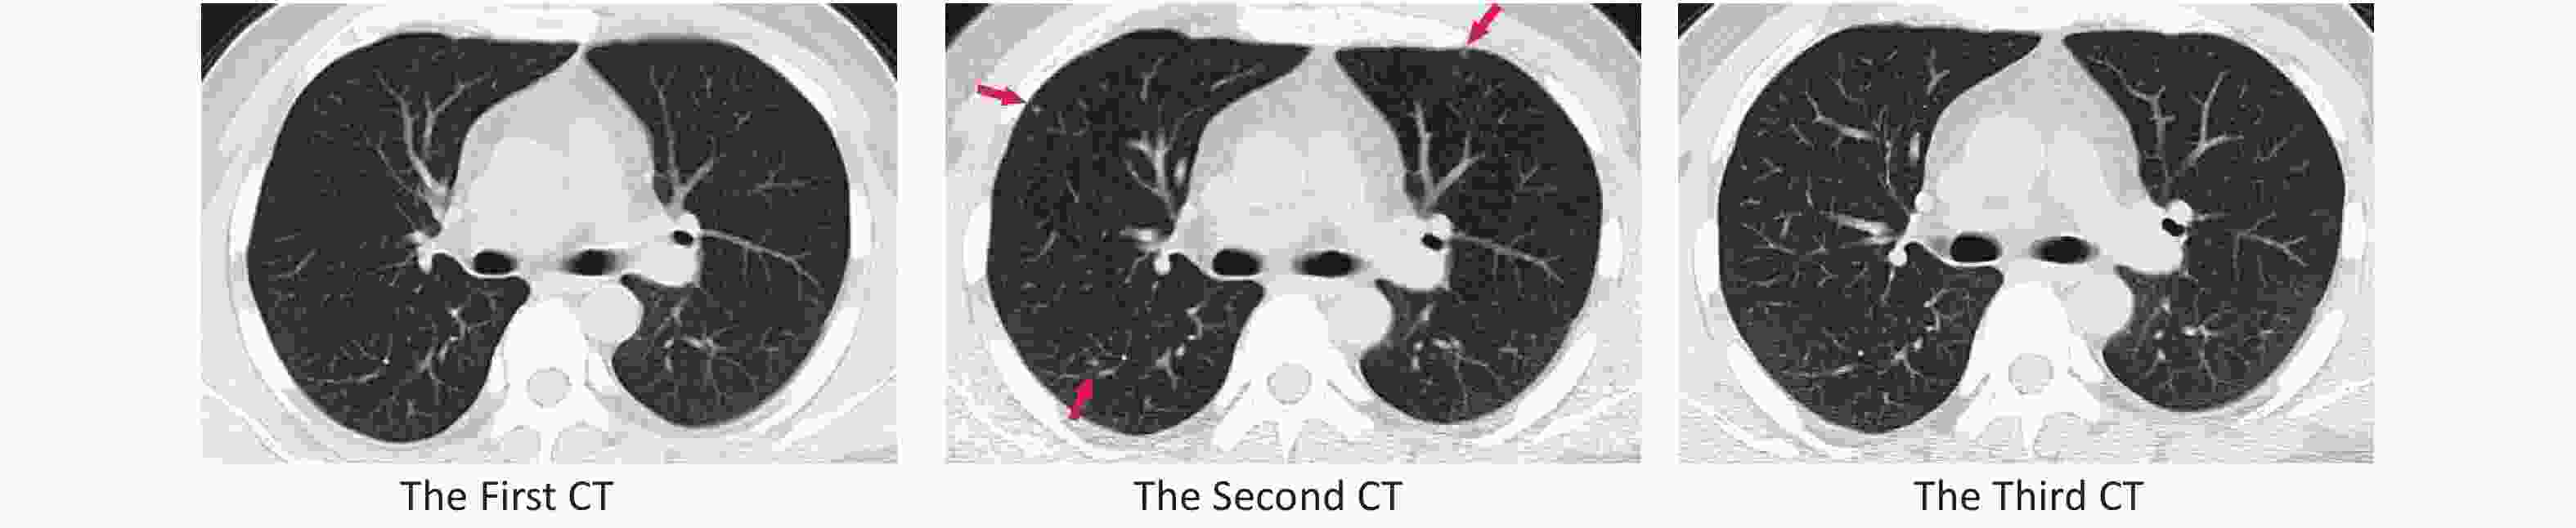
Figure 2. Compared with the first computed tomography (CT), the second CT showed three new-onset pulmonary nodules: a 3-mm solid nodule in the anterior segment of the upper lobe of the right lung, a 3-mm subsolid nodule in the dorsal segment of the lower lobe of the right lung, and a 2-mm subsolid nodule in the anterior lobe of the left superior lobe. The nodules disappeared in the third CT.
In conclusion, the number of pulmonary nodules increased in part-time staff members who was on duty in the isolation ward. Most of the new-onset nodules were subsolid and ground glass nodules and distributed near the pleura. Annual follow-up was recommended. The environment of the isolation ward disinfected with chlorine-containing disinfectant may be harmful to the respiratory system of health care staff. Hospitals should pay attention to the respiratory protection of its staff. We also recommended establishing criteria on chlorine concentration in the air of a working environment.
No potential conflicts of interest were disclosed.
LI Bo and HE Bing designed this paper; LI Bo also did all the statistical work. LI Yu Hua and YU Ke Wen collected data and wrote the manuscript. LUO Xin, LI Yu Hua, and HE Bing collected imaging data. SUN Neng Jun, YANG Jing, and JIN Xiao Dong were involved in part in the study design and data collection. All authors reviewed the manuscript.
HTML
Reference

 Quick Links
 DownLoad: