


-
Cardiovascular disease (CVD) is the leading cause of death worldwide[1, 2] and accounts for > 40% of deaths in the Chinese population[3]. Dyslipidemia is a group of metabolic derangements characterized by high low-density lipoprotein cholesterol (LDL-C), high total cholesterol (TC), high triglycerides (TG), and/or low high-density lipoprotein cholesterol (HDL-C) and is the major risk factor for atherosclerosis, which is highly associated with CVD development, and an independent predictor for coronary heart disease and ischemic stroke incidences[4, 5]. An increasing prevalence of dyslipidemia[6], which potentially explained the dramatic increase in the burden of atherosclerotic CVD in China, was reported with the rapid urbanization and economic transitions in the past few decades in China[6]. The prevalence rates of high LDL-C, low HDL-C, high TG, and high TC were 8.1%, 20.4%, 6.9%, and 13.8%, respectively, in 2013–2014[7]. Marked regional variations in epidemiological characteristics, such as prevalence rate and associated factors of dyslipidemia, were observed[8].
Lowering cholesterol was proven as an effective measure to reduce CVD risk in addition to blood pressure and glucose management[9-11]. China lags in dyslipidemia management due to lifestyle changes in the last few decades, including reduced physical activity and increased oral energy intake from fat[12]. The current treatment and control rates of dyslipidemia were calculated according to the definition of dyslipidemia and were reported as 14.4% and 4.9%, respectively, requiring urgent improvement[8]. However, limited studies have assessed the treatment and control rates in achieving LDL-C lowering targets or reported the availability of lipid-lowering medication in primary health settings across China. Further, lipid management is suggested to be included in the “healthy China 2030 action plan,” which might be listed in the essential public health services program and be co-managed with blood pressure and glucose in primary settings in the near future.
Previous studies reported the dramatic differences in abnormal lipid profiles and awareness, treatment, and control rates of Chinese people[8, 13], which might be one of the main reasons for the unsatisfactory management of such disorders. A deep understanding of the spatial distribution of dyslipidemia at the provincial level is critical to plan the population prevention strategy because each province developed the corresponding province-specific health action plan according to the regional health characteristics. Previous studies were conducted based on a purposively selected population sample and reported the geographic variations of dyslipidemia at the great region level, thereby preventing the authorities from developing more up-to-date region-specific and -precise prevention interventions for lipid abnormalities in Chinese adults. Limited studies investigated the spatial disparity in such a country with uneven socioeconomic development. Therefore, understanding the geographic disparities of the prevalence and management of dyslipidemia at a more granular level is vital in China. Our study aims to provide more solid and updated evidence for developing regional-condition-based lipids management strategy by investigating the provincial-level variation of prevalence, awareness, treatment, and control of dyslipidemia in Chinese adults using a nationally representative cross-sectional survey.
-
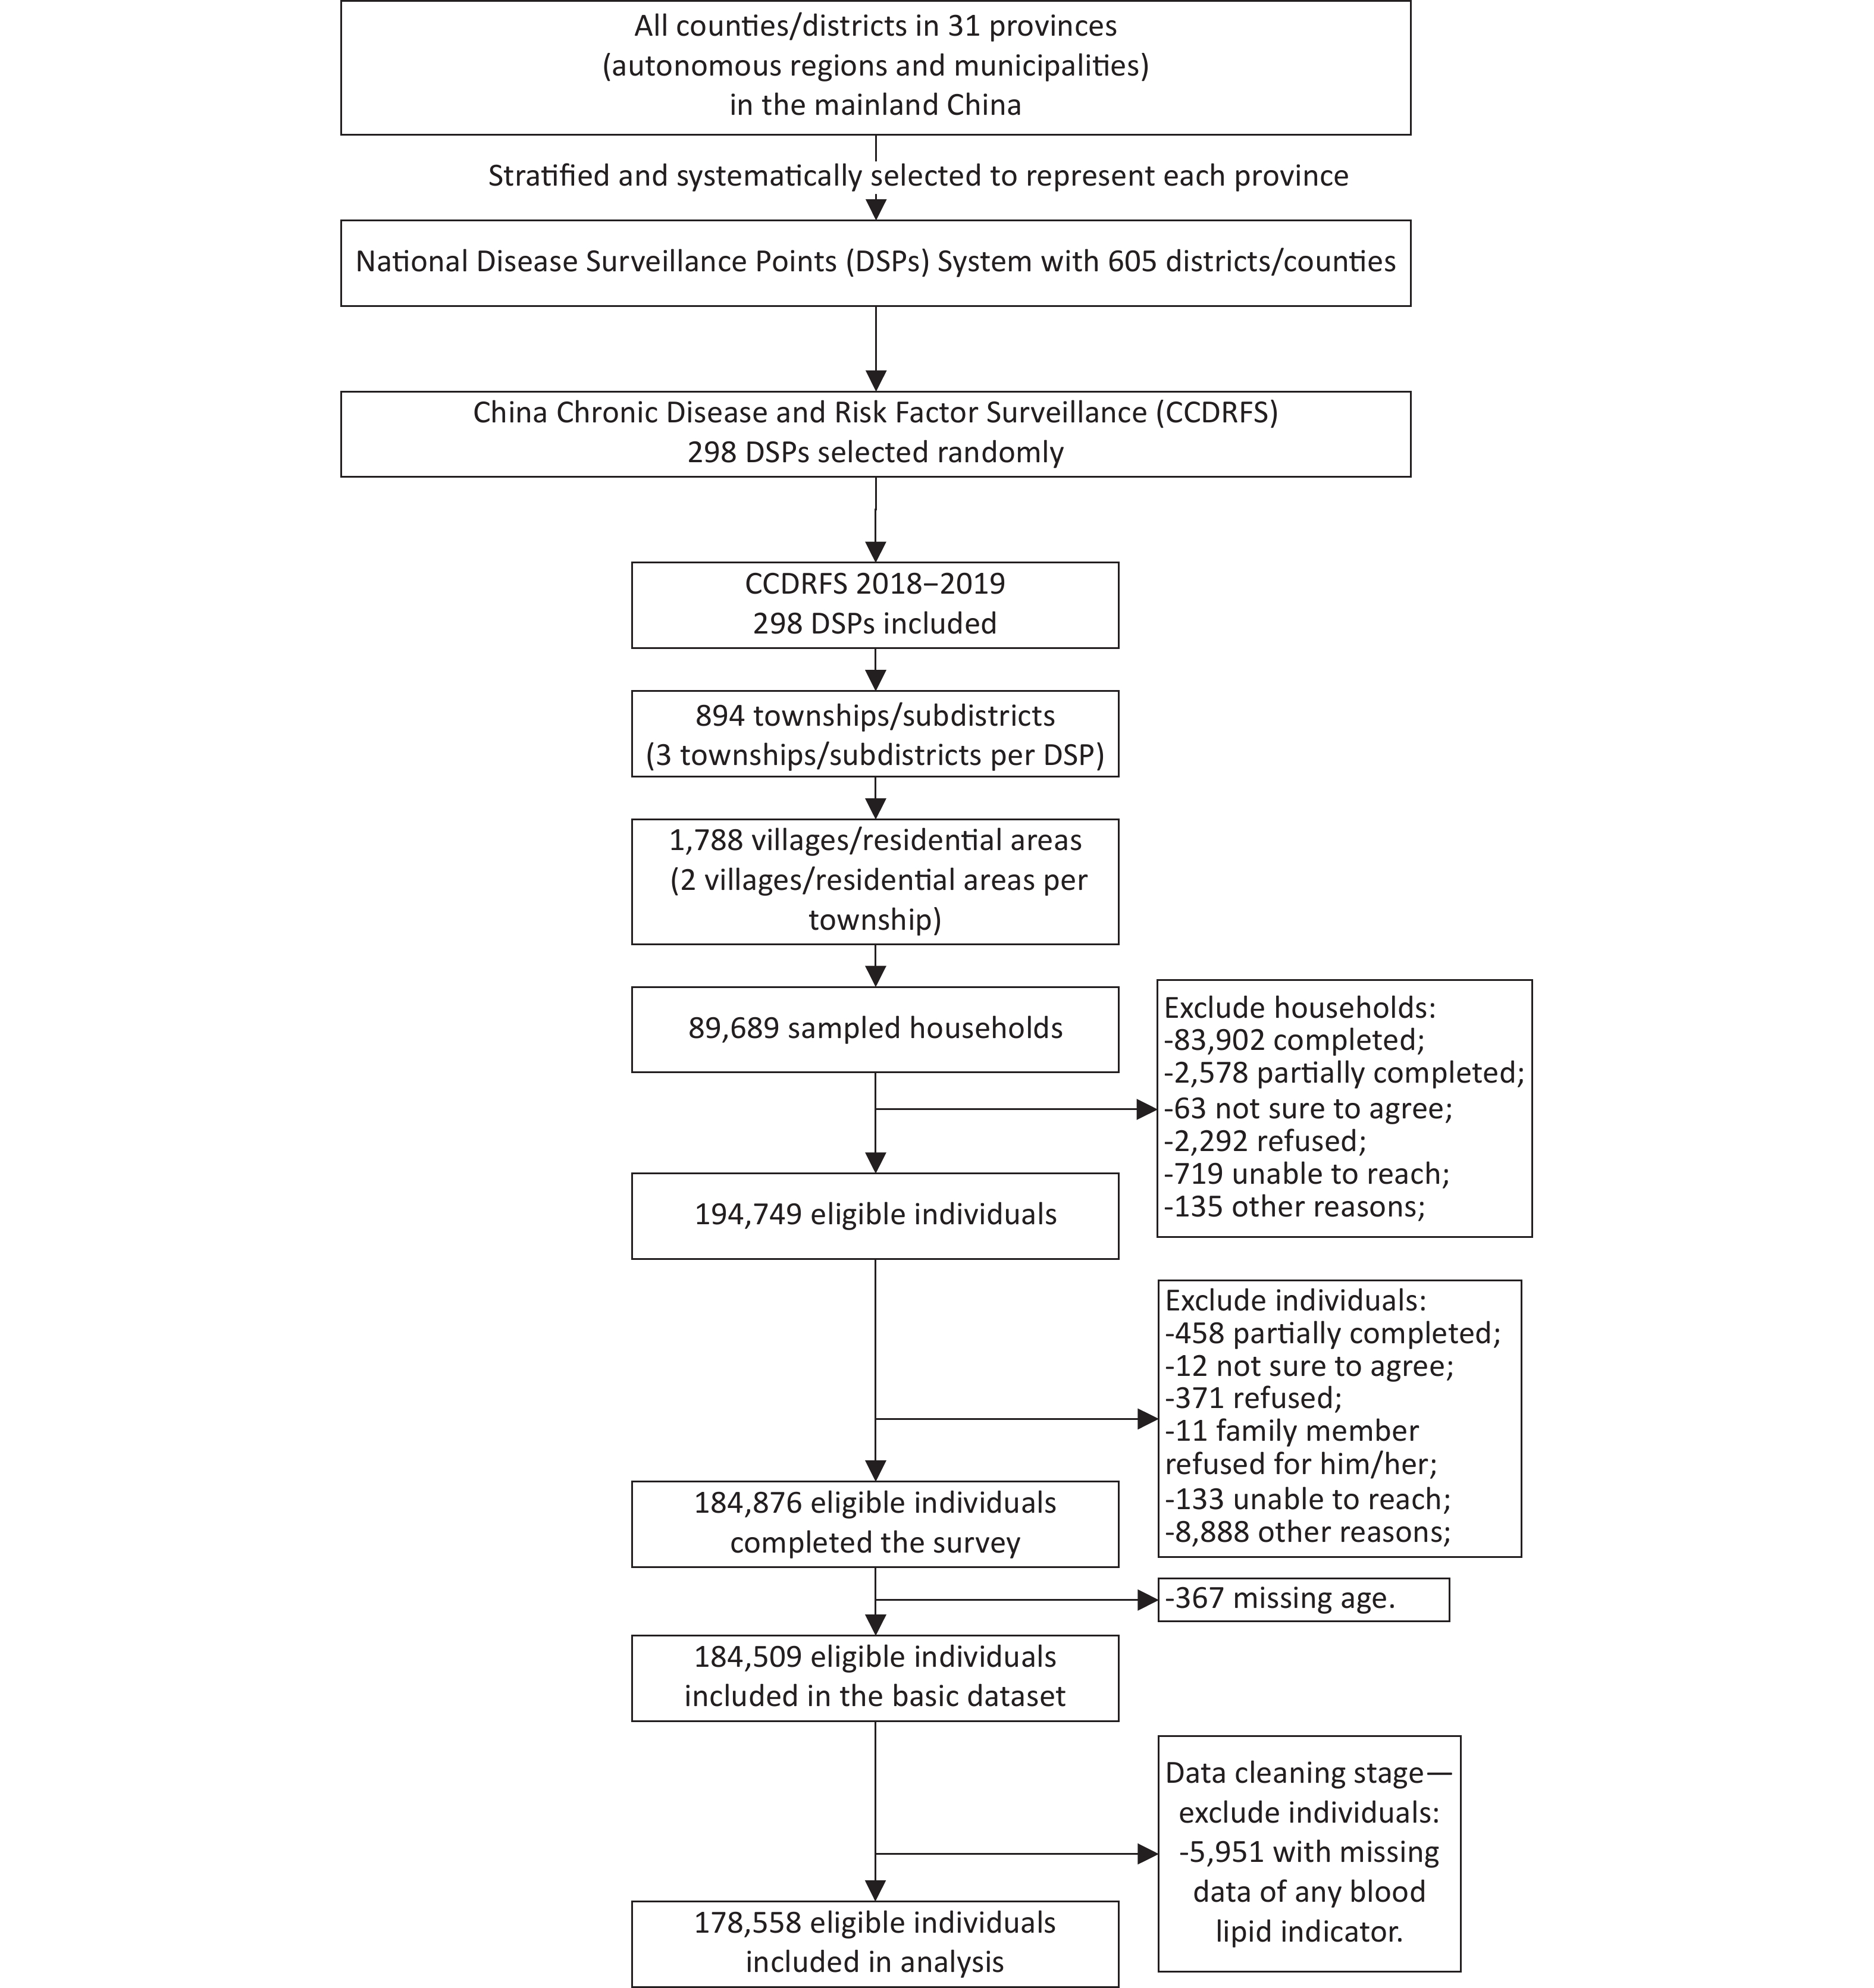
A national and provincial representative cross-sectional survey (China Chronic Disease and Risk Factor Surveillance [CCDRFS]) was conducted in mainland China in 2018–2019 using a multi-stage, stratified, cluster-randomized sampling design (Figure 1). Briefly, CCDRFS is a series of ongoing periodical nationally representative cross-sectional surveys conducted by the National Center for Chronic and Non-communicable Disease Control and Prevention (NCNCD) and the Chinese Center for Disease Control and Prevention[14, 15]. The CCDRFS system covered 298 districts/counties (surveillance points) from 31 provinces (autonomous and municipalities) across mainland China.
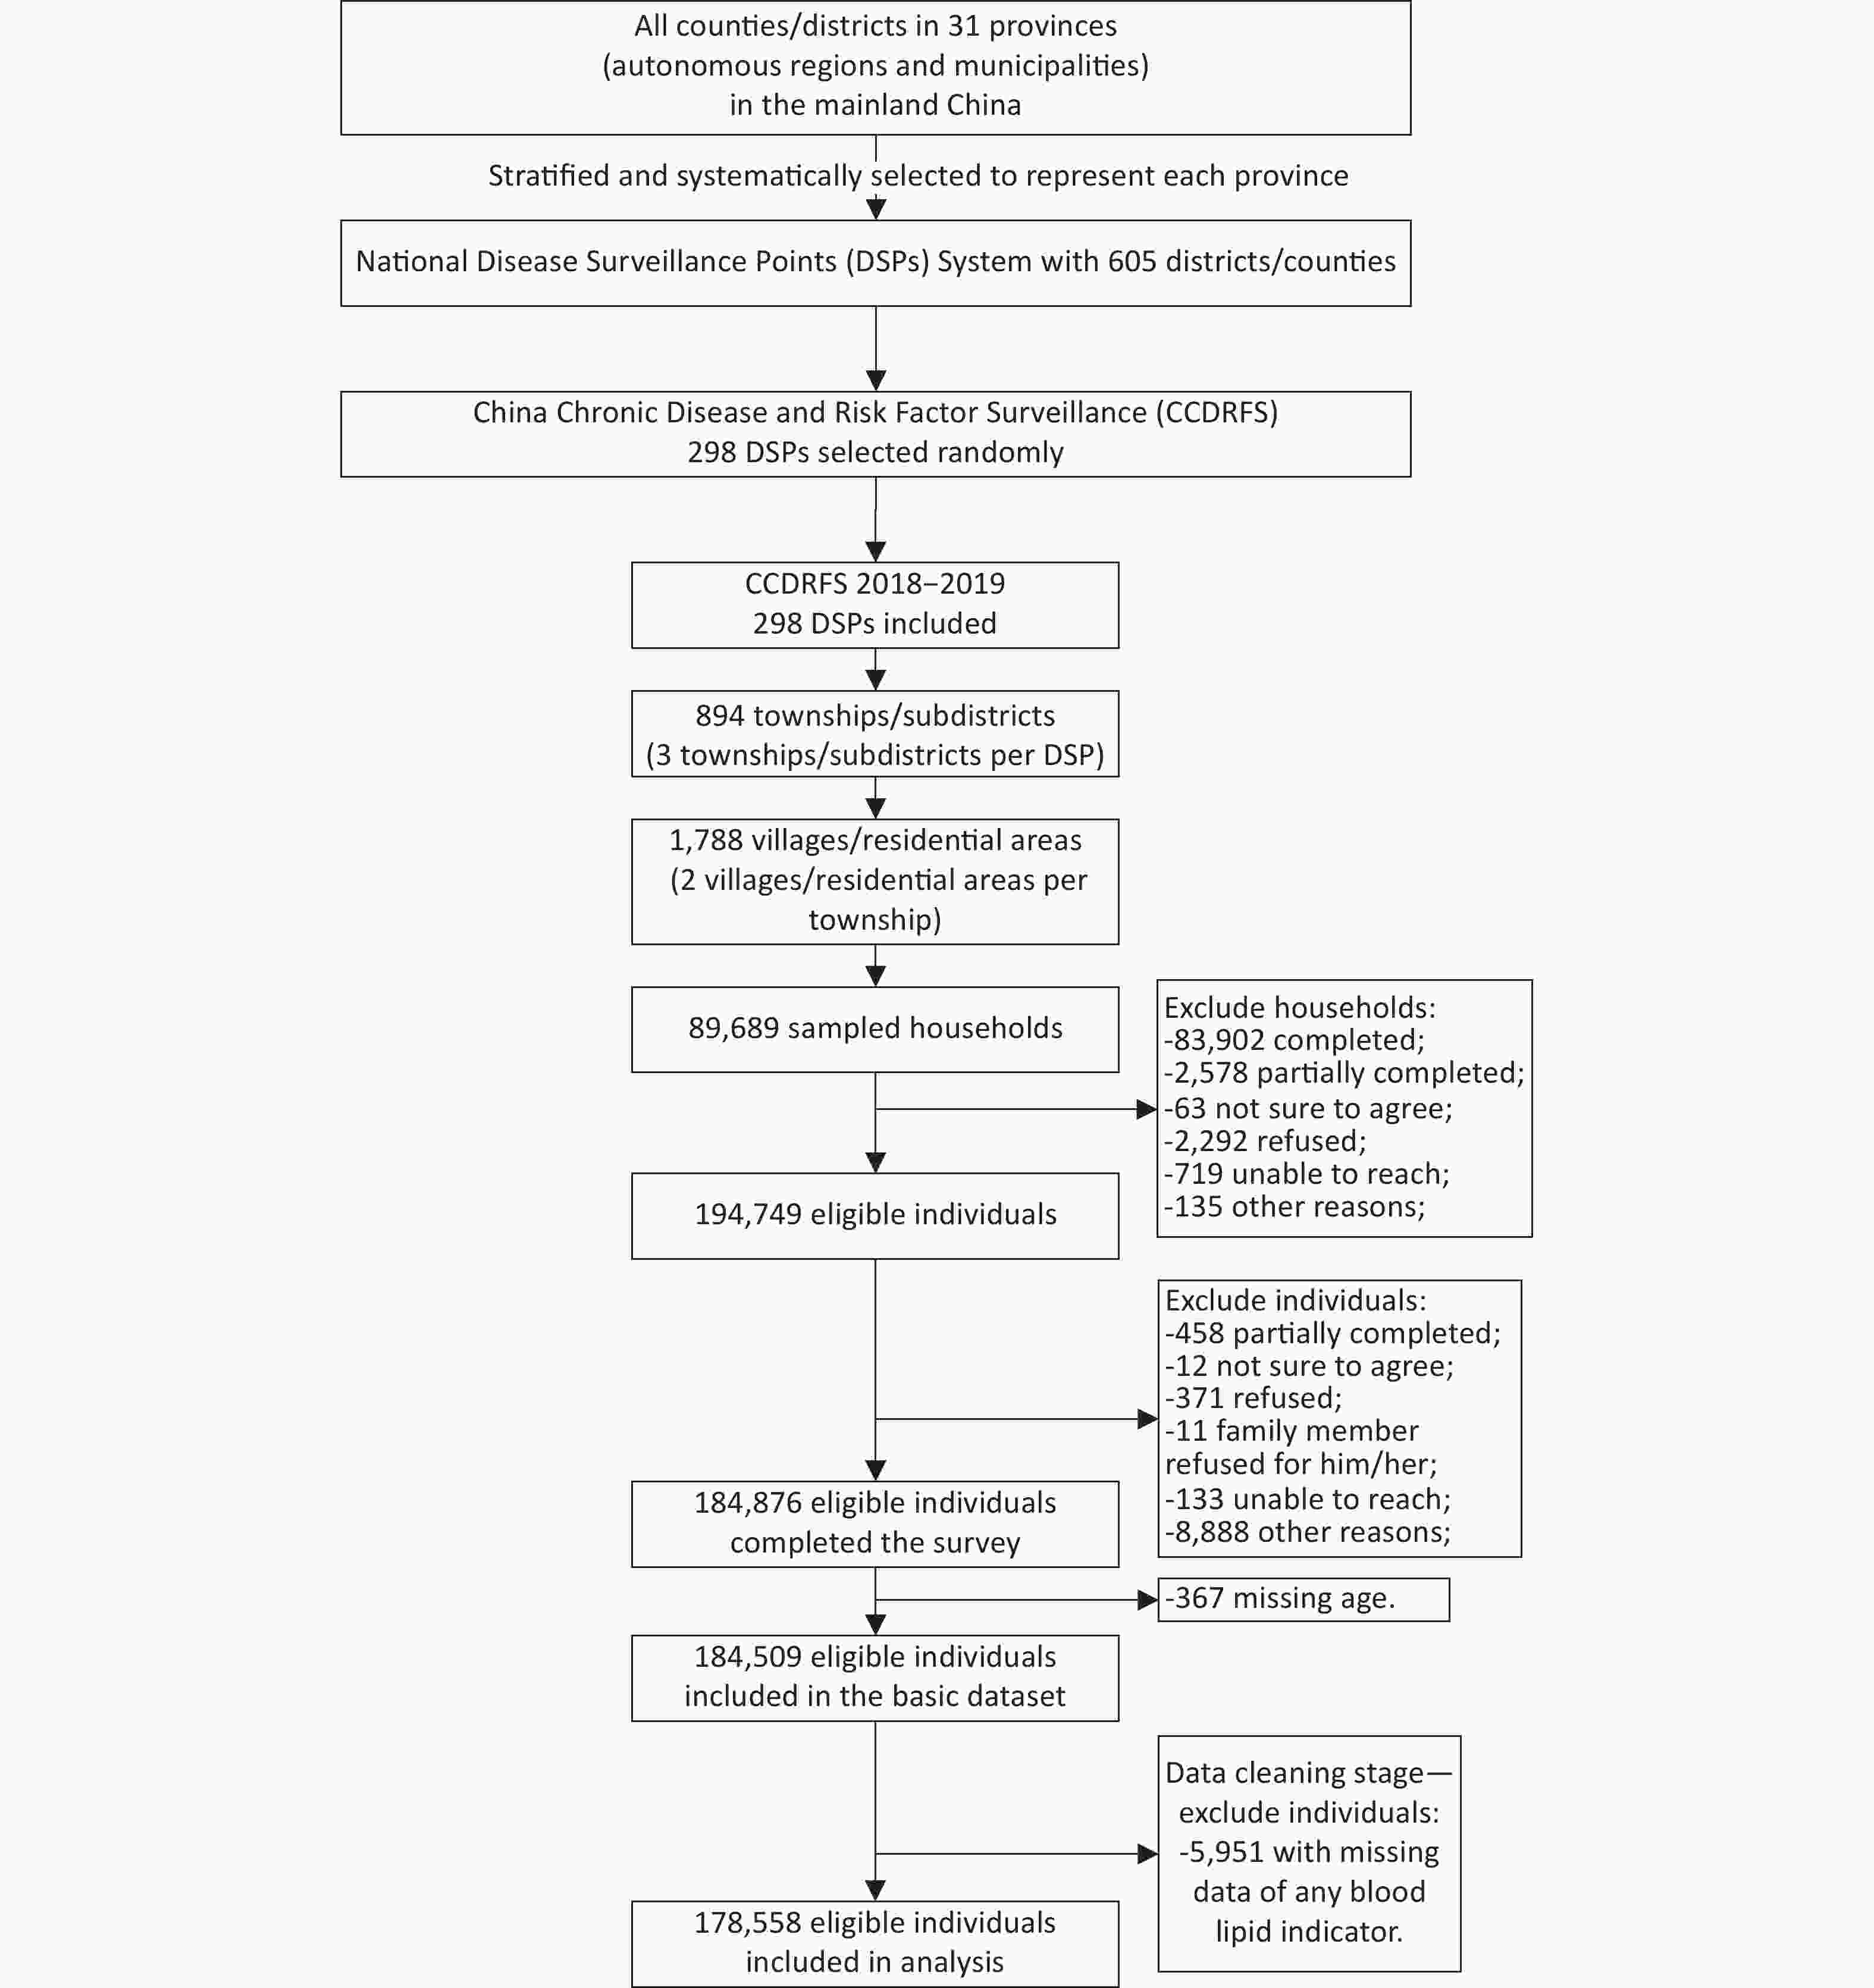
Figure 1. Flow diagram of study sampling
-
A household list was collected by the local Center for Disease Control and Prevention (CDC) for each surveillance point after the initial screening of all residents. Then, subjects, as households, were selected using multi-stage stratified cluster sampling, followed by a home visit to collect information. Inclusion criteria include (i) ages of ≥ 18 years; (ii) having lived in the address for > 6 months in the past 12 months; (iii) not pregnant; (iv) no serious health condition or illness that would prevent the individual from participating, including intellectual disability or language disorder and all eligible participants in the household have been invited to participate in the filed survey. Of 194,749 individuals initially invited, 184,876 individuals completed the survey (94.9% response rate), of whom approximately 3.4% (n = 6,318) were excluded due to missing demographic and lipid data; thus, 178,558 participants remained for the final analysis.
-
Dyslipidemia was defined, and serum TC, LDL-C, HDL-C, and TG levels were categorized according to the 2016 Chinese Guideline for the Management of Dyslipidemia in Adults[16], which was aligned with the National Cholesterol Education Program (NCEP) Expert Panel on Detection, Evaluation, and Treatment of High Blood Cholesterol in Adults (Adult Treatment Panel III) final report (NCEP-ATP III)[4]. Dyslipidemia was defined as any of the following conditions: TC of ≥ 6.22 mmol/L or LDL-C of ≥ 4.14 mmol/L or HDL-C of < 1.04 mmol/L, or TG of ≥ 2.26 mmol/L or currently under antihyperlipidemic treatment[16]. Participants previously diagnosed with dyslipidemia were classified as having an awareness of dyslipidemia. The eligibility of participants who should receive lipid-lowering medication and who have been controlled was defined based on the atherosclerotic cardiovascular disease (ASCVD) risk stratification in the Chinese guideline. Participants currently taking antihyperlipidemic treatment among eligible participants were classified as having dyslipidemia treatment. Specifically, participants who had established ASCVD and LDL-C of ≤ 1.8 mmol/L or who had an estimated 10-year ASCVD risk of ≥ 10% and LDL-C of ≤ 2.6 mmol/L, or who had an estimated 10-year ASCVD risk of < 10% and LDL-C of ≤ 3.4 mmol/L were considered as having been controlled[16].
In the CCDRFS, all participants were informed by trained interviewers from local CDCs and consented in writing before data collection. Interviewers administered a standardized and structured questionnaire for a face-to-face interview that covered detailed information on general demographic, socioeconomic, dietary, and other lifestyle factors (e.g., smoking, alcohol drinking, and physical activity), medical conditions, and medication use at each study community clinic or health station. Physical measurements included height, weight, waist circumference, and blood pressure. Blood samples were obtained in the morning after a 10-h overnight fast. Serum samples used for lipid tests were pre-treated in the field, then delivered to the local CDCs and stored in a refrigerator at −20 ℃. Serum samples were frozen at −80 ℃ with dry ice for 1 week after collection and shipped by air to the central laboratories, then measured using a ROCHE COBAS C702 automated clinical chemistry analyzer (ROCHE DIAGNOSTICS, IN, USA). Precision and accuracy verification for centralized labs was performed by measuring one batch of 2 levels of freeze-dried quality control material 3 times per day for 5 days before biochemical testing. The coefficient of variations and bias (B) of each laboratory were calculated. All centralized labs have passed precision and accuracy requirements from the Chinese health industry standard WS/T 492-2016 before the survey and assessed lipids with serum samples according to a standard protocol.
The ethical review committee of the NCNCD approved the 2018 CCDRFS (approval number 201819) studies.
-
Age-sex adjusted rates and confidence intervals (CIs) were estimated using the Sixth National Population Census conducted in 2010 provided by the National Statistics Bureau of China, considering the complex design of the survey sample. We created a series of choropleth maps, denoting the prevalence rate of the four components of dyslipidemia by provinces to provide a direct and graphic representation of the distribution of dyslipidemia across the country. Lipid-lowering therapy indication is based on the ASCVD risk with LDL-C level as the treatment target according to the current clinical guidelines. Additionally, we performed linear regression analyses to investigate associations between economic level and accessibility to health care with the prevalence rates of each type of dyslipidemia and treatment and control rates of dyslipidemia. The economic level was proxied by the socio-demographic index (SDI, a measure indicating the development of regions considered incomes per capita, average educational attainment, and fertility rates) and urbanization rate, and accessibility to health care was proxied by affordable basic technologies and essential medicines (ABTEM) and the number of general practitioners (GPs) per 10,000 people in the province. All statistical analyses were conducted using SAS (Version 9.4; SAS Institute Inc., Cary, USA) and R statistical software version 4.11 (R Project for Statistical Computing).
-
The funding sources had no role in the design, conduct, or analysis of the study or the decision to submit the manuscript for publication.
-
The mean age of the 178,558 eligible participants was 55.1 ± 13.8 years, and 102,591 (55.6%) were females. The crude prevalence of dyslipidemia was 35.6%. The characteristics of the sample are shown in Table 1.
Variables Number (% or CI) Overall 178,558 Age (years) 18–29 9,340 (5.2) 30–39 17,626 (9.9) 40–49 32,241 (18.1) 50–59 46,950 (26.3) 60–69 48,642 (27.2) 70+ 23,759 (13.3) Sex Female 99,690 (55.8) Male 78,868 (44.2) Region Rural 105,532 (59.1) Urban 73,026 (40.9) Dyslipidemia Overall 38.2 (27.1–39.2) High TC 8.2 (7.7–8.7) High LDL-C 8.0 (7.4–8.5) Low HDL-C 20.9 (19.9–21.9) High TG 18.4 (17.4–19.3) Awareness of dyslipidemia* 17.5 (16.4–18.6) Treatment of dyslipidemia* 10.1 (9.3–10.8) Control of dyslipidemia* 6.9 (6.3–7.4) Note. Standardized rate adjusted to the Sixth National Population Census (2010). *Participants with dyslipidemia. Table 1. Characteristics of the 178,558 study participants
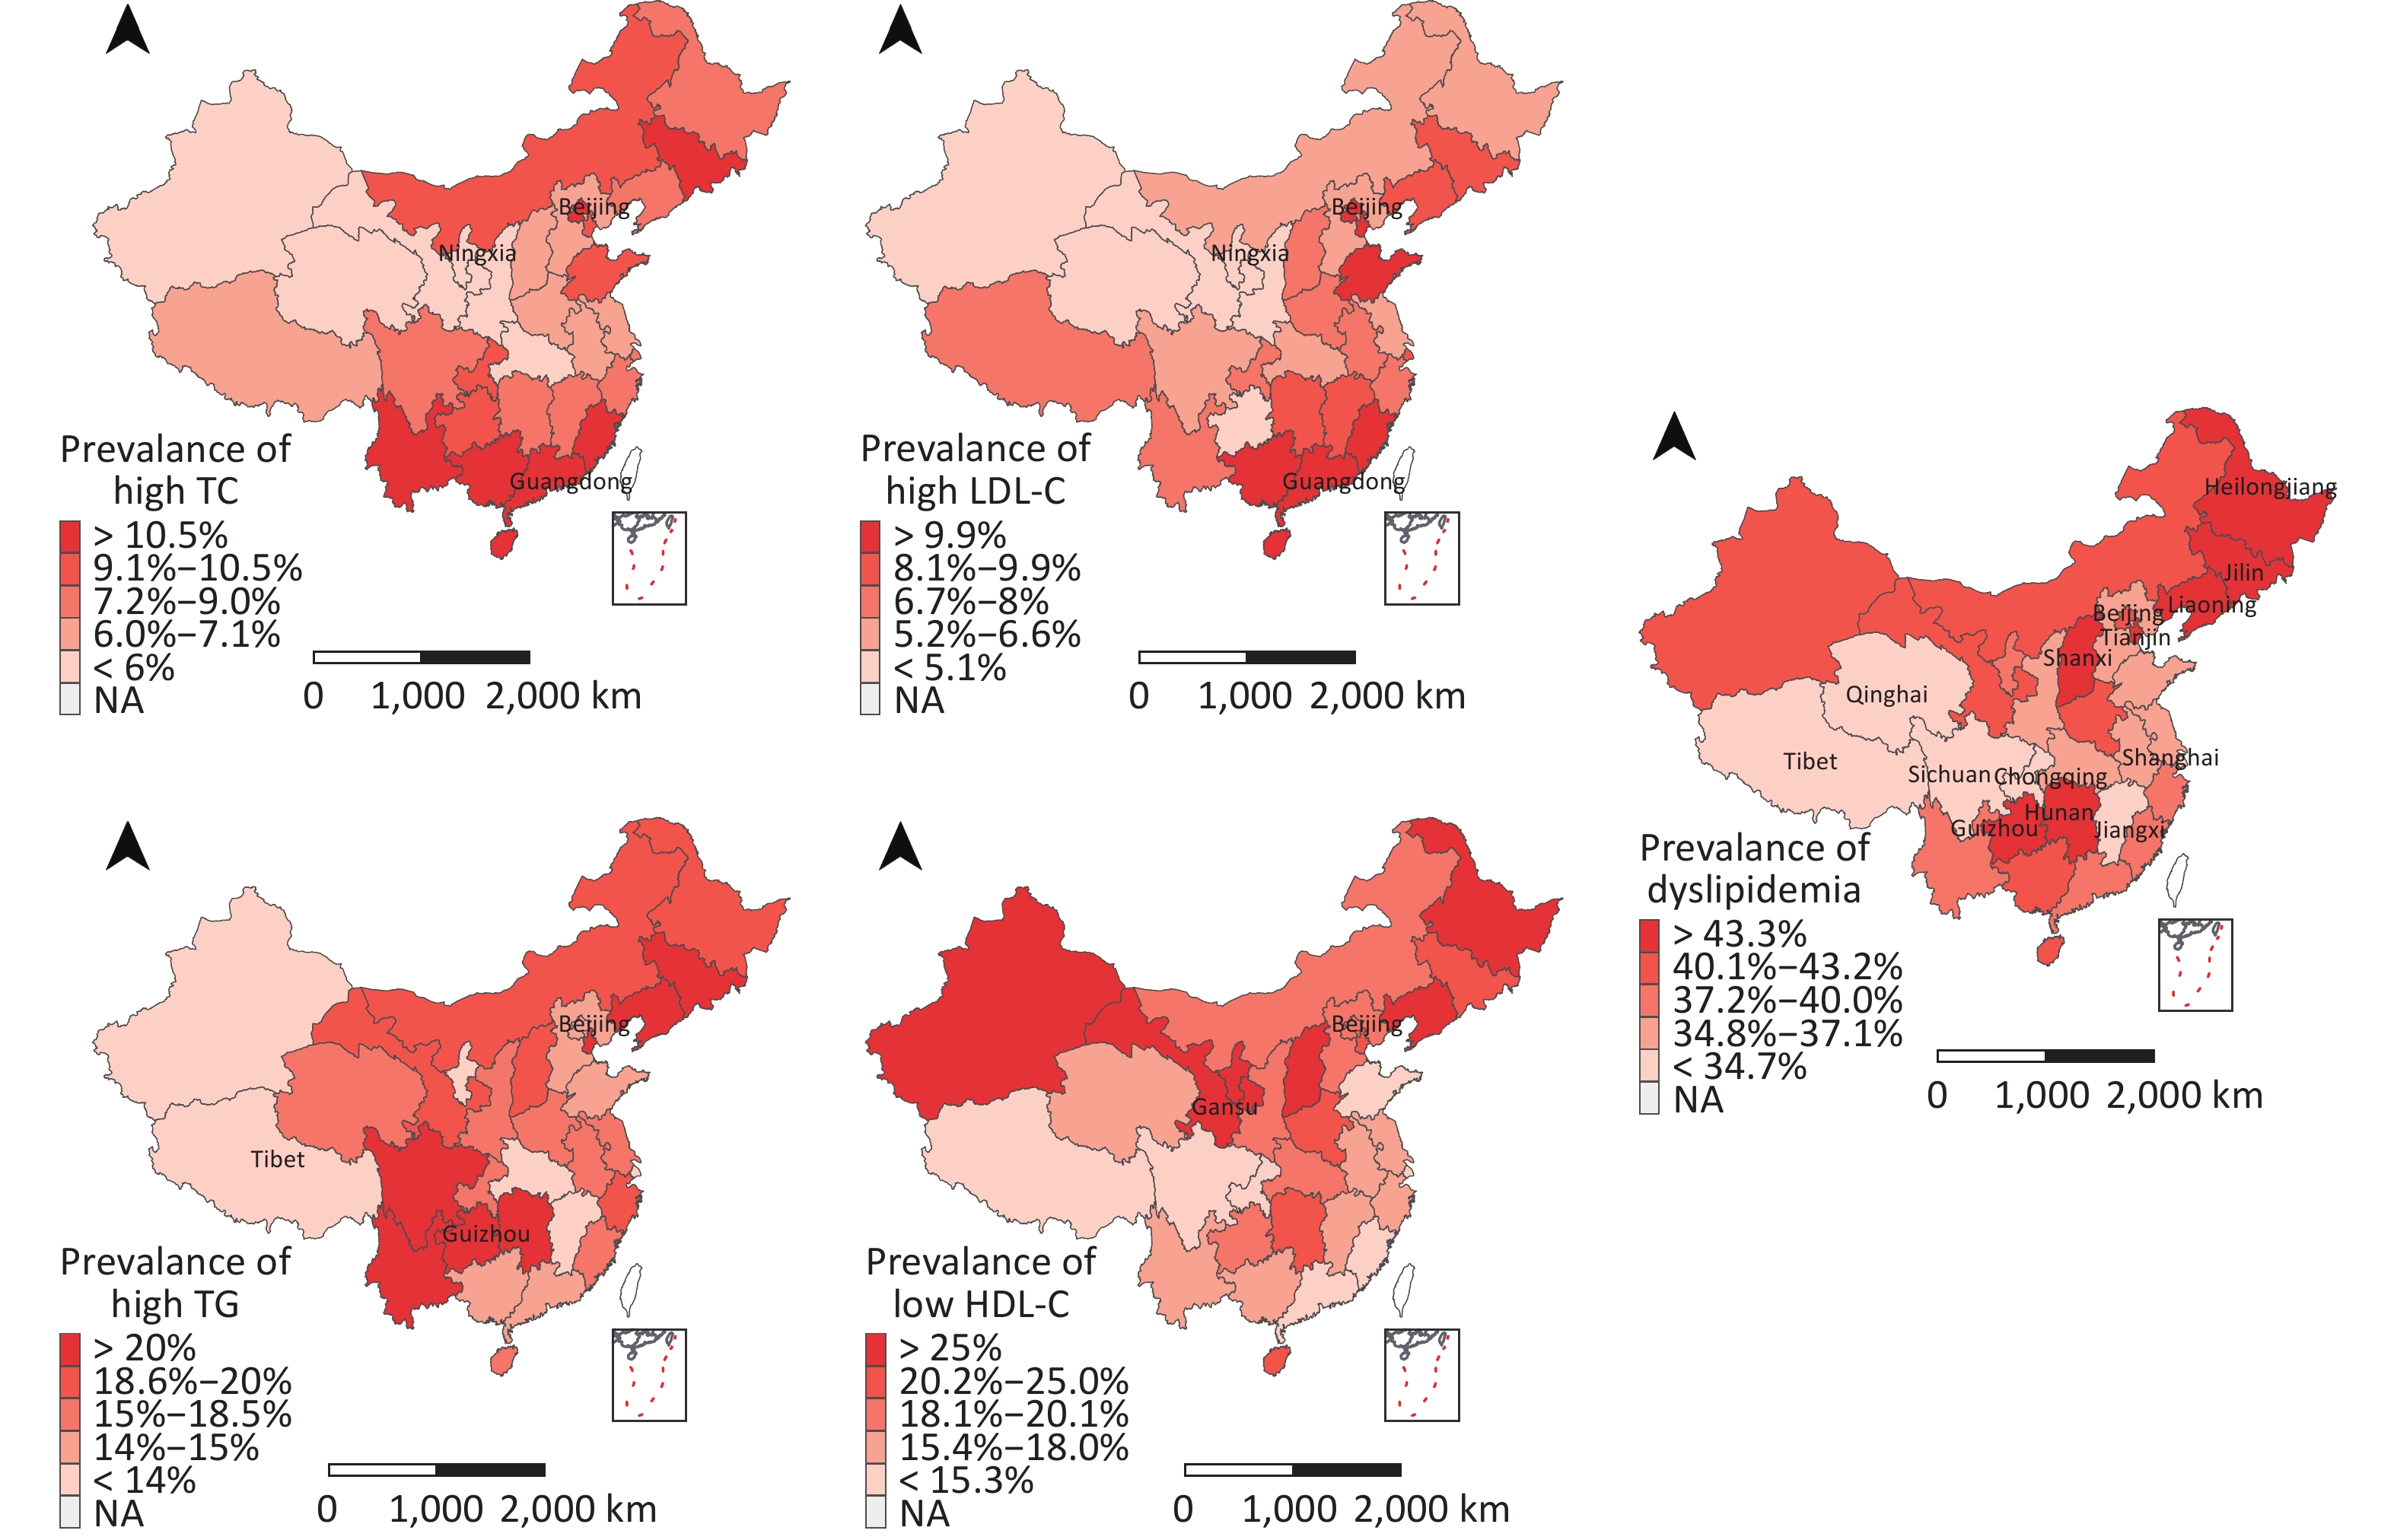
Figure 2 illustrates the standardized prevalence of dyslipidemia by province. The prevalence of each province was divided into quintile intervals. The provinces with the highest prevalence of dyslipidemia quintile (43.4%–49.7%) were Guizhou (49.7%, 95% CI: 30.9%–68.6%), Jilin (47.5%, 95% CI: 42.9%–52.1%), Tianjin (47.4%, 95% CI: 41.5%–53.4%), Liaoning (46.1%, 95% CI: 41.1%–51.3%), Heilongjiang (46.2%, 95% CI: 41.0%–51.4%), Shanxi (45.9%, 95% CI: 42.0%–49.8%), and Hunan (43.4%, 95% CI: 38.8%–48.1%). Whereas provinces with the lowest prevalence of dyslipidemia quintile (27.8%–35.0%) included Tibet (27.8%, 95% CI: 17.9%–40.4%), Qinghai (30.8%, 95% CI: 24.4%–38.0%), Shanghai (32.5%, 95% CI: 27.7%–37.6%), Jiangxi (33.7%, 95% CI: 29.5%–38.2%), Sichuan (34.6%, 95% CI: 27.6%–42.2%), Chongqing (34.7%, 95% CI: 30.7%–38.9%), and Shaanxi (35.0%, 95% CI: 31.5%–38.7%). Generally, provinces that lie between north latitudes 30 to 35 degrees crossed by the Yangtze River had a relatively lower prevalence (27.8%–37.2%) of dyslipidemia.
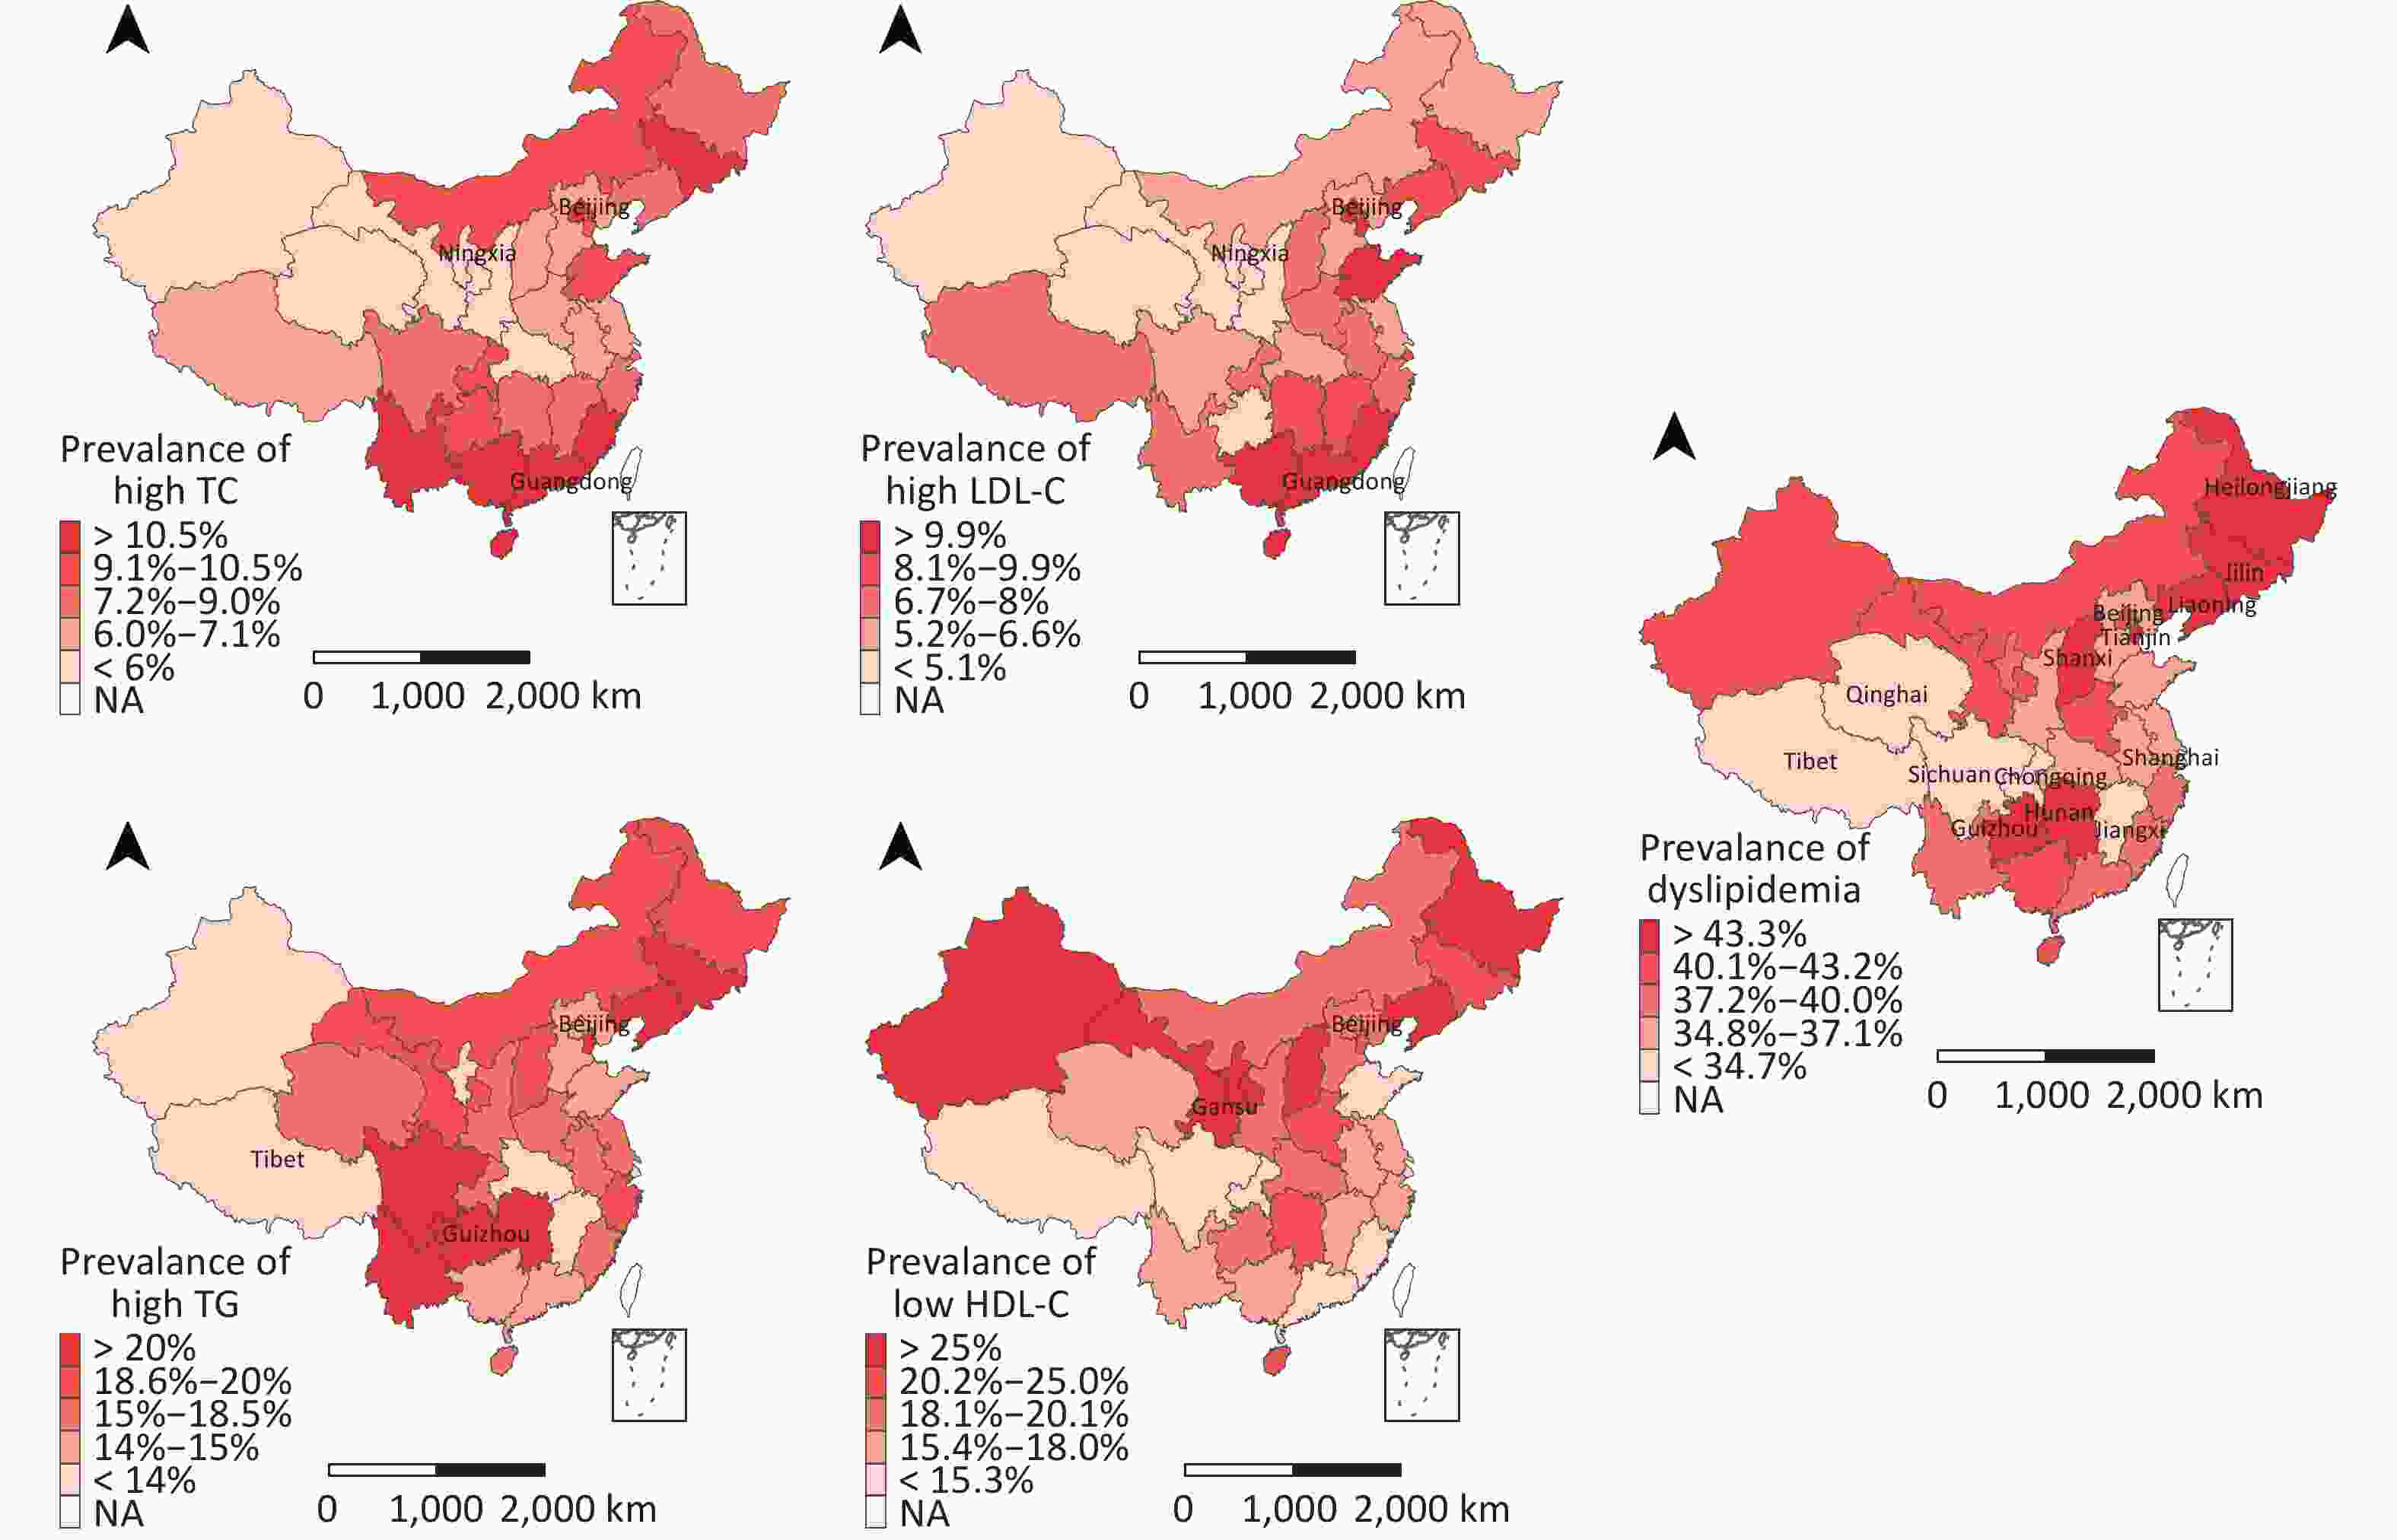
Figure 2. Geographic distribution of prevalence of dyslipidemia
The prevalence of high TC ranged from 2.5% to 16.7%, and high LDL-C prevalence ranged from 2.1% to 19.7% across provinces. Noticeably, the geographic distribution of these two dyslipidemia types was similar. The highest and lowest prevalence rates of high TC and LDL-C were found in Guangdong (high TC: 16.7%, 95% CI: 12.1%–22.7%; high LDL-C: 19.7%, 95% CI: 15.3%–24.9%), and Ningxia (high TC: 2.5%, 95% CI: 1.3%–4.7%; high LDL-C: 2.1%, 95% CI: 1.2%–3.6%), respectively. Provinces in both the highest prevalence of high TC (≥ 10.7% and ≤ 16.7%) and high LDL-C (≥ 9.9% and ≤ 19.7%) quintiles included Guangxi, Hainan, Fujian, and Beijing, while provinces with the lowest prevalence of high TC (≥ 2.5% and < 6.1%) and high LDL-C (≥ 2.1% and < 5.2%) quintile included Gansu, Xinjiang, Shaanxi, and Qinghai.
Provinces in the northwest and northeast of China generally had higher low HDL-C levels. The highest prevalence rate of low HDL-C quintile was 24.9%–31.4%, with the highest in Gansu (31.4%, 95% CI: 24.7%–38.9%). High TG was more common in the southwest and northeast of China, with the highest prevalence rate of high TG quintile of 20.4%–35.9%.
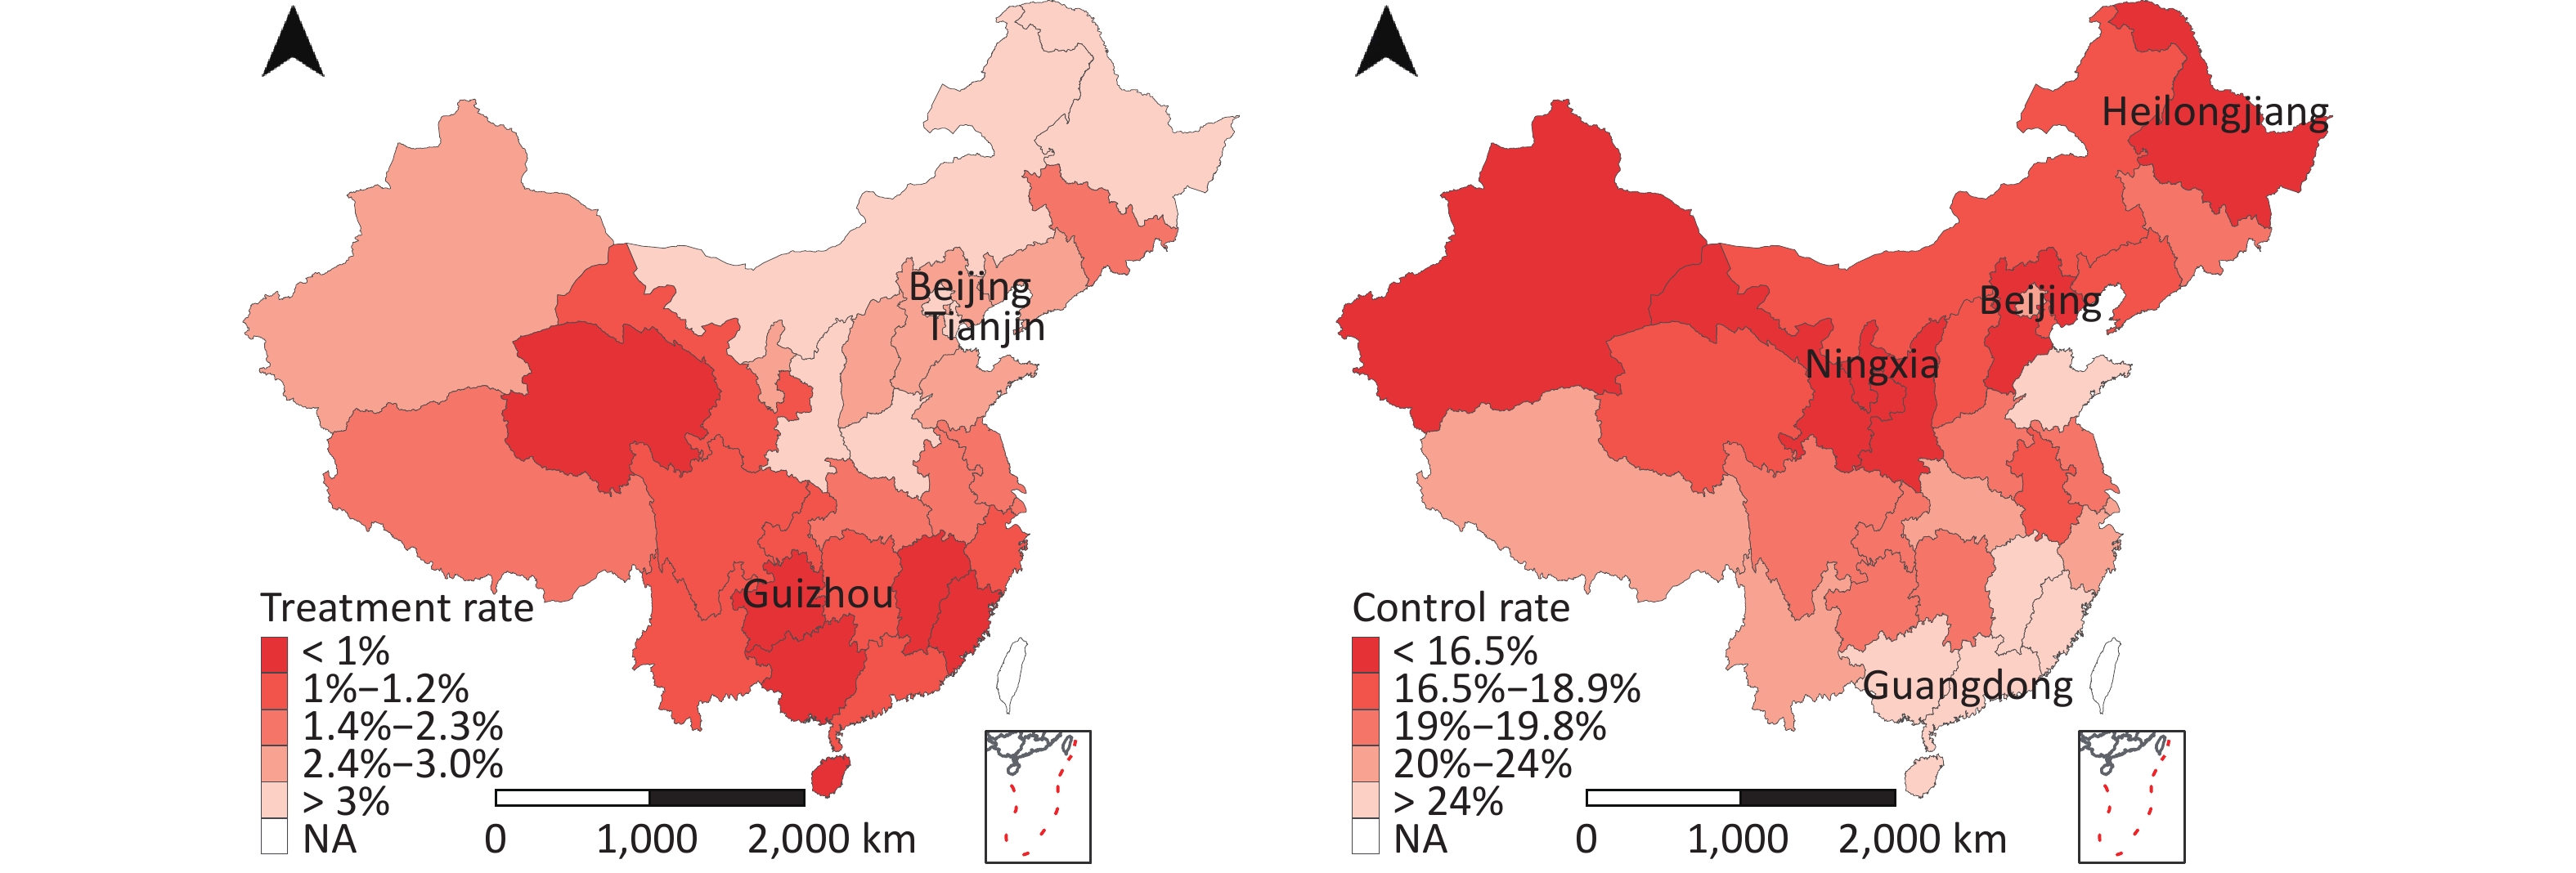
The standardized treatment rates and dyslipidemia control by province are illustrated in Figure 3. Provinces to the south of the Yangtze River have lower treatment rates of dyslipidemia, while provinces in the northern part of China have lower control rates. Guizhou and Guangdong were reported to have the lowest treatment rates (0.4%, 95% CI: 0.2%–0.7%) and dyslipidemia control (9.5, 95% CI: 8.5%–10.7%), respectively, whereas the highest rates were illustrated in Beijing (treatment: 6.6%, 95% CI: 5.4%–8.0%) and Heilongjiang (control: 27.9%, 95% CI: 21.9.1%–34.7%).
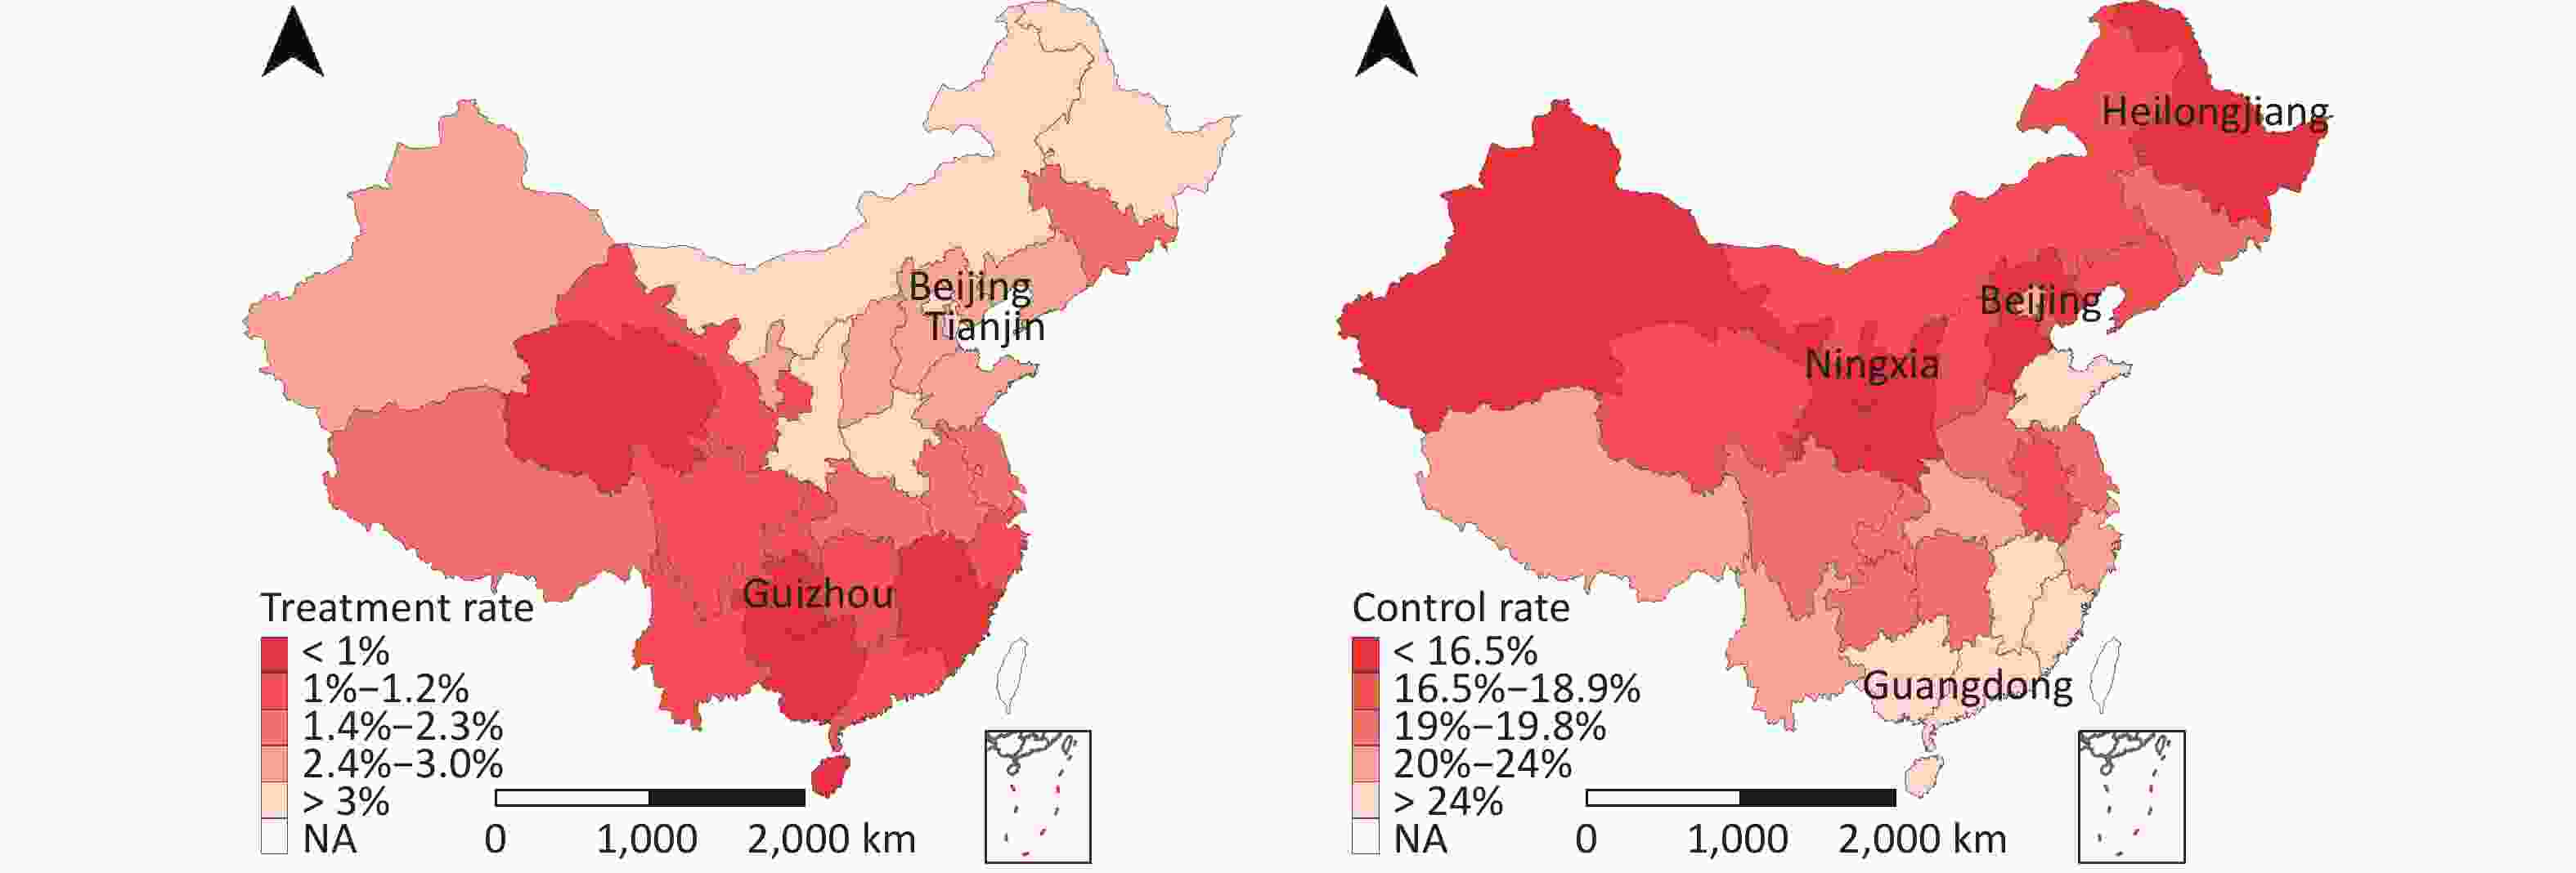
Figure 3. Geographic distribution of treatment and control rates
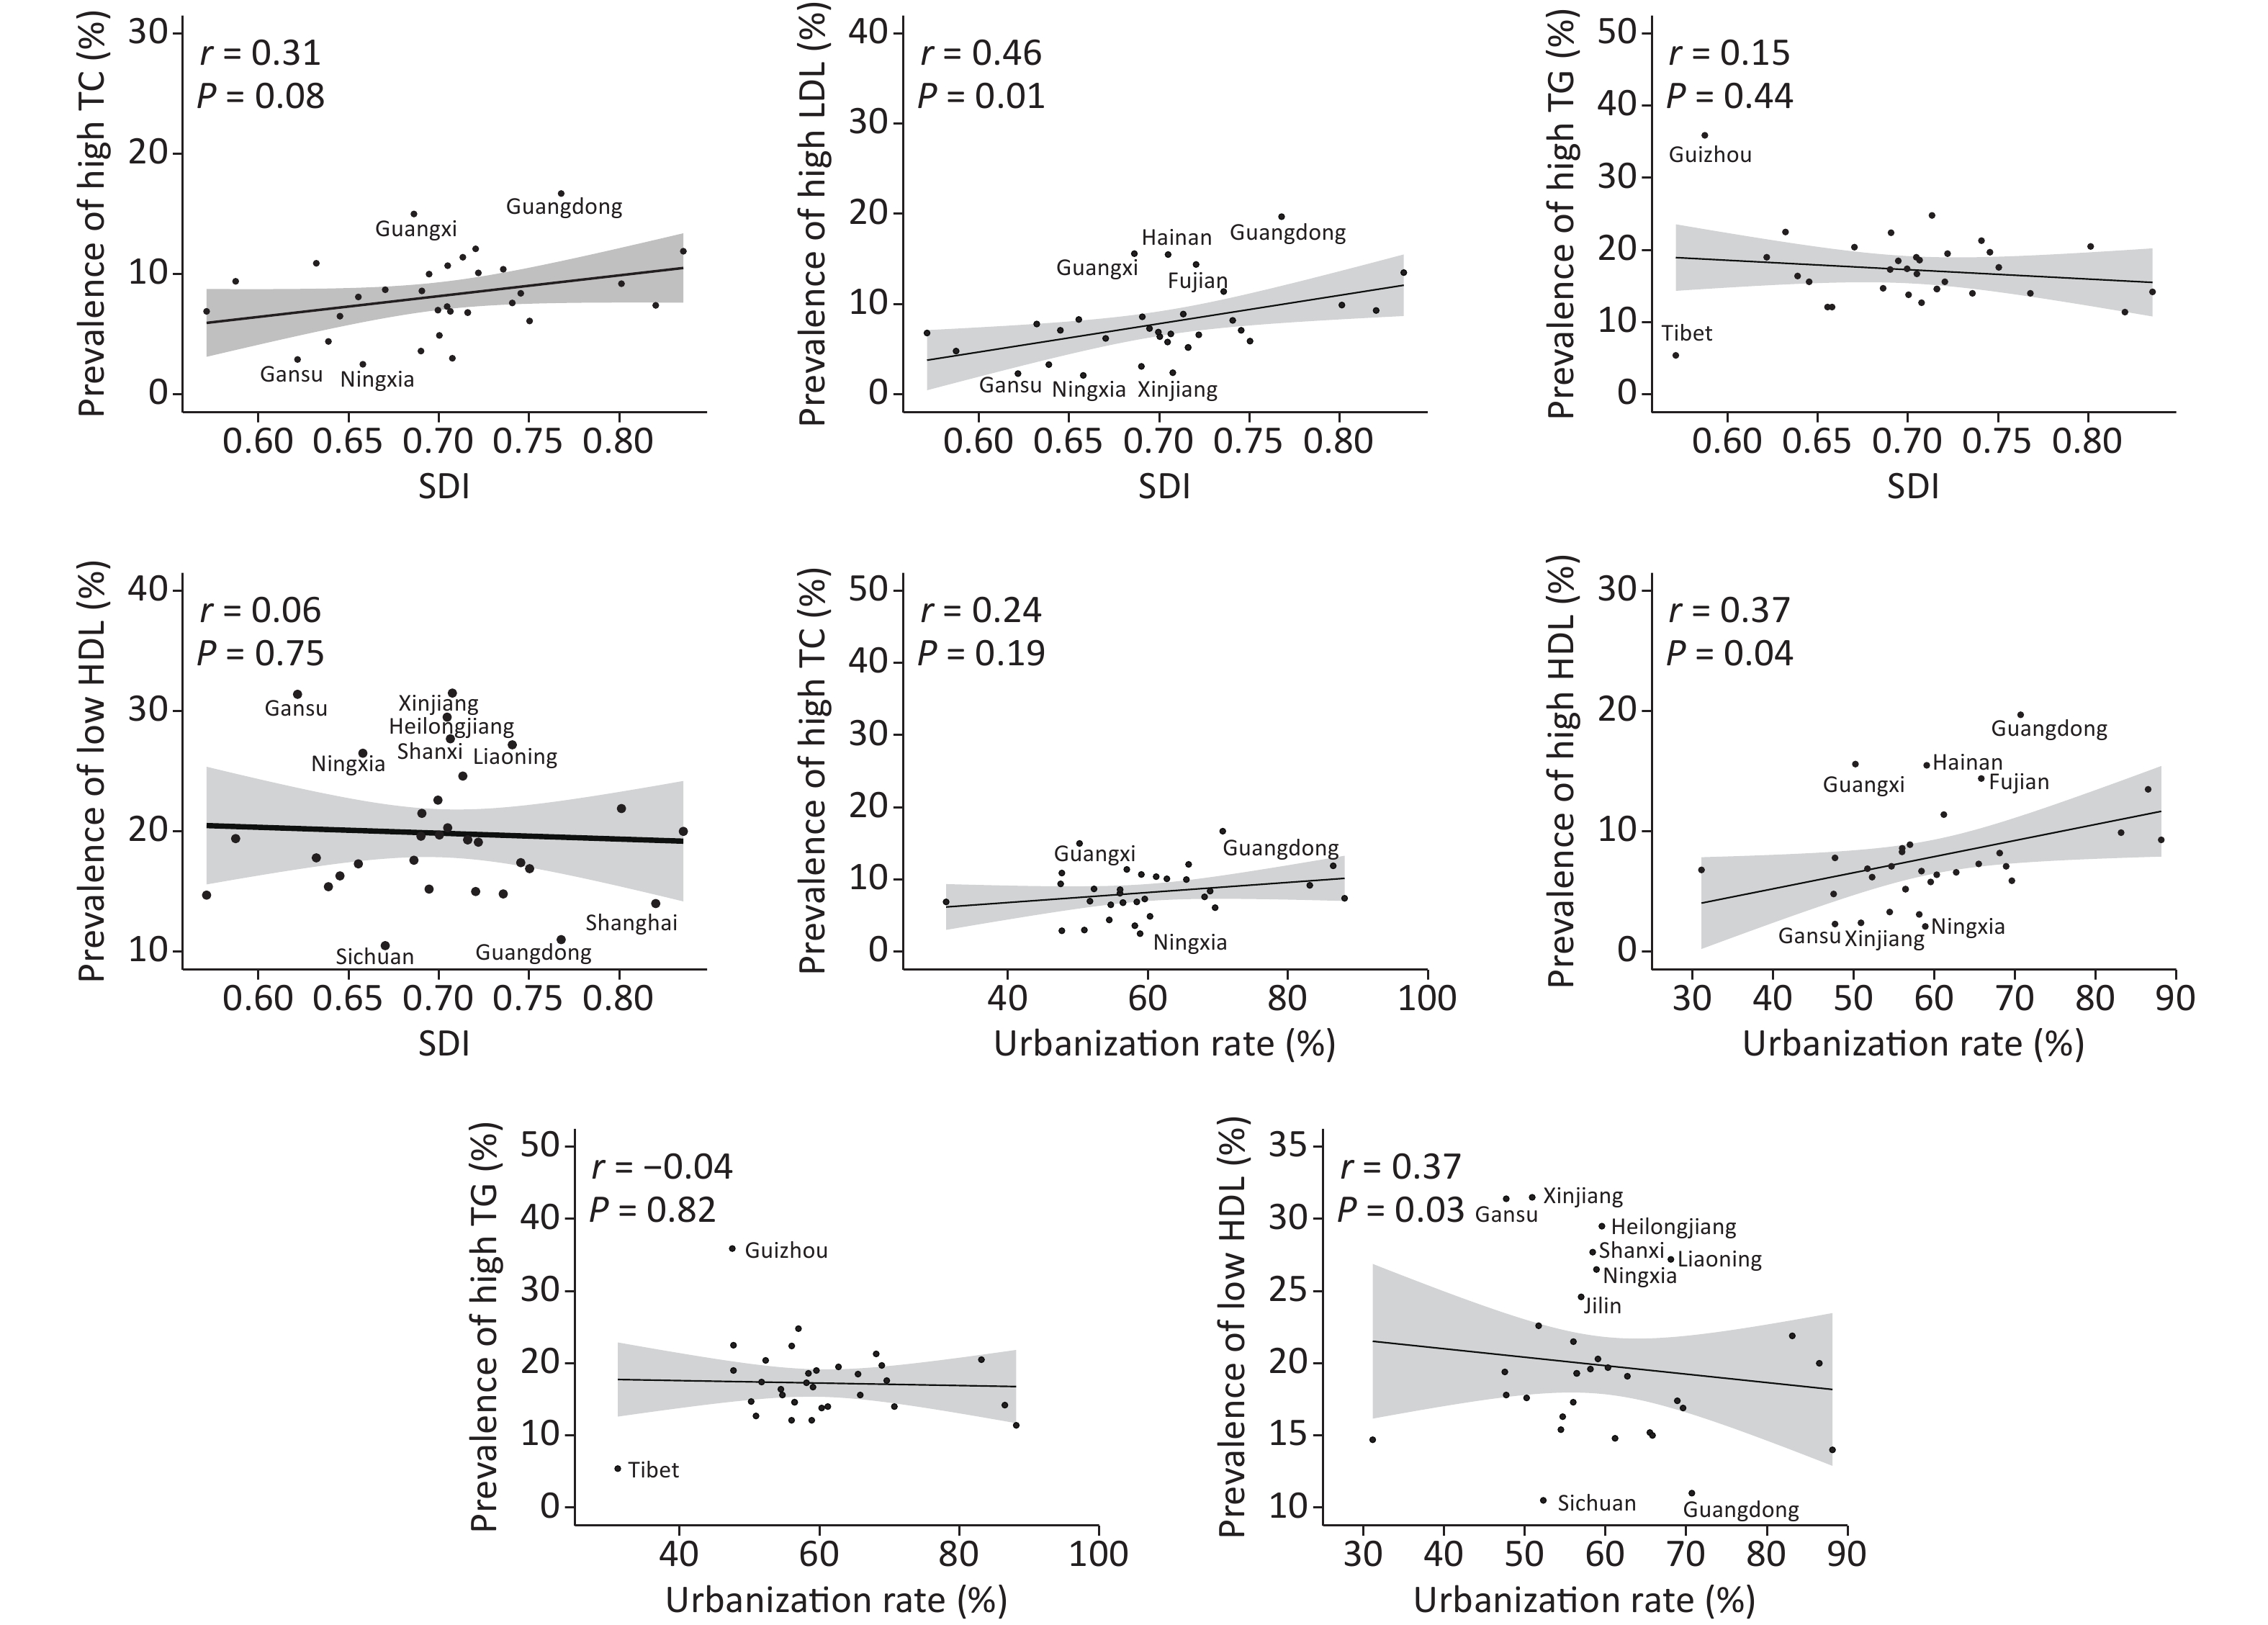
The prevalence rate of high LDL-C was correlated with SDI (r = 0.46, P = 0.01) and urbanization rate (r = 0.37, P = 0.04) (Figure 4). The treatment rate of dyslipidemia was correlated with SDI (r = 0.56, P < 0.001), urbanization rate (r = 0.45, P = 0.01), and ABTEM (r = 0.54, P < 0.001) (Figure 5). Supplementary Table S1, (available in www.besjournal.com).
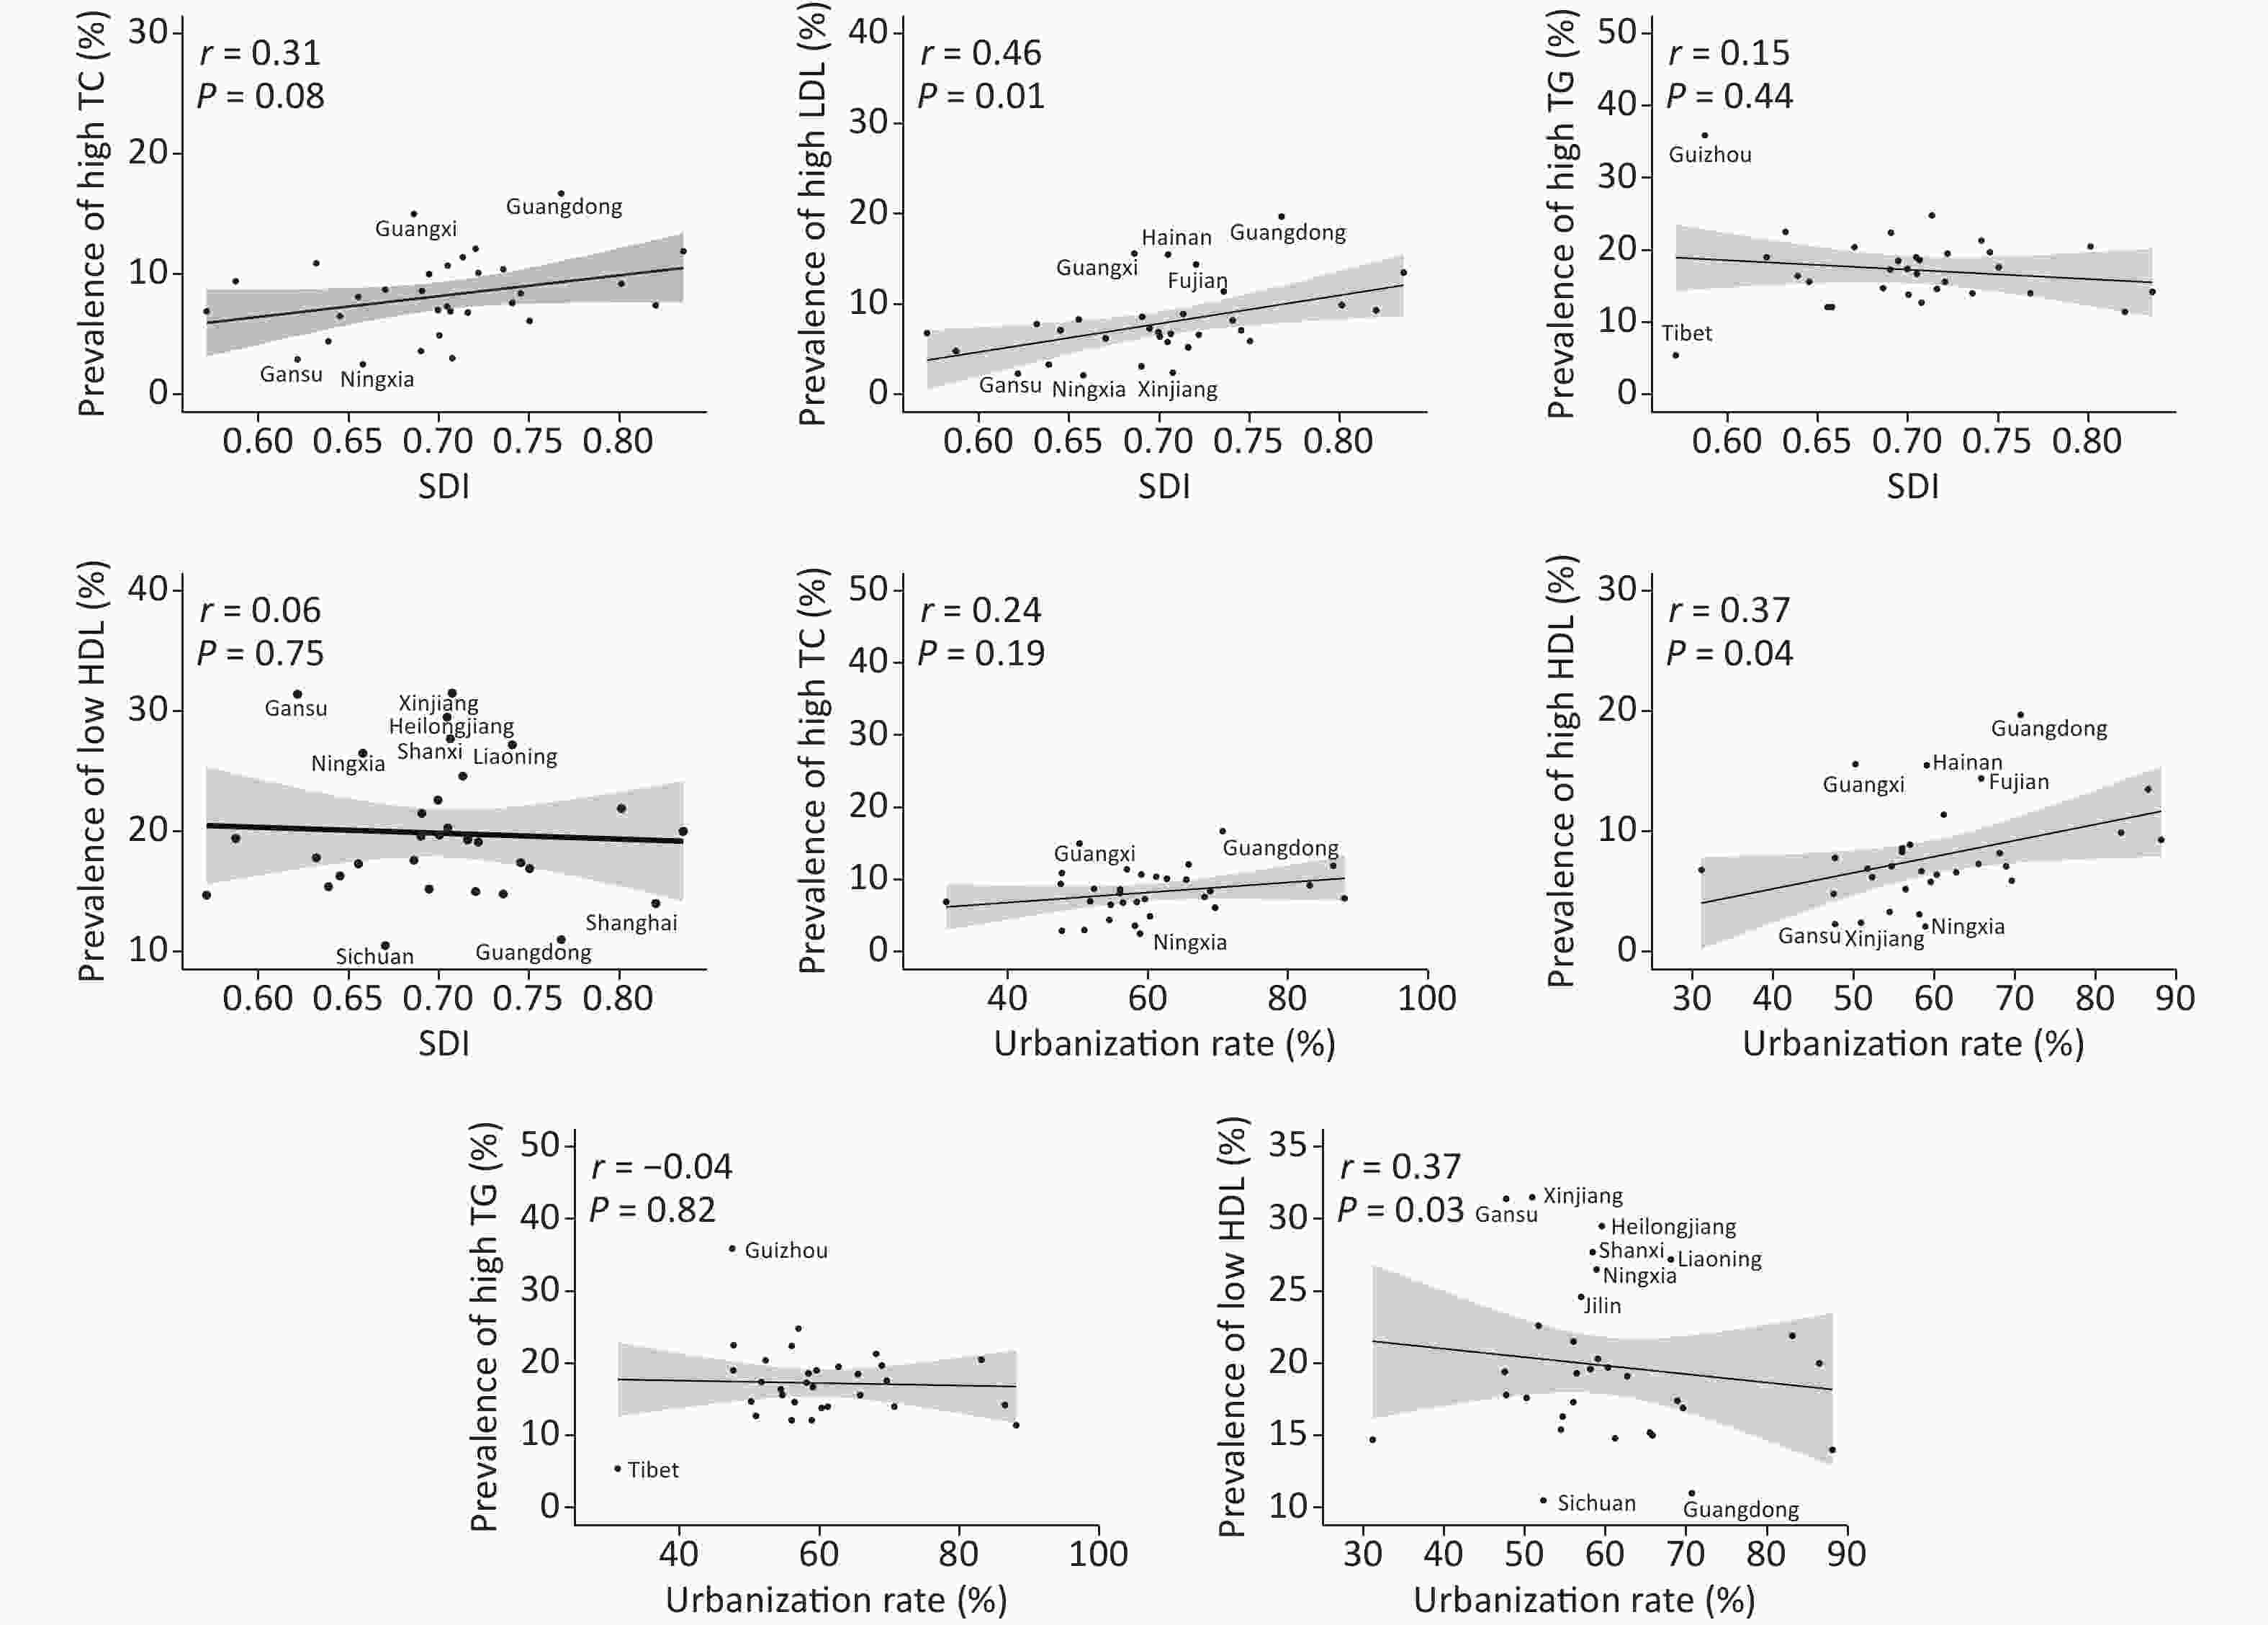
Figure 4. Correlations between lipid abnormalities and SDI and urbanization rate. TC, high total cholesterol; LDL, low-density lipoprotein; TG, high triglycerides; HDL, high-density lipoprotein; SDI, socio-demographic index
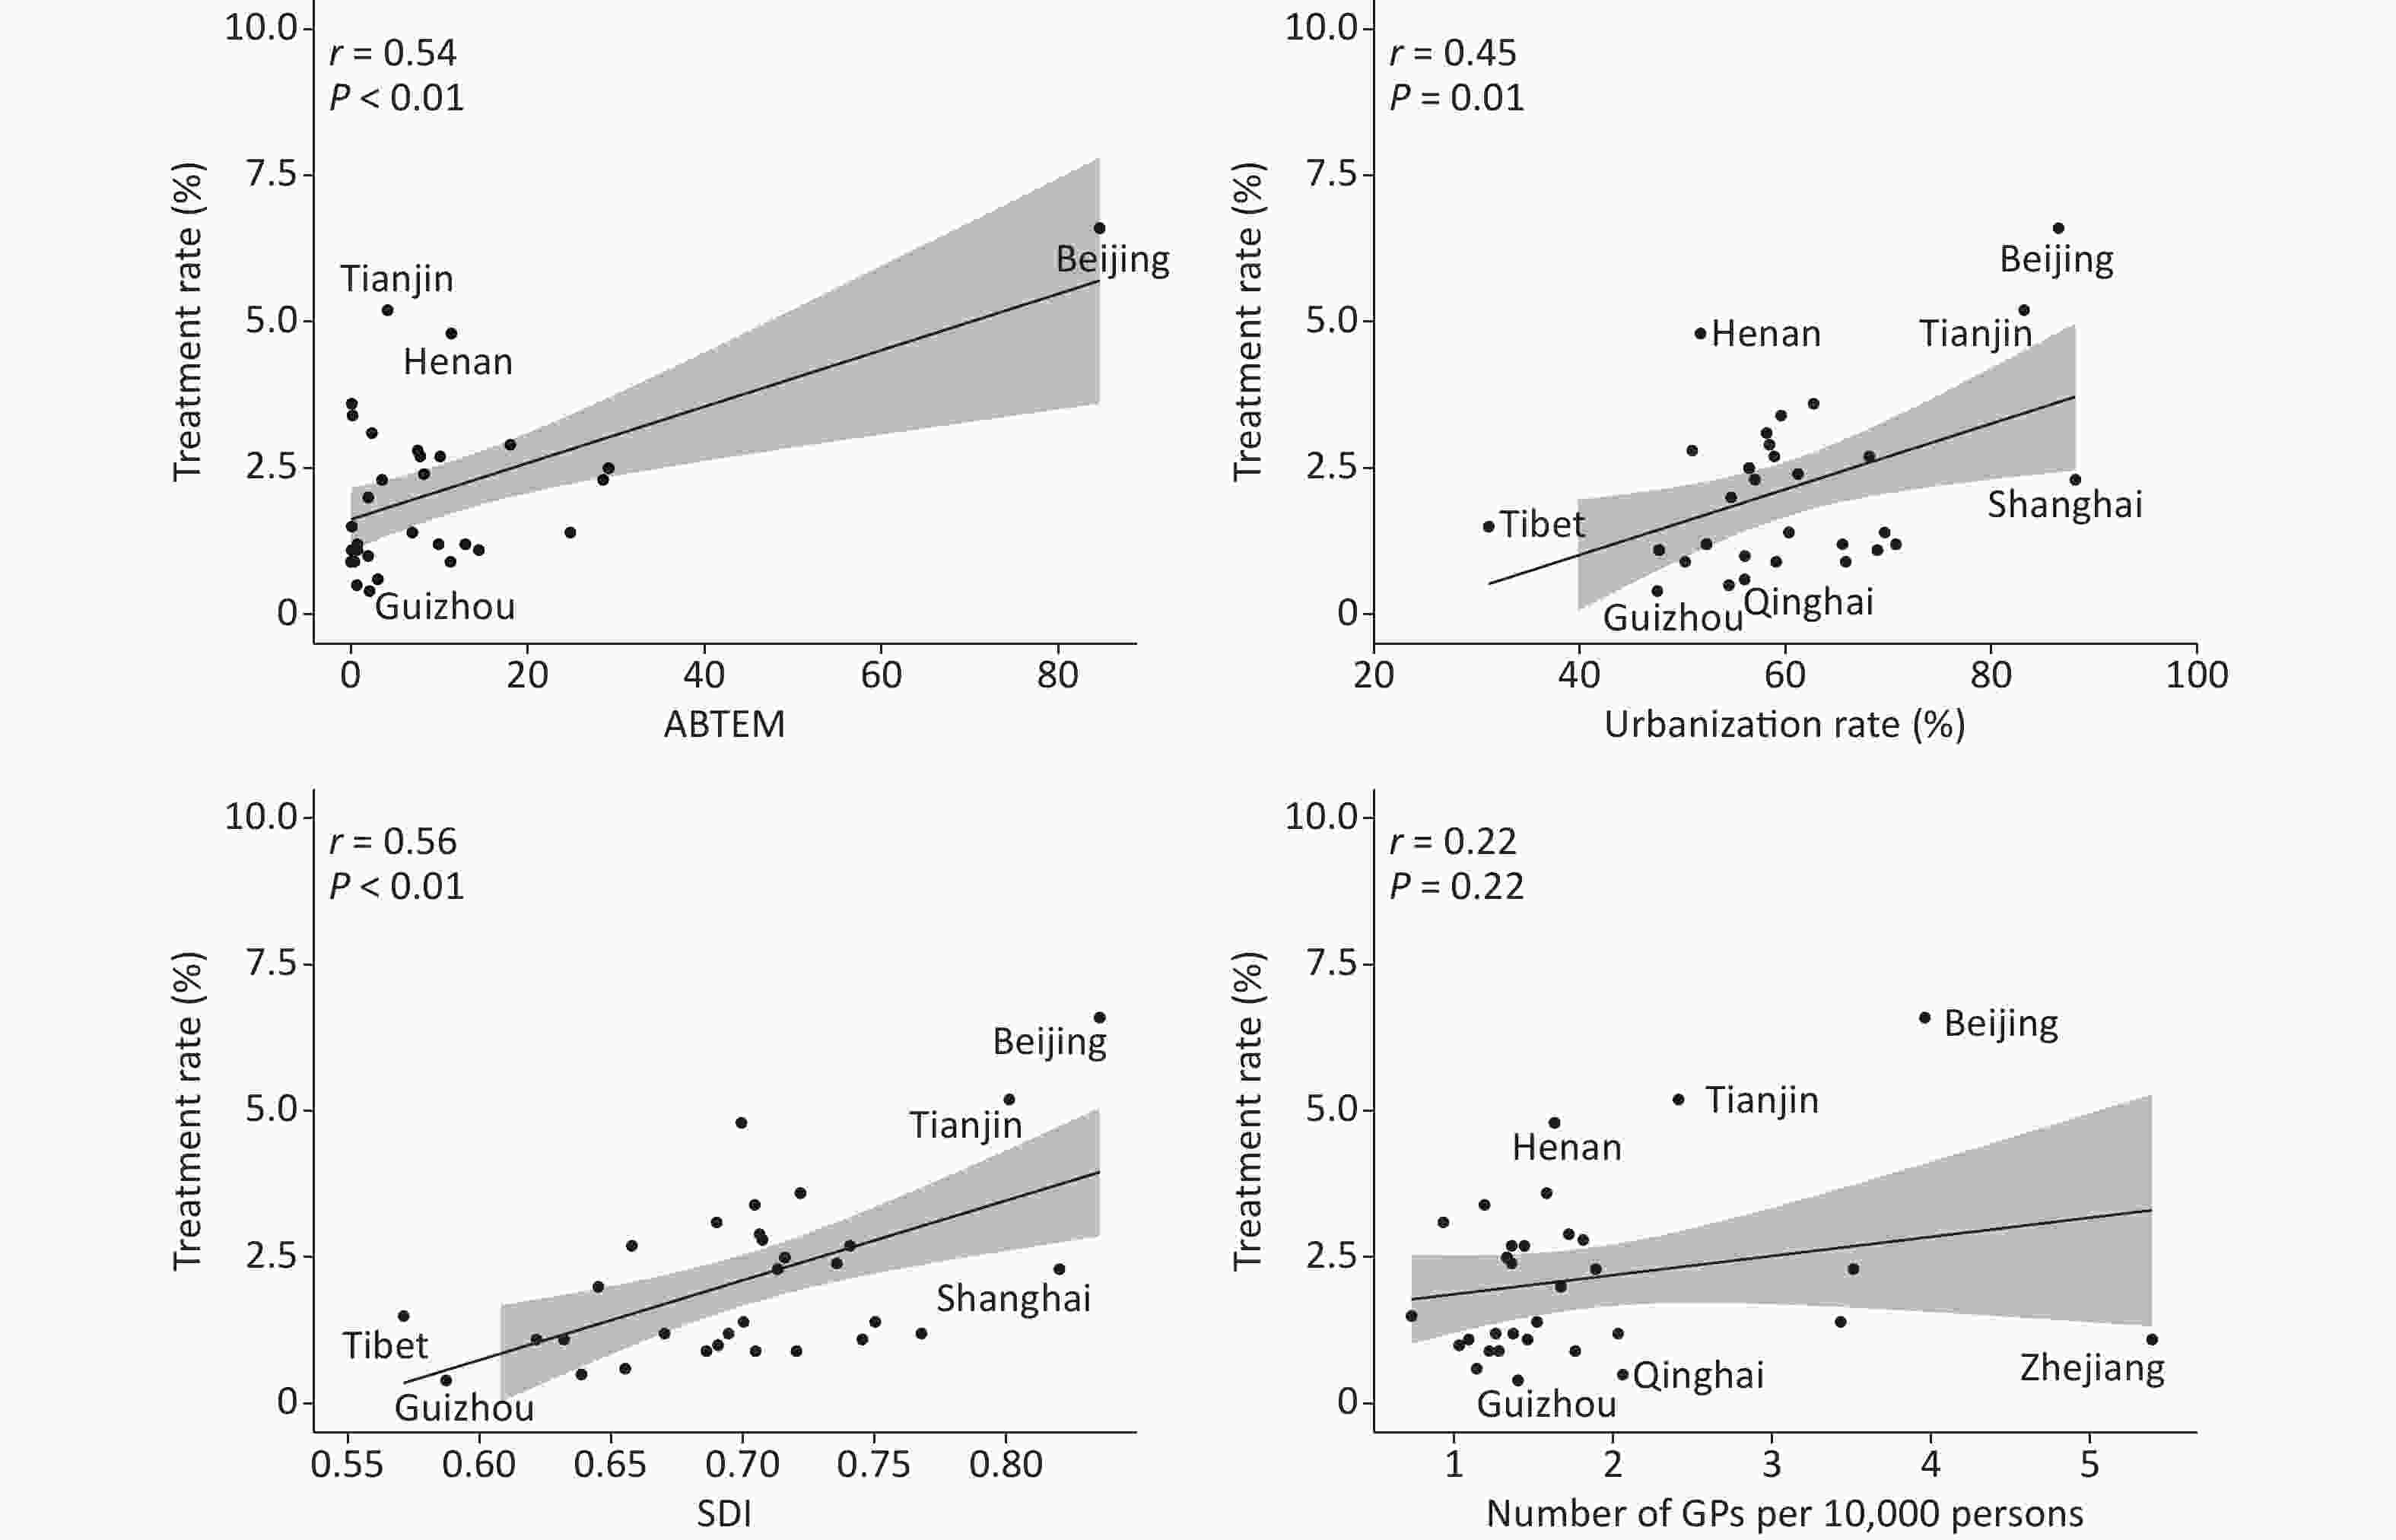
Figure 5. Correlations between dyslipidemia treatment and economic level and accessibility to healthcare. ABTEM, affordable basic technologies and essential medicines; SDI, socio-demographic index; GPs, general practitioners
Regions Urbanization rate SDI Affordable basic technologies
and essential medicinesNumber of general practitioners
per 10,000 peopleBeijing 86.5 0.8354 84.66 3.96 Tianjin 83.15 0.8011 4.13 2.41 Hebei 56.43 0.7159 29.13 1.33 Shanxi 58.41 0.7063 18.02 1.72 Inner Mongolia 62.71 0.7218 0.08 1.58 Liaoning 68.1 0.7406 10.08 1.44 Jilin 56.98 0.7132 3.5 1.89 Heilongjiang 59.55 0.7045 0.17 1.19 Shanghai 88.13 0.8201 28.51 3.51 Jiangsu 69.61 0.7502 24.8 3.43 Zhejiang 68.9 0.7453 14.46 5.39 Anhui 54.69 0.6451 1.95 1.67 Fujian 65.82 0.7203 0.38 1.76 Jiangxi 56 0.6553 3.03 1.14 Shandong 61.18 0.7356 8.25 1.36 Henan 51.71 0.6994 11.34 1.63 Hubei 60.3 0.7002 6.93 1.52 Hunan 56.02 0.6905 1.93 1.03 Guangdong 70.7 0.7677 9.9 2.03 Guangxi 50.22 0.6861 11.24 1.28 Hainan 59.06 0.7048 0 1.22 Chongqing 65.5 0.6945 0.72 1.26 Sichuan 52.29 0.6702 12.92 1.37 Guizhou 47.52 0.5873 2.09 1.4 Yunnan 47.69 0.632 0.07 1.09 Tibet 31.14 0.5712 0.08 0.73 Shaanxi 58.13 0.69 2.35 0.93 Gansu 47.69 0.6216 0.72 1.46 Qinghai 54.47 0.6387 0.65 2.06 Ningxia 58.88 0.6578 7.84 1.36 Xinjiang 50.91 0.7074 7.55 1.81 Table S1. Urbanization rates, SDI, affordable basic technologies and essential medicines and number of general practitioners per 10,000 people by regions
-
Our study presents more recent and up-to-date data on the prevalence, treatment, and control rates of dyslipidemia in China based on a comprehensive, nationally representative survey. The prevalence of dyslipidemia remains high among Chinese adults, with a significant geographic variation. The treatment and control rates of dyslipidemia were universally low in China, and the treatment rate was significantly correlated with the regional economic and primary healthcare conditions. Study findings provide useful information to underline the needs of each province to develop and implement population-based prevention and control strategies that are more appropriate for its status quo of lipid management.
-
The geographic variation of the prevalence of dyslipidemia identified in this study may be attributed, in part, to differences in the distribution of proven risk factors[17], including obesity/overweight[18], dietary behavior[19, 20], lifestyle[21], socioeconomic status, and medical conditions such as hypertension[22] and diabetes[23]. Health behaviors were generally associated with health factors, including blood pressure, fasting glucose, and lipid levels. Geographic variations of health behavior knowledge and awareness associated with CVD prevention were identified in China[24, 25]. Moreover, lipid-lowering drugs remained inaccessible to patients living in these areas due to the less developed health system in low-income settings in China. Our study revealed generally high overall prevalence rates of dyslipidemia in the southwest and northwest of China. A similar geographic distribution of high TC and high LDL-C was identified, which was more common in the coastal provinces, especially in Southern China. Low HDL-C have a higher prevalence rate in the northeast and northwest of China, while high TG was more common in southwest and northeast. A “Hammer-shaped” distribution of a high prevalence rate of dyslipidemia and low HDL-C was reported[8]. The head of Hammer, North China, had the highest prevalence rates of dyslipidemia and low HDL-C. The highest prevalence of high LDL-C was reported in the northwest, and high TC was a more common type of dyslipidemia in the southeast of China. The CHARLS study recruited people aged ≥ 45 years, but our study involved people with a broader age range (aged ≥ 18 years) which could be the main reason for the difference in the geographic variation. Furthermore, our study calculated the prevalence at the provincial level whereas the CHARLS study calculated the prevalence at regional level, including East, North Northeast, Northwest, South Central, and Southwest China, geographically. Additionally, the baseline data of CHARLS was solicited in 2011; however, our study used up-to-date data collected in 2018.
A vast spatial disparity regarding lipid levels and treatment and control rates was found in China. The highest prevalence rates of high LDL-C (19.7%) and high TC (16.7%) were found in Guangdong, which was eight and six times higher than the lowest rate reported in Ningxia (high LDL-C: 2.1%, high TC: 2.5%), respectively. The highest prevalence rate of high TG was found in Guizhou (35.9%), which was six times higher than the lowest rate reported in Tibet (5.4%). The highest prevalence rate of low HDL-C was found in Gansu (31.4%), which was two times higher than the lowest rate reported in Sichuan (10.5%). The main reason contributing to the discrepancy in lipid abnormality prevalence might be the diet and lifestyle differences between each region[19] and is attributed to the unbalanced health resource allocation across China[26, 27].
The present study reported universally low dyslipidemia treatment and control rates across 31 provinces in China. The present study revealed a treatment rate of < 3% in 25 of 31 provinces in China, of which 23 have a control rate of < 20%. The United States National Health and Nutrition Examination Survey reported 54.1% and 35.7% treatment and control rates of dyslipidemia, respectively, among American adults in 2012[12]. A significant health literacy gap regarding dyslipidemia between China and the United States (other developed countries as well) exists, although the definition of treatment and control in these two studies was slightly different [12, 28]. Additionally, a statistically significant declining trend in LDL levels, which is the lipid-lowering therapy target, has been observed from 1998 to 2010 in the United States. It could be explained by the significantly increasing trend in the percentage of adults taking lipid-lowering medications. Similarly, in Denmark, a dramatic increase in statin use rate has been observed from 2000 to 2015, and the total cost of lipid-lowering therapy decreased due to the reduction of statin cost since 2002. Improving lipid management in the primary care setting, which is an important measure to prevent coronary heart disease in China, is important because the prevalence rate of dyslipidemia in China is still increasing. Therefore, more health education should be applied to the general population, and physicians need more training on dyslipidemia guidelines, diagnosis, and treatment.
Significant geographic discrepancies in treatment and control rates of dyslipidemia were illustrated by generating the corresponding maps across Chinese provinces based on the data presented in our study. Notably, Guizhou province had the lowest treatment (0.4%), and Guangdong province had the lowest control (9.5%) rates of dyslipidemia which were 16 and 2 times lower compared to the highest treatment and control rates reported in Beijing and Heilongjiang (6.6% and 27.9%), respectively. Maldistribution of socioeconomic levels could be a major contributor to geographic discrepancies in treatment and control rates. Previous studies have revealed that poor health literacy was associated with low socioeconomic status and poor access to health care, similar to our study[29, 30]. The current study confirmed such a relationship and revealed a linear association between treatment levels of dyslipidemia and social demographic index and urbanization rate in the Chinese population. Substantial inter-province differences regarding economic development, health service quality, and health literacy of the general population might be the potential drivers for varying dyslipidemia management across provinces. Understanding the gaps and their causes could help those provinces with poorer management to better tailor and implement population-based strategies that are appropriate for the status quo of lipid management. Additionally, the treatment rate of dyslipidemia was correlated with ABTEM availability, which was deemed an important indicator of chronic disease management capacity in primary care settings. Moreover, unbalanced health service quality might result in different lipid management outcomes. Low job satisfaction and high occupation burnout were reported among physicians in primary care settings[31, 32] due to unsatisfied job rewards, working environment, and organization management[33, 34]. The Chinese government has pledged a strong government role in health and made great efforts to improve chronic disease management in the last two decades, such as increasing financial investment, facilities, general practitioners, and chronic disease activities[35], but low implementation and maintenance levels of evidence-based practice were suggested as other important barriers to integrating evidence into chronic disease management at the primary care level[36]. Expectedly, control and treatment rates gradually increased with higher economic levels, and lipid abnormality management among those people in higher economic levels was not well achieved compared to other developed settings. Therefore, the change in such low health literacy may be related to certain protocol and policy development that improves the accessibility, delivery, and quality of primary health care in all settings in China. Meanwhile, more attention should be paid to the training of physicians in primary care settings and to increase the ABTEM in the less developed areas. Therefore, more interactive communications between regions are encouraged to even the geographic discrepancy of lipid management.
-
To our best knowledge, this randomized sampling study is the first nationwide and provincial representative investigation of the geographic variation of dyslipidemia in China. All measurements in this survey have passed a standardization and certificating program besides the large sample size. However, this cross-sectional study identified the correlations between prevalence, treatment and control rates, economic level, and healthcare accessibility at the provincial level; thus, the causal effect at the individual level could not be concluded. Further, participants recruited in the present study were non-institutionalized populations which slightly decreased the presentative of the sample. Therefore, future studies are necessary to investigate causal relationships among lipid profiles, health literacy and socioeconomic indicator, and primary care levels with adjustment to the possible confounders.
-
In conclusion, this study is an innovative national investigation of the provincial geographic variation of the prevalence and management of dyslipidemia in China. Our findings suggest that China must adopt a national strategy to illuminate the common impediments to dyslipidemia management and control, and government policies and services should be more focused on the less developed regions to even the health inequities, which could be helpful for the significant geographic variation to improve the management of dyslipidemia in China. We recommend the development and implementation of interventions focusing on training and educating both patients with lipid abnormalities and general practitioners in primary care settings to improve dyslipidemia management in China.
HTML
Design and Setting
Participants
Data Collection and Measurement
Statistical Analyses
Role of the Funding Source
Summary of Findings
Comparison with Literature
Strengths and Limitations
 22273Supplementary Materials.pdf
|

|

 Quick Links
 DownLoad: