


-
Coronary artery disease (CAD) is a major cause of death and disability in developed countries. Although CAD mortality rates have declined over the past four decades, it still accounts for one-third or more of all deaths in individuals over the age of 35 years old[1-3]. Percutaneous coronary intervention (PCI) is commonly performed to relieve ischemic symptoms in CAD patients, whereas low-density lipoprotein cholesterol (LDL-C) plays a crucial role in the pathogenesis and perpetuation of atherosclerotic cardiovascular disease (CVD)[4-8].
Rigorous lipid-lowering goals have become a target of growing concern within the medical community. According to the 2021 European Society of Cardiology guidelines, LDL-C < 1.8 mmol/L (70 mg/dL) is recommended for patients with high-risk factors, such as acute coronary syndrome (ACS), CAD, carotid or peripheral vascular disease, or secondary prevention[9-11]. To date, the importance of the magnitude of LDL-C reduction, rather than an exact LDL-C target, has been emphasized internationally and in America in particular[12]. In China, the recommended treatment target for LDL-C is 2.6 mmol/L for patients at high risk and 1.8 mmol/L for those at very high risk[13]. Mendelian randomization analysis demonstrated that lifelong, very low LDL-C is associated with a considerably low risk of CVD[7]. From a pathophysiologic point of view, the decreased LDL-C levels significantly attenuate plaque-volume progression, which delays CAD progress[14]. Furthermore, the authors of large-scale lipid-lowering trials have shown that statins can reduce recurrent ischemic coronary events in patients with hypercholesterolemia and in those with normal cholesterol levels[15-17]. However, despite following optimal lipid-lowering treatments, many patients still experience one or more adverse events.
In recent years, an increasing number of studies have reported that spontaneous low-admission LDL-C levels were correlated with the poor prognosis of CAD patients, which is called the “cholesterol paradox”[18, 19]. Specifically, the “LDL cholesterol paradox” can be explained as a reduction in cardiovascular risk associated with a decrease in LDL-C levels[20]. In other words, high baseline LDL-C levels are associated with favorable clinical outcomes following PCI[21]. Researchers also found the association of hypercholesterolemia with desirable clinical outcomes of ACS[22]. Although the “cholesterol paradox” is explored extensively abroad, a few reports on Chinese populations have been published, and the effects of baseline LDL-C on clinical outcomes following PCI remain controversial. A large Chinese cohort study demonstrated that for patients with STEMI, the cholesterol paradox does not hold exactly true in terms of in-hospital mortality because of the nutritional situation[23]. Another large clinical study in China reported that the cholesterol paradox existed in Chinese patients with CAD when the nutritional assessment was incorporated into the analysis; however, this study analyzed only one endpoint: long-term all-cause mortality[24]. Evidence suggesting that a low LDL-C indicates a low risk of multiple adverse clinical outcomes, especially in the Chinese population, remains lacking.
Therefore, this study aimed to comprehensively examine the relationship between baseline LDL-C and multiple adverse clinical outcomes for patients undergoing first PCI and to further explore whether the “cholesterol paradox” exists in the Chinese population.
-
This research is a retrospective, single-center, observational cohort study conducted to assess the relationship between baseline LDL-C and long-term outcomes in CAD patients following their first PCI. The data were collected from cardiac catheterization laboratories of Sir Run Run Shaw Hospital (Zhejiang, China). Figure 1 shows the process of the present study.

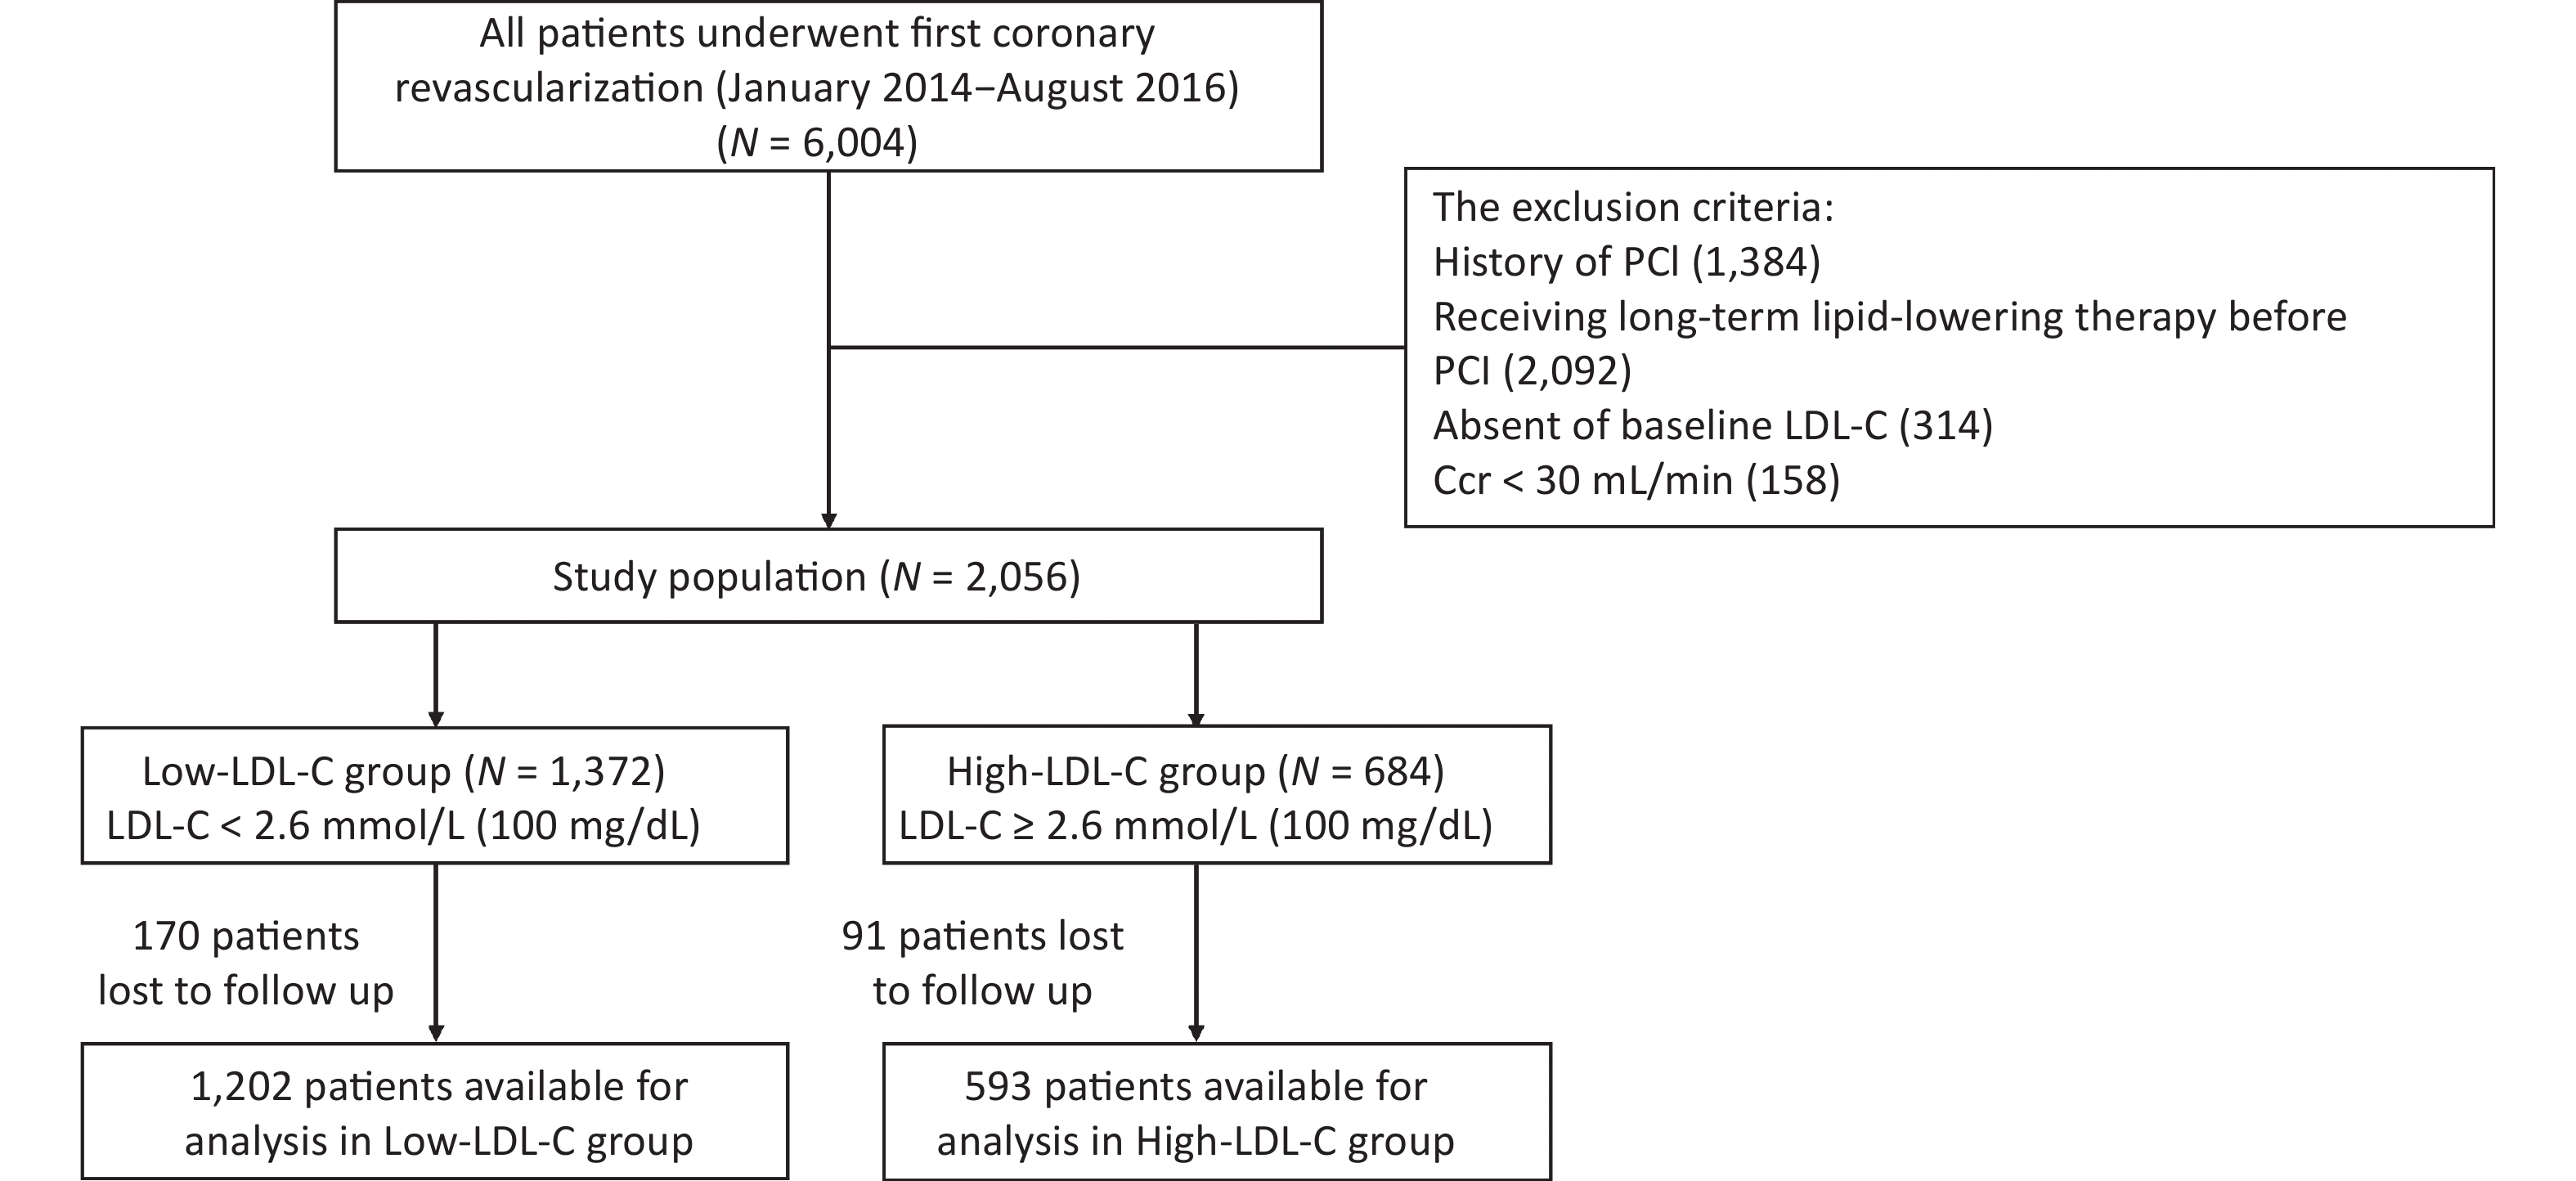
Figure 1. Patient flow chart. PCI, percutaneous coronary intervention; Ccr, creatinine clearance rate
Patients who had undergone their first PCI were eligible for the study. Patients were excluded from participating if they: i) had a history of PCI; ii) were receiving long-term lipid-lowering therapy before PCI (> 8 weeks of lipid-lowering therapy); iii) demonstrated an absence of baseline LDL-C; iv) had a creatinine clearance of less than 30 mL/min.
Between January 2014 and August 2016, a total of 6,004 patients in the Sir Run Run Shaw Hospital underwent their first PCI. Of these patients, 2,056 were enrolled in the study. All patients were treated with statins with or without ezetimibe and with fibrates during administration or upon discharge. Blood samples for baseline information were collected 24 h before PCI. All participants were categorized into two groups based on LDL-C = 2.6 mmol/L (100 mg/dL), with the target LDL-C level being less than 1.8 mmol/L (70 mg/dL)[9, 10]. Patients had follow-up visits at 1, 6, 9, and 12 months and every 6 months thereafter. All patients were followed-up in an outpatient clinic or by a telephone interview.
-
The primary endpoint was a major adverse cardiac event (MACE), defined as a composite of all-cause mortality, recurrent nonfatal myocardial infarction (MI), unexpected coronary revascularization (occurring at least 30 days following PCI), or any nonfatal stroke during follow-up, as assessed from the beginning of follow-up until the first occurrence of one of these events. Based on the codes of the International Classification of Diseases, Tenth Revision (ICD-10), all-cause mortality was defined as death due to any cause (ICD-10 codes A00-Y98)[25]. MI was defined as an elevation of cardiac biomarkers (troponin T, troponin I, or creatine kinase-MB) and specific changes in the electrocardiogram or symptoms in accordance with the third universal MI definition[26]. Revascularization was defined as a repeat PCI or coronary artery bypass graft surgery following the index procedure. A nonfatal stroke involves nonfatal cerebral infarction, intracerebral hemorrhage, and unspecified stroke[27].
Secondary endpoints were a composite of cardiac death, MI, or unexpected revascularization; a composite of cardiac death or MI; a composite of any nonfatal stroke, and individual components of MACE, including all-cause mortality, MI, ischemic stroke, hemorrhagic stroke, and revascularization.
Medications were prescribed during hospitalization and following discharge. Coronary artery angiography and PCI were performed following standard methods, and decisions about detailed treatment were left to the physician’s discretion.
-
All data were analyzed using SPSS version 22.0 (SPSS Institute Inc. Cary, North Carolina). Non-parametric Mann–Whitney U test was used to test the variables. Survival curves were estimated using the Kaplan–Meier method and compared with the log-rank test. Multivariate analysis was performed to reduce the potential bias. Propensity score-matching analysis was also carried out as a sensitivity analysis. All tests were two-tailed, and P < 0.05 represented significance.
To evaluate the independent effect of baseline LDL-C level on clinical outcomes, we conducted the multivariable-adjusted Cox proportional hazard model analysis. Covariates were significant in univariate analysis or clinically relevant. The covariates included in the model were age, sex, hypertension, smoking status, ACS, estimated glomerular filtration rate (eGFR), left anterior descending artery, left circumflex, right coronary artery, stent length, primary PCI, coronary calcification, clopidogrel, warfarin, statin, fibrates, ezetimibe, and LDL-C level during follow-up.
Propensity scores were estimated using a logistic-regression analysis which included covariates, such as age, sex, hypertension, ACS, eGFR, left circumflex (culprit vessel), primary PCI, ezetimibe, beta-blocker, triglyceride, and high-density lipoprotein cholesterol. A 1:1 matching was carried out with the greedy algorithm, and the nearest neighbor method was used for patients with an individual propensity score. In the matched population, the current study used a multivariable-adjusted Cox proportional hazard model analysis. The covariates included in this model were triglyceride, ACS, multivessel coronary disease, left anterior descending, right coronary artery, stent length, statin, fibrates, ezetimibe, and LDL-C levels during follow-up.
-
A total of 2,056 patients who underwent PCI between 2014 and 2016 were included. Of these, 261 were lost to follow-up, and 1,795 were analyzed (Figure 1). The low- and high-LDL-C groups included 1,202 (LDL-C < 2.6 mmol/L) and 593 patients (LDL-C ≥ 2.6 mmol/L), respectively. The median follow-up was 20.2 months (range = 9–39.6 months).
Table 1 and Supplementary Tables S1–S3 (available in www.besjournal.com) provide the baseline clinical characteristics and angiographic findings. The patients had a mean age of 64.9 ± 10.6 years, 72.4% were men, and 22.3% had diabetes mellitus. Overall, participants in the high-LDL-C group had higher risk factors. Compared with the low-LDL-C group, the high-LDL-C group had a higher prevalence of previous ACS and left circumflex culprit vessel but a lower prevalence of elderly, hypertension, chronic kidney disease, and primary PCI. Ezetimibes were more frequently used in the high-LDL-C group.
Variables
n (%)Overall population Propensity-matched population Low-LDL-C
(n = 1,202)High-LDL-C
(n = 593)P value Low-LDL-C
(n = 443)High-LDL-C
(n = 443)P value Age (yrs) 66.3 ± 10.5 63.0 ± 10.2 < 0.001* 62.3 ± 10.5 63.7 ± 10.5 0.996 Male 909/1,200 (75.8) 390/590 (66.1) < 0.001* 297/443 (67.0) 307/443 (69.3) 0.471 Body-mass index 24.6 ± 3.4 24.9 ± 3.5 0.208 25.6 ± 3.2 24.6 ± 3.0 0.326 Diabetes 272/1,176 (23.1) 129/585 (22.1) 0.661 98/443 (22.1) 98/443 (22.1) 1.000 Hypertension 781/1,175 (66.5) 346/585 (59.1) 0.003* 257/443 (58.0) 266/443 (60.0) 0.539 Congestive heart failure 29/1,116 (2.6) 22/555 (4.0) 0.126 10/408 (2.5) 14/409 (3.4) 0.411 ACS 488/1,175 (41.5) 272/580 (46.9) 0.033* 175/443 (39.5) 181/443 (40.9) 0.681 Previous cerebrovascular disease 107/1,176 (9.1) 44/585 (7.5) 0.266 37/443 (8.4) 30/443 (6.8) 0.374 Current smoker 337/1,174 (28.7) 186/583 (31.9) 0.167 119/443 (26.9) 134/442 (30.3) 0.255 Current alcohol consumption 241/1,173 (20.5) 133/582 (22.9) 0.267 87/442 (19.7) 105/442 (23.8) 0.142 Note. Values are mean ± SD, n (%), or n/N (%). ACS, acute coronary syndrome. *P < 0.05. Table 1. Baseline characteristics-demographic characteristic
Following 1:1 propensity score matching, 886 patients were matched (Table 1). In the propensity-matched population, no significant differences existed in baseline characteristics between the two groups except for triglyceride.
-
Upon admission, the median LDL-C levels were 1.85 in the Low-LDL-C group and 3.15 mmol/L in High-LDL-C group (P < 0.001, Table 2). Among patients whose blood samples were obtained at a median of 20.2 months of follow-up, the median LDL-C levels were 1.46 mmol/L in the low-LDL-C group and 1.89 mmol/L in the high-LDL-C group (P < 0.001, Table 2). During follow-up, reductions in the LDL-C levels were 0.39 mmol/L (21.1%) in the low-LDL-C group and 1.26 mmol/L (40.0%) in the high-LDL-C group. A total of 66.8% of the overall population achieved the target LDL-C level, with 75.9% in the low-LDL-C group and 46.5% in the high-LDL-C group. Following 1:1 propensity score matching, 73.8% of patients in the low-LDL-C and 49.5% in the high-LDL-C group achieved the target LDL-C level.
Variables Overall population Propensity-matched population Low-LDL-C (n = 1,202) High-LDL-C (n = 593) P value Low-LDL-C (n = 443) High-LDL-C (n = 443) P value LDL cholesterol, mmol/L At admission† 1.85 (1.49–2.21) 3.15 (2.73–3.57) < 0.001* 1.84 (1.57–2.12) 3.20 (2.76–3.64) < 0.001* Follow-up† 1.46 (1.14–1.79) 1.89 (1.32–2.46) < 0.001* 1.45 (1.07–1.82) 1.78 (1.15–2.41) < 0.001* Difference 0.39 1.26 0.39 1.42 Reduction (%) 21.1 40 21.2 44.3 P-value < 0.001* < 0.001* < 0.001* < 0.001* Patients reach the treatment LDL-C goal (< 1.8 mmol/L), no./total no (%) 912/1,202 (75.9) 275/591 (46.5) < 0.001* 327/443 (73.8) 219/442 (49.5) < 0.001* Note. †Median (Interquartile range). *P < 0.050. Table 2. LDL-C levels (mmol/L) at admission and follow-up
-
Table 3 shows the clinical outcomes. During follow-up, MACE occurred in 202 patients (11.3%), whereas 20 patients (1.1%) had all-cause mortality, 11 (0.6%) had cardiac death, 2 (0.1%) had MI, 171 (9.5%) had revascularization, 13 (2.2%) had an ischemic stroke, and 2 had a hemorrhagic stroke. Supplementary Figure S1 (available in www.besjournal.com), Figure 2, and Table 2 demonstrate the cumulative incidences of clinical outcomes in the two groups.
Variables Low-LDL-C
(n = 1,202)High-LDL-C
(n = 593)Unadjusted Adjusted 1§ HR (95% CI) P HR (95% CI) P A. Overall population (N = 1,795) Primary end point MACE 126 (13.0) 76 (16.1) 1.202 (0.904−1.598) 0.205 1.009 (0.701−1.452) 0.960 Secondary end points Cardiac death, MI, or revascularization 111 (11.8) 71 (15.2) 1.281 (0.951−1.725) 0.103 1.051 (0.718−1.538) 0.800 Cardiac death or MI 4 (0.4) 9 (1.8) 4.509 (1.388−14.644) 0.012* 10.300 (1.046−101.461) 0.046* All−cause death 8 (0.7) 12 (2.4) 3.019 (1.234−7.387) 0.015* 4.030 (1.088−14.934) 0.037* Cardiac death 3 (0.3) 8 (1.6) 5.347 (1.418−20.156) 0.013* 137.729 (0.845−2.253 × 10⁴) 0.058 MI 1 (0.1) 1 (0.2) 1.984 (0.124−31.727) 0.628 0.279 (0.000−8.350 × 1045) 0.981 Revascularization 108 (11.6) 63 (13.5) 1.158 (0.800−1.580) 0.355 0.975 (0.659−1.443) 0.900 Any nonfatal stroke 12 (1.2) 3 (0.5) 0.498 (0.141−1.765) 0.280 0.712 (0.169−3.001) 0.643 Ischemic stroke 10 (1.0) 3 (0.5) 0.597 (0.164−2.169) 0.433 0.756 (0.172−3.311) 0.710 Hemorrhagic stroke 2 (0.2) 0 (0.0) 0.026 (0.000−5.988 × 10³) 0.563 0.000 (0.000−5.533 × 10237) 0.978 Variables Low-LDL-C
(n = 443)High-LDL-C
(n = 443)Unadjusted Adjusted 2§ HR (95% CI) P HR (95% CI) P B. Propensity-matched population (N = 886) Primary end point MACE 51 (13.9) 52 (15.1) 1.032 (0.702−1.519) 0.872 0.981 (0.656−1.468) 0.926 Secondary end points Cardiac death, MI, or revascularization 46 (12.7) 48 (14.1) 1.061 (0.708−1.590) 0.775 1.015 (0.665−1.548) 0.946 Cardiac death or MI 0 (0) 4 (1.3) 65.957 (0.021−2.050 × 10⁵) 0.045* 3.836 × 107 (0−1.734 × 10132) 0.905 All−cause death 1 (0.2) 7 (2.1) 7.156 (0.880−58.180) 0.031* 6.887 (0.748−63.371) 0.088 Cardiac death 0 (0) 4 (1.3) 65.957 (0.021−2.050 × 10⁵) 0.045* 3.836 × 107 (0−1.734 × 10132) 0.905 MI 0 (0) 0 (0) 0 0 0 0 Revascularization 46 (12.7) 44 (12.8) 0.967 (0.640−1.462) 0.873 0.926 (0.602−1.425) 0.727 Any nonfatal stroke 5 (1.6) 3 (0.7) 0.597 (0.143−2.499) 0.480 0.520 (0.117−2.300) 0.389 Ischemic stroke 5 (1.6) 3 (0.7) 0.597 (0.143−2.499) 0.480 0.520 (0.117−2.300) 0.389 Hemorrhagic stroke 0 (0) 0 (0) 0 0 0 0 Note. Cox regression analyses were performed before and after PSM. §Covariates were adjusted including age, gender, hypertension, current smoker, ACS, eGFR, left anterior descending, left circumflex, right coronary artery, stent length, primary PCI, coronary calcification, clopidogrel, warfarin, statin, fibrates, ezetimibe and LDL−C level. *P < 0.05. Table 3. Clinical outcomes in the study, according to the different baseline LDL-C level
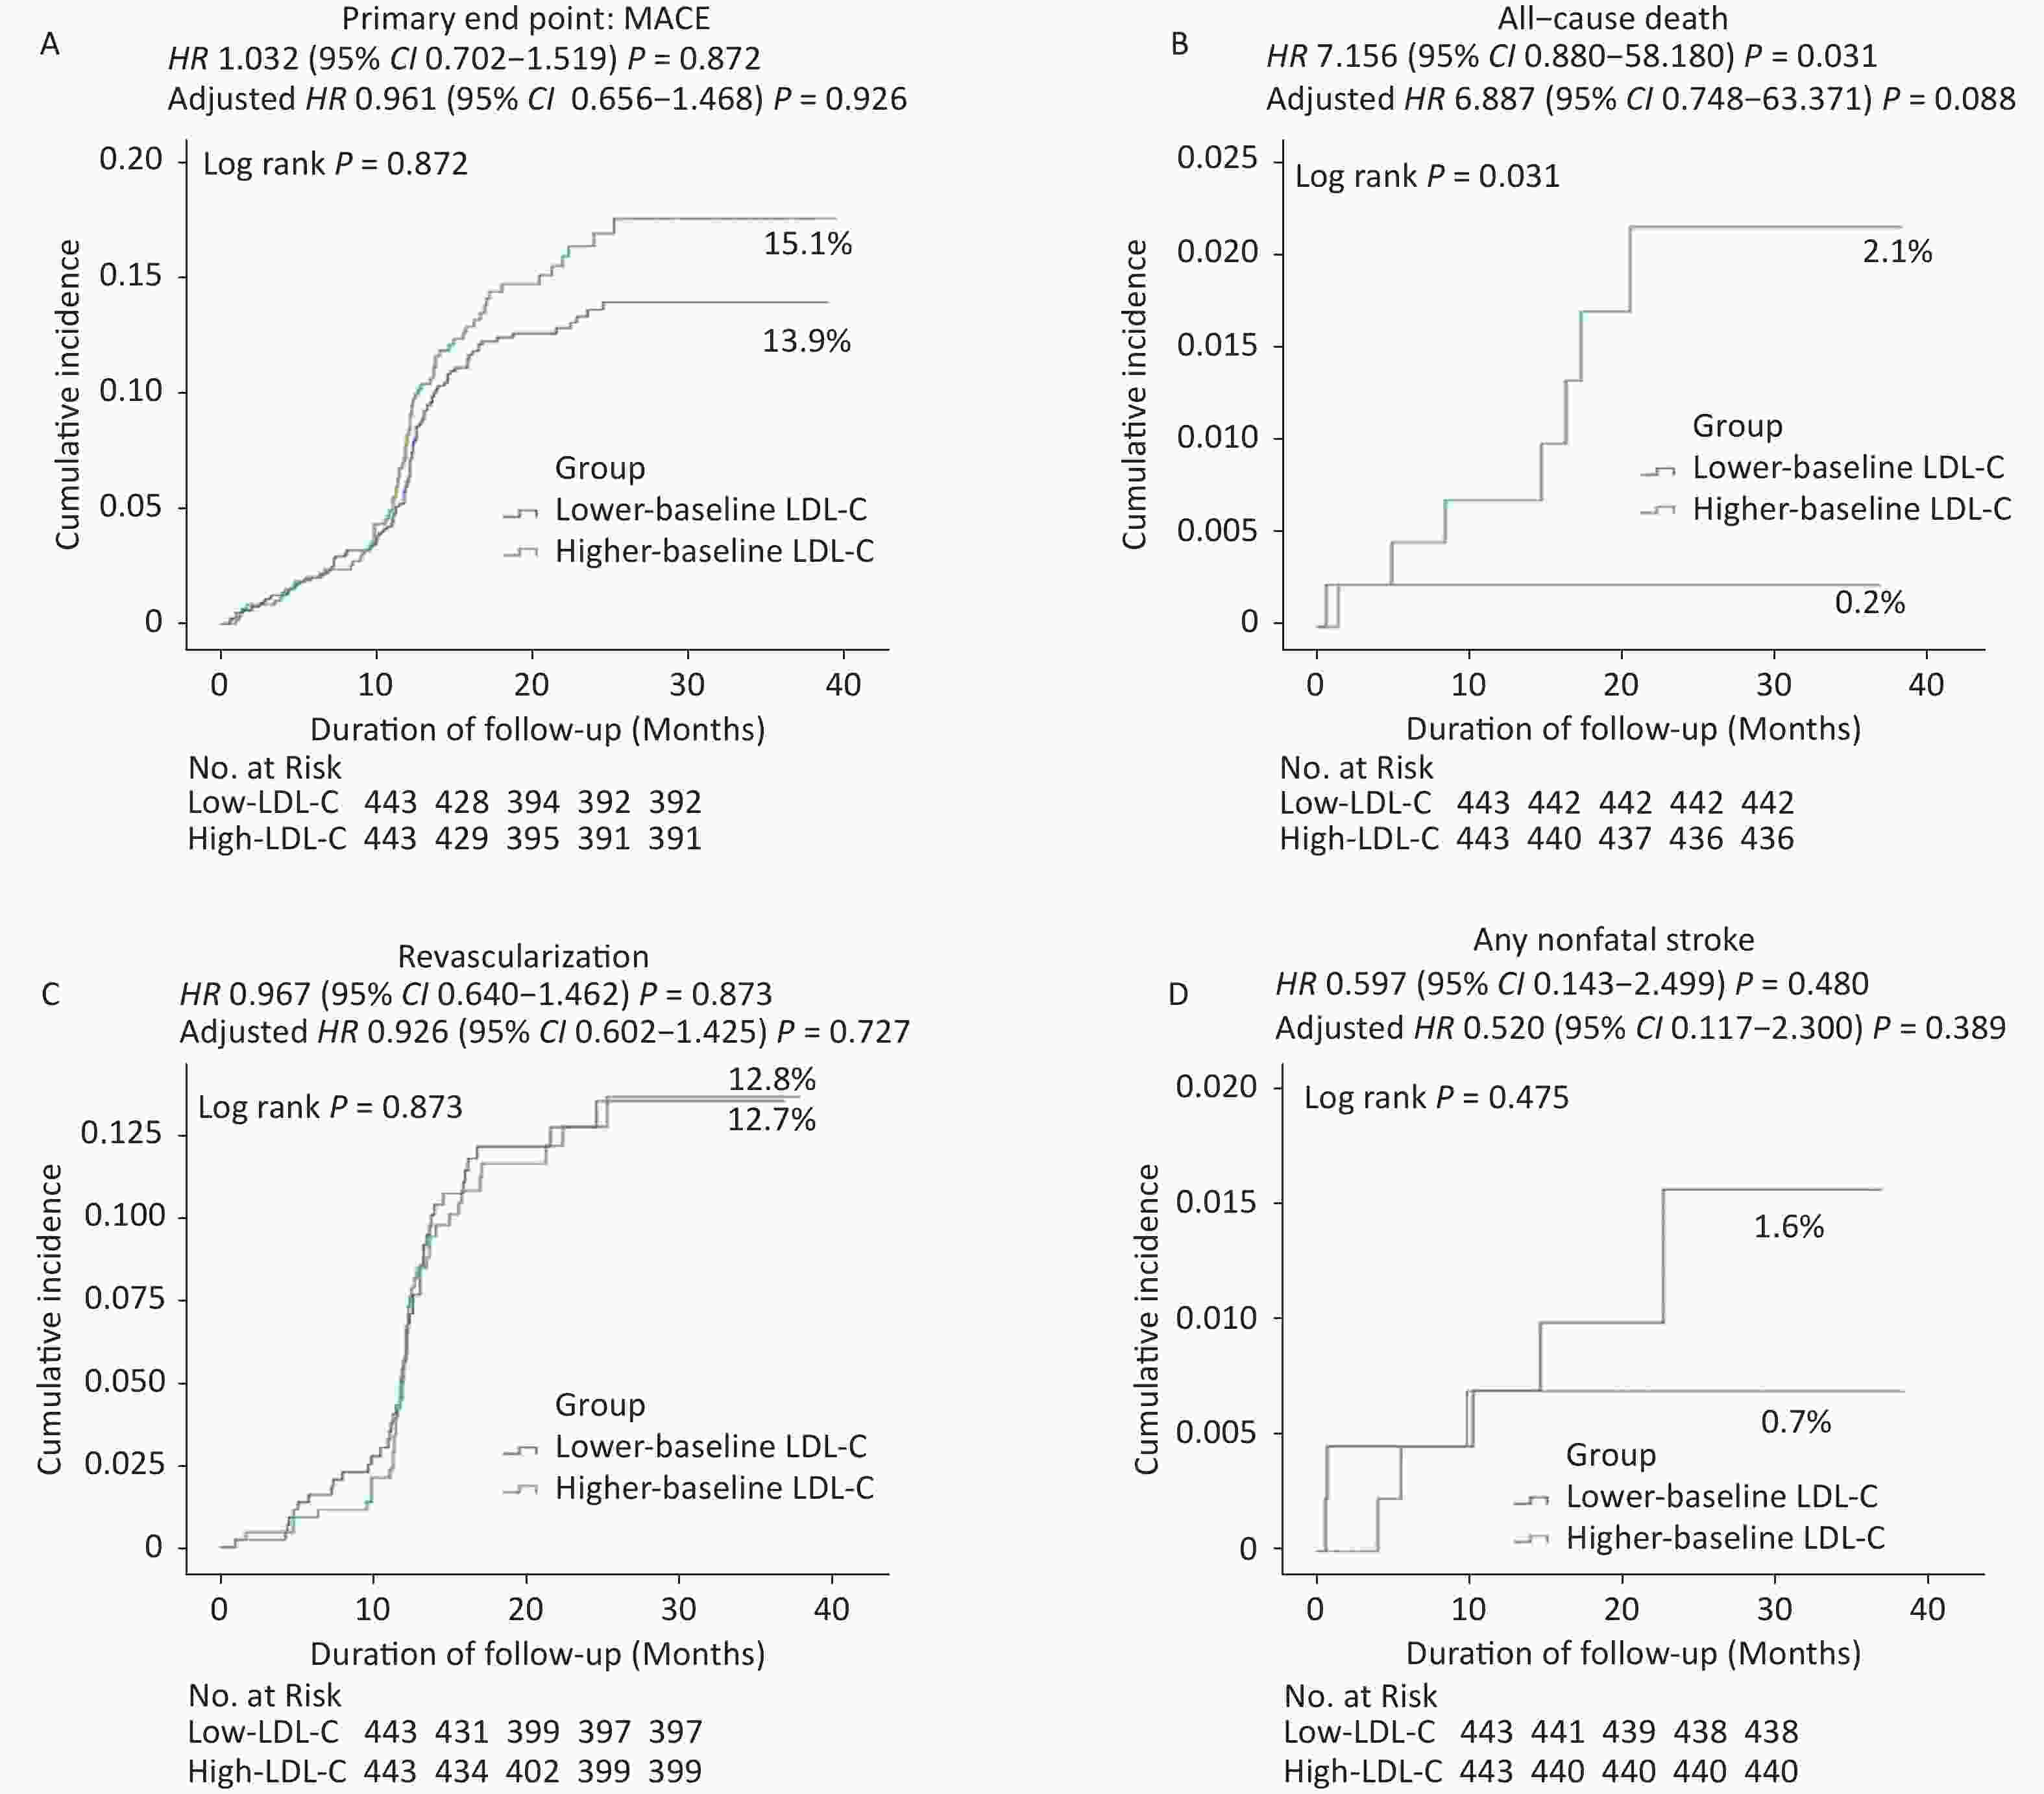
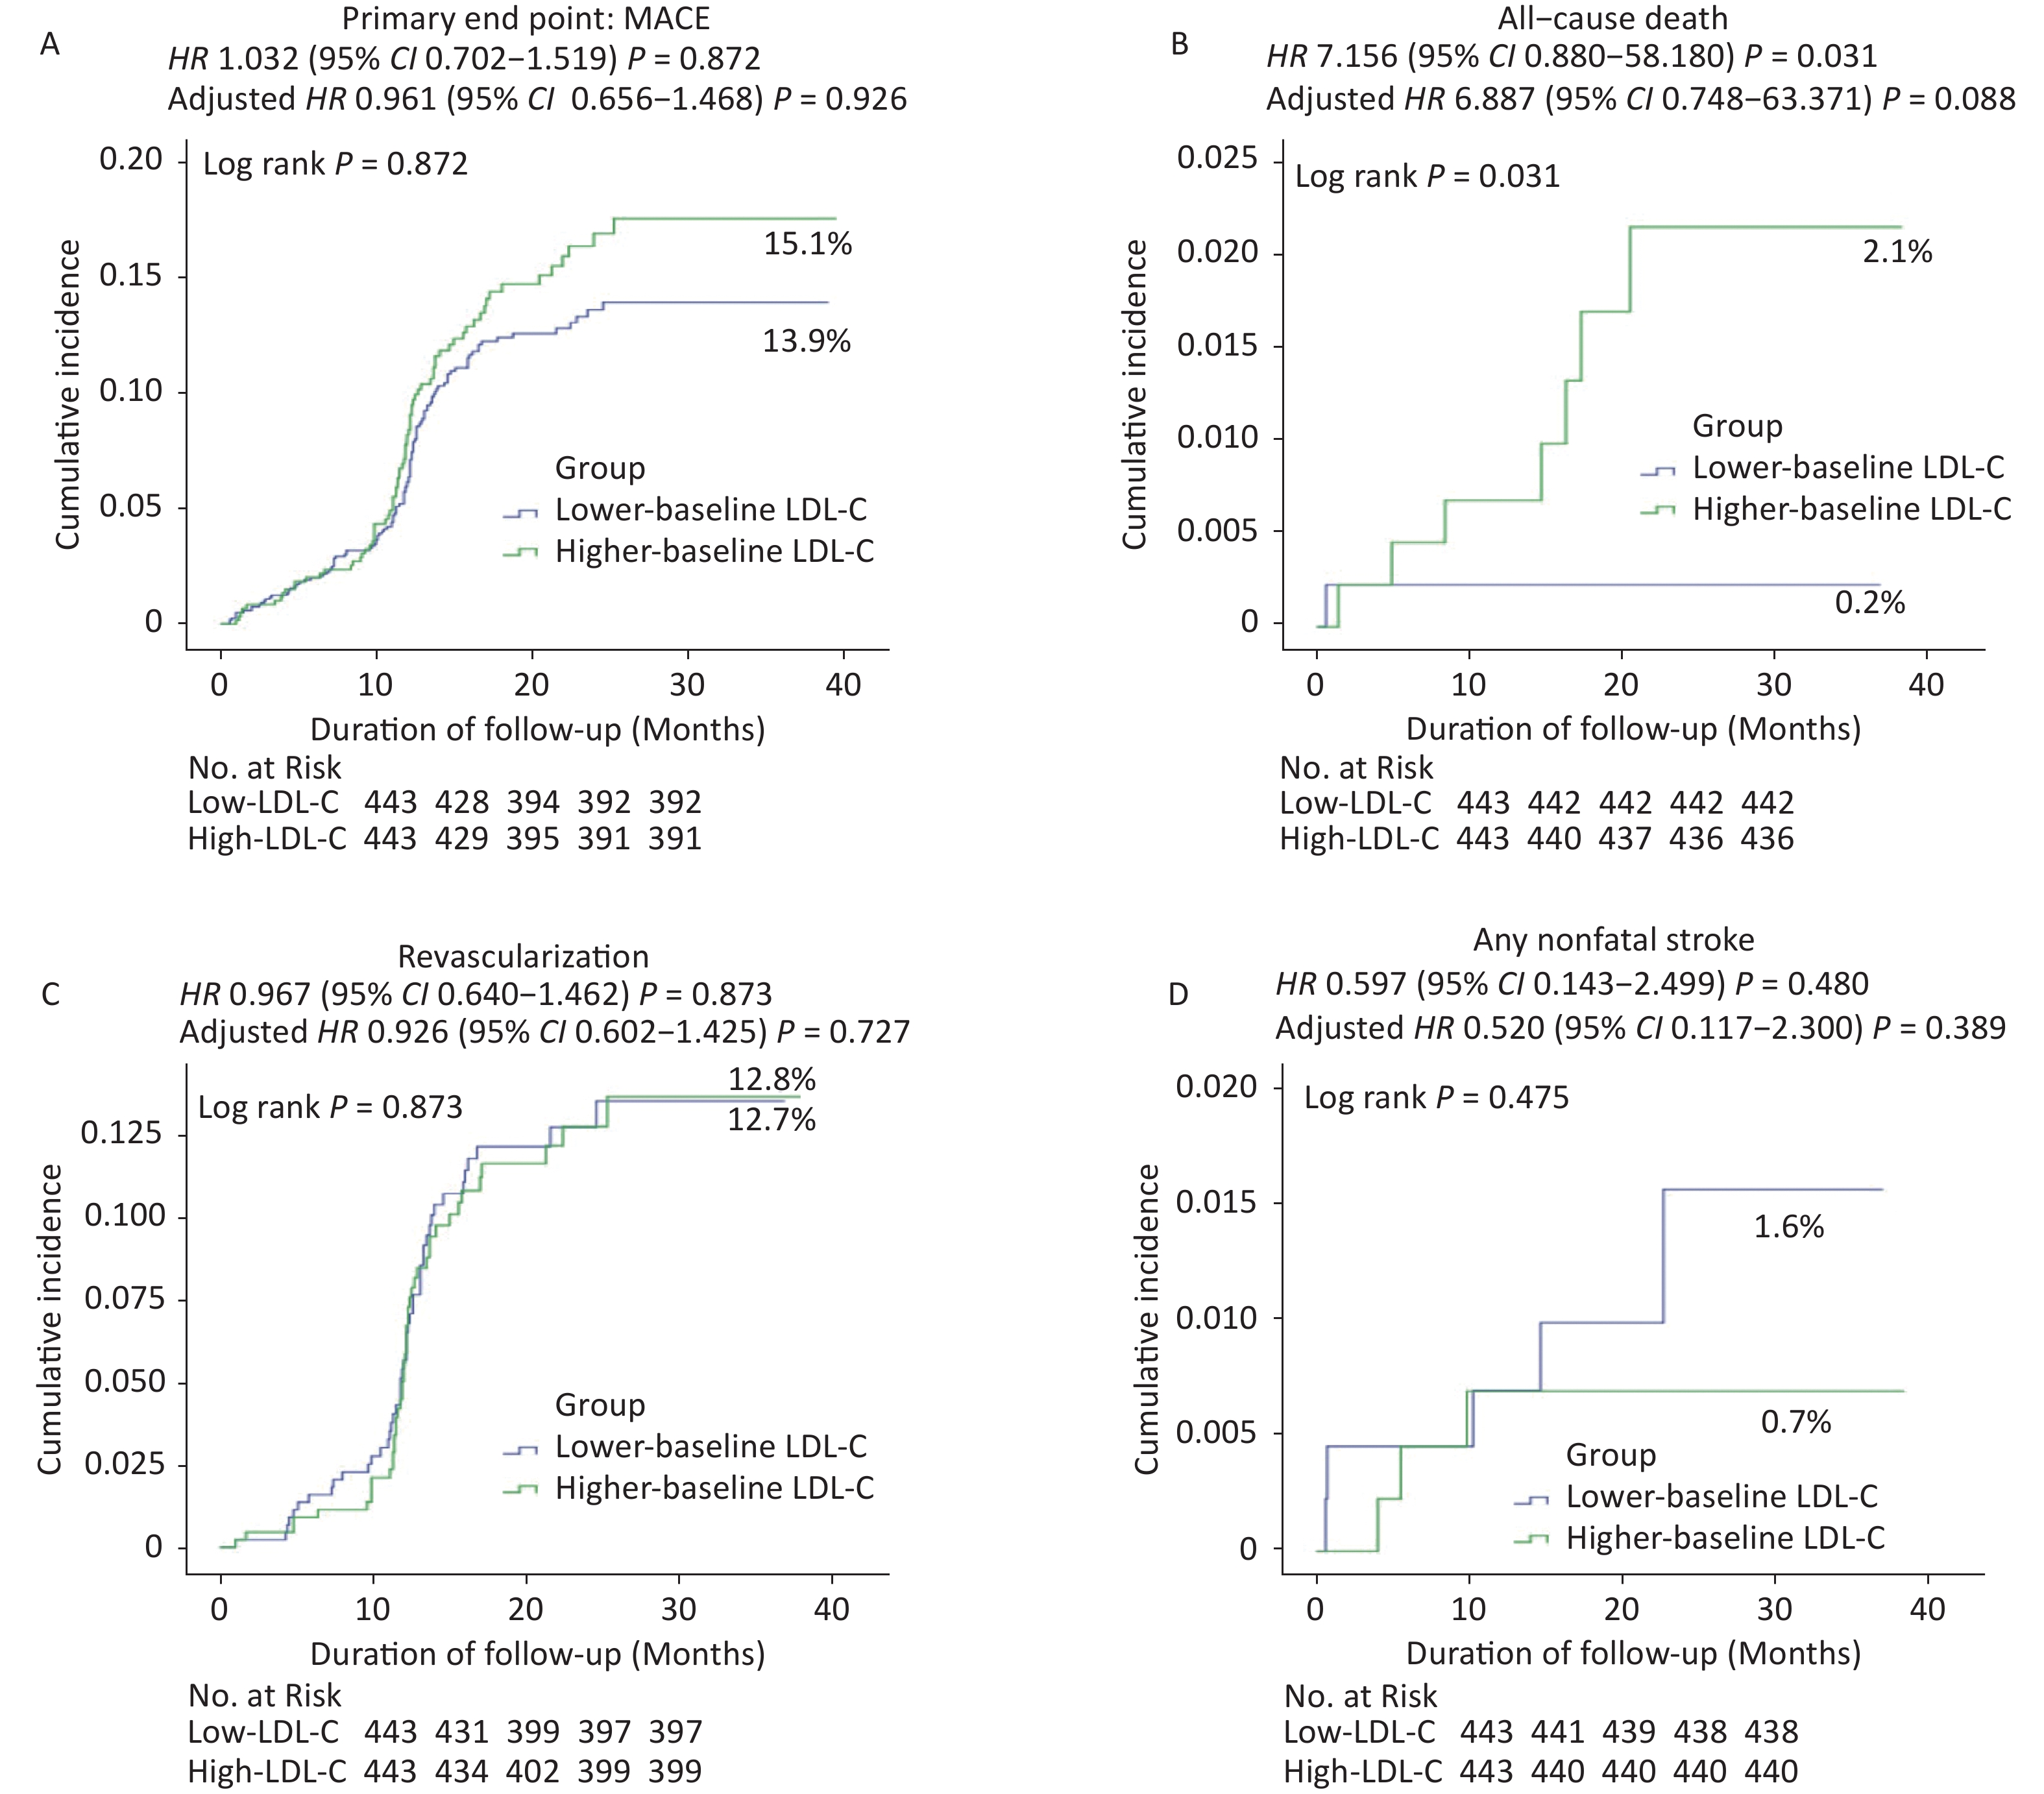
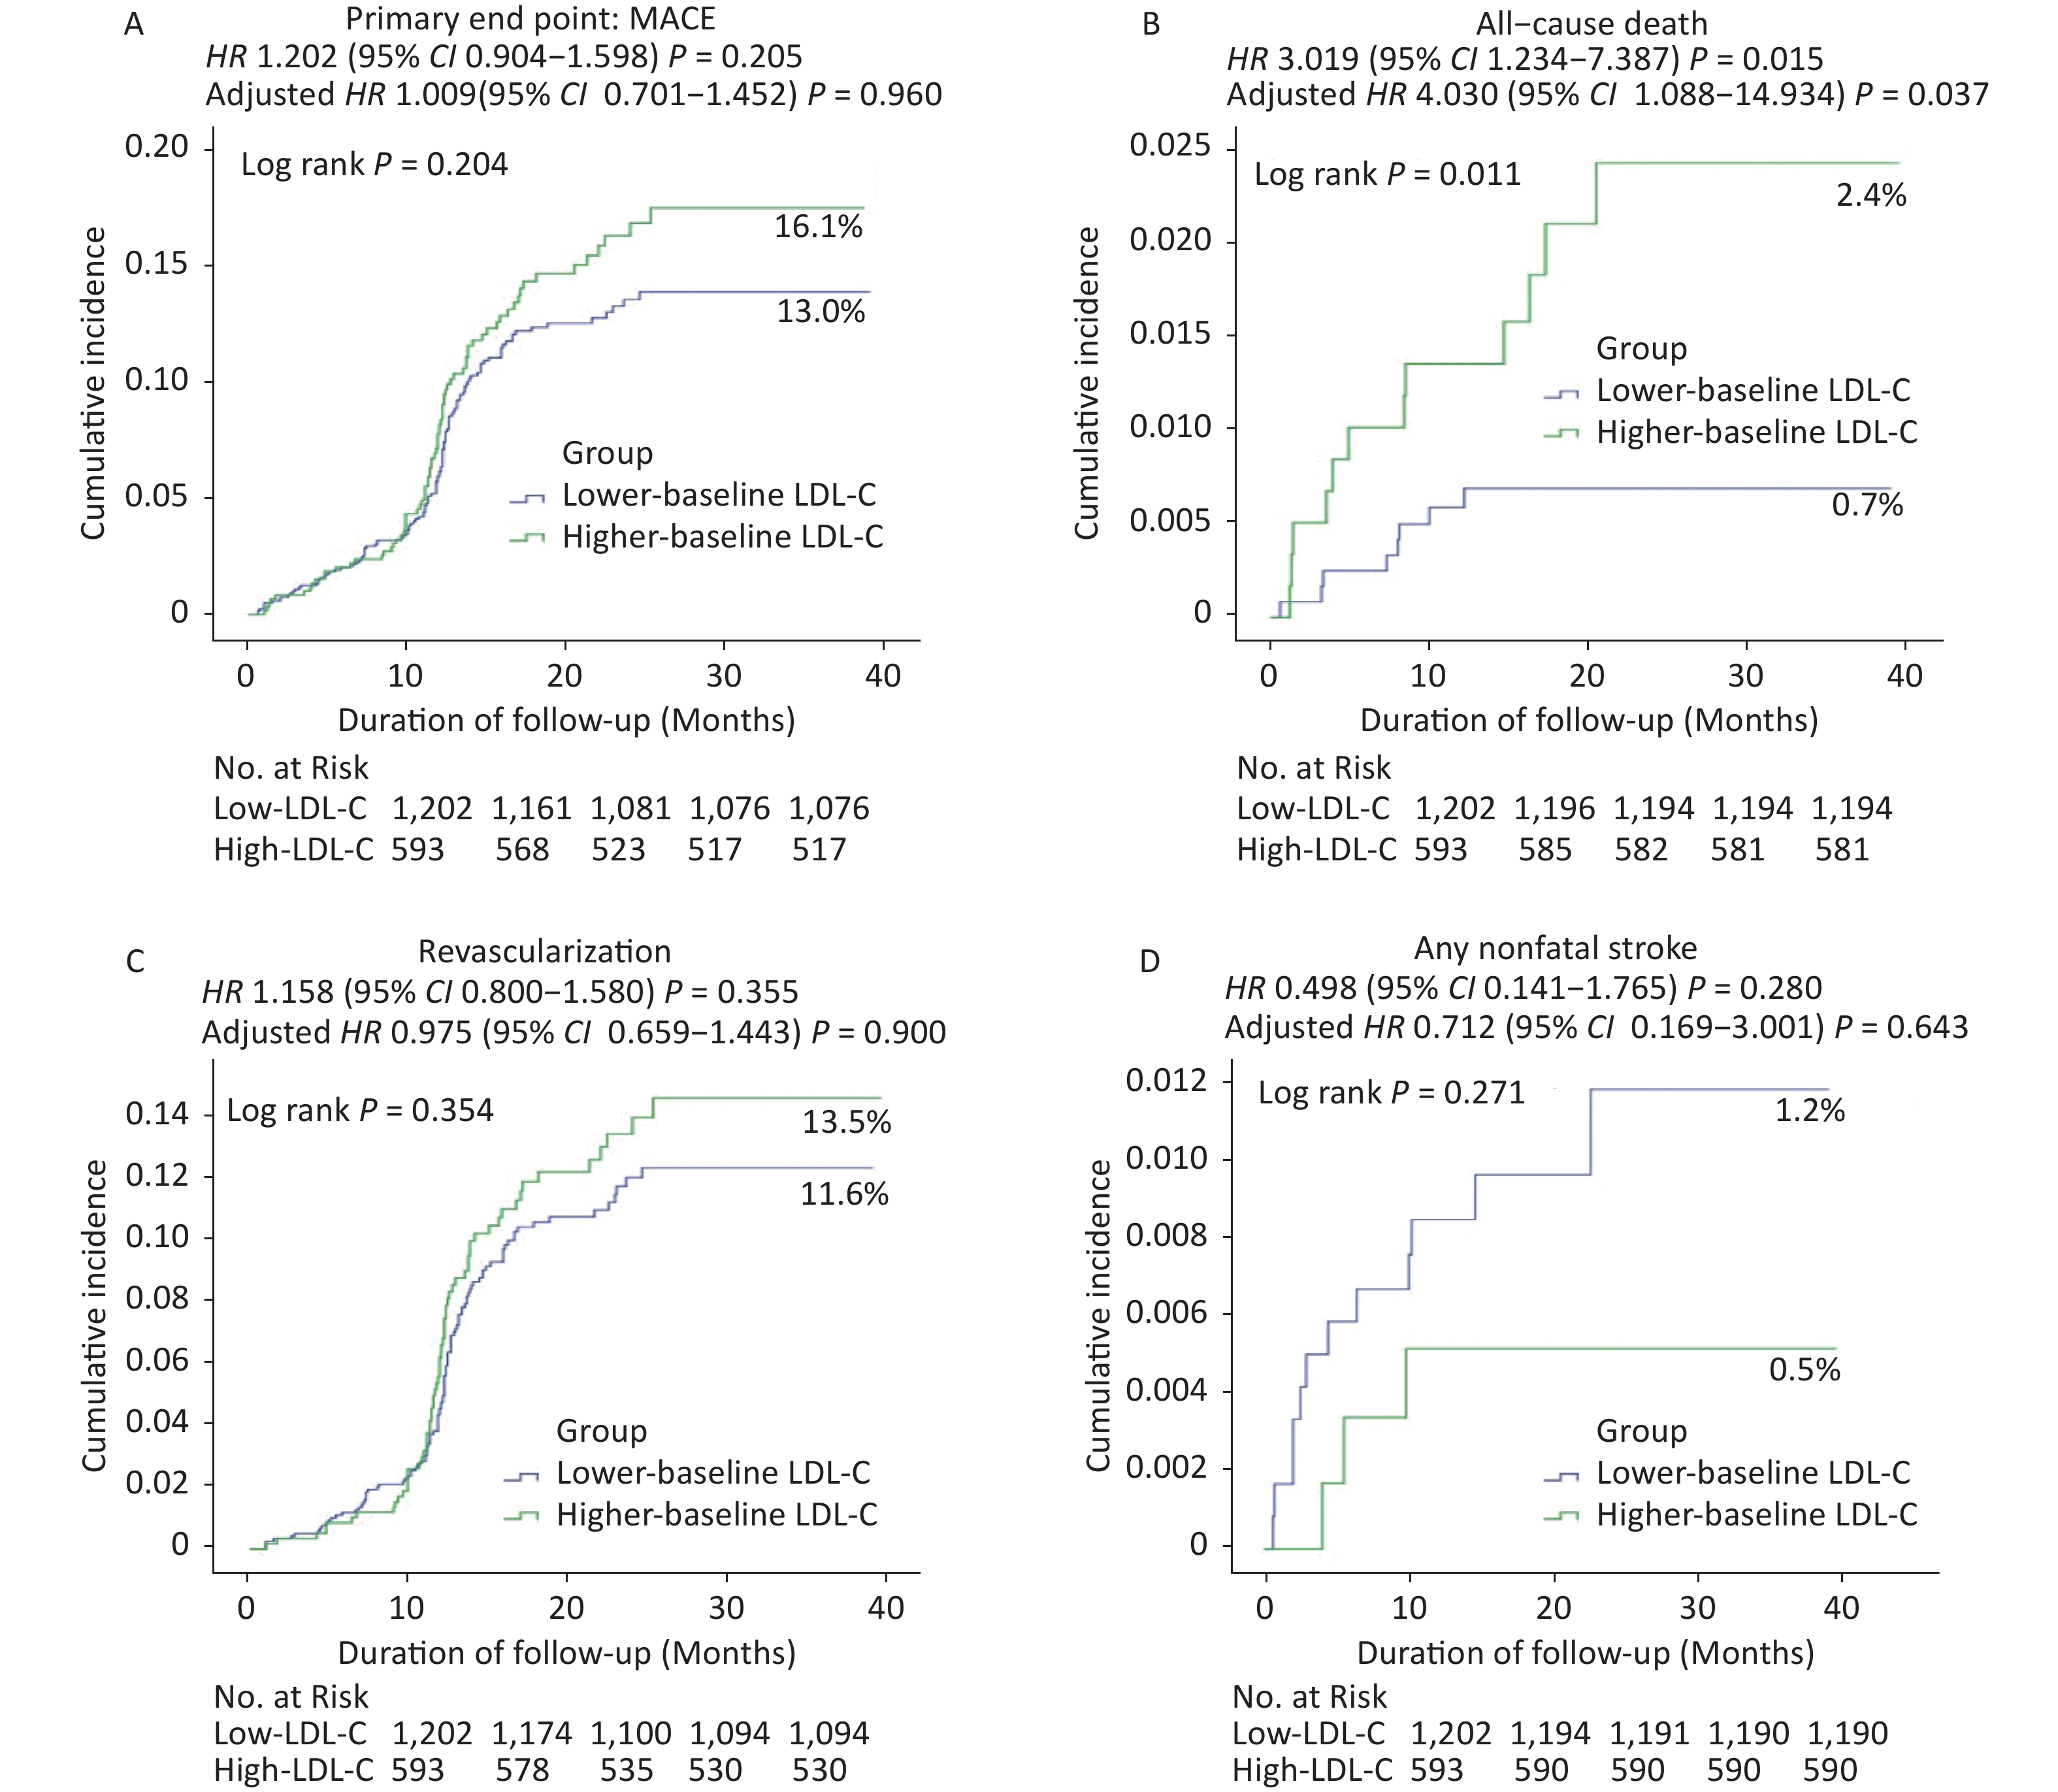
Figure 2. Cumulative incidence of clinical outcomes in the propensity-matched population. Kaplan–Meier curves for the (A) primary endpoint, (B) all-cause death, (C) revascularization, and (D) any nonfatal stroke in the propensity-matched population. Cumulative event rates for the primary composite endpoint of death from all-cause death, recurrent nonfatal MI, unexpected coronary revascularization (occurring at least 30 days after PCI), and nonfatal stroke during the overall study period.
Kaplan–Meier event rates for the risk of all-cause mortality were significantly lower in the low-LDL-C group than in the high-LDL-C group [adjusted hazard ratio (HR): 4.030, 95% confidence interval (CI): 1.088–14.934; P = 0.037, Table 3, Supplementary Figures S1 and Figure 3]. However, no significant differences were observed in the rates of MACE or other secondary endpoints between the two groups (Table 3, Supplementary Figure S1, and Figure 3).
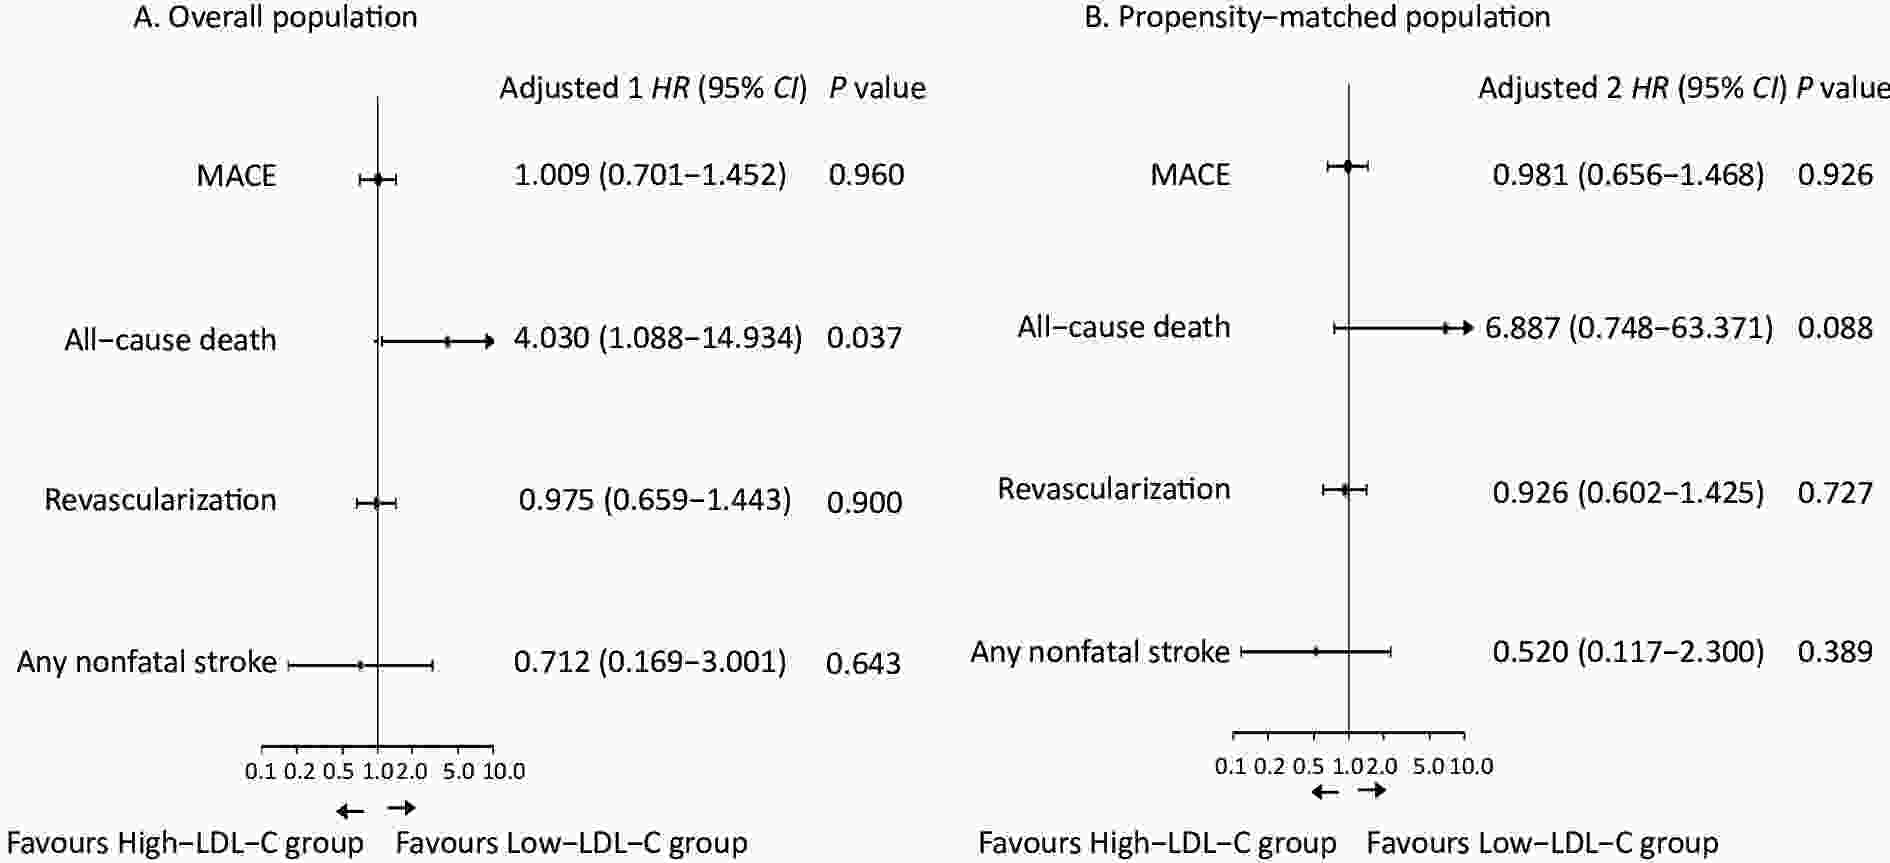
Figure 3. Clinical outcomes of the study, according to the baseline LDL-C level. (A) Adjusted 1: The models included age, gender, hypertension, current smoker, ACS, eGFR, left anterior descending, left circumflex, right coronary artery, stent length, primary PCI, coronary calcification, clopidogrel, warfarin, statin, fibrates, ezetimibe, and LDL-C level during follow-up as covariates. (B) Adjusted 2: The models included triglyceride, ACS, multivessel coronary disease, left anterior descending, right coronary artery, stent length, statin, fibrates, ezetimibe, and LDL-C level during follow-up as covariates.
Variables Overall population Propensity-matched population Low-LDL-C (N = 1,202) High-LDL-C (N = 593) P value Low-LDL-C (N = 443) High-LDL-C (N = 443) P value LDL-C, mmol/L† 1.85 (1.49–2.21) 3.15 (2.73–3.57) < 0.001* 1.84 (1.57–2.12) 3.20 (2.76–3.64) < 0.001* HDL-C, mmol/L† 0.95 (0.77–1.14) 1.02 (0.85–1.20) < 0.001* 0.98 (0.84–1.12) 1.04 (0.90–1.18) 0.216 TG, mmol/L† 1.28 (0.85–1.72) 1.55 (1.12–1.98) < 0.001* 1.44 (0.79–2.09) 1.53 (1.10–1.97) < 0.001* eGFR (SD), mL/min/1.73 m2‡† 71.86 (56.03–87.69) 77.11 (58.83–95.39) < 0.001* 75.62 (60.48–90.76) 79.83 (60.44–99.21) 0.362 Note. LDL-C, low density lipoprotein cholesterol; HDL-C, high density lipoprotein cholesterol; TG, triglyceride; eGFR, estimated glomerular filtration rate. †Median (Interquartile range). ‡eGFR is estimated by using the Modification of Diet in Renal Disease equation. *P < 0.050. Table S1. Baseline characteristics-laboratory findings
Variables
N (%)Overall population Propensity-matched population Low-LDL-C (N = 1,202) High-LDL-C (N = 593) P value Low-LDL-C (N = 443) High-LDL-C (N = 443) P value Multivessel coronary disease 186/1,147 (16.2) 108/558 (19.4) 0.107 91/443 (20.5) 91/443 (20.5) 1.000 Culprit vessel Left main 104/1,147 (9.1) 49/558 (8.8) 0.846 42/443 (9.5) 39/443 (8.8) 0.727 Left anterior descending 718/1,147 (62.6) 344/558 (61.6) 0.704 271/443 (61.2) 278/443 (62.8) 0.628 Left circumflex 220/1,147 (19.2) 134/558 (24.0) 0.021* 114/443 (25.7) 107/443 (24.2) 0.587 Right 278/1,147 (24.2) 136/558 (24.4) 0.951 106/443 (23.9) 104/443 (23.5) 0.874 Lesion type B2 or C 1,067/1,108 (96.3) 502/529 (94.9) 0.183 404/430 (94.0) 398/420 (94.8) 0.610 Calcification lesion 191/1,111 (17.2) 95/534 (17.8) 0.764 81/431 (18.8) 75/425 (17.6) 0.664 CTO 52/1,111 (4.7) 37/536 (6.9) 0.062 17/431 (3.9) 27/424 (6.4) 0.109 Primary PCI 251/1,147 (21.9) 93/558 (16.7) 0.012* 80/443 (18.1) 72/443 (16.3) 0.476 Stent length (mm) 39 ± 22 40 ± 23 0.209 53 ± 28 55 ± 25 0.110 Stent diameter ≥ 2.5 mm 934/1,147 (81.4) 457/558 (81.9) 0.814 352/443 (79.5) 362/443 (81.7) 0.396 Stent number 2.3 ± 1.0 2.2 ± 0.8 0.498 2.2 ± 0.9 2.2 ± 0.9 0.762 Note. CTO, chronic total occlusion. *P < 0.050. Table S2. Baseline characteristics-coronary angiographic and procedural findings
Variables
N (%)Overall population Propensity-matched population Low-LDL-C (N = 1,202) High-LDL-C (N = 593) P value Low-LDL-C (N = 443) High-LDL-C (N = 443) P value Medications Antiplatelet drug Aspirin 1,163/1,202 (96.8) 581/591 (98.3) 0.058 432/443 (97.5) 436/443 (98.4) 0.341 Clopidogrel 1,079/1,202 (89.8) 535/591 (90.5) 0.615 408/443 (92.1) 403/443 (91.0) 0.546 Ticagrelor 6/1,202 (0.5) 4/591 (0.7) 0.738 0/443 (0.0) 3/443 (0.7) 0.083 Cilostazol 32/1,202 (2.7) 8/591 (1.4) 0.078 10/443 (2.3) 6/443 (1.4) 0.313 Warfarin 15/1,202 (1.2) 8/591 (1.4) 0.852 9/443 (2.0) 5/443 (1.1) 0.281 Lipid-lowering drug Statin 1,186/1,202 (98.7) 582/591 (98.5) 0.745 439/443 (99.1) 437/443 (98.6) 0.525 Fibrates 8/1,202 (0.7) 2/591 (0.3) 0.382 4/443 (0.9) 2/443 (0.5) 0.413 Ezetimibe 93/1,202 (7.7) 147/591 (24.9) < 0.001* 71/443 (16.0) 79/443 (17.8) 0.474 ACEI or ARB 715/1,202 (59.5) 352/591 (59.6) 0.975 249/443 (56.2) 256/443 (57.8) 0.635 Beta-blocker 671/1,202 (55.8) 303/591 (51.3) 0.069 230/443 (51.9) 219/443 (49.4) 0.460 CCB 302/1,202 (25.1) 151/591 (25.5) 0.846 96/443 (21.7) 117/443 (26.4) 0.099 Note. ACEI, angiotensin-converting enzyme inhibitor; ARB, angiotensin-receptor blocker; CCB, Dihydropyridine calcium-channel blocker. *P < 0.050. Table S3. Baseline characteristics-medications
-
Following adjustment for potential confounders, including triglyceride, ACS, multivessel coronary disease, left anterior descending, right coronary artery, stent length, statin, fibrates, ezetimibe, and LDL-C during follow-up in the propensity-matched population, the low-LDL-C group had a trend of decreased all-cause mortality risk (adjusted HR: 6.887, 95% CI: 0.748–63.371, P = 0.088; Table 3 and Figures 2 and 3). However, no significant differences were detected in the risks of MACE or other secondary endpoints between the groups.
-
The findings of this study have demonstrated that a low baseline LDL-C was associated with a low risk of all-cause mortality among statin-naive patients undergoing their first PCI. However, no significant differences were found in the rate of MACE, and no other secondary endpoints, such as unexpected revascularization or nonfatal stroke, were observed. In this study, a high baseline LDL-C was not associated with a low risk of clinical outcomes in CAD patients undergoing first PCI, which suggested that the “cholesterol paradox” may not be applicable to the Chinese population. Therefore, further research on Chinese populations is still needed.
LDL-C plays a crucial role in the pathogenesis and perpetuation of atherosclerotic CVD[4-8]. Specifically, LDL-C is composed of various heterogeneous populations of particles. Existing studies have identified multiple LDL subfractions, each of which has different biological effects and thus shows various atherogenic potentials[28]. At present, no international standard is available for LDL subgroup typing. The more common subtypes are further divided into seven subtypes based on different densities: LDL-1 and LDL-2 are large buoyant LDL; LDL-3 and LDL-4 are intermediate-density LDL; LDL-5, LDL-6, and LDL-7 are small dense (sdLDL). SHIFFMAN et al. observed that LDL-1 was negatively associated with CVD, whereas sdLDL, LDL-3, and LDL-6 were positively associated with CVD[29]. Furthermore, the sdLDL subfractions (3–7) can be considered the most atherogenic due to their easier penetration into the arterial walls[30]. However, currently, these LDL cholesterol subfractions have not been incorporated into clinical routines. Therefore, the current studies have still mainly focused on the effect of LDL-C on the clinical prognosis of CVDs.
LDL-C is a predictor of increased morbidity and mortality for CAD[8]. In several trials[31, 32], a low LDL-C results in desired outcomes, and no below-threshold value exists, which means that no incremental benefit can be gained. The benefits observed in these trials may be due to the great degree of LDL-C lowering and pleiotropic effects of a high statin dose or both. However, controversy remains over whether baseline LDL-C can be used to predict clinical outcomes for patients with CAD.
The results of this study are consistent with those from previous reports[6, 33] in that elevated baseline LDL-C was associated with an increased risk of all-cause mortality. A large Chinese cohort study demonstrated that when incorporating nutritional assessment into analysis, the cholesterol paradox existed in patients with CAD, and a low LDL-C was associated with a high long-term all-cause mortality[24]. However, in this study, no significant relationship was observed between baseline LDL-C levels and MACE and other secondary endpoints, and this finding may be due to the small sample size of this study. Nonetheless, the authors of recent trials have also reported that low LDL-C levels upon admission are associated with increased mortality of patients with ACSs[21, 34]. Reddy et al. demonstrated that high cholesterol levels are associated with good survival in patients with chronic heart failure[19]. This phenomenon is known as the “cholesterol paradox”. At present, the theory of the “cholesterol paradox” is mainly focused on foreign data, and whether it also applies to the Chinese population is still unclear. As shown by the results, no “cholesterol paradox” was found in this study. Therefore, the “cholesterol paradox” may be inapplicable to the Chinese population, which indicates the need for further large clinical studies.
The mechanism of the “cholesterol paradox” is still not fully understood. Recent studies have reported that differences in genetic polymorphisms between these ethnicities may be a part of an underlying mechanism[35]. For example, factor V Leiden (G1691A) and prothrombin G20210A gene mutations are more common in Caucasians than in Asian people. Similarly, in this study, the results of Cox regression analysis revealed that high baseline LDL-C levels had no protective effect for CAD patients after the first PCI, which indicated a “cholesterol paradox”. This study failed to support the “cholesterol paradox” in the Chinese population, which may be explained by ethnic differences.
Hence, the paradox may be caused by various factors. A previous study[21] showed that in patients with AMI, clinical outcomes decreased as the LDL-C level increased, aside from in patients with LDL-C levels of ≥ 160 mg/dL. Patients with lower LDL-C levels were older and had more co-morbidities and an unfavorable hemodynamic status. However, in the present study, participants with baseline LDL-C of ≥ 160 mg/dL were also included. Patients with lower LDL-C levels are likely to be older and with more co-morbidities (such as hypertension and chronic kidney disease) but with a low prevalence of previous ACS and left circumflex. In the present study, patients in the high-LDL-C group had a low median LDL-C level (1.46 mmol/L vs. 1.89 mmol/L). Although low LDL-C levels indicate desirable outcomes[10, 36], we hypothesized that a great reduction in the risk of high baseline LDL-C levels may be counterbalanced by an increase in the high median LDL-C level during follow-up.
This study has several limitations. First, this research is a retrospective study with selection bias. To overcome this issue, we performed Cox multivariate and propensity-matching analyses with adjustments for potential confounders. However, unmeasured potential confounders could not be adjusted. Second, as included patients were statin-naive, the findings of this study cannot be generalized to patients with long-term statin treatment before PCI. Third, cardiac death, nonfatal strokes, and ischemic stroke were low-probability events. Thus, we failed to find the effect of baseline LDL-C on them. Another limitation is that the target LDL-C level (< 1.8 mmol/L) may not be rigorous enough. Lower target LDL-C levels have been recommended for individuals at extreme risk (< 1.4 mmol/L)[9]. Meanwhile, the sample size was insufficient. As shown in Table 3, the number of deaths was very low. Therefore, the confidence intervals in the results recorded here were very large and may be linked to the insufficient sample size of the study. Prospective, large-sample-size studies are required for further research. Finally, we did not assess the effect of the variability of LDL-C levels on clinical outcomes during follow-up.
In conclusion, the “cholesterol paradox” was not detected in the present study, which suggests that high baseline LDL-C levels have no protective effect on Chinese CAD patients. Further large population studies are needed to directly assess the relationship between baseline LDL-C levels and cardiovascular events.
-
In this study, high baseline LDL-C was not associated with a low risk of clinical outcomes in CAD patients undergoing their first PCI, which suggested that the “cholesterol paradox” may not be applicable to the Chinese population. Further research is still needed for Chinese populations.
-
The authors have no conflicts of interest to disclose.
-
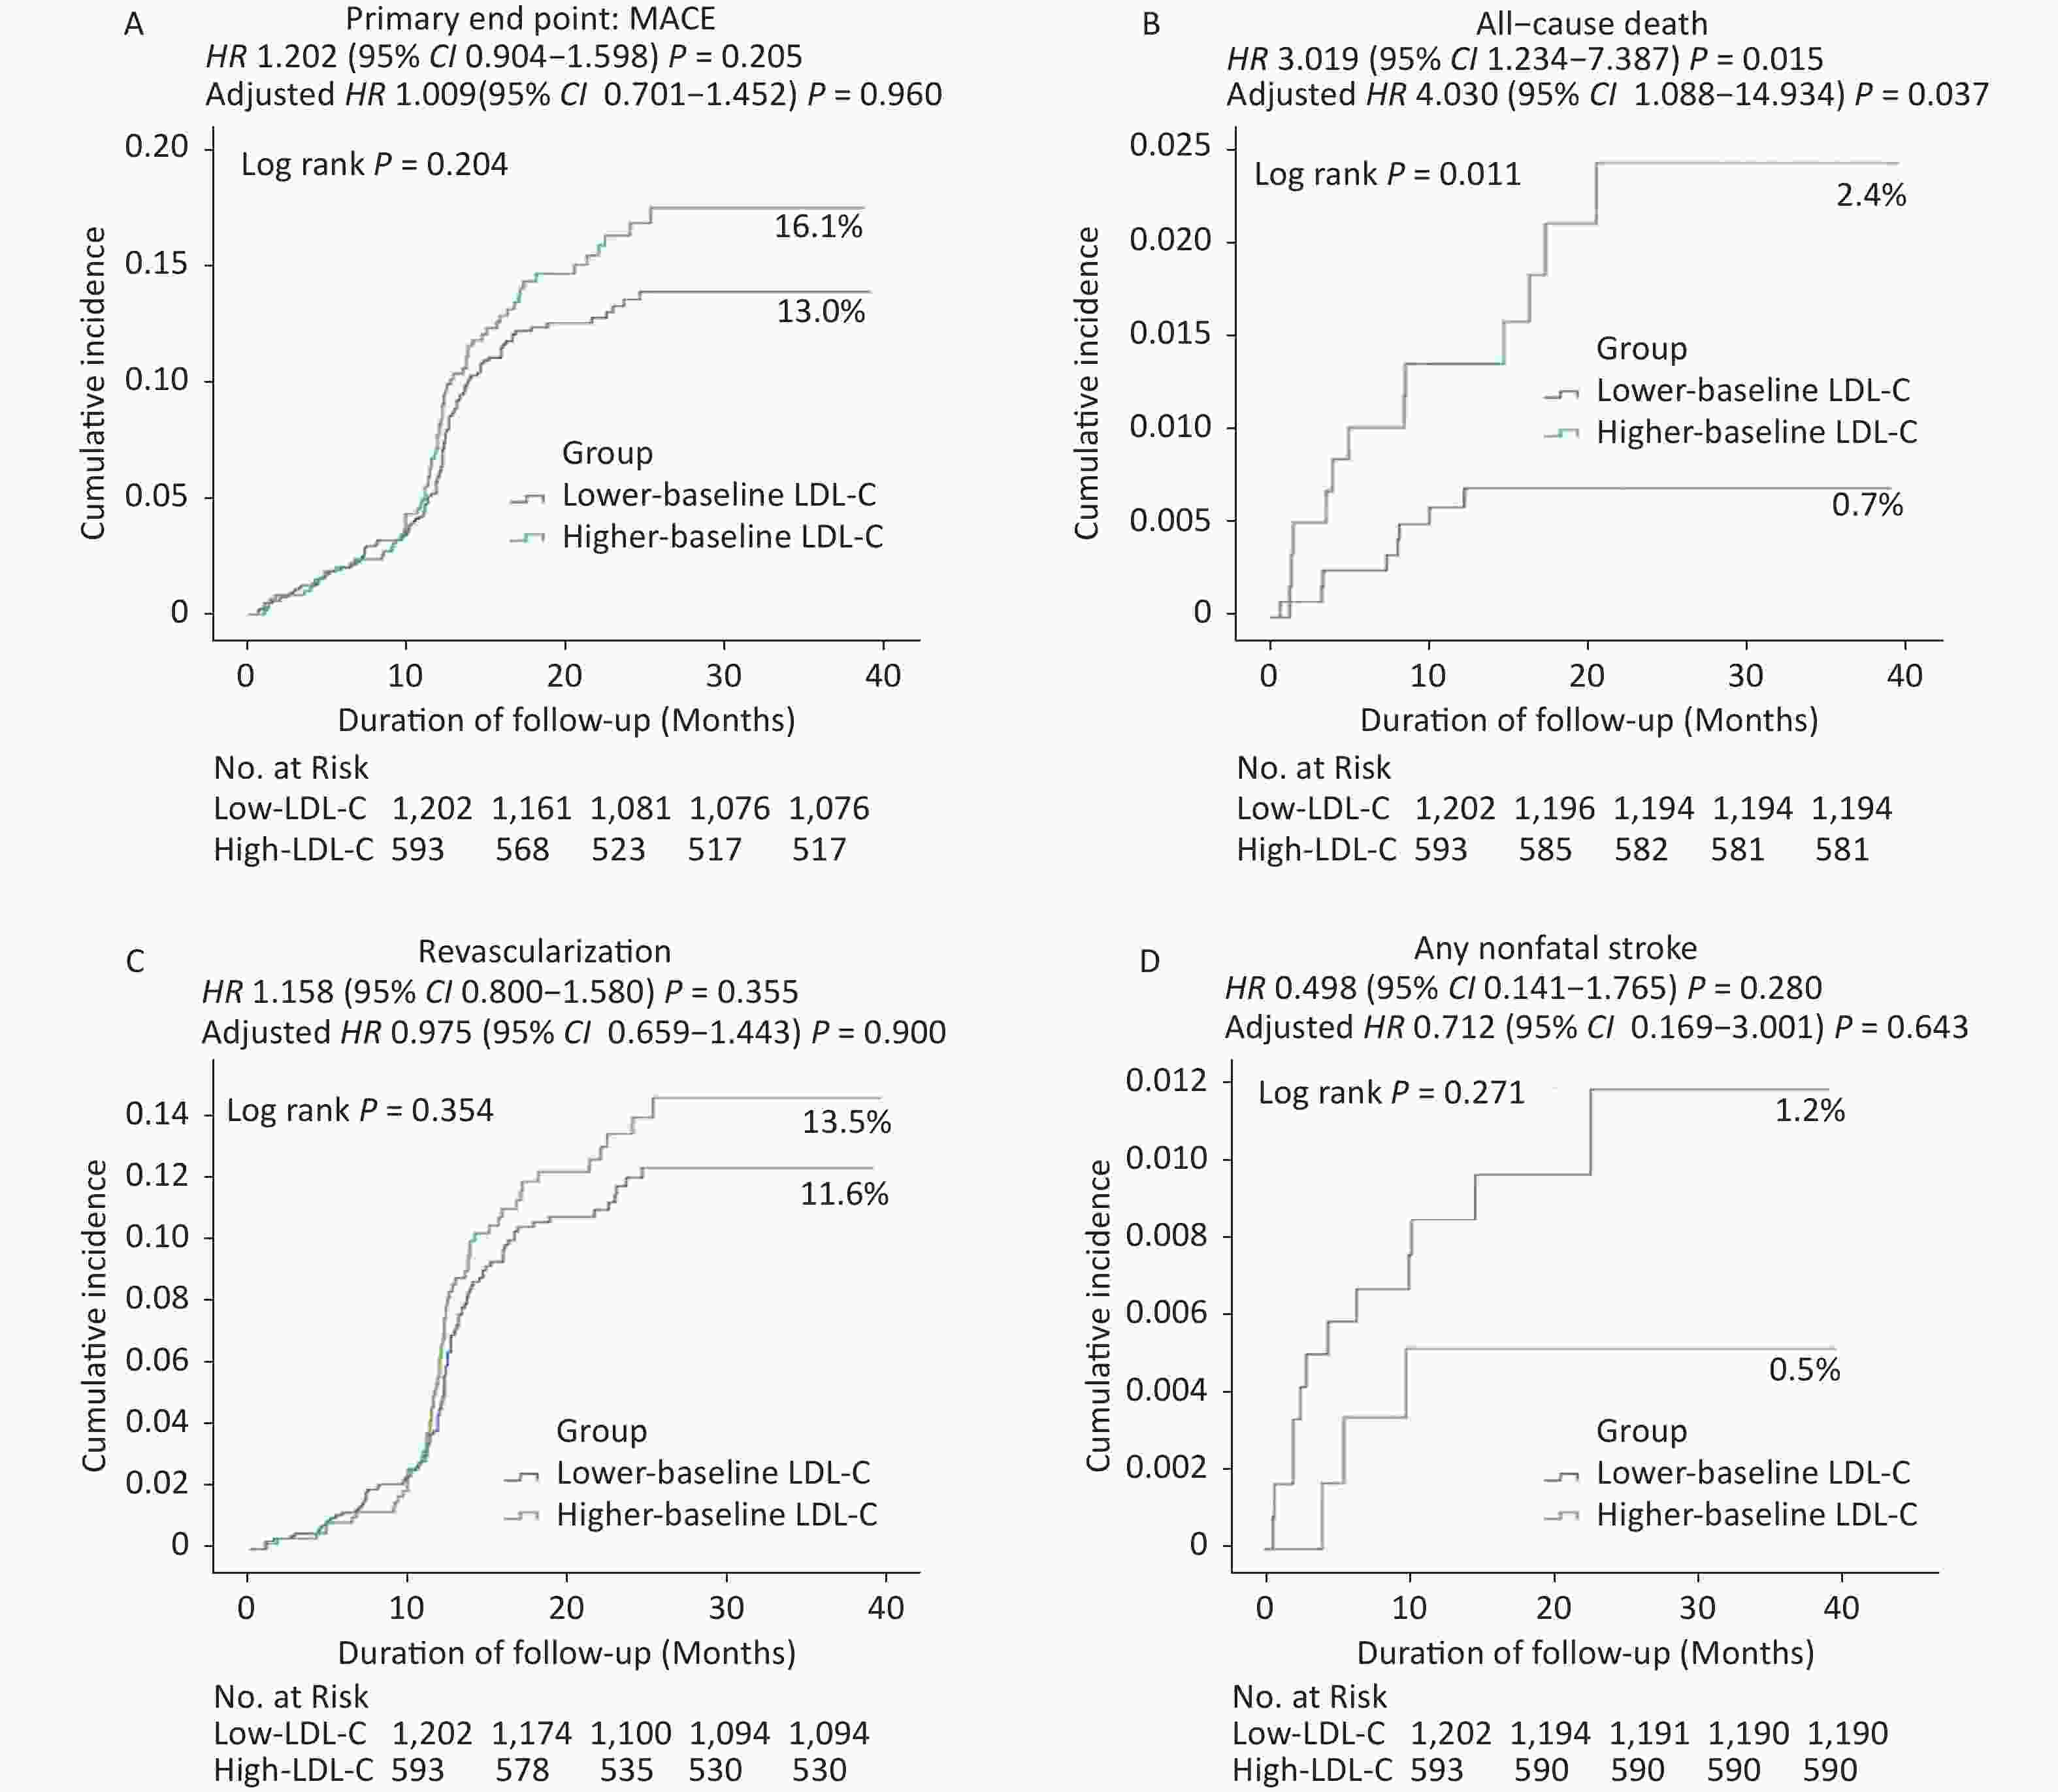
Figure S1. Cumulative Incidence of Clinical Outcomes in the Propensity-matched population. Kaplan–Meier Curves for the (A) Primary End Point, (B) all-cause death, (C) Revascularization and (D) any nonfatal stroke in the Propensity-matched population.
HTML
Data Sources and Study Population
Endpoints
Statistical Analysis
Baseline Demographics and Angiographic Findings
LDL-C Data
Clinical Outcomes in the Overall Population
Clinical Outcomes in the Propensity-matched Population
 22127Supplementary Materials.pdf
|

|

 Quick Links
 DownLoad: