


-
Non-alcoholic fatty liver disease (NAFLD) is a clinicopathological syndrome characterized by lipid accumulation in the liver without excessive alcohol intake or other liver diseases[1]. It encompasses a spectrum of liver damage, ranging from simple liver steatosis to nonalcoholic steatohepatitis (NASH), liver fibrosis, cirrhosis, and hepatocellular carcinoma (HCC)[2-5], which increases the risk of hypertension, diabetes, obesity, and cardiovascular disease[6-8]. In recent years, the prevalence of NAFLD has increased rapidly, ranging from 10% to 35% worldwide[9], and approximately 30% of American adults have NAFLD[10]. To our knowledge, no pharmacological treatment has been approved for NAFLD[11]. Dietary modifications and antioxidants are recommended to prevent NAFLD progression of NAFLD[12].
Several modifiable lifestyle and dietary factors are associated with chronic diseases. Previous studies demonstrated that high intake of vegetables, fruits, and whole grains, as a dietary pattern was associated with reduced risk of hypertension, hyperuricemia, type 2 diabetes, and cardiovascular disease[13-17]. In addition, several studies have reported that the consumption of fried foods, refined grains, processed meat, and fructose-rich foods increases the risk of NAFLD[18-20], whereas the consumption of whole grains, legumes, probiotic dairy products, vegetables, and fruits reduces the risk of NAFLD[20-23].
Vitamin A is a common dietary antioxidant[24] that has both antioxidant and antifibrotic effects[25]. The two major forms of dietary vitamin A are animal-derived dietary retinol (i.e., preformed vitamin A, such as retinol and retinyl esters) and plant-derived dietary retinol (i.e., provitamin A carotenoids, such as carotene). Animal products containing preformed vitamin A provide approximately 70% of daily vitamin A intake. Provitamin A carotenoids that are mainly found in fruits and vegetables provide ≤ 30% of daily vitamin A intake[26], which can be cleaved and metabolized into retinol after absorption by the intestinal cells[27]. The basic mechanisms underlying preformed vitamin A and carotenoid absorption were first investigated 40 years ago using everted rat intestinal sacs[28-30]. The data obtained indicated that preformed vitamin A absorption occurred via (a) carrier-dependent proteins, whereas carotenoids were absorbed via a passive diffusion process[27]. Additionally, hepatocytes actively metabolize preformed vitamin A, which alter glucose and lipid metabolism. Carotenoids possess antioxidant properties and can scavenge free radical species in the liver, thereby ameliorating hepatic dysfunction[31]. Therefore, it is important to study the effects of dietary retinol in patients with NAFLD. However, in studies exploring the potential relationship between dietary retinol and NAFLD, discrepancies in ethnic background, dietary patterns, and study design led to inconsistent results. An Iranian study indicated that higher retinol intake is associated with a reduced risk of NAFLD[9]. Another cross-sectional study of 80 participants showed that patients with NAFLD had a higher intake of vitamin A than healthy controls[32]. However, these studies have reported inconsistent outcomes. Previous studies have mainly focused on the relationship between total dietary retinol intake and the risk of NAFLD[9,33,34] and have less statistical power in the evaluation of nonlinear and complex relationships. Moreover, these studies did not adjust for potential confounders such as sex, age, and body mass index (BMI)[32,35]. Therefore, the establishment of a model that incorporates dietary retinol intake from different sources to predict the risk of NAFLD is warranted.
As a novel data-mining analysis approach, artificial neural networks (ANNs) play an important role in analyzing large and complex datasets related to health promotion, disease management, and chronic disease prediction[36-38]. In previous studies, ANN has been used to automatically predict the exacerbation of chronic obstructive pulmonary disorder[39], heart disease, and hyperuricemia[40,41], and diagnose diabetes via small mobile devices[42]. However, no study has investigated the ability of ANN combined with dietary retinol intake from different sources to predict the risk of NAFLD. Therefore, this cross-sectional study aimed to illustrate the potential usefulness of artificial intelligence, particularly ANN, in predicting the risk of NAFLD after incorporating dietary retinol intake from different sources. This model can be used as an initial screening tool to assess the correlation between dietary retinol intake from different sources and the risk of NAFLD, contributing to the management of NAFLD in American adults.
-
The National Health and Nutrition Examination Survey (NHANES) was conducted by the National Center for Health Statistics (NCHS) of the Centers for Disease Control and Prevention (CDC) in the US[43]. The survey was a continuous program in 2-year cycles starting from 1999[44]. The NHANES includes demographic, socioeconomic, dietary, and health-related questions. The examination component consisted of medical, dental, and physiological measurements, as well as laboratory tests conducted by highly trained medical personnel, which were collected from a complex multistage stratified sample representative of the non-institutionalized civilian US population[45]. The study plan was approved by the Research Ethics Review Board of the National Center for Health Statistics and all participants provided written informed consent.
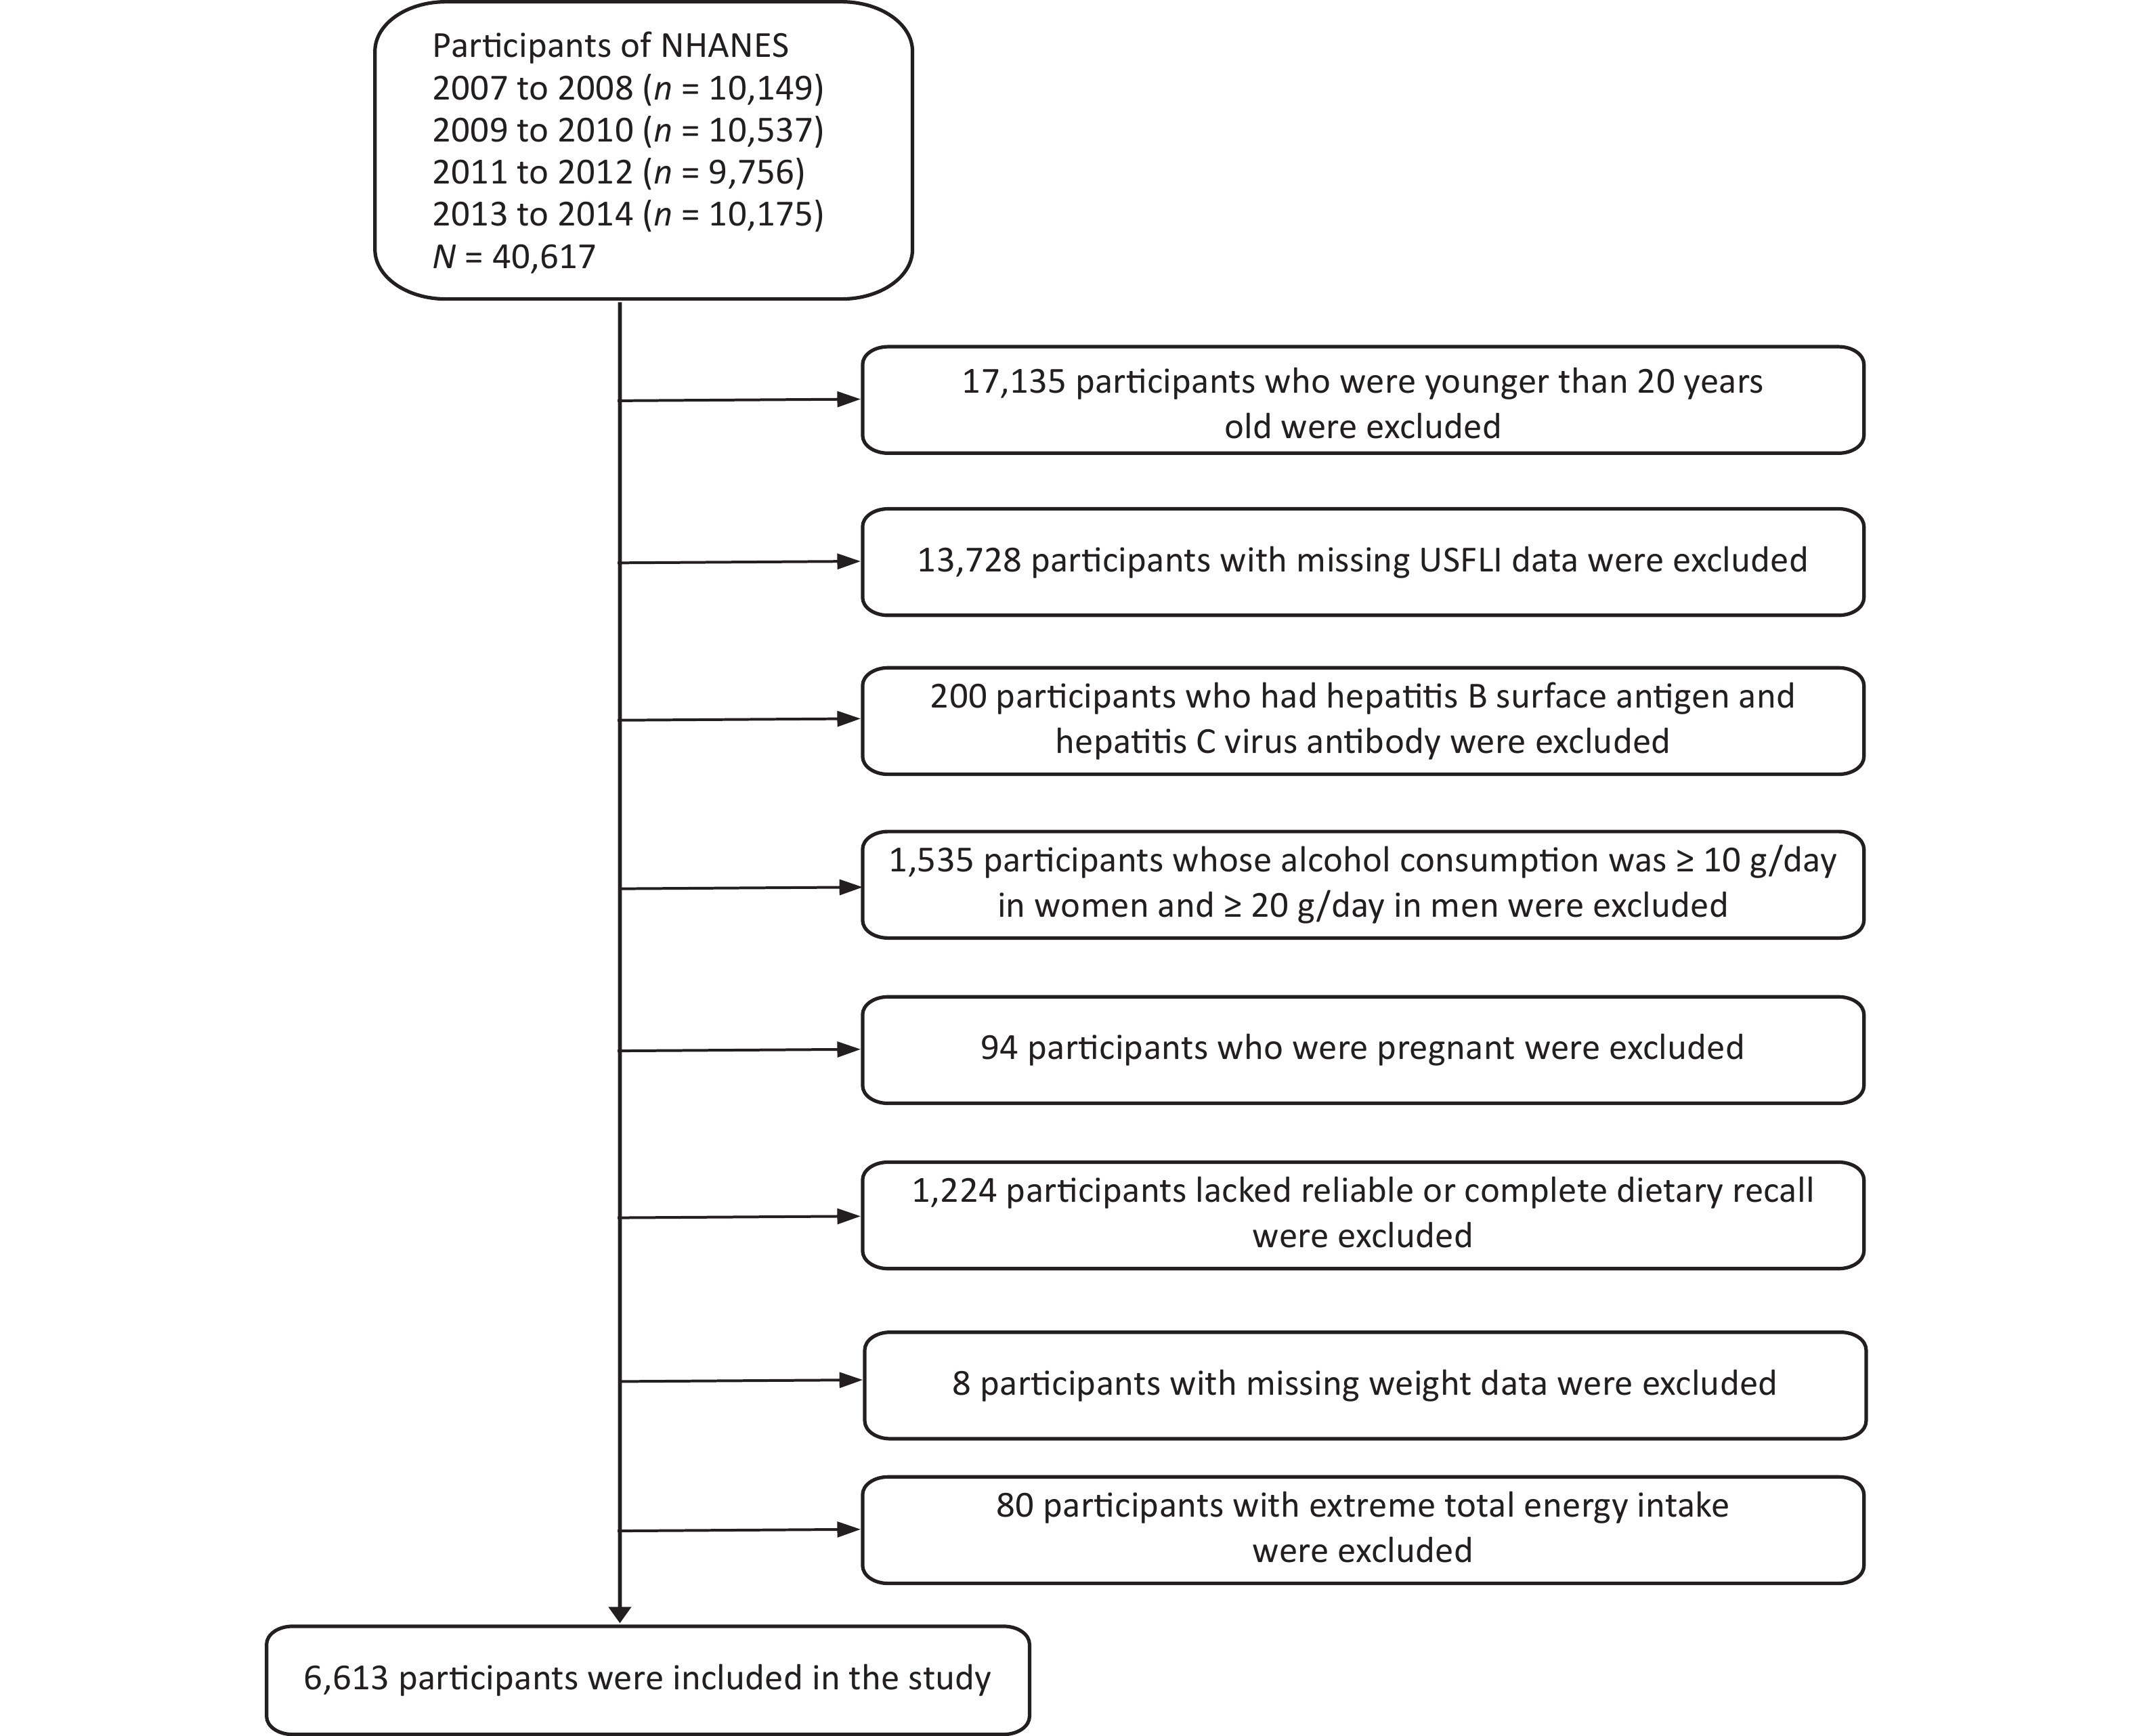
This study analyzed continuous National Health and NHANES data from 2007 to 2014. The NHANES datasets included 40,617 participants (20,180 males and 20,437 females) and 23,482 subjects aged 20 years or older were included. Participants with missing information on the United States fatty liver index (USFLI) were excluded (n = 13,728). Furthermore, 200 individuals with hepatitis B surface antigens and hepatitis C virus antibodies were excluded. Subsequently, participants whose alcohol consumption was ≥ 10 g/day in women and ≥ 20 g/day in men (n = 1,535) were excluded. Finally, 6,613 participants (3,067 males and 3,546 females) were included in our analyses after excluding those who were pregnant (n = 94), lacked reliable or complete dietary recall (n = 1,224), had missing weight data (n = 8), and whose average energy intake was higher than the mean + 3 standard deviations (SDs) or less than the mean – 3 SDs (n = 80) (Figure 1).

Figure 1. Flow chart showing the eligible participants selection of the study. NHANES: National Health and Nutrition Examination Survey.
-
According to a previous study[46], NAFLD was defined based on the USFLI, which was previously validated. Patients with other causes of chronic liver disease and exposure to steatogenic medication were excluded. The USFLI was calculated based on age, race, waist circumference, fasting glucose, gamma glutamyl transferase, and fasting insulin level[47]. A USFLI cutoff value of ≥ 30 was used to define the presence of NAFLD[47]. As reported in previous studies, USFLI is a credible noninvasive measure of NAFLD and an independent predictor of liver-related and overall mortality[48-50]. The USFLI is calculated as follows: USFLI = [e^ (−0.8073 × non – Hispanic Black + 0.3485 × Mexican American + 0.0093 × Age + 0.6151 × ln (GGT) + 0.0249 × Waist Circumference + 1.1792 × ln (Insulin) + 0.8242 × ln (Glucose) – 14.7812) / {(1 + [e^ (-0.8073 × non – Hispanic Black + 0.3485 × Mexican American + 0.0093 × Age + 0.6151 × ln (GGT) + 0.0249 × Waist Circumference +1.1792 × ln (Insulin) + 0.8242 × ln (Glucose) – 14.7812)]} × 100.
The value for “non-Hispanic Black” and “Mexican American” is 1 if the person is of that ethnicity, and 0 if the person is not.
-
Dietary retinol intake was calculated using two 24-h dietary recall interviews in retinol activity equivalents (mcg)[51]. The first dietary recall interview was conducted in person at the mobile examination center, and the second interview was conducted by telephone 3–10 days later. Nutrient intake was calculated using the US Department of Agriculture Dietary Research Food and Nutrition Database for Dietary Studies[16]. Different sources of dietary retinol, such as the sources of animal-derived dietary retinol intake (milk and milk products; meat, poultry, fish and mixtures; eggs) and plant-derived dietary retinol intake (legumes, nuts and seeds; grain products; fruits; vegetables) were identified using the food codes. The detailed operating procedures are available at https://search. USA. gov/searches. Affiliate = agricultural research service earners and query = FNDDS + 2012. Dietary retinol intake from the two 24-h recalls was averaged and adjusted for energy intake for subsequent analyses. The dietary retinol intake (μg/1,000 kcal per day) was divided into quartiles. It should be noted that dietary retinol intake from supplements was not included in total dietary retinol intake. For animal-derived dietary retinol intake, 1 μg retinol activity equivalents (RAEs) was equal to 1 μg of all-trans retinol from animal foods. Plant-derived dietary retinol intake was estimated using the following Formula: 1 RAEs (μg) = 1/12 beta-carotene (μg) + 1/24 other provitamin A (μg)[51].
-
Potential confounding factors were adjusted in multivariate models, including sex (male and female), age (20–44 years, 45–59 years, 60–74 years and ≥ 75 years), race (Mexican-Americans, other Hispanics, non-Hispanic Whites, non-Hispanic Blacks and other races), BMI (normal: < 25 kg/m2; overweight: 25 to < 30 kg/m2; obese: ≥ 30 kg/m2), education level (under high school, high school, and above high school), annual household income (< $20,000, $20,000–$44,999, $45,000–$74,999, and ≥ $75,000), smoking status (smoking at least 100 cigarettes in life or not), vigorous recreational activity (yes or no), diabetes (yes or no), hypertension (yes or no), total cholesterol (TC) and uric acid (UA). Diabetes was defined based on the following conditions: 1) fasting blood glucose level ≥ 7.0 mmol/L, 2) 2-h plasma glucose level ≥ 11.1 mmol/L, 3) use of antidiabetic pills or insulin, or 4) self-reported diabetes diagnosed by a physician[52]. Hypertension was defined as mean systolic blood pressure ≥ 130 mmHg and/or mean diastolic blood pressure ≥ 80 mmHg, or the use of antihypertensive agents and self-reported physician diagnosis[53].
-
All eligible subjects (n = 6,613) were randomly divided into a training set (n1 = 4,609) and a validation set (n2 = 2,004) at a ratio of approximately 7:3, based on the deep learning of the ANN for proportional division[54,55]. The chi-square test was used for categorical variables (Student’s t-test for continuous variables) to compare differences between groups. The training set was used to select variables and establish a predictive ANN model. Subsequently, a validation set is used to test and evaluate the ANN models. All variable values were normalized on a scale of 0 to 1. The binary variables used were 0 and 1 to indicate ‘No’ and ‘Yes,’ respectively. Non-binary variables were normalized as X’m = (Xm – Xmin)/ (Xmax – Xmin). Continuous variables were expressed as mean values [standard deviation (SD)], and categorical variables were reported as percentages of frequency.
The model analysis comprised three stages. In the first stage, the training set was used to identify predictors of NAFLD risk using logistic regression analysis. Univariate logistic regression was used to explore predictors of NAFLD risk. Dietary retinol levels were divided into quartiles with the first quartile (Q1) set as the reference category. Two models were created: Model 1 included sex and age; in Model 2, we further adjusted for race, educational level, smoking status, recreational activities, annual household income, hypertension, diabetes, BMI, low-density lipoprotein (LDL), UA, and TC levels. Odds ratios (ORs) and 95% confidence intervals (CIs) were used to quantify correlations. In the second stage, a neural network model was established to predict the NAFLD risk by incorporating the significant predictors identified in the first stage. The ANN model was performed after selecting all potentially important risk predictors (P < 0.05) from the univariate logistic models in our study. A neural network is generally composed of input, hidden, and output layers, which function by receiving information, processing information, and calculating responses, respectively. As a mathematical or computational model, ANN attempt to simulate the structure or function of biological neural networks[56]. In addition, as a nonlinear statistical data modeling tool, it can model the complex association between the input and output. To our knowledge, different types of neural networks, such as feed-forward neural networks, radial basis function (RBF) networks, and Kohonen self-organizing networks, have been used to predict risk predictors related to chronic diseases[57,58]. Previous studies demonstrated that the back-propagation (BP) delta regular network is a feed-forward neural network, which is the most popular choice owing to its relative simplicity and stability[41]. Thus, the BP network was used for analysis in our study.
In the third stage, the performance of the risk assessment model (using the training and validation sets) was evaluated using accuracy, sensitivity (Se), specificity (Sp), Youden index, and Receiver operating characteristic (ROC) curve analysis to assess the discriminability of the model. An accuracy index was used to measure the percentage of correctly diagnosed participants. Sensitivity was the proportion of participants who met the target condition and yielded positive test results. Specificity was defined as the proportion of participants who did not have any target conditions and gave negative test results. The ROC curves graphically show true positives versus false positives at a range of cutoffs, and the selection of the optimal cutoff for the clinical support used. The Youden index is the sum of Se and Sp minus one (Se + Sp - 1)[59]. All statistical analyses were performed using SPSS Modeler 18.3 and Stata 15.0. Appropriate sample weights and units were used as nationally representative estimates in the analyses. A two-tailed P < 0.05 was considered as statistically significant for all analyses.
-
Supplementary Table S1 (available in www.besjournal.com) summarizes the patient characteristics in the training and validation sets. There were 2,124 males and 2,485 females (53.92%) in the training set, and 943 males and 1,061 females (52.94%) in the validation set. In our study, the differences between the training and validation sets were not statistically significant, except for race, which suggests that the subjects in these two datasets had similar characteristics (P > 0.05).
Characteristic Training set (n = 4,609 ) Validation set (n = 2,004) P-value Sex, n (%) 0.455 Males 2,124 (46.08) 943 (47.06) Females 2,485 (53.92) 1,061 (52.94) Age (years), n (%) 0.721 20– 1,809 (39.25) 790 (39.42) 45– 1,149 (24.93) 494 (24.65) 60– 1,134 (24.60) 470 (23.45) ≥ 75 517 (11.22) 250 (12.48) Race/Ethnicity, n (%) 0.009 Mexican American 751 (16.29) 289 (14.42) Other hispanic 535 (11.61) 203 (10.13) Non-hispanic white 2,069 (44.89) 931 (46.46) Non-hispanic black 817 (17.73) 383 (19.11) Other/multiracial 437 (9.48) 198 (9.88) BMI (kg/m2), n (%) 0.166 < 25 1,251 (27.18) 573 (28.64) 25–30 1,531 (33.27) 674 (33.68) ≥ 30 1,820 (39.55) 754 (37.68) Educational level, n (%) 0.182 < High school 1,203 (26.15) 501 (25.00) High school 1,056 (22.95) 441 (22.01) > High school 2,342 (50.90) 1,062 (52.99) Annual household income (CNY), n (%) 0.081 < 20,000 933 (22.21) 408 (21.19) 20,000– 1,614 (36.11) 669 (34.76) 45,000– 850 (19.02) 340 (17.66) ≥ 75,000 1,013 (22.66) 508 (26.39) Smoking status, n (%) 0.446 Yes 1,906 (41.37) 801 (39.97) No 2,701 (58.63) 1,203 (60.03) Vigorous recreational activity, n (%) 0.350 Yes 895 (19.42) 406 (20.26) No 3,714 (80.58) 1,598 (79.74) Hypertension, n (%) 0.455 Yes 2,198 (47.69) 989 (49.35) No 2,411 (52.31) 1,015 (50.65) Diabetes, n (%) 0.362 Yes 981 (21.28) 434 (21.66) No 3,628 (78.72) 1,570 (78.34) Cholesterol, mg/dL 192.63 ± 41.61 193.59 ± 40.98 0.386 Uric Acid, mg/dL 5.45 ± 1.40 5.51 ± 1.44 0.112 High-density lipoprotein, mg/dL 52.26 ± 14.45 52.82 ± 15.35 0.155 Low-density lipoprotein, mg/dL 114.87 ± 35.60 115.39 ± 35.02 0.583 Average energy intake, kcal/day 1,898.36 ± 703.84 1,925.17 ± 696.28 0.153 Total dietary retinol intake, RAEs, μg/1,000 kcal/day 335.31 ± 288.18 330.68 ± 269.25 0.540 Animal-derived dietary retinol intake, RAEs, μg/1,000 kcal/day 127.36 ± 168.10 126.82 ± 183.63 0.907 Plant-derived dietary retinol intake, RAEs, μg/1,000 kcal/day 189.62 ± 231.38 186.58 ± 190.60 0.605 Note. BMI: Body Mass Index, RAEs: retinol activity equivalents. Table S1. Characteristics of the participants in training set and validation set
The individuals with NAFLD in the training set included 901 males (52.88%) and 803 females (47.12%) (Table 1). We found that risk predictors such as sex, age, race, BMI, education level, annual household income, smoking status, vigorous recreational activity, hypertension, diabetes, uric acid (UA), high-density lipoprotein (HDL), animal-derived dietary retinol intake, and plant-derived dietary retinol intake showed statistically significant differences between participants with NAFLD and healthy controls in the training set (P < 0.05). Participants with NAFLD tended to be older, were more likely to be Mexican Americans, and had lower educational levels, annual household incomes, vigorous recreational activity levels, and HDL and plant-derived dietary retinol intake than the control group. In addition, participants with NAFLD were more likely to be obese, smokers, have hypertension and diabetes, and have higher levels of serum UA and animal-derived dietary retinol intake than those without NAFLD (P < 0.01).
Characteristics NAFLD P-value No (n = 2,905) Yes (n = 1,704) Sex, n (%) < 0.001 Males 1,223 (42.10) 901 (52.88) Females 1,682 (57.90) 803 (47.12) Age (years), n (%) < 0.001 20– 1,317 (45.34) 492 (28.87) 45– 681 (23.44) 468 (27.46) 60– 606 (20.86) 528 (30.99) ≥ 75 301 (10.36) 216 (12.68) Race/ethnicity, n (%) < 0.001 Mexican American 344 (11.84) 407 (23.88) Other hispanic 328 (11.29) 207 (12.15) Non-hispanic white 1,271 (43.76) 798 (46.84) Non-hispanic black 636 (21.89) 181 (10.62) Other/multiracial 326 (11.22) 111 (6.51) BMI (kg/m2), n (%) < 0.001 < 25 1,172 (40.41) 79 (4.64) 25–30 1,087 (37.48) 444 (26.09) ≥ 30 641 (22.11) 1,179 (69.27) Educational level, n (%) < 0.001 < High school 624 (21.51) 579 (34.06) High school 665 (22.92) 391 (23.00) > High school 1,612 (55.57) 730 (42.94) Annual household income (CNY), n (%) < 0.001 < 20,000 539 (19.40) 394 (24.16) 20,000– 951 (34.22) 663 (40.65) 45,000– 558 (20.08) 292 (17.90) ≥ 75,000 731 (26.30) 282 (17.29) Smoking status, n (%) < 0.001 Yes 1,088 (37.48) 818 (48.00) No 1,815 (62.52) 886 (52.00) Vigorous recreational activity, n (%) < 0.001 Yes 709 (24.41) 186 (10.92) No 2,196 (75.59) 1,518 (89.08) Hypertension, n (%) < 0.001 Yes 1,133 (39.00) 1,065 (62.50) No 1,772 (61.00) 639 (37.50) Diabetes, n (%) < 0.001 Yes 343 (11.81) 638 (37.44) No 2,562 (88.19) 1,066 (62.56) Cholesterol, mg/dL 191.81 ± 41.45 194.03 ± 41.86 0.080 Uric Acid, mg/dL 5.13 ± 1.29 5.99 ± 1.42 < 0.001 High-density lipoprotein, mg/dL 56.00 ± 14.51 45.87 ± 11.91 < 0.001 Low-density lipoprotein, mg/dL 114.76 ± 35.28 115.08 ± 36.17 0.766 Average energy intake, kcal per day 1,892.93 ± 696.32 1,907.61 ± 716.59 0.494 Total dietary retinol intake, RAEs, μg/1,000 kcal per day 339.77 ± 292.55 327.69 ± 280.49 0.170 Animal-derived dietary retinol intake, RAEs, μg/1,000 kcal per day 122.52 ± 144.50 135.60 ± 201.85 0.011 Plant-derived dietary retinol intake, RAEs, μg/1,000 kcal per day 200.37 ± 253.68 171.29 ± 185.98 < 0.001 Note. Continuous variables are represented by mean ± standard deviation (SD). NAFLD: non-alcoholic fatty liver disease, BMI: Body Mass Index, RAEs: retinol activity equivalents. Table 1. Participant characteristics in training data set by NAFLD status
-
The predictors of NAFLD risk identified in the logistic regression analysis of the training set are shown in Table 2. In univariate logistic regression models, race (OR = 0.634, 95% CI: 0.588–0.684), vigorous recreational activity (OR = 0.679, 95% CI: 0.540–0.853) and HDL (OR = 0.955, 95% CI: 0.948–0.961) were inversely associated with NAFLD risk. Moreover, there were significant positive correlations between NAFLD risk and the following predictors: age (OR = 1.251, 95% CI: 1.139–1.374), BMI (OR = 4.386, 95% CI: 3.870–4.971), smoking (OR = 1.353, 95% CI: 1.149–1.594), hypertension (OR = 1.546, 95% CI: 1.289–1.855), diabetes (OR = 2.423, 95% CI: 1.985–2.957) and UA (OR = 1.291, 95% CI: 1.212–1.375).
Variables B SE Wald χ2 P OR (95% CI) Age 0.224 0.048 22.004 < 0.001 1.251 (1.139–1.374) BMI 1.478 0.064 535.961 < 0.001 4.386 (3.870–4.971) Race/ethnicity −0.455 0.038 140.054 < 0.001 0.634 (0.588–0.684) Smoking 0.302 0.084 13.085 < 0.001 1.353 (1.149–1.594) Vigorous recreational activity −0.387 0.117 11.018 0.001 0.679 (0.540–0.853) Hypertension 0.436 0.093 21.982 < 0.001 1.546 (1.289–1.855) Diabetes 0.885 0.102 75.776 < 0.001 2.423 (1.985–2.957) HDL −0.046 0.004 172.778 < 0.001 0.955 (0.948–0.961) Uric Acid 0.256 0.032 63.325 < 0.001 1.291 (1.212–1.375) Note. NAFLD: non-alcoholic fatty liver disease, SE: standard error, OR: Odds ratios, CI: confidence intervals, BMI: Body Mass Index, HDL: High-density lipoprotein. Table 2. Analysis of risk factors for NAFLD using univariate logistic regression model
The weighted ORs (95% CIs) for NAFLD as a dichotomous outcome based on the quartiles of total dietary retinol intake, animal-, and plant-derived dietary retinol intake are shown in Table 3. In the table, outcomes are given as classified variables (quartiles) for total dietary retinol intake, animal-derived dietary retinol intake, and plant-derived dietary retinol intake due to evidence of nonlinearity in some situations. Nevertheless, the P-value for the trend computed from the models was included in our analyses, which included dietary retinol as a reference for continuous exposure. In univariate logistic regression models, we found that the ORs (95% CIs) of NAFLD for the highest quartile of plant-derived dietary retinol intake (OR = 0.75, 95% CI: 0.57–0.99) were inversely associated with NAFLD risk compared to the lowest quartile of intake by adjusting for confounding factors such as sex, age, race, education level, smoking status, recreational activities, income level, hypertension, diabetes, BMI, LDL, UA and TC (model 2).
Variables Crude OR (95% CI) P-trend Model 1 OR (95% CI) P-trend Model 2 OR (95% CI) P-trend Total dietary retinol intake
(RAEs, μg/1,000 kcal per day)0.005 0.001 0.176 < 190.54 1.00 (ref.) 1.00 (ref.) 1.00 (ref.) 190.54–284.02 1.11 (0.89–1.38) 1.02 (0.81–1.28) 1.10 (0.80–1.51) 284.02–422.22 1.12 (0.94–1.34) 1.01 (0.82–1.25) 1.03 (0.79–1.34) ≥ 422.22 0.79 (0.66–0.95)* 0.70 (0.57–0.87)** 0.86 (0.65–1.15) Animal-derived dietary retinol
intake (RAEs, μg/1,000 kcal per day)0.339 0.853 0.559 < 59.37 1.00 (ref.) 1.00 (ref.) 1.00 (ref.) 59.37–105.57 1.04 (0.83–1.29) 0.97 (0.78–1.19) 1.03 (0.80–1.33) 105.57–165.14 1.33 (1.07–1.67)* 1.25 (1.00–1.56)* 1.21 (0.90–1.61) ≥ 165.14 1.07 (0.85–1.36) 0.98 (0.76–1.26) 0.90 (0.63–1.26) Plant-derived dietary retinol intake
(RAEs, μg/1,000 kcal per day)< 0.001 < 0.001 0.042 < 70.22 1.00 (ref.) 1.00 (ref.) 1.00 (ref.) 70.22–135.01 0.89 (0.73–1.09) 0.89 (0.72–1.10) 0.95 (0.72–1.27) 135.01–253.74 0.84 (0.67–1.05) 0.81 (0.64–1.04) 0.91 (0.67–1.24) ≥ 253.74 0.64 (0.50–0.82)** 0.60 (0.46–0.79)** 0.75 (0.57–0.99)* Note. Model 1 is adjusted for sex and age. Model 2 was adjusted for sex, age, race, education level, smoking status, physical activity, income level, hypertension, diabetes, BMI, LDL, UA, and TC levels. The lowest dietary retinol intake quartile was used as the reference group. The results are survey-weighted. *P < 0.05, **P < 0.01. Tests for trends based on variables containing median values for each quartile. NAFLD: non-alcoholic fatty liver disease, OR: Odds ratios, CI: confidence intervals, RAEs: retinol activity equivalents. Table 3. Weighted ORs and 95% CIs for NAFLD according to dietary retinol intake quartile (μg /1,000 kcal per day) using the univariate logistic regression model
-
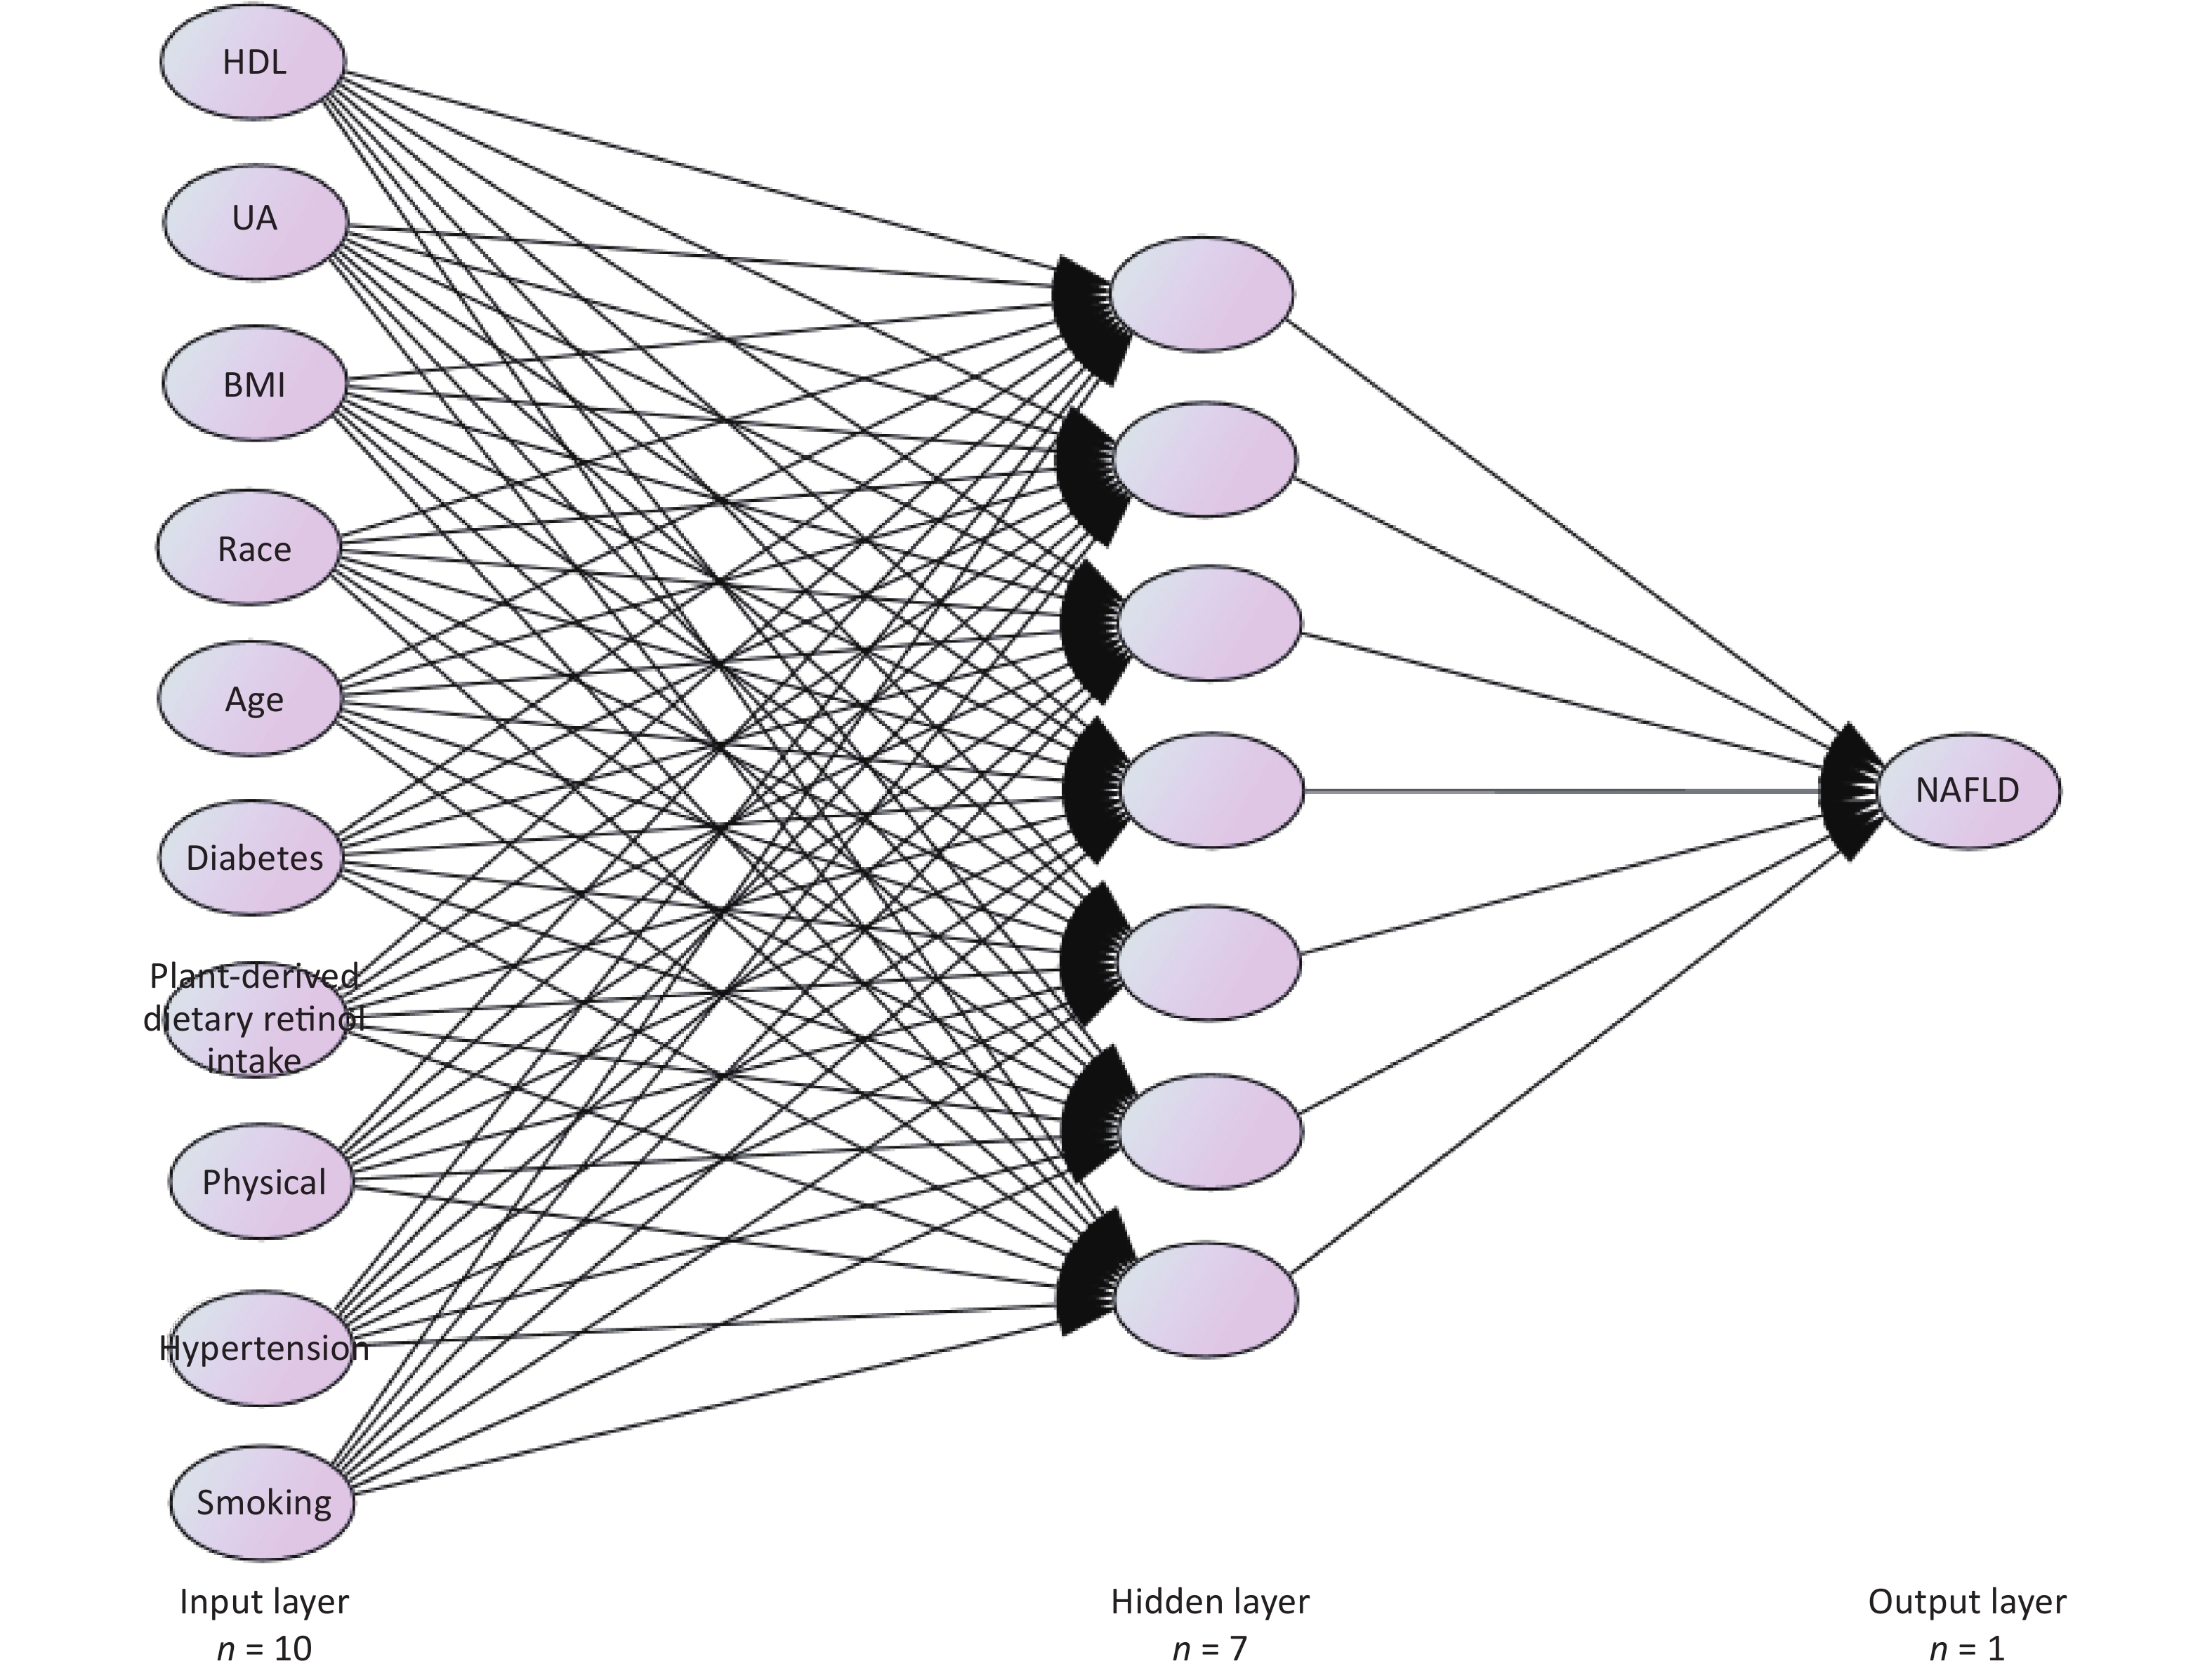
An ANN model was established based on the NAFLD risk predictors obtained from the logistic regression analysis. The input variables for the ANN model included age, race, BMI, smoking status, recreational activities, hypertension, diabetes, HDL, UA, and plant-derived dietary retinol intake. The output variable is a binary variable indicating whether an individual has NAFLD. The structure of the BP neural network consists of three layers (Figure 2). These parameters were selected based on previous studies[36,37]. We set the training parameters (e.g., learning rate and momentum) to their default values. The Levenberg-Marquardt algorithm was used as the training function. The neural network was trained for over 100 epochs. It is usually optimal to remove 20% of the input units and 50% of the hidden units because this simple method can prevent the overfitting of neural networks[60]. To ensure that the output was not heavily skewed toward the dominant class, each data point was weighted according to its outcome ratio. The ANN model corresponding to the prediction variable, which was the probability of having NAFLD, had 10 neurons in the input layer, seven neurons in the hidden layer, and one neuron in the output layer.
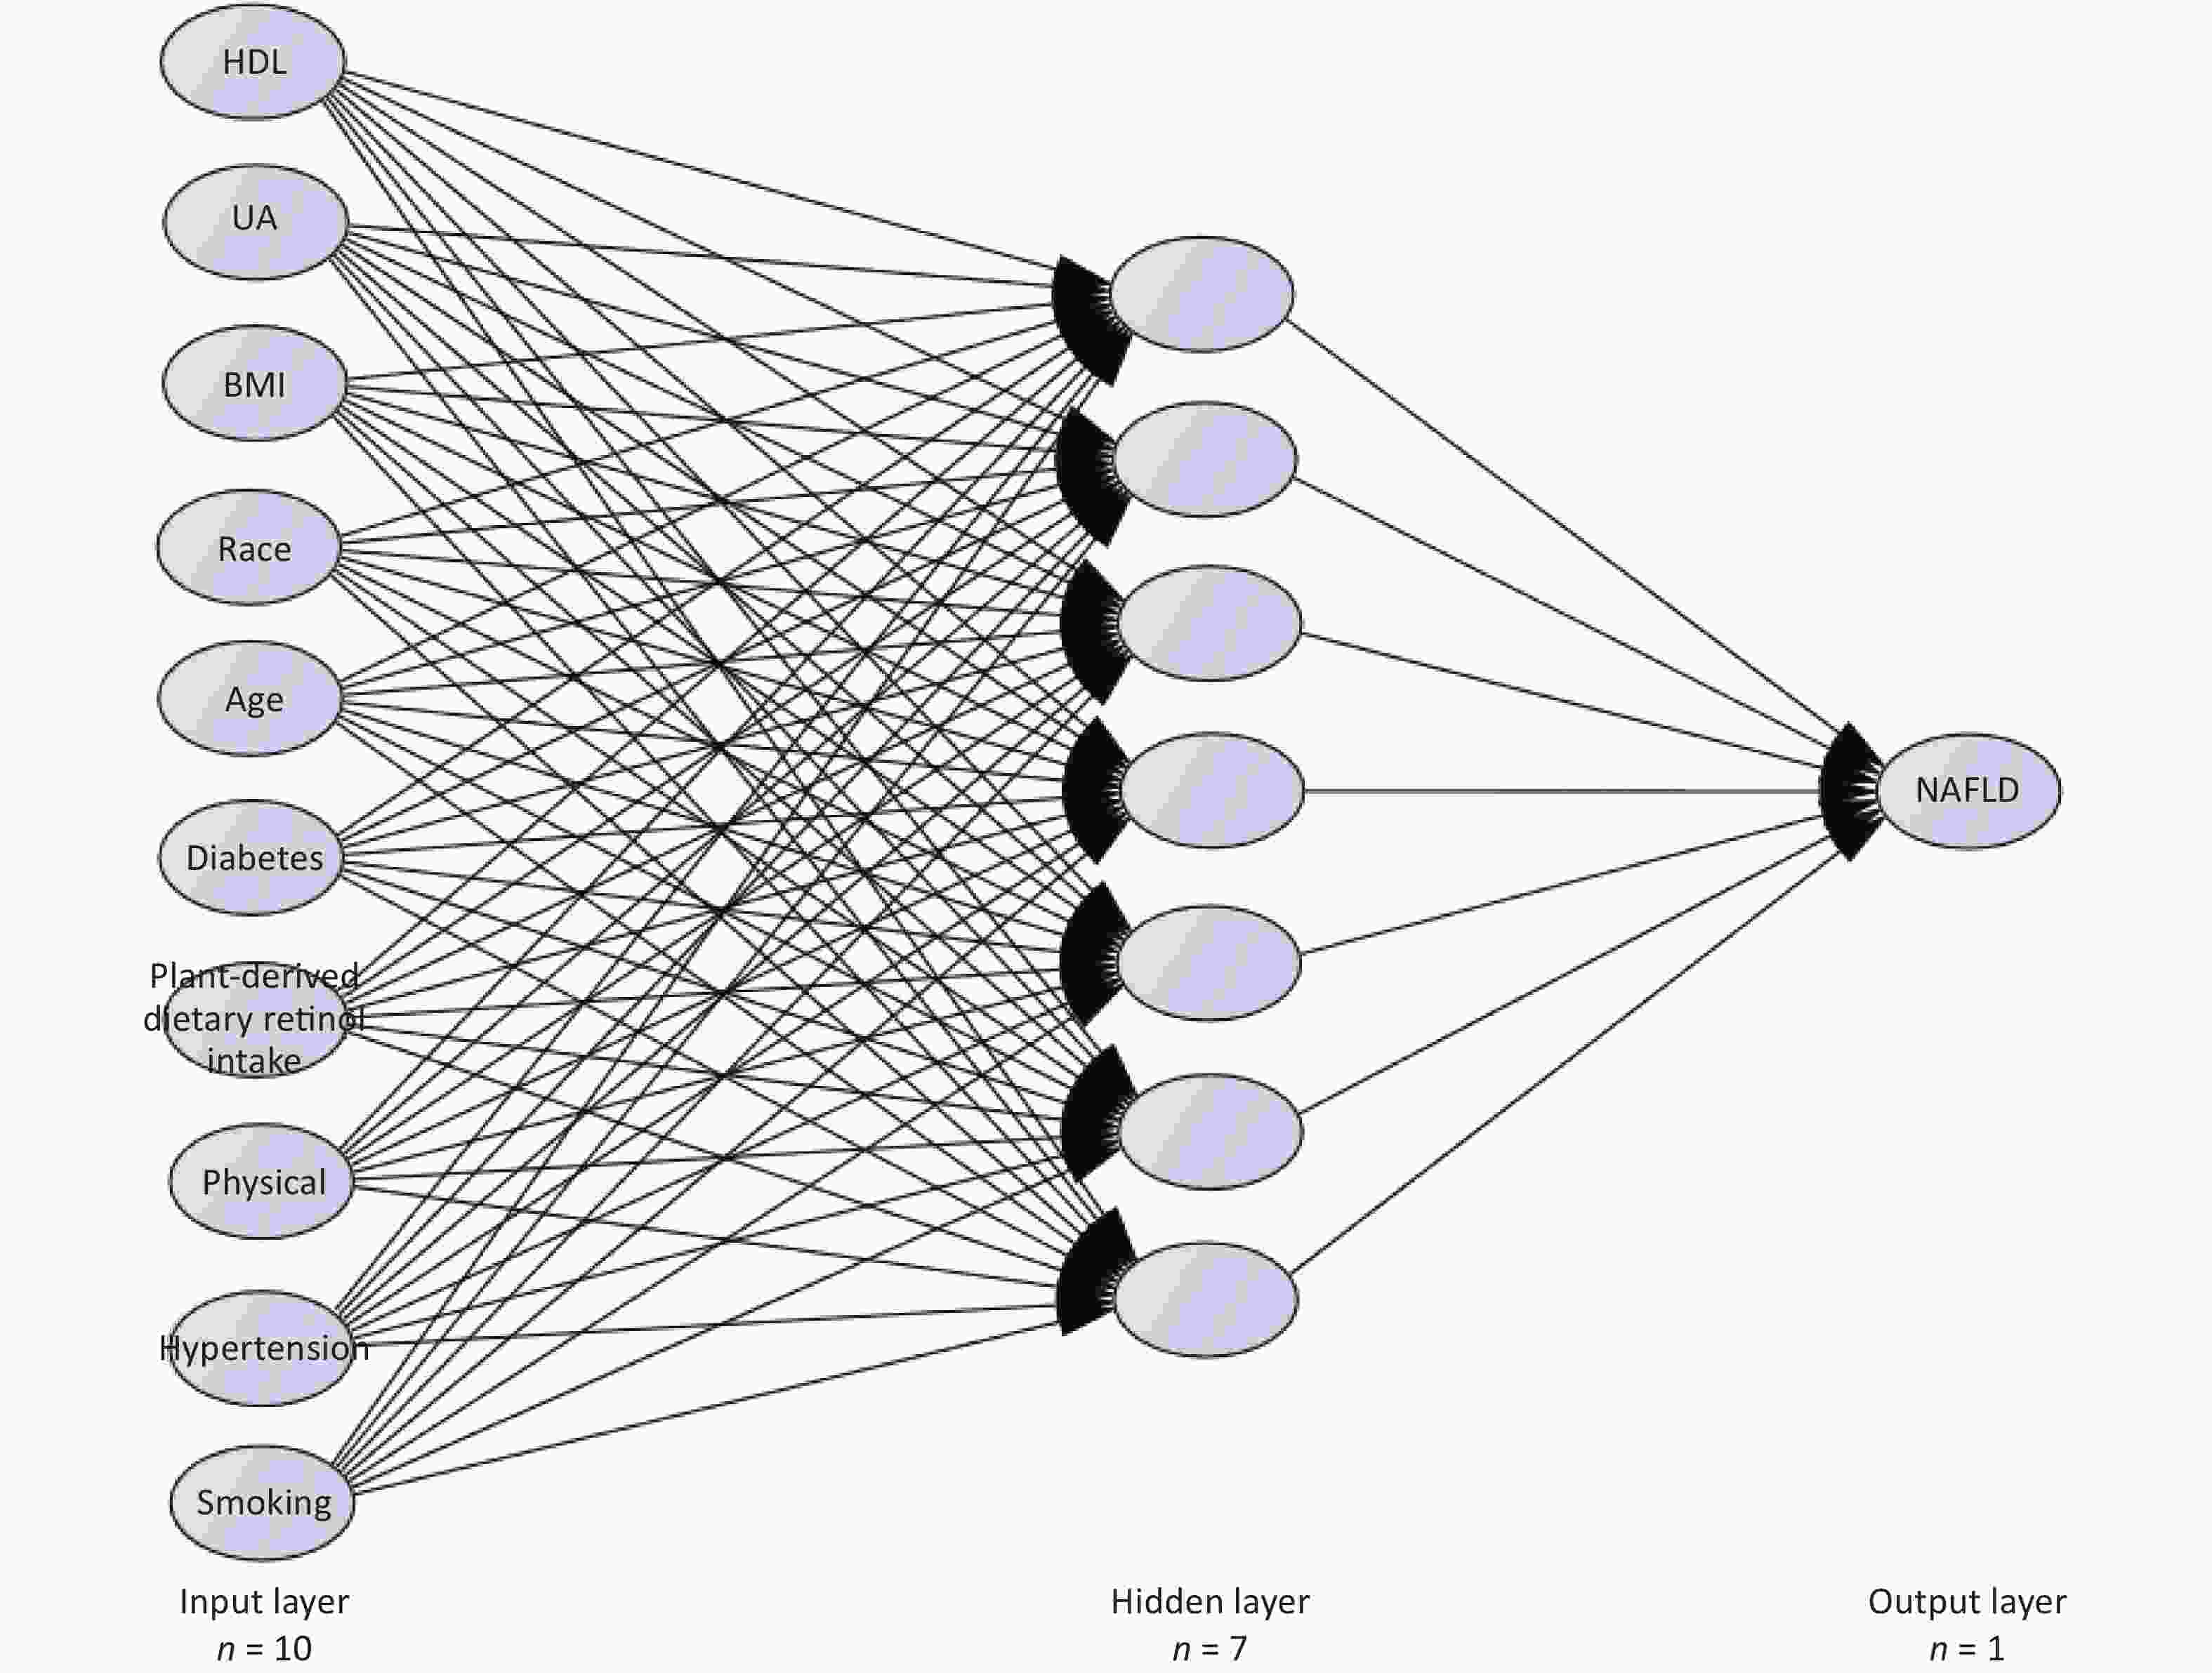
Figure 2. Graphic representation of the basic architecture of artificial neural network (ANN) model used in the study for predictors analyzed for NALFD risk in training set. NAFLD: non-alcoholic fatty liver disease, HDL: high-density lipoprotein, UA: uric acid, BMI: Body Mass Index.
-
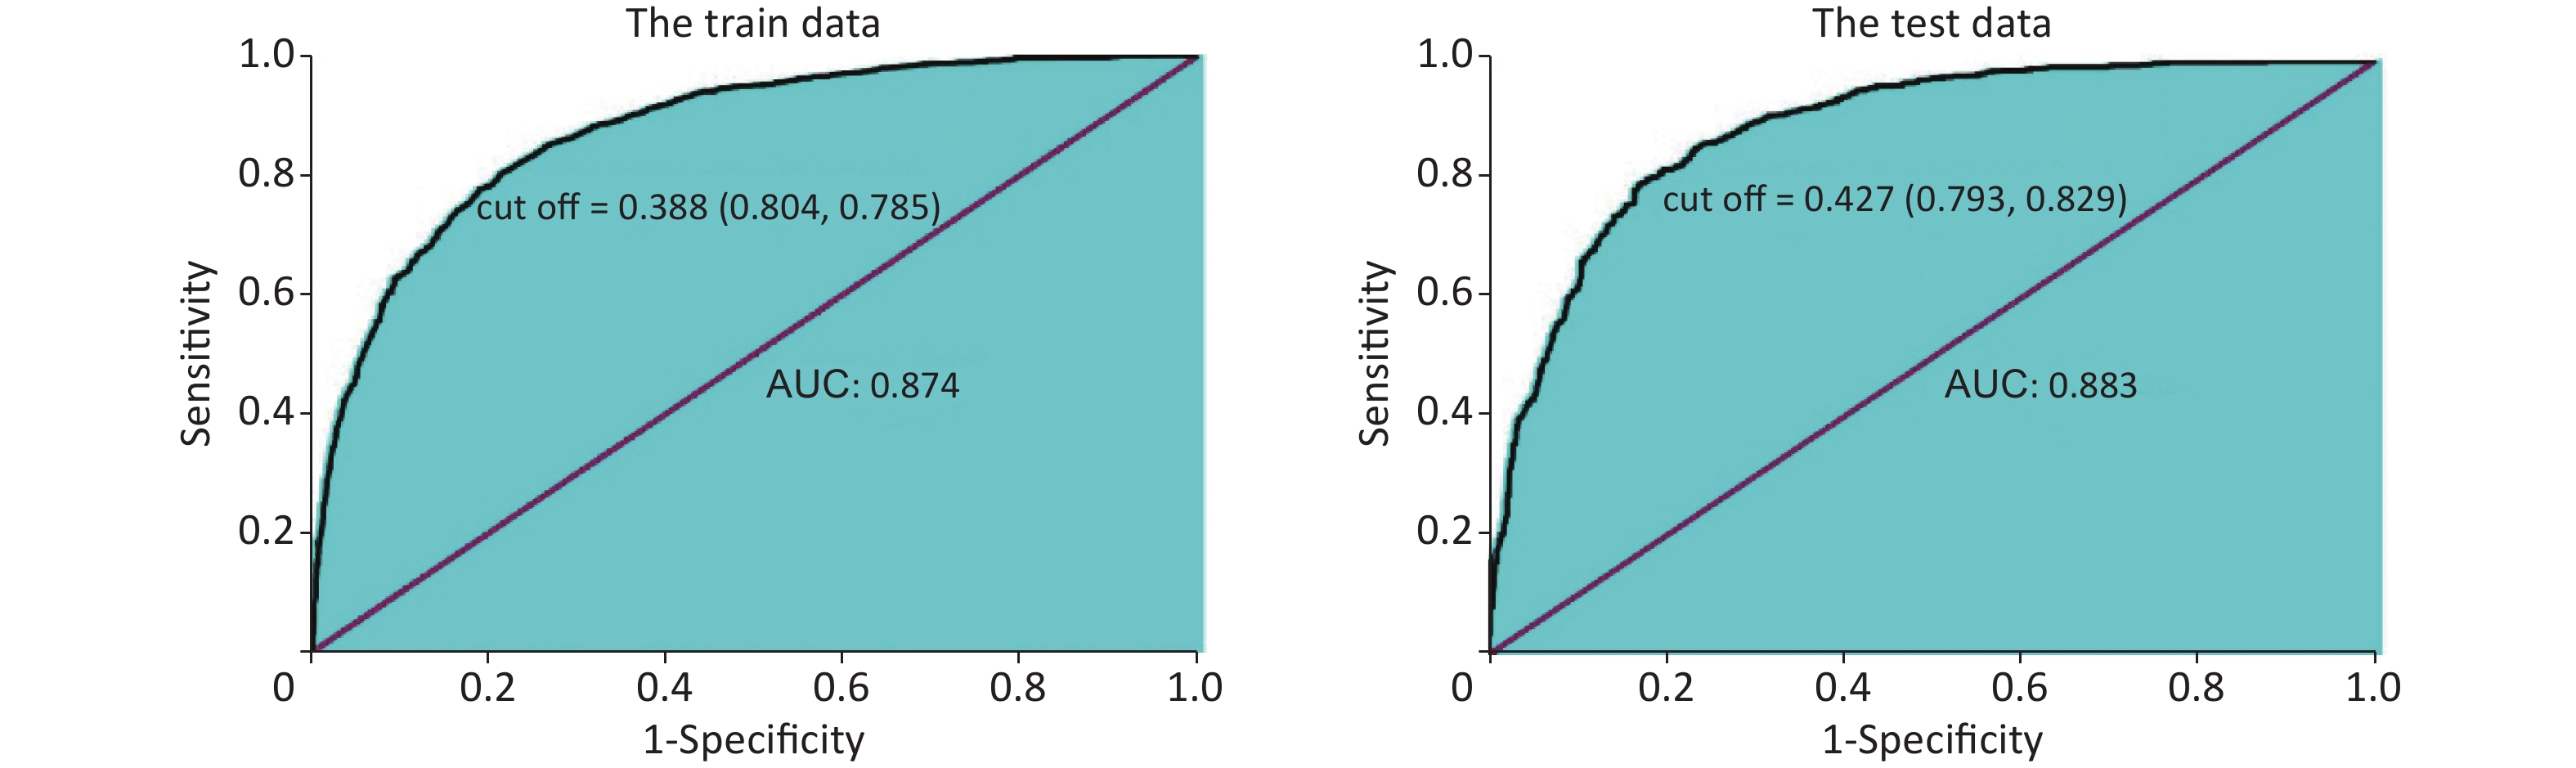
Figure 3 shows the areas under the ROC curves for the training and validation sets of the ANN model. The area under the receiver operating characteristic curve (AUC) was 0.874 and 0.883 for the training and validation sets, respectively. Therefore, a well-trained ANN model with high accuracy and large AUC can successfully predict the individual risk of NAFLD. The cutoff values of the incidence probability of NAFLD were 0.388 in the training set and 0.427 in the validation set, indicating that NAFLD will occur when the probability of incidence is greater than 0.388.
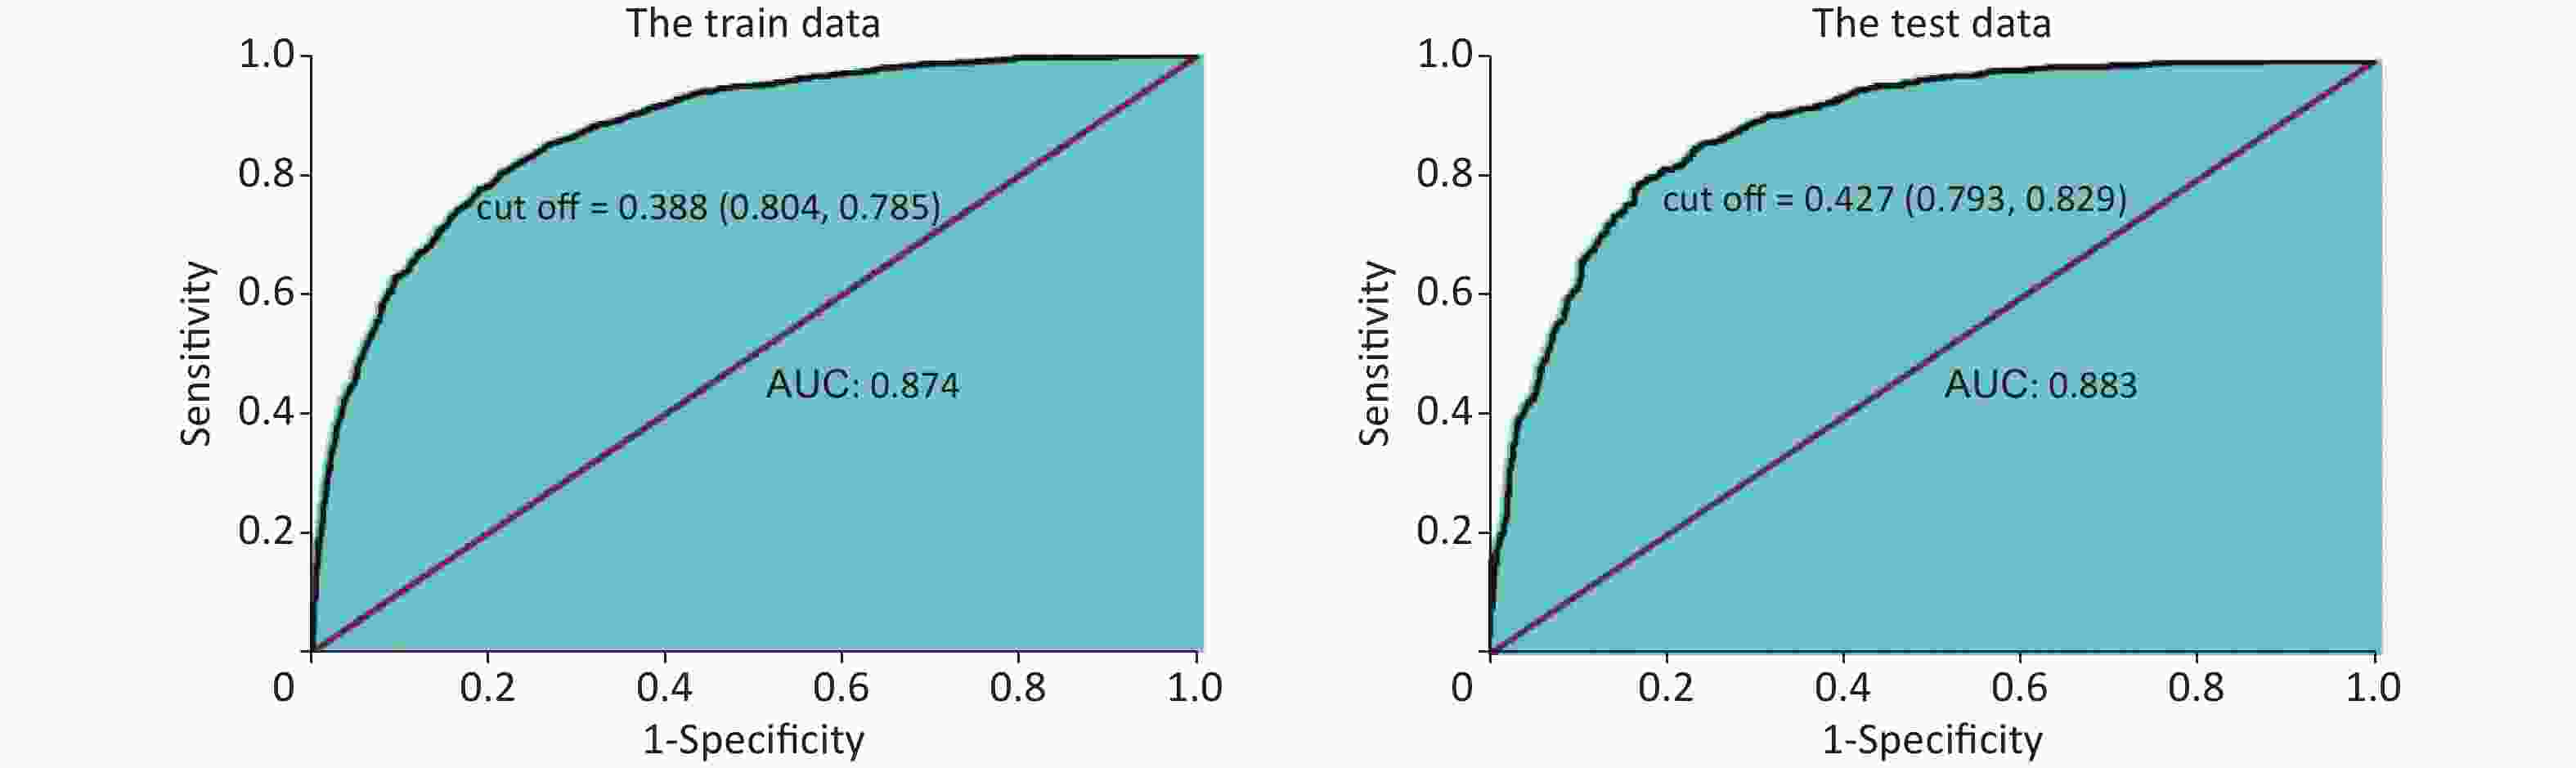
Figure 3. The receiver operating characteristic (ROC) curves obtained from the artificial neural network (ANN) model in training and test sets. AUC: area under the curve.
Table 4 shows that the accuracy indices of the training set and validation set are 0.807 and 0.800 for the ANN, respectively. The Se, Sp, and Youden index of the training set and validation set were 0.804, 0.785, and 0.589 and 0.793, 0.829, and 0.622 for the ANN, respectively. The AUC of the ANN model were 0.874 for the training set and 0.883 for the validation set. The accuracy, Se, Sp, Youden index and AUC values were 0.798, 0.697, 0.856, 0.553 and 0.871 for logistic regression, respectively. So, the ability of the ANN to predict the risk of NAFLD was significantly greater than that of logistic regression model.
Indicator ANN Logistic regression Training set (n = 4,609) Validation set (n = 2,004) Accuracy 0.807 0.800 0.798 Sensitivity 0.804 0.793 0.697 Specificity 0.785 0.829 0.856 Yuden index 0.589 0.622 0.553 AUC (95% CI) 0.874 (0.864–0.884) 0.883 (0.868–0.898) 0.871 (0.861–0.881) Note. ANN: artificial neural network, AUC: area under the curve. Table 4. The performance of artificial neural network (ANN) and logistic model
-
In this national population study of American adults, an ANN model was developed to predict the risk of developing NAFLD. The AUC of the ANN model was 0.874 for the training set and 0.883 for the validation set, and the cutoff values for the incidence probability of NAFLD were 0.388 and 0.427 in the training and validation sets, respectively. We found that NAFLD occurred if the probability of incidence was > 0.388. In addition, the predictive accuracy of NAFLD can be improved using this model. As systematic screening tools with great potential for clinical decision support, ANN can identify high-risk groups for NAFLD according to dietary information and construct specific prediction values for each patient based on their relevant risk predictors[41]. Plant-derived dietary retinol intake is an important predictor of NAFLD and is inversely related to the risk of NAFLD. To the best of our knowledge, this is the first study to demonstrate an ANN model combined with dietary retinol intake from different sources to predict the risk of NAFLD.
Several studies have reported contradictory results regarding the association between dietary retinol intake and the risk of NAFLD. A population-based study conducted in Iran indicated that dietary retinol consumption could lower the prevalence of NAFLD[9]. Vahid et al.[33] reported that dietary vitamin A intake negatively correlated with the risk of NAFLD. Moreover, a cohort study involving 241 rural Chinese adults reported a negative association between dietary retinol intake and NAFLD risk[34]. Conversely, a Korean study of 80 participants showed that vitamin A intake was higher in patients with NAFLD than in healthy controls[32]. A study conducted in Italy reported similar results[61]. These divergent results may be attributed to the lack of adjustment for potential confounders and discrepancies in ethnic backgrounds, dietary patterns, and study designs.
Provitamin A carotenoids are abundant in plant-based foods. In this study, the consumption of plant-derived dietary retinol (i.e., provitamin A carotenoids such as-carotene) was assessed by calculating the retinol mainly from plant foods such as legumes, beans, fruits, and vegetables. Studies reporting the association between dietary retinol intake from different sources and NAFLD risk are scarce. Our results showed that plant-derived dietary retinol exerts a protective effect against NAFLD. Although the mechanism underlying the association between plant-derived dietary retinol intake and NAFLD risk remains unclear, several possible mechanisms have been proposed. The higher mobilization of β-carotene for conversion into retinol may be responsible for the lower intake of plant-derived dietary retinol in patients with NAFLD than in healthy subjects in the present study[62]. Another possible explanation is that the bioavailability of carotenoids is greatly affected by food substrate[63-65]. Experimental studies have shown that carotenoids can reverse steatosis, inflammation, and fibrosis progression in NASH, attenuate insulin resistance, and prevent steatohepatitis by reducing the activation of macrophages and Kupffer cells[66]. Anti-inflammatory and antioxidant properties are the primary mechanisms of action of carotenoids, which modulate intracellular signaling pathways that affect gene expression and protein translation[67]. A previous study has indicated that the antioxidant properties of carotenoids may prevent liver damage and the risk of developing NAFLD by alleviating the injurious effects of oxidative stress on hepatocytes[68]. In addition, several studies have shown that high-sensitivity C-reactive protein (hs-CRP) and inflammatory cytokine IL-6 and TNF-α levels are associated with NAFLD risk, and are deemed biomarkers of inflammation leading to endothelial cell damage[69,70]. Several studies demonstrated that carotenoids and their metabolites were likely to modulate adiponectin expression[71,72]. In terms of its anti-inflammatory properties, adiponectin can effectively fight inflammation by inhibiting nuclear factor-kappa B (NFκB) action and TNF-α expression, thereby reducing the risk of NAFLD[73]. According to previous studies, the exact explanation for the association between dietary retinol intake and risk is still unclear. Hence, additional studies are required to explore these underlying mechanisms.
-
This study has some limitations. First, a causal relationship between dietary retinol intake and NAFLD could not be established due to the cross-sectional design of this study. Second, the application of two 24-h dietary recall datasets may have led to recall bias. In this study, dietary retinol intake from supplements was not included in the total dietary retinol intake. Therefore, we did not evaluate the relationship between dietary retinol intake from supplements and the risk of NAFLD. Third, the USFLI has superior sensitivity in identifying patients with NAFLD[10,47]. However, the USFLI cannot be used to classify NAFLD stages, and the correlation between dietary retinol intake and NAFLD risk remains unclear. Fourth, the possibility of residual confusion caused by other confounding factors cannot be excluded. Fifth, NAFLD status was estimated based on a previously validated index rather than a clinical diagnosis. Finally, ANN may be less practical for clinical applications because it is more complex than traditional statistical models[36,37] and requires greater statistical expertise.
-
Under the general trend of an increasing global prevalence rate of NAFLD, the US has become one of the countries with a high prevalence. Our study showed that plant-derived dietary retinol intake impacts NAFLD incidence in the US adult population. The ANN model, combined with plant-derived dietary retinol intake, could be applied to predict NAFLD risk, and predictive accuracy could be improved using the model. Additionally, NAFLD occurs when the probability of its incidence is greater than 0.388. These findings have a reference value for predicting the risk of NAFLD using an ANN model combined with plant-derived dietary retinol intake.
HTML
Subjects and Data Collection
NAFLD Definition and Measurement
Dietary Retinol Intake
Covariates
Statistical Analysis
Participant Characteristics
Predictors of NAFLD Risk
Prediction Models
Discriminatory Ability of Models
Limitations
 23060+Supplementary Materials.pdf
|

|

 Quick Links
 DownLoad: