


-
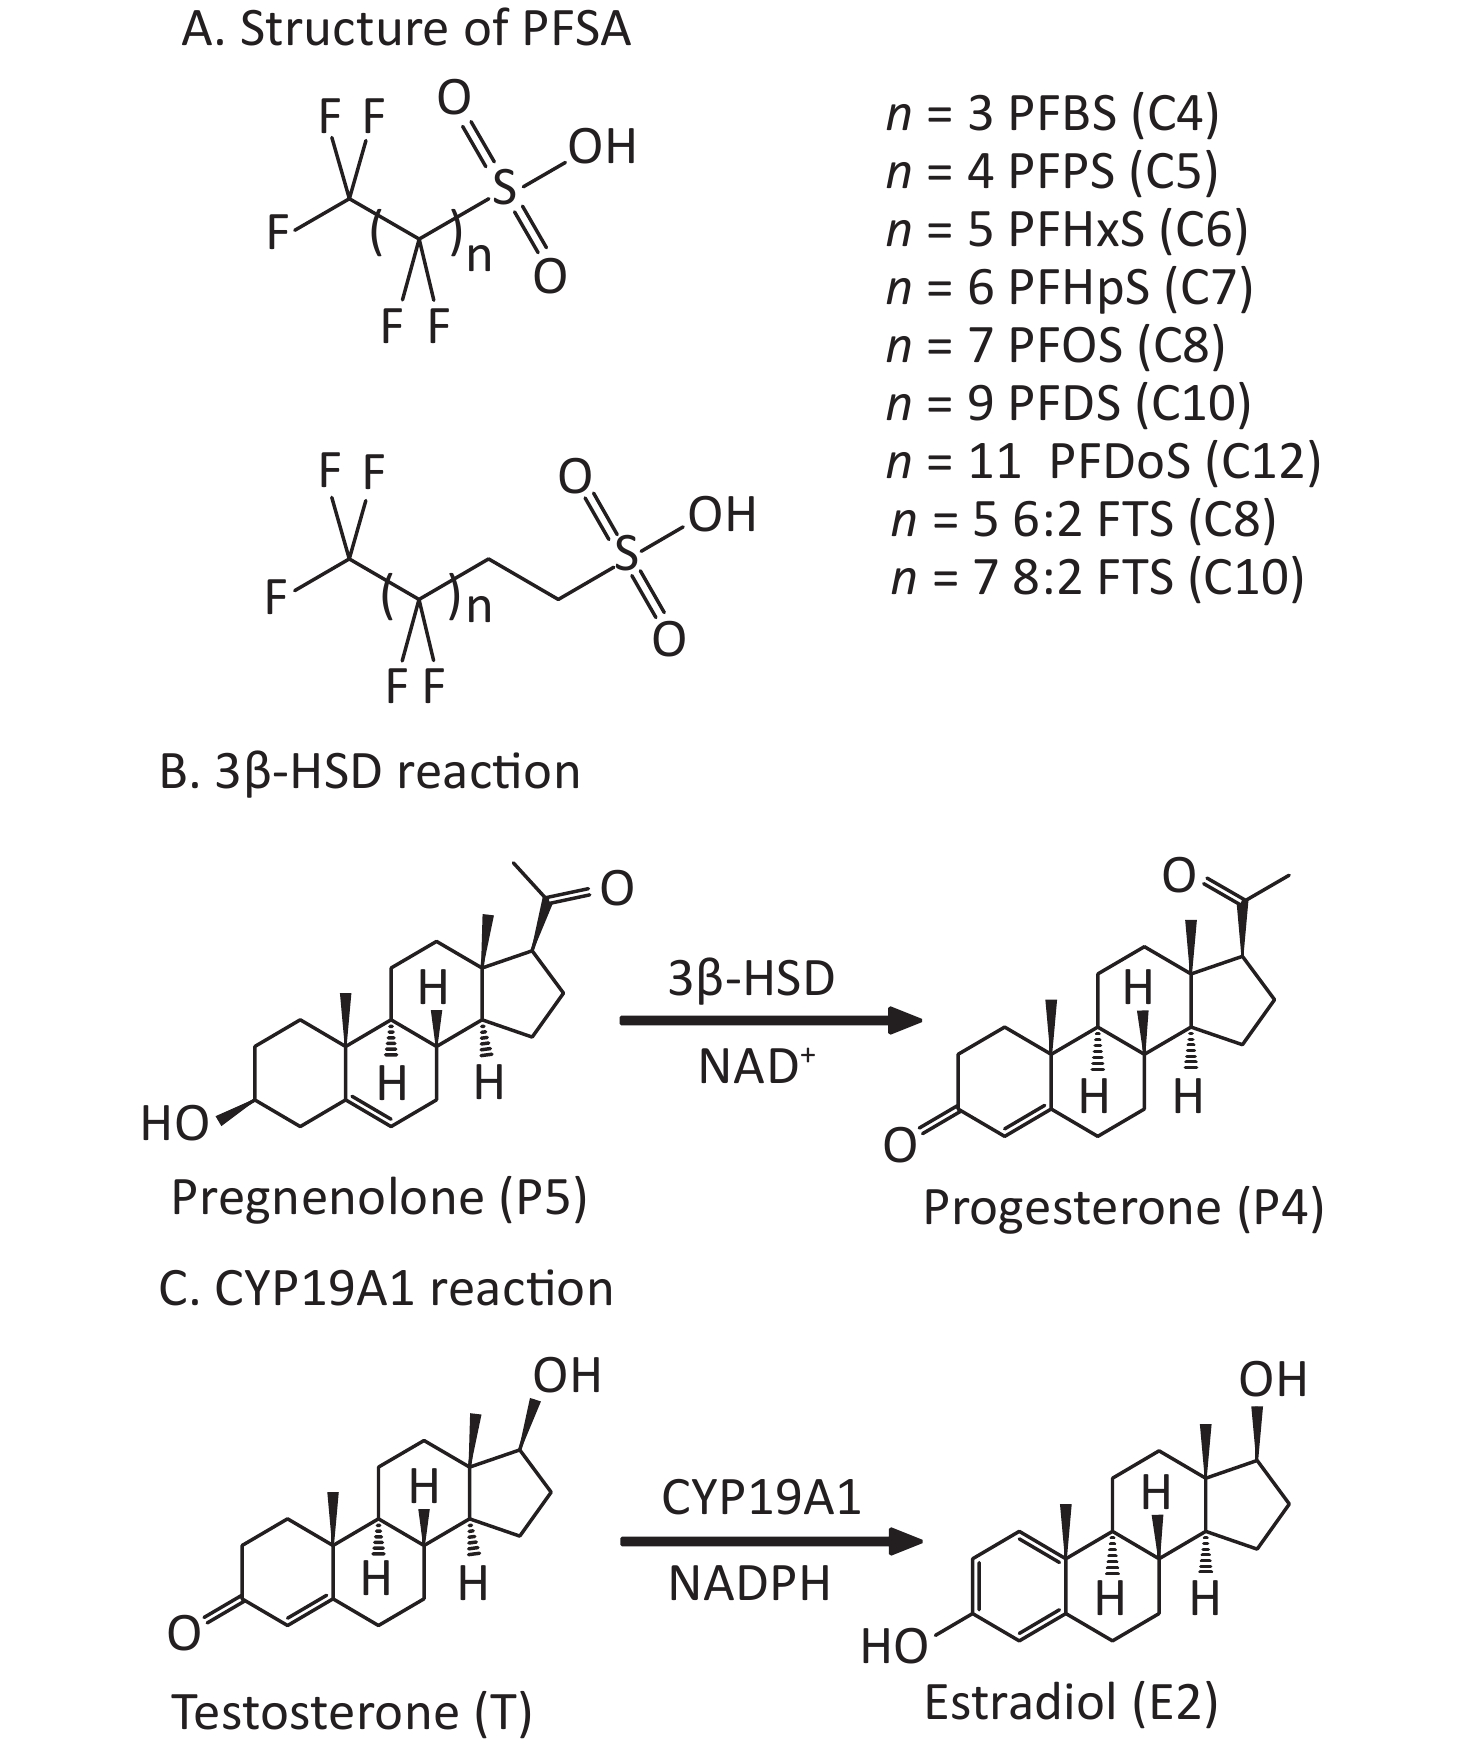
Poly- and perfluoroalkyl substances (PFAS) have poly- or perfluoroalkyl chains. Owing to their unique stabilities and surface activities, PFAS are widely used in many industrial and consumer products. Structurally, PFAS have fluorinated alkyl chains and polar head groups, including carboxylic acids (PFCA), such as perfluoroheptanoic acid (PFHpA, C7) and perfluorooctanoic acid (PFOA, C8), or sulfonic acids (PFSA), such as perfluoroheptanesulfonic acid (PFHpS, C7) and perfluorooctanesulfonic acid (PFOS, C8), which have an additional sulfur atom than the identical carbon-chained PFCA. PFSA are structurally similar; however, the carbon chain length varies. The PFSA include perfluorobutanesulfonic acid (PFBS, C4), perfluoropentanesulfonic acid (PFPS, C5), perfluorohexanesulfonic acid (PFHxS, C6), perfluorodecanesulfonic acid (PFDS, C10), and perfluorododecanesulfonic acid (PFDoS, C12) (Figure 1). PFSA containing at least one perfluorocarbon atom and some hydrogen-containing carbons are referred to as polyfluoroalkyl substances, such as 1H, 1H, 2H, 2H-perfluorooctanesulfonic acid (6:2FTS) and 1H, 1H, 2H, 2H-perfluorodecanesulfonic acid (8:2FTS) (Figure 1)[1]. They are used for coating textiles, paper, and upholstery, and as reaction additives in various processes[2-4].
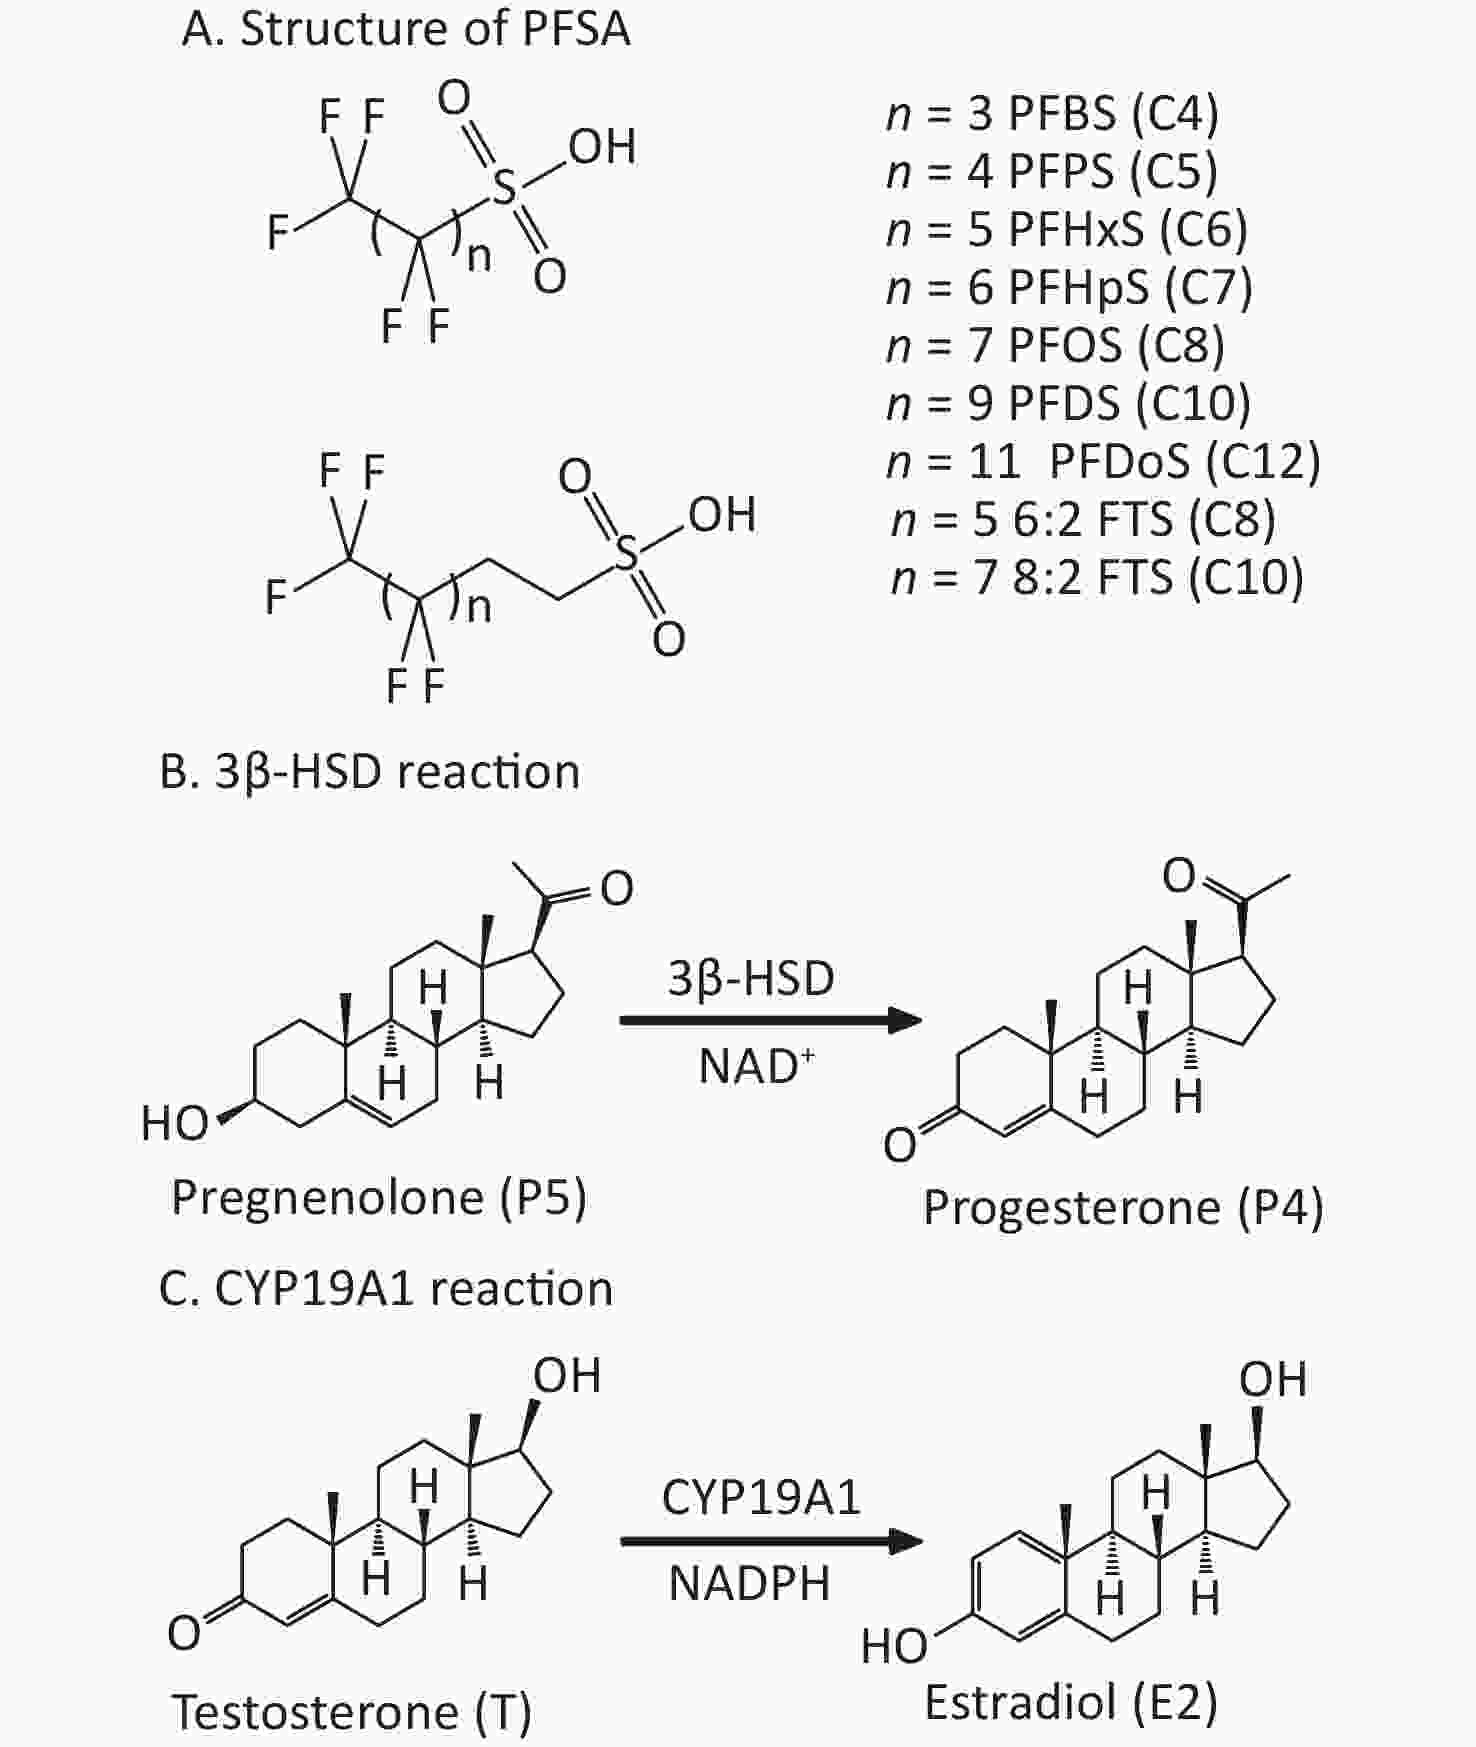
Figure 1. PFSA structure and placental 3β-HSD and CYP19A1 catalytic reactions. (A) Structure (n = number of carbon atoms); (B) 3β-HSD reaction; (C) CYP19A1 reaction. 3β-HSD, 3β-hydroxysteroid dehydrogenase; CYP19A1, aromatase; PFSA, polyfluoroalkyl sulfonic acid.
PFSA is widely present in the environment and the blood of the general population[5]. The average serum PFOS, PFOA, and PFHxS levels in the USA population were 14.7, 3.4, and 1.5 ng/mL[6]. Moreover, the PFOS level (33.3 ng/mL) in the population of two cities in northern China in 2012 was the highest, followed by PFHxS level (2.95 ng/mL)[7]. Serum PFOS levels may exceed 100 μg/mL in some factory workers[3]. PFOS and PFHxS persistently accumulate in the human body, and their serum elimination half-lives (t1/2) are 5.4 and 8.5 years, respectively[8]. However, their serum elimination t1/2 values are substantially lower in rats and monkeys[9]. Due to their high elimination t1/2 and the potential persistent hazards in humans, 3M Company, a major PFAS manufacturer, has automatically phased out PFOS and PFOA production at the beginning of this century[6]. Short-chain PFSA compounds, such as PFBS and PFPS, have recently been introduced to replace PFOS and PFHxS because the serum elimination of PFBS is more rapid than that of PFOS and PFHxS. The t1/2 of PFBS in male rats and monkeys is 3.1 and about 10 h, respectively[10].
PFAS act as endocrine disruptors. Human studies have established an association between PFOS level, preeclampsia, and low birth weights[11-14]. The adverse effects of PFAS may be associated with the interruption of steroid production in the human placenta. Progesterone (P4) and estradiol (E2) are steroid hormones secreted by the placenta and essential for maintaining pregnancy and fetal development. Human placental 3β-hydroxysteroid dehydrogenase/Δ5,4-isomerase 1 (h3β-HSD1) is a critical enzyme that catalyzes P4 biosynthesis from pregnenolone (P5) (Figure 1B). 3β-HSD1 sequence is highly similar to the rat homologue r3β-HSD4 in the placenta[15]. We have recently found that PFCA structure-dependently inhibited human placental h3β-HSD1 and r3β-HSD4, with perfluoroundecanoic acid (PFUA, C11) being the most potent inhibitor[16].
Aromatase (CYP19A1), an important enzyme in the placenta, is a cytochrome P450 enzyme and the rate-limiting enzyme in estrogen biosynthesis[17]. It catalyzes testosterone (T) conversion into E2 (Figure 1C). Estrogen synthesis in the placenta requires androgen from fetal and maternal adrenal glands, which produce large amounts of dehydroepiandrosterone (DHEA) that enter the placenta[18]. In the human placenta, DHEA is converted by h3β-HSD1 into androstenedione, which is further converted into T by 17β-hydroxysteroid dehydrogenases and then E2 by CYP19A1 (Figure 1C)[19]. Placental estrogen stimulates placental growth and enhances placental blood flow for the optimal exchange of gases and nutrients required for a rapidly developing fetus[20].
In this study, we explored the effects of nine PFSA molecules (C4–C12) on human placental h3β-HSD1, rat placental r3β-HSD4, and human placental CYP19A1 activity, as well as P4 production in human choriocarcinoma JEG-3 cells, and compared their potency, mode of action, and structure–activity relationship (SAR). We also performed docking analysis to determine the underlying mechanism.
-
P5 (catalog #P9129), P4 (P0130), T (T-1500), E2 (E-8875), dimethyl sulfoxide (DMSO, D8418), NADPH (N7505), and NAD+ (N7004) were purchased from Sigma–Aldrich (St. Louis, MO, USA). PFBS (C4, CAS#375-73-5, Cat#387933, purity 98%) was purchased from J&K Scientific (Beijing, China), PFHpS (C7, CAS#375-92-8, Cat#C15986880, purity 95.3%) and 8:2FTS (CAS#39108-34-4, Cat#C15986585, purity 95.3%) were purchased from Dr. Ehenstorfer (Augsburg, Germany), PFPS (C5, CAS#2706-91-4, Cat#ACM2706914, purity 96%) was purchased from Alfa Chemistry (Ronkonkoma, NY, USA), PFOS (C8, CAS#1763-23-1, Cat#H0781, purity 98%) was purchased from TCI (Tokyo, Japan), PFHxS (C6, CAS#355-46-4, Cat#P999738, purity 98%) and PFDS (C10, CAS#335-77-3, Cat#P286540, purity 95%) were purchased from TRC (Toronto, Canada), 6:2FTS (C10, CAS#27619-97-2, Cat#T923214, purity 98%) was purchased from Macklin (Shanghai, China), PFDoS (C12, CAS#1260224-54-1, Cat#1ST14848, purity 98%) was purchased from Alta Scientific (Tianjin, China). PFSA compounds were dissolved in DMSO. Pregnant Sprague-Dawley rats (280–320 g) were obtained from the Shanghai Laboratory Animal Center (Shanghai, China). Rat placentas were obtained from dams on gestational day 20 after the rats were euthanized by CO2 and cervical dislocation. The Animal Care and Use Committee of Wenzhou Medical University approved all animal protocols. The Second Affiliated Hospital of Wenzhou Medical University provided full-term human placental samples under the endorsement of the Hospital Ethics Committee and the subjects’ agreement (Protocol no. 2022-K-81-01). The human choriocarcinoma cell line JEG-3 was obtained from the American Type Culture Collection (ATCC; Manassas, VA, USA).
-
Microsomes were prepared from the placenta at 4 °C as described previously[16]. Briefly, homogenized placental suspension in 0.01 mol/L phosphate-buffered saline (PBS, pH 7.2) supplemented with 0.25 mol/L sucrose was sequentially centrifuged at 700 ×g for 30 min, 14,500 ×g for 30 min, and then 105,000 ×g twice for 1.5 h for obtaining the microsomal pellet, which was resuspended in ice-cold PBS, and its protein content was measured by an enhanced BCA protein assay kit (Cat#P0010, Beyotime Biotech; Shanghai, China) according to the manufacturer's instruction.
-
Both human h3β-HSD1 and rat r3β-HSD4 catalyze P5 conversion to P4, which can be measured using the HPLC/MS–MS method[16]. The following operations were performed: 1) a linear reaction condition for 3β-HSD was established after incubating the assay system (a 1.5 mL tube containing 200 nmol/L P5, 200 μmol/L NAD+, and 5 μg placental microsome in 100 μL pH 7.2 0.01 mol/L PBS) for 0–90 min in a shaking water bath (75 rpm) at 37 °C; 2) Michaelis–Menten kinetics of each enzyme was established after incubating the assay system (a 1.5 mL tube containing 0–2 μmol/L P5, 200 μmol/L NAD+, and 5 μg placental microsome in 100 μL 0.01 mol/L PBS) for 60 min; 3) a screening test for PFSA-mediated 3β-HSD inhibition was established after incubating the assay system (a 1.5 mL tube containing 200 nmol/L P5, 200 μmol/L NAD+, 5 μg placental microsome, and 100 μmol/L PFSA in 100 μL 0.01 mol/L PBS) for 60 min; 4) the dose response of each PFSA was measured after incubating the assay system (a 1.5 mL tube containing 200 nmol/L P5, 200 μmol/L NAD+, 5 μg placental microsome, and 0–200 μmol/L PFSA 100 μL 0.01 mol/L PBS) for 60 min; 5) the enzyme kinetics inhibition assay was established after incubating the assay system (a 1.5 mL tube containing 0–5 μmol/L P5, 200 μmol/L NAD+, 5 μg placental microsome, and 0–200 μmol/L PFSA in 100 μL 0.01 mol/L PBS) for 60 min. At the end of the reaction, 10 μL internal standard (IS, T-d5, Shanghai Zzbio Co., China) together with 200 μL acetonitrile (Merck Supelco, PA) was added to the tube in an ice bath, and the tube was centrifuged at 20,000 ×g for 10 min. Then, 10 μL extract was injected into HPLC–MS/MS system for measuring P4 amount.
-
HPLC–MS/MS (Waters, USA) equipped with an Acquity BEH C18 column (2.1 mm × 50.0 mm, 1.7 μm particle size) was used to determine P4[16]. A gradient procedure in mixed solvent A (0.1% aqueous formic acid solution) and solvent D (acetonitrile) was programmed as follows: 70%–30% D (0–0.3 min), 10%–90% D (0.3–1.9 min), 70%–30% A (1.9–2.0 min). The flow rate was 0.40 mL/min and the injection volume was 10 μL. The column and sample temperatures were 30 and 4 °C, respectively. The XEVO TQD triple quadrupole mass spectrometer equipped with ESI source (Waters) was used for mass determination in a multiple-reaction monitoring mode and the MRM mode transitions for P4 and IS were m/z 315.16→96.92 and 289.07→96.92, respectively. Masslynx 4.1 (Waters) software was used for data acquisition and control. The P4 amount was calculated using the standard curve method with IS.
-
The JEG-3 choriocarcinoma cell line is widely used as a placental steroid production model[19]. This cell line is derived from a human choriocarcinoma, produces a substantial P4 amount, and contains h3β-HSD1 and CYP19A1[19]. Therefore, it was used as a placental syncytiotrophoblast model in this study. Briefly, 105 cells were cultivated per well in 24-well plates using Minimum Essential Medium (MEM) supplemented with phenol red, 10% fetal calf serum (FCS), and various PFOS and PFDS concentrations at 37 °C and 5% CO2 for P4 production for 24 h. The media were collected for measuring P4 using HPLC–MS/MS method. For cytotoxicity analysis, the cells were treated with 100 μmol/L PFOS and PFDS and their viability was tested. For viability assay, 5,000 cells were seeded per well in 100 μL medium in 96-well plates and treated with 100 μmol/L PFOS and PFDS for 24 h. The optical density (OD) at 450 nm was measured using the Cell Counting Kit-8 (CCK-8, Sigma–Aldrich). Five samples were measured at each point and the results were averaged.
-
Human CYP19A1 catalyzes T to E2 conversion, which can be measured using a radioimmunoassay[21]. Briefly, the following operations were performed: 1) a linear reaction condition for CYP19A1 was established after incubating the assay system (a 1.5 mL tube containing 100 nmol/L T, 200 μmol/L NADPH, and 5 μg human placental microsome in 200 μL pH 7.2 0.01 mol/L PBS) for 0–120 min in a shaking water bath (75 rpm) at 37 °C; 2) Michaelis–Menten kinetics of CYP19A1 was established after incubating the assay system (a 1.5 mL tube containing 0–1 μmol/L T, 200 μmol/L NADPH, and 5 μg placental microsome in 200 μL 0.01 mol/L PBS) for 60 min; 3) a screening test for PFSA-mediated CYP19A1 inhibition was established after incubating the assay system (a 1.5 mL tube containing 100 nmol/L T, 200 μmol/L NADPH, 5 μg placental microsome, and 100 μmol/L PFSA in 200 μL 0.01 mol/L PBS) for 60 min. The reactions were terminated by adding 10 μL 1 N HCl. E2 amount in the reaction medium was measured using radioimmunoassay[21]. A standard curve was prepared using 10–2,000 pg/mL E2, the bound and free steroids were separated with a charcoal–dextran suspension, and radioactivity was determined using a β-counter (PE). The minimum detectable E2 amount was 5 pg/mL.
-
Dose response and mode of action (MOA) were analyzed as previously described[16]. Control (DMSO) activity was set at 100%. Residual activity after PFSA treatment was normalized to that of the control. When the residual activity after PFSA treatment was less than or equal to 50%, the half-maximum inhibitory concentration (IC50), which was calculated from the nonlinear regression (curve fit) of the dose response inhibition model, in which the inhibitor and response (three parameters) were calculated using GraphPad (GraphPad Inc., CA, USA). For MOA, enzyme kinetics inhibition (mixed model) with the following equations were used:
$$ {V}_{maxApp}=\frac{{V}_{max}}{1+\dfrac{I}{\alpha \times {K}_{i}}} $$ (1) $$ {K}_{mApp}={K}_{m}\times \frac{1+\dfrac{I}{{K}_{i}}}{1+\dfrac{I}{\alpha \times {K}_{i}}} $$ (2) $$ Y=\frac{{V}_{maxApp}\times X}{{K}_{mApp}+X} $$ (3) where Vmax is the maximum velocity (pmol∙mg−1∙min−1), I is the inhibitor concentration, Ki is the inhibition constant, Km is Michaelis–Menten kinetics constant, and α is a factor to judge the MOA. “α = 1” indicates noncompetitive inhibition, “α > 1 or < 1” indicates mixed inhibition, “α near 0 but not equal to 0” indicates uncompetitive inhibition; “α > ∞” indicates competitive inhibition. A Lineweaver–Burk plot (LBP) was drawn after comparing 1/V (velocity) with 1/substrate concentration (1/[P5]) to further evaluate the MOA of PFSA.
-
AlphaFold human h3β-HSD1 model (AF-P14060-F1-model) [https://alphafold.ebi.ac.uk/entry/P14060][22,23], with 94.16 average model confidence (pLDDT), was selected as the human h3β-HSD1 target for in silico docking analysis. PFSA was sketched in ChemBioDraw Ultra 12.0 (Cambridge, UK) in the mol2 format. Docking analysis was performed with SwissDock web Server[24], and the lowest binding energy was calculated and visualized by Chimera 1.1.1 software (San Francisco, CA, USA). Hydrogen bonds and amino acid residues were labeled using a chimera. PyMOL software was used for the 3D structure and measurement of the chemical length. 2D graphics of the superimposed structures of PFSA with P5 were analyzed using LigPlot[25].
-
The assays were repeated 4–8 times. Enzymatic results were analyzed using one-way ANOVA followed by post hoc Tukey’s multiple comparisons to identify significant differences between the groups for the screening test. Significant differences are denoted as *P < 0.05, **P < 0.01, ***P < 0.001, $P < 0.05, and $$$P < 0.001. Data are presented as means ± standard deviation (SD).
-
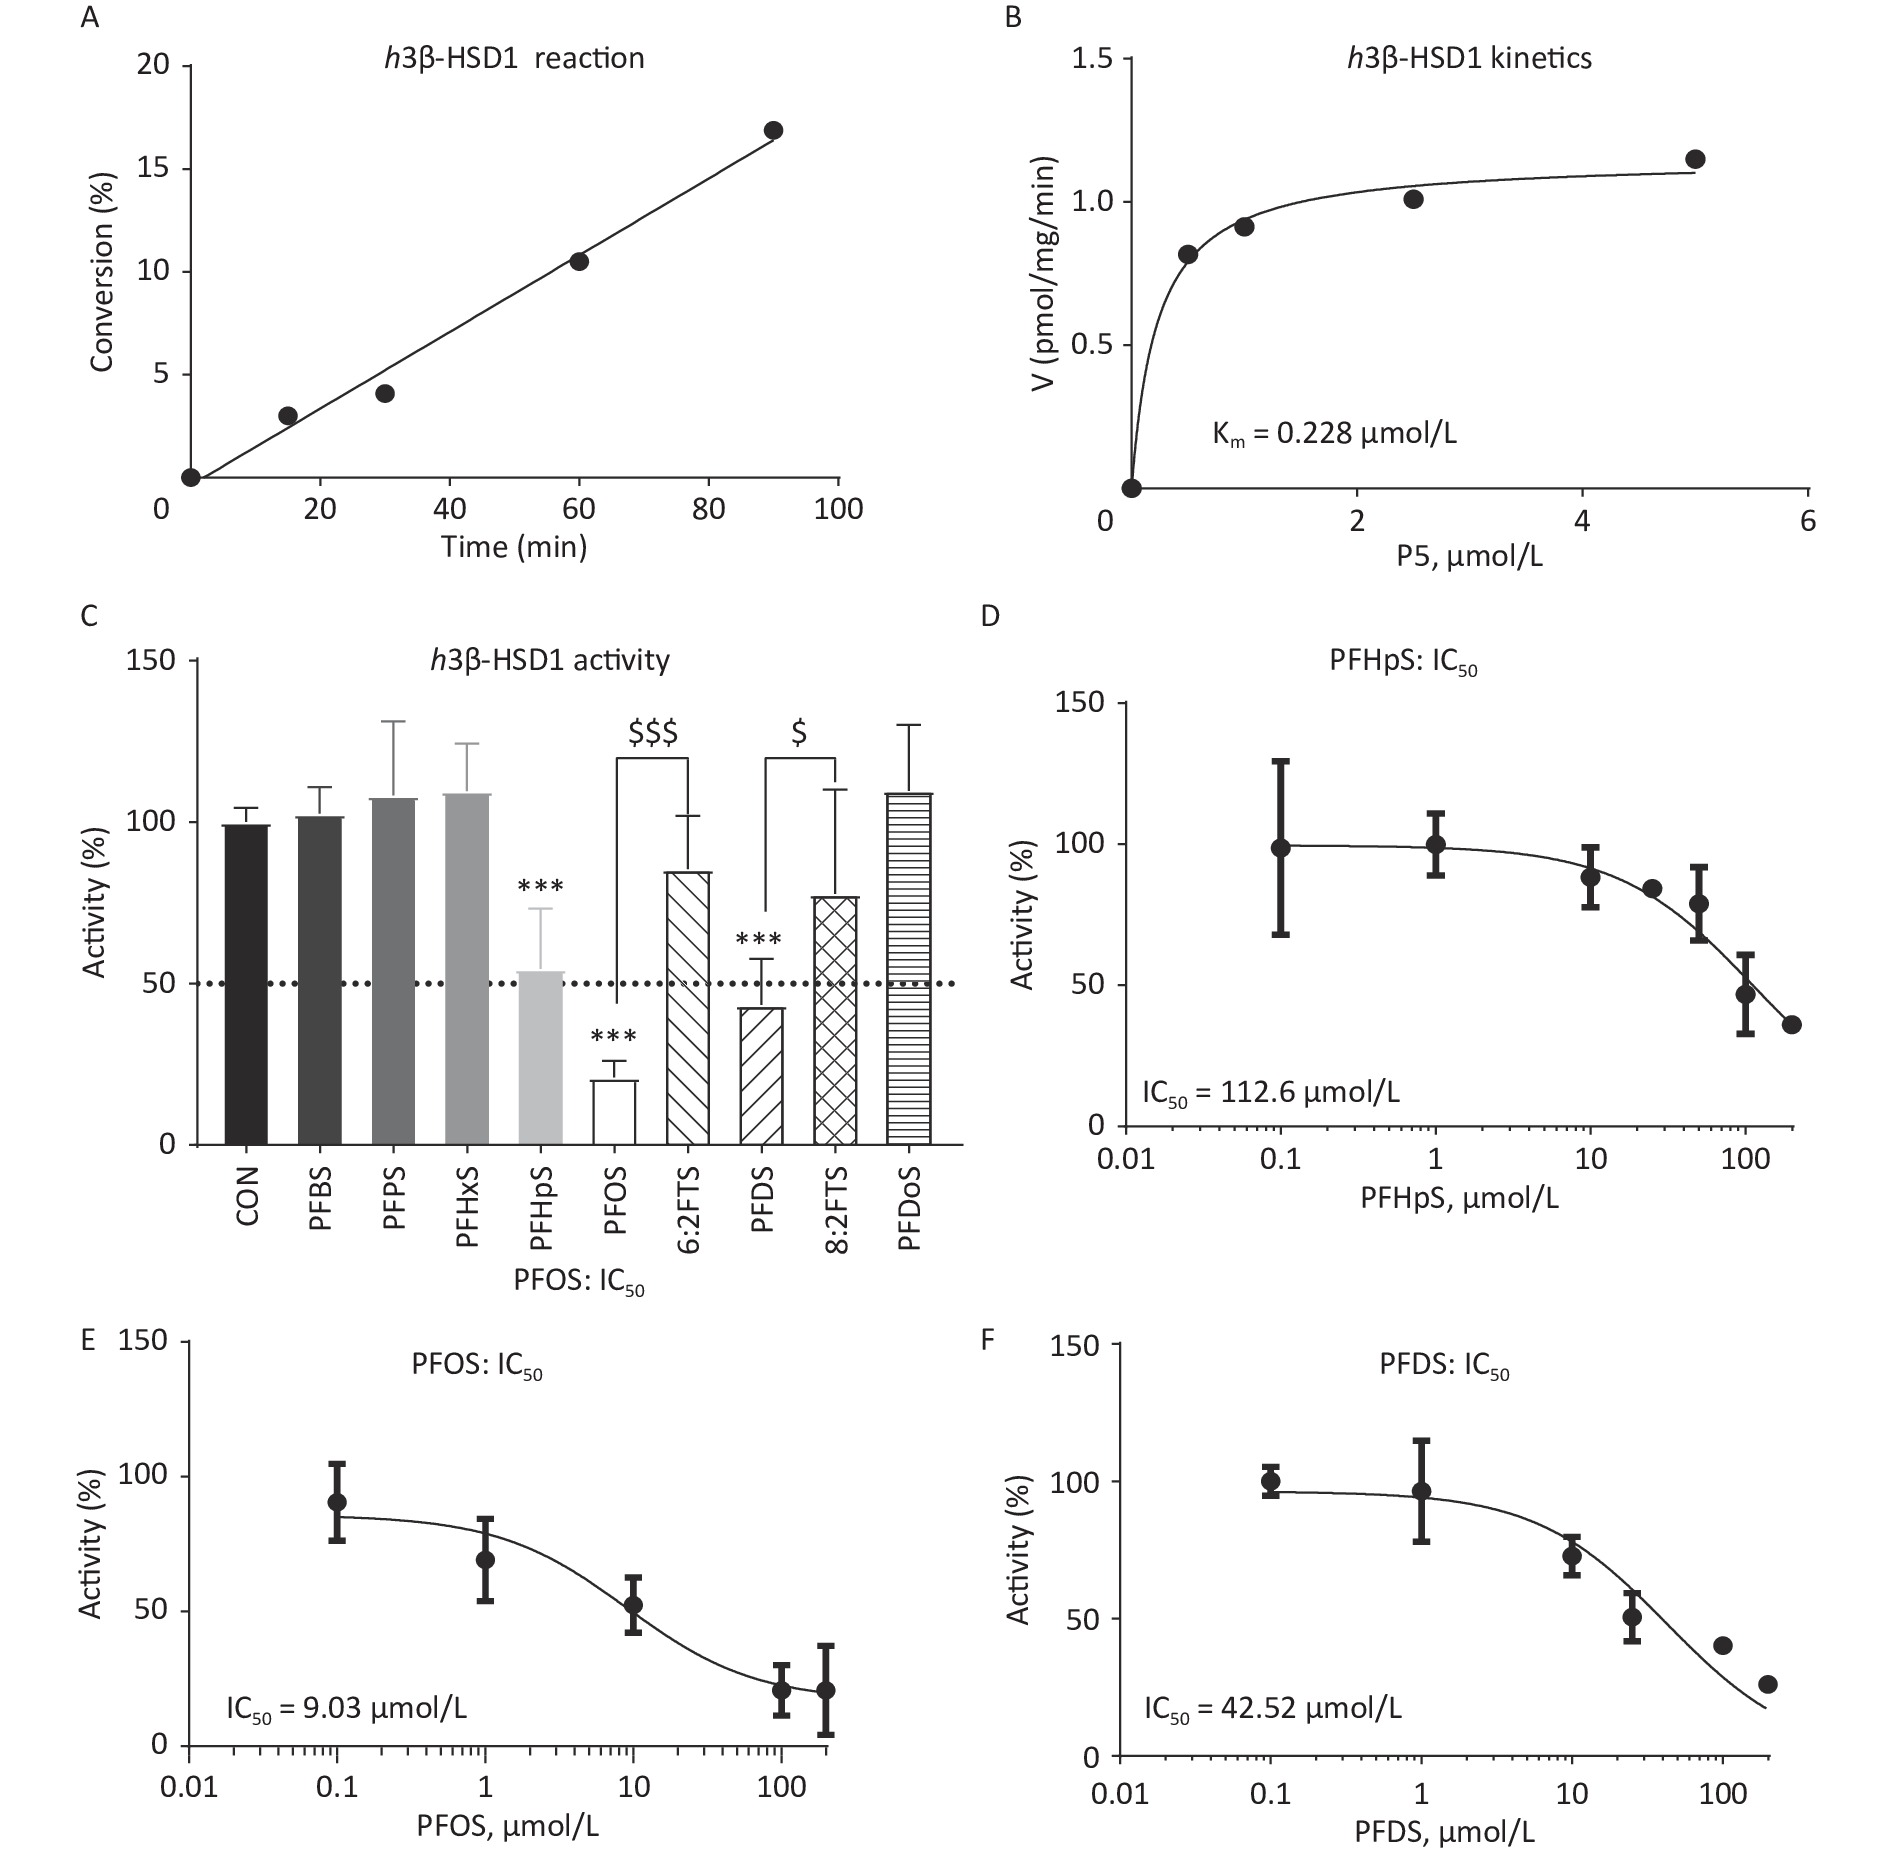
Time-dependent h3β-HSD1 activity was measured after mixing 200 nmol/L P5 and 0.2 mmol/L NAD+ with human placental microsome for 0–90 min. P5 to P4 conversion rate was linear within 90 min (Figure 2A). When 0–2 μmol/L P5 was incubated with 0.2 mmol/L NAD+ and 5 μg human placental microsome for 60 min, the Km and Vmax for h3β-HSD1 were 0.228 ± 0.053 μmol/L and 1.152 ± 0.044 nmol∙mg−1min−1, respectively (Figure 2B), which is within the previously reported range[26]. The screening results showed that PFHpS, PFOS, and PFDS significantly inhibited h3β-HSD1 activity, resulting in residual activity close to or lower than 50% of the control activity (Figure 2C). Although PFOS and 6:2FTS have the same number of carbon atoms, 100 μmol/L 6:2FTS did not inhibit h3β-HSD1 activity. This was also true for 8:2FTS and PFDS (Figure 2C). These results indicate that PFSA structure-dependently inhibits h3β-HSD1 activity. The dose response of PFSA molecules with approximately 50% or lower residual activity than control was determines using a concentration series. The IC50 of PFOS, PFDS, and PFHpS were 9.03 ± 4.82, 42.52 ± 8.99, and 112.6 ± 29.39 μmol/L, respectively (Table 1 and Figure 2D–F). The enzyme kinetics inhibition analysis revealed that the Ki of PFOS, PFDS, and PFHpS were 8.32, 43.41, and 114.7 μmol/L, respectively (Table 1 and Figure 3). These results indicate that the inhibitory potency is PFOS > PFDS > PFHpS > PFBS = PFPS = PFHxS = PFDoS for h3β-HSD1, showing a V-shaped turn at PFOS (C8). Enzyme kinetics inhibition (mixed model) and Lineweaver–Burk plot analysis showed that PFOS and PFHpS were mixed inhibitors, whereas PFDS was a competitive P5 inhibitor (Figure 3 and Table 1).
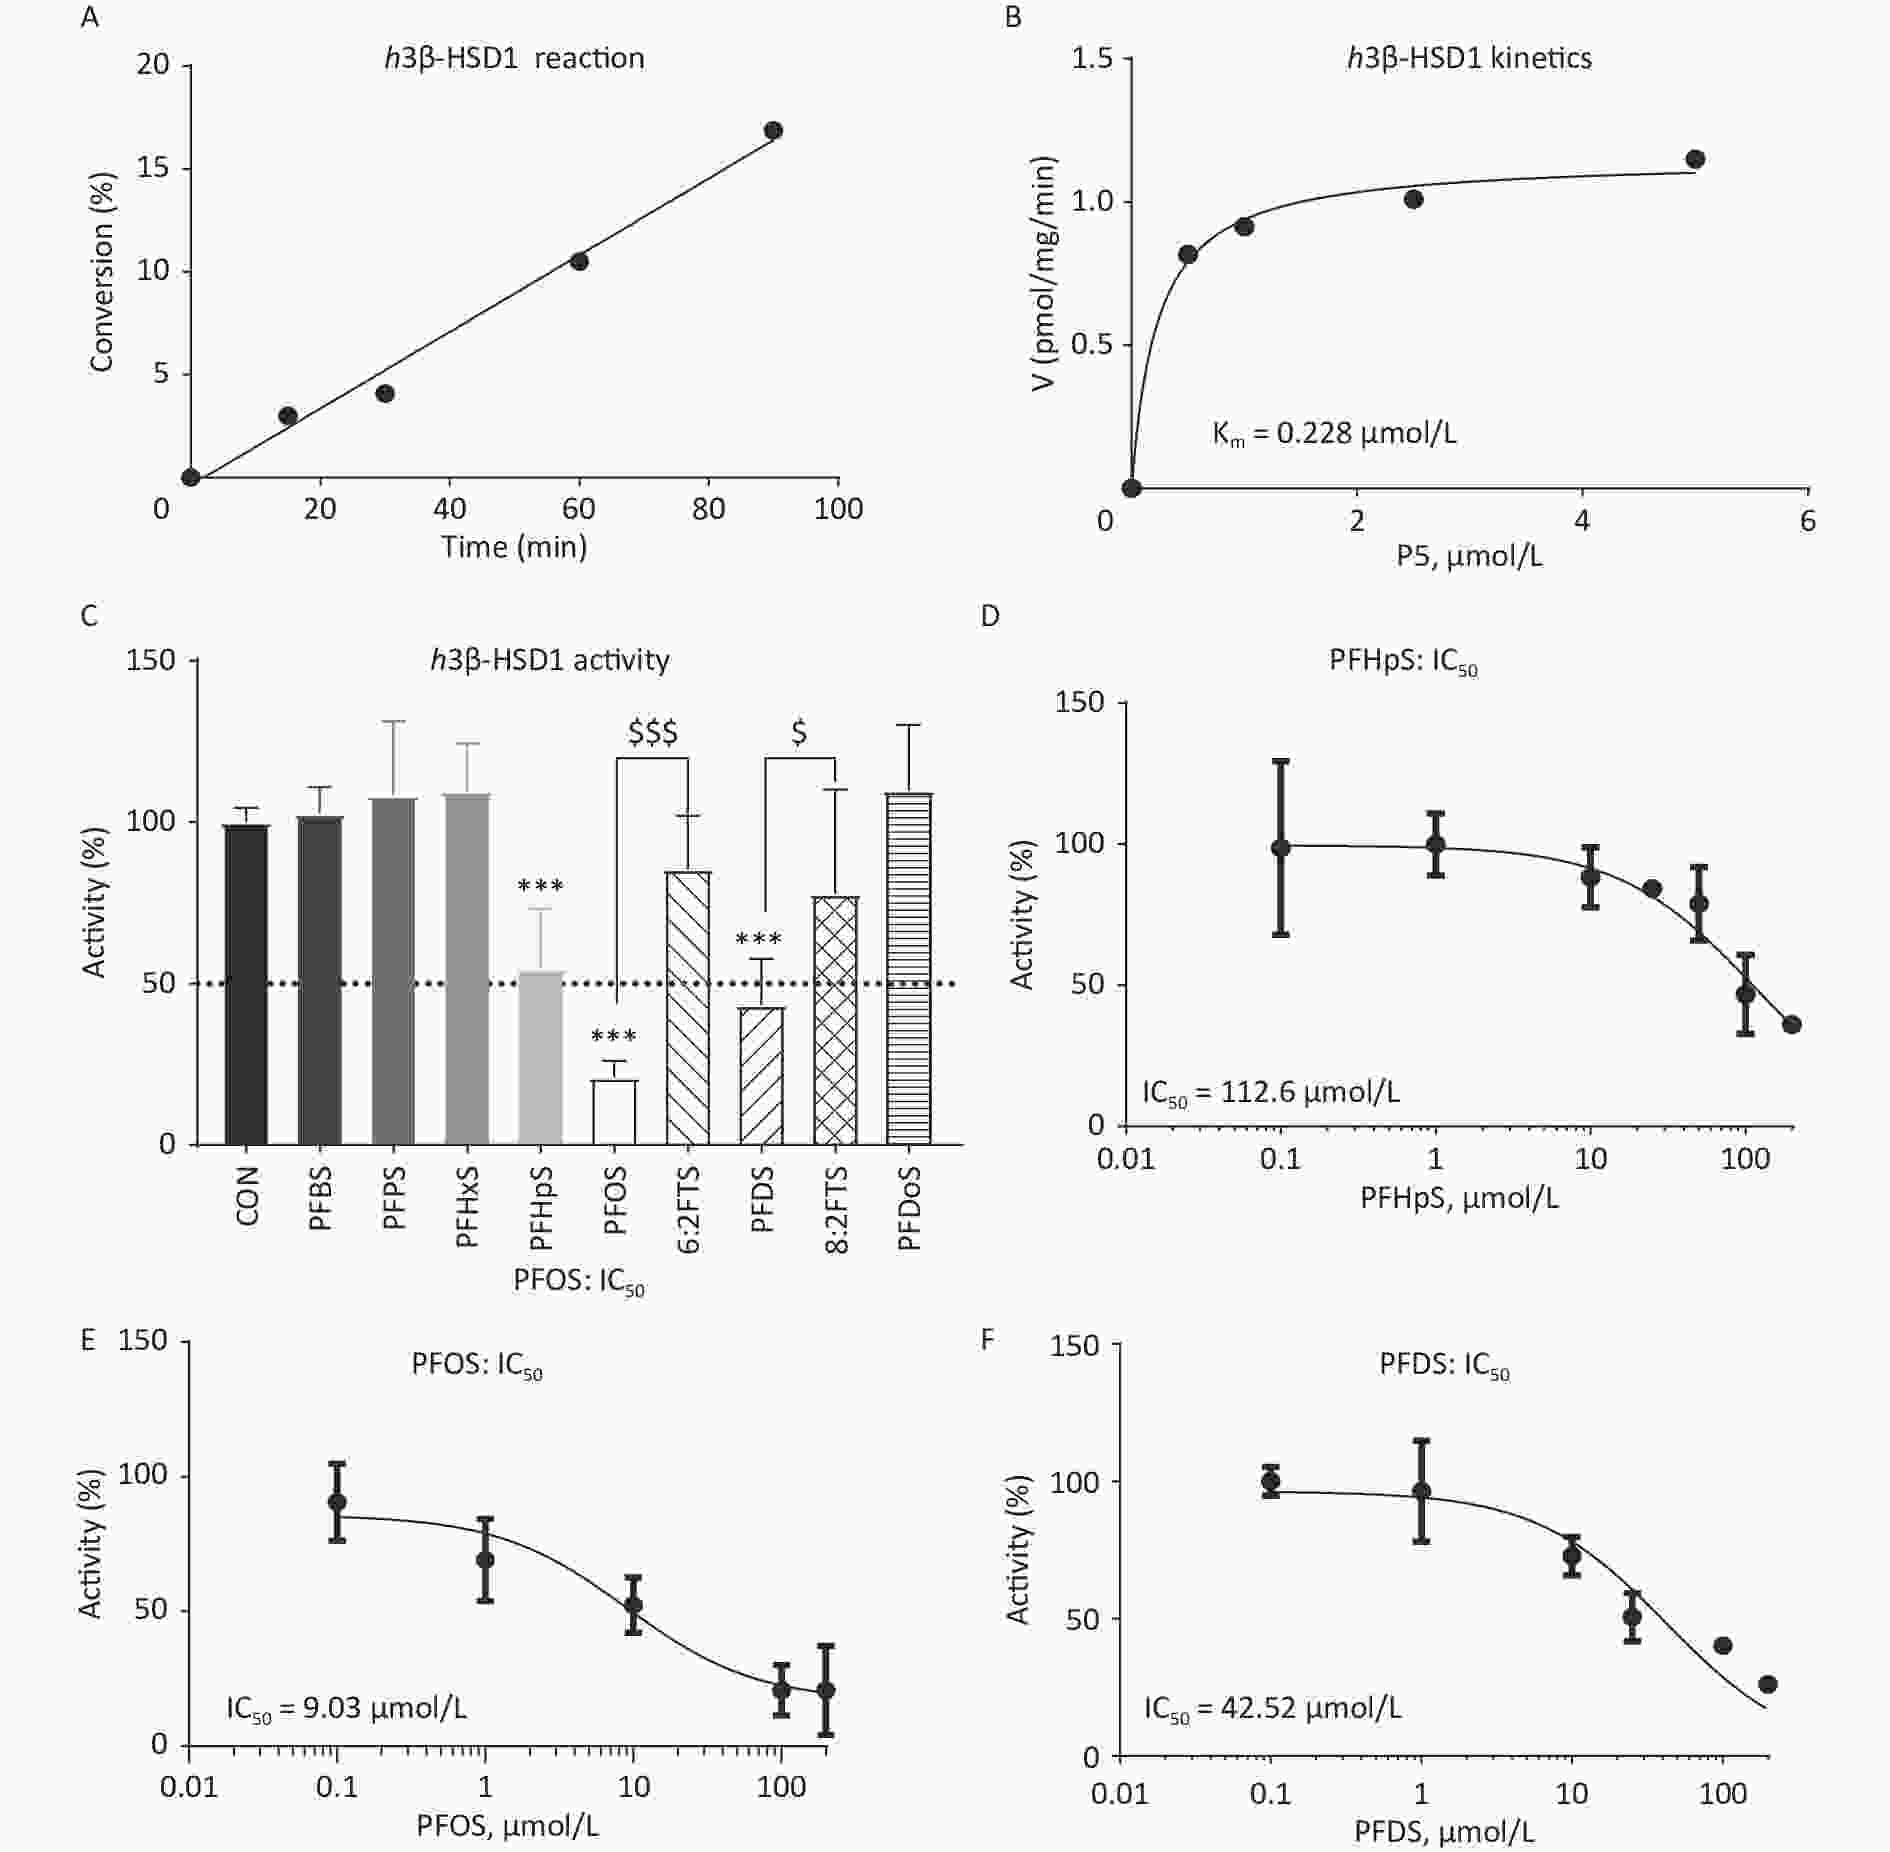
Figure 2. Time-curve reaction, Michaelis–Menten kinetics, screening assay, and dose response of PFSA to inhibit placental h3β-HSD1 activity. (A) Time-curve reaction; (B) Michaelis–Menten kinetics; (C) Screening for PFSA to inhibit human placental h3β-HSD1 activity: means ± SD (n = 4–8); ***Indicates significant difference compared to CON at P < 0.001, $$$PFOS vs. 6:2FTS at P < 0.001, $PFDS vs. 8:2FTS at P < 0.05; (D–F) IC50 of PFHpS, PFOS, and PFDS, respectively. 6:2FTS, 1H, 1H, 2H, and 2H-perfluorooctanesulfonic acid; 8:2FTS, 1H, 1H, 2H, and 2H-perfluorodecanesulfonic acid; CON, control; h3β-HSD1, human 3β-hydroxysteroid dehydrogenase 1; IC50, half-maximum inhibitory concentration; PFDS, perfluorodecanesulfonic acid; PFHpS, perfluoroheptanesulfonic acid; PFOS, perfluorooctanesulfonic acid; PFSA, polyfluoroalkyl sulfonic acid; SD, standard deviation.
Name Length (Å) IC50 (μmol/L) Ki/Km (μmol/L) LBE, (kcal/mol) Mode action Binding site P5 12.0 ND 0.308 −8.754 competitive Steroid PFBS (C4) 7.2 NI ND −6.620 ND Steroid PFPS (C5) 8.9 NI ND −6.320 ND Steroid PFHxS (C6) 9.9 NI ND −6.555 ND Steroid PFHpS (C7) 10.2 112.6 ± 29.39 114.7 −6.800 ND Steroid PFOS (C8) 11.6 9.03 ± 4.83 8.32 −7.272 mixed Steroid 6:2FTS (C8) 12.0 NI ND −6.661 ND Steroid PFDS (C10) 14.4 42.52 ± 8.99 43.41 −7.153 competitive Steroid 8:2FTS (C10) 14.4 NI ND −6.709 ND Steroid PFDoS (C12) 16.7 NI ND −6.531 ND Steroid Note. IC50 = half-maximal inhibitory concentration, Ki = measured inhibition constant, LBE = lowest binding energy; NI = No inhibition at 100 μmol/L; ND = Not determined. IC50, half-maximum inhibitory concentration; PFBS, perfluorobutanesulfonic acid; PFDS, perfluorodecanesulfonic acid; PFHpS, perfluoroheptanesulfonic acid; h3β-HSD1, human 3β-hydroxysteroid dehydrogenase 1; PFHpS, perfluoroheptanesulfonic acid; PFHxS, perfluorohexanesulfonic acid; PFOS, perfluorooctanesulfonic acid; PFDoS, perfluorododecanesulfonic acid; 6:2FTS, 1H, 1H, 2H, and 2H-perfluorooctanesulfonic acid; 8:2FTS, 1H, 1H, 2H, and 2H-perfluorodecanesulfonic acid; SD, standard deviation. Table 1. Information of PFSA to inhibit human 3β-HSD1
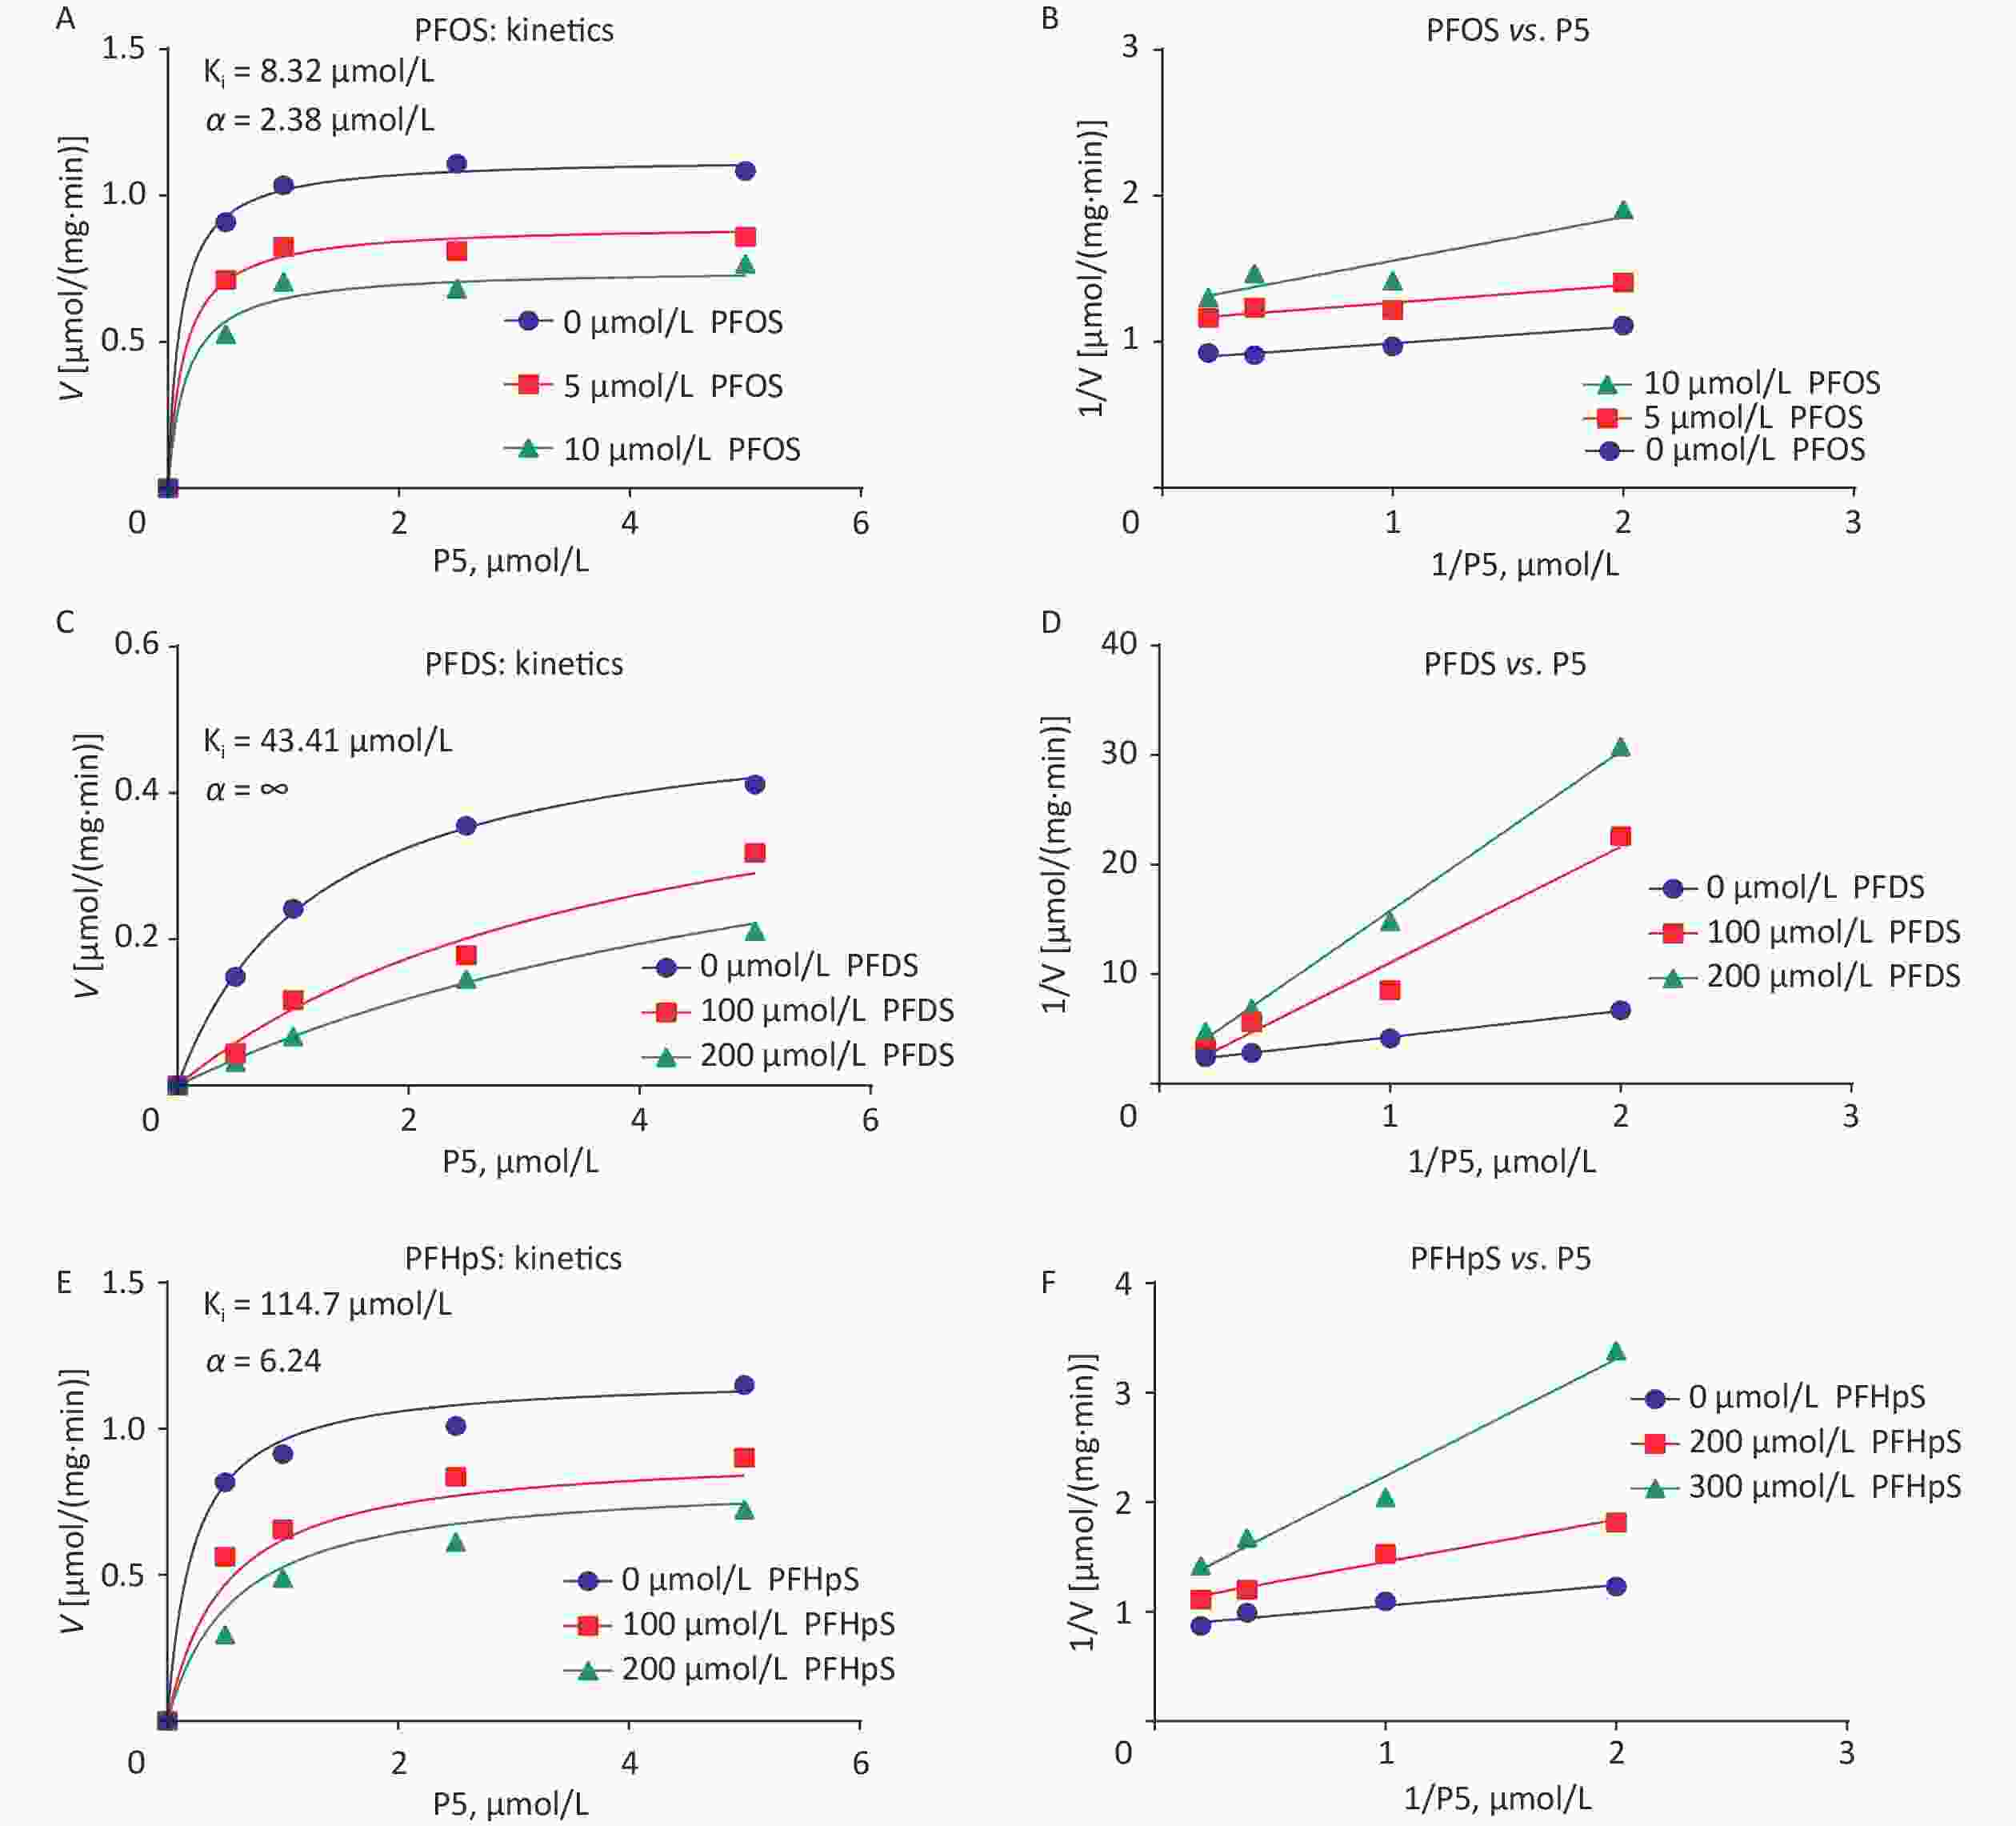
Figure 3. (A, C, E) Enzyme kinetics inhibition and (B, F, F) Lineweaver–Burk plot analysis for mode of action of PFOS, PFDS, and PFHpS. PFDS, perfluorodecanesulfonic acid; PFHpS, perfluoroheptanesulfonic acid; PFOS, perfluorooctanesulfonic acid.
-
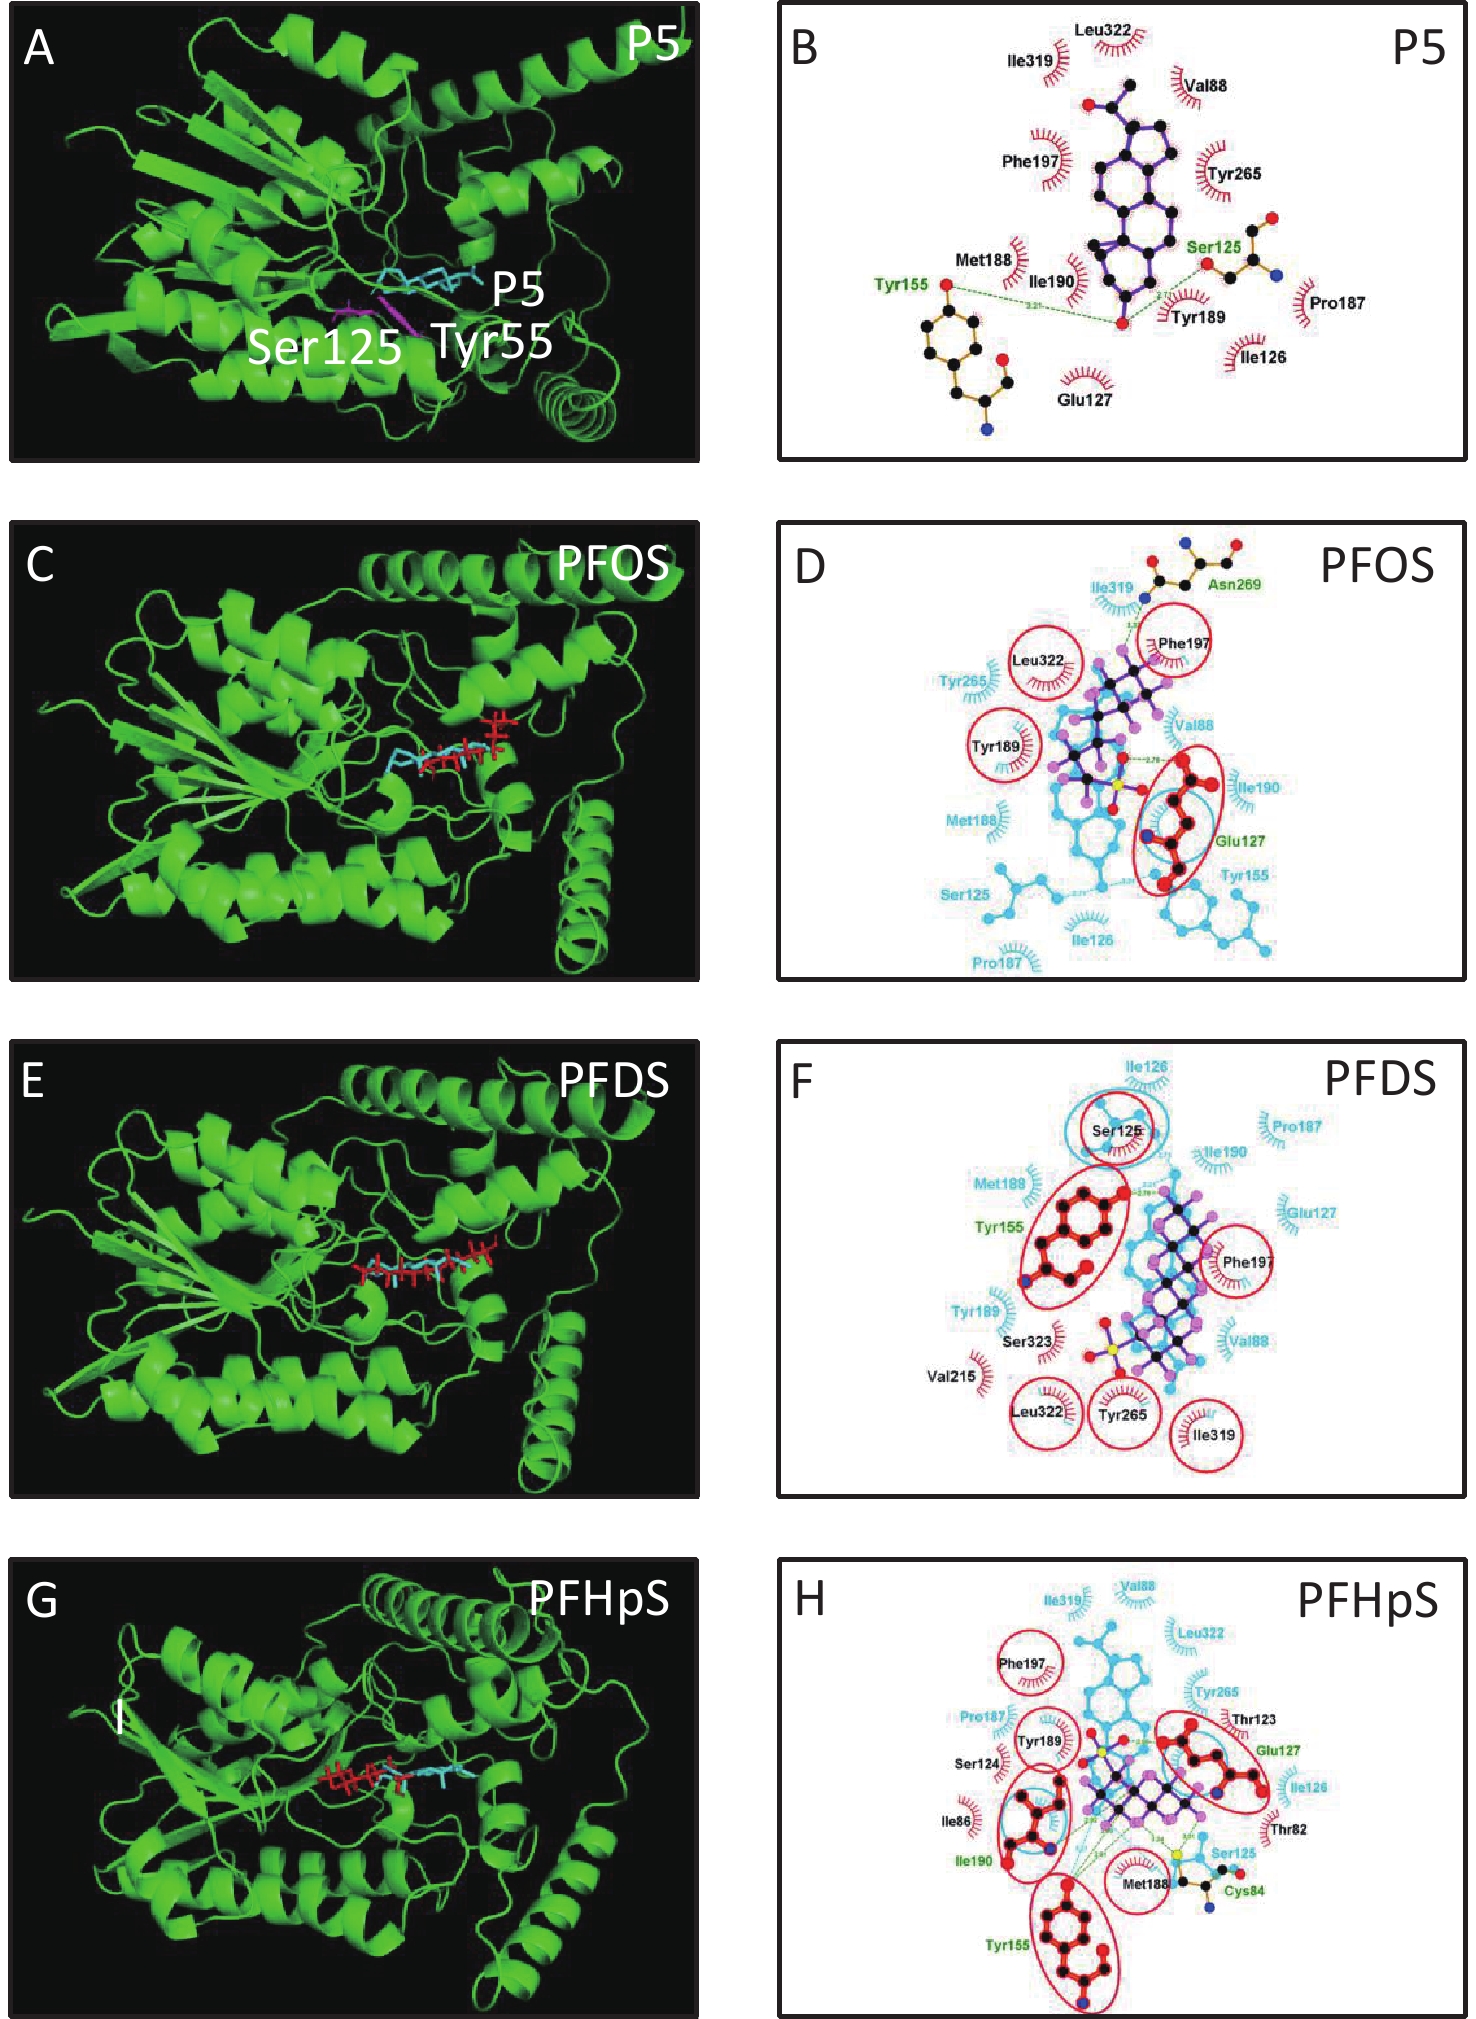
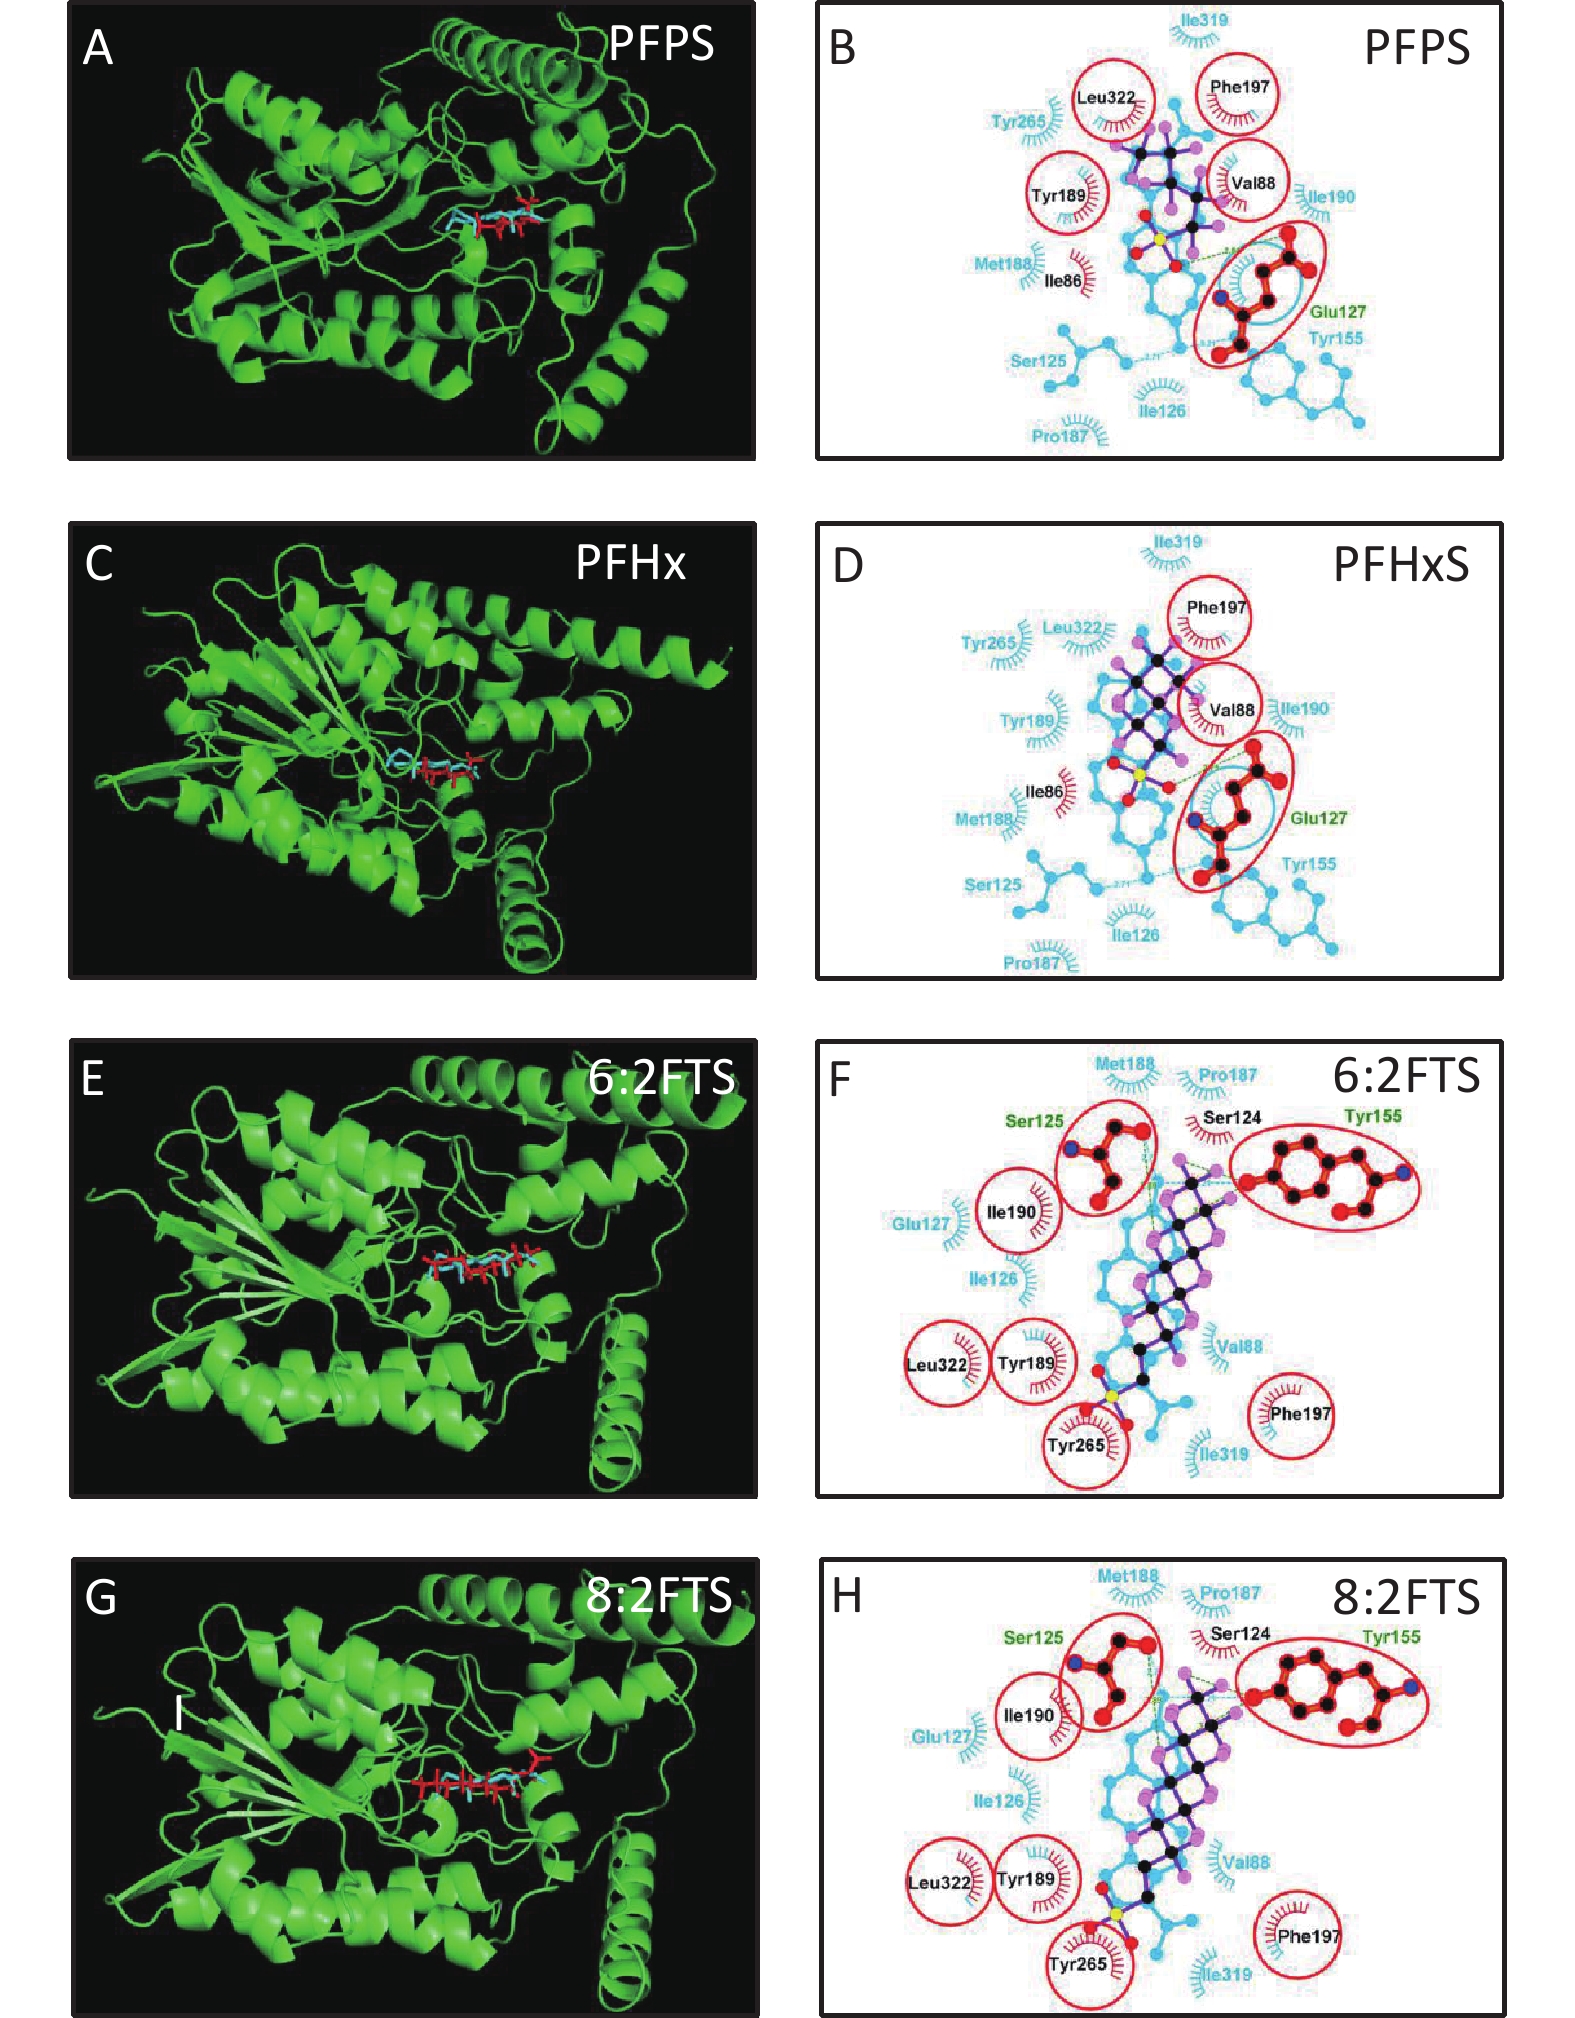
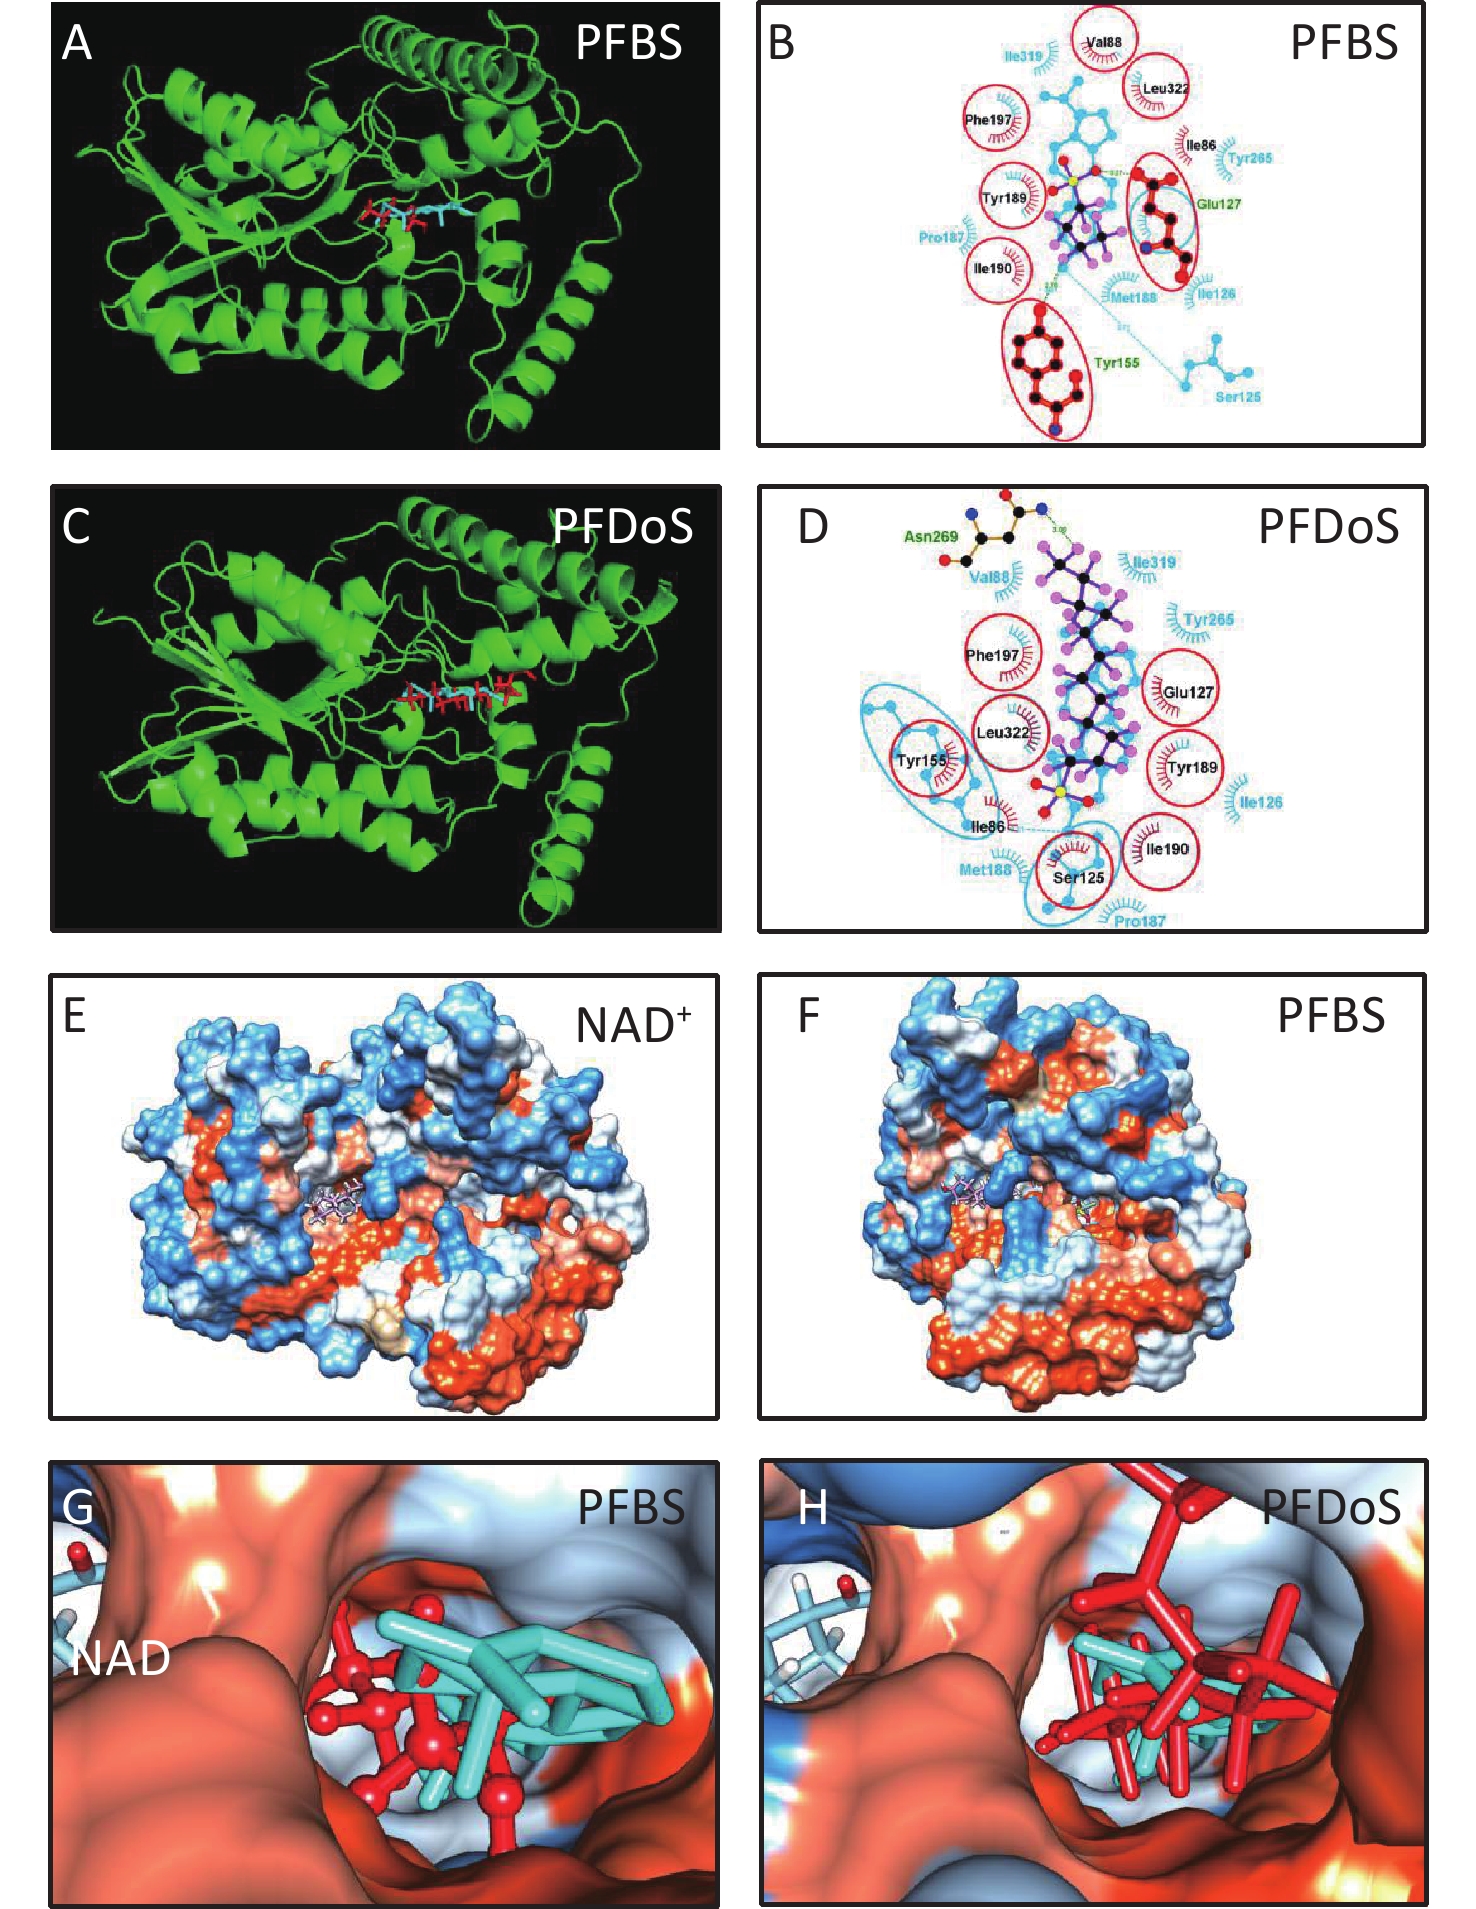
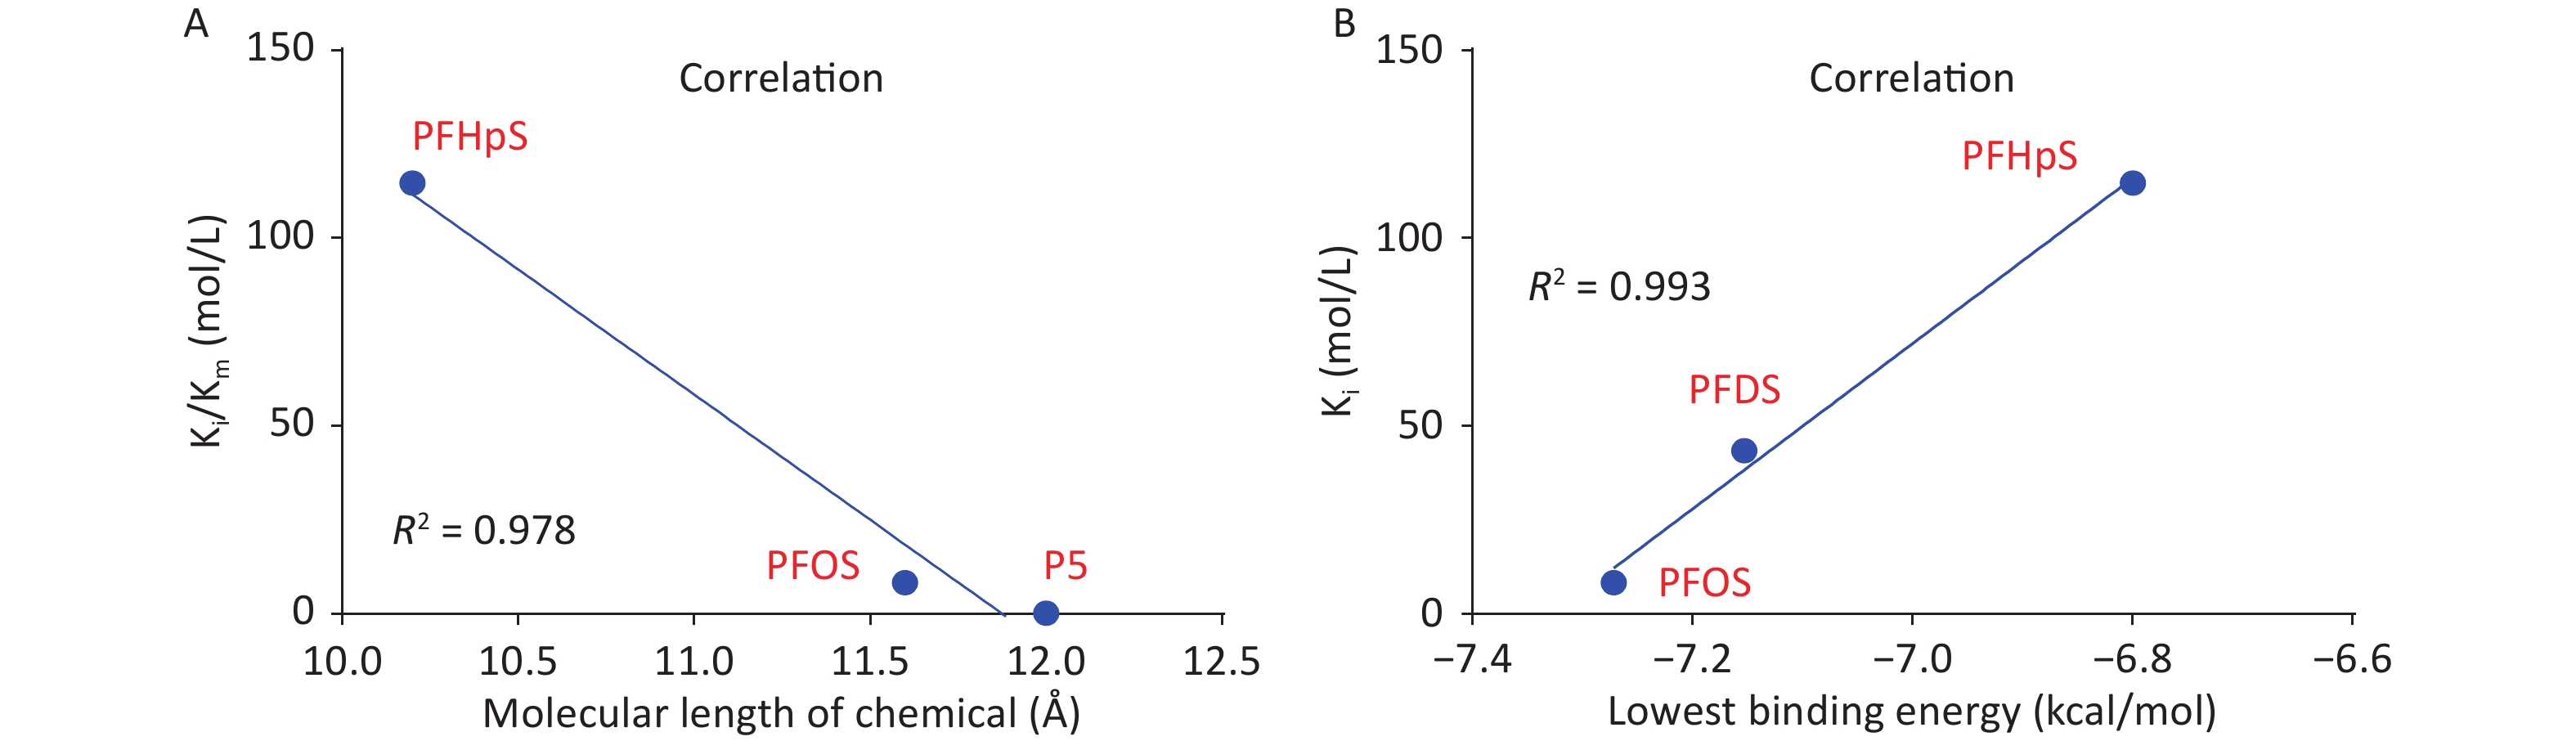
3D h3β-HSD1 structure (AF-P14060-F1) constructed using AlphaFold2 was used. P5 docked to h3β-HSD1. Docking revealed that P5 forms two hydrogen bonds with h3β-HSD1 catalytic residues, Ser125 and Tyr155 (Figure 4A), and contacts 13 residues (Val88, Ser125, Ile126, Glu127, Tyr155, Pro187, Met188, Tyr189, Ile190, Phe197, Tyr265, Ile319, and Leu322) (Figure 4B). This is consistent with the results of a previous docking model by Autodock for h3β-HSD1 with catalytic residues Ser124 and Tyr154, because it lacks one amino acid[27]. All PFSA were docked to the steroid-binding active site of h3β-HSD1. PFOS contacts five residues (Table 2), overlaps with four substrate-binding residues, and forms two hydrogen bonds (Figure 4C and 4D), and the lowest binding energy is −7.272 kcal/mol (Table 1). PFDS contacts eight residues (Table 2), overlaps with six substrate-binding residues, and forms one hydrogen bond with residue Tyr155 (Figure 4E and 4F), and the lowest binding energy is −7.153 kcal/mol (Table 1). PFHpS contacts 11 residues (Table 2), overlaps with six substrate-binding residues, and forms three hydrogen bonds (Figure 4G and 4H); the lowest binding energy was −6.800 kcal/mol (Table 1). Interestingly, the lowest binding energy values of other PFSA molecules were greater than −6.800 kcal/mol (Table 1), although they overlap with more than three substrate-binding residues (Supplementary Figure S1, available in www.besjournal.com). FTS connect with several substrate-binding residues and form hydrogen bonds with the catalytic residue Tyr155. However, the hydrogen atoms near the sulfonic acid moiety, instead of those near the fluorine atoms, may cause less negative attraction with h3β-HSD1, which may decrease the binding affinity (Supplementary Figure S1). The short-chain PFSA molecules, (such as PFBS), are extremely small, possibly decreasing the binding affinity (Supplementary Figure S2, available in www.besjournal.com). We further measured the molecular length of P5 and each PFSA, and found that the appropriate molecular length of P5, PFOS, PFBS, and PFDoS are 12, 11.6, 7.1, and 16.7 Å, respectively. We calculated the correlation between the Km of P5, Ki of PFHpS and PFOS, the molecular size, and the correlation between Ki and the lowest binding energy of PFHpS, PFOS, and PFDS. Ki/Km were inversely correlated with P5, PFHpS, and PFOS size (Figure 5A, R2 = 0.978), indicating that PFHpS and PFOS inhibit human 3β-HSD1, and Ki positively correlates with the lowest binding energy (Figure 5B, R2=0.993). This indicates that PFSA size should match the binding cavity like substrate P5 (12 Å), and lowest binding energy can well predict the inhibitory potency of PFSA.
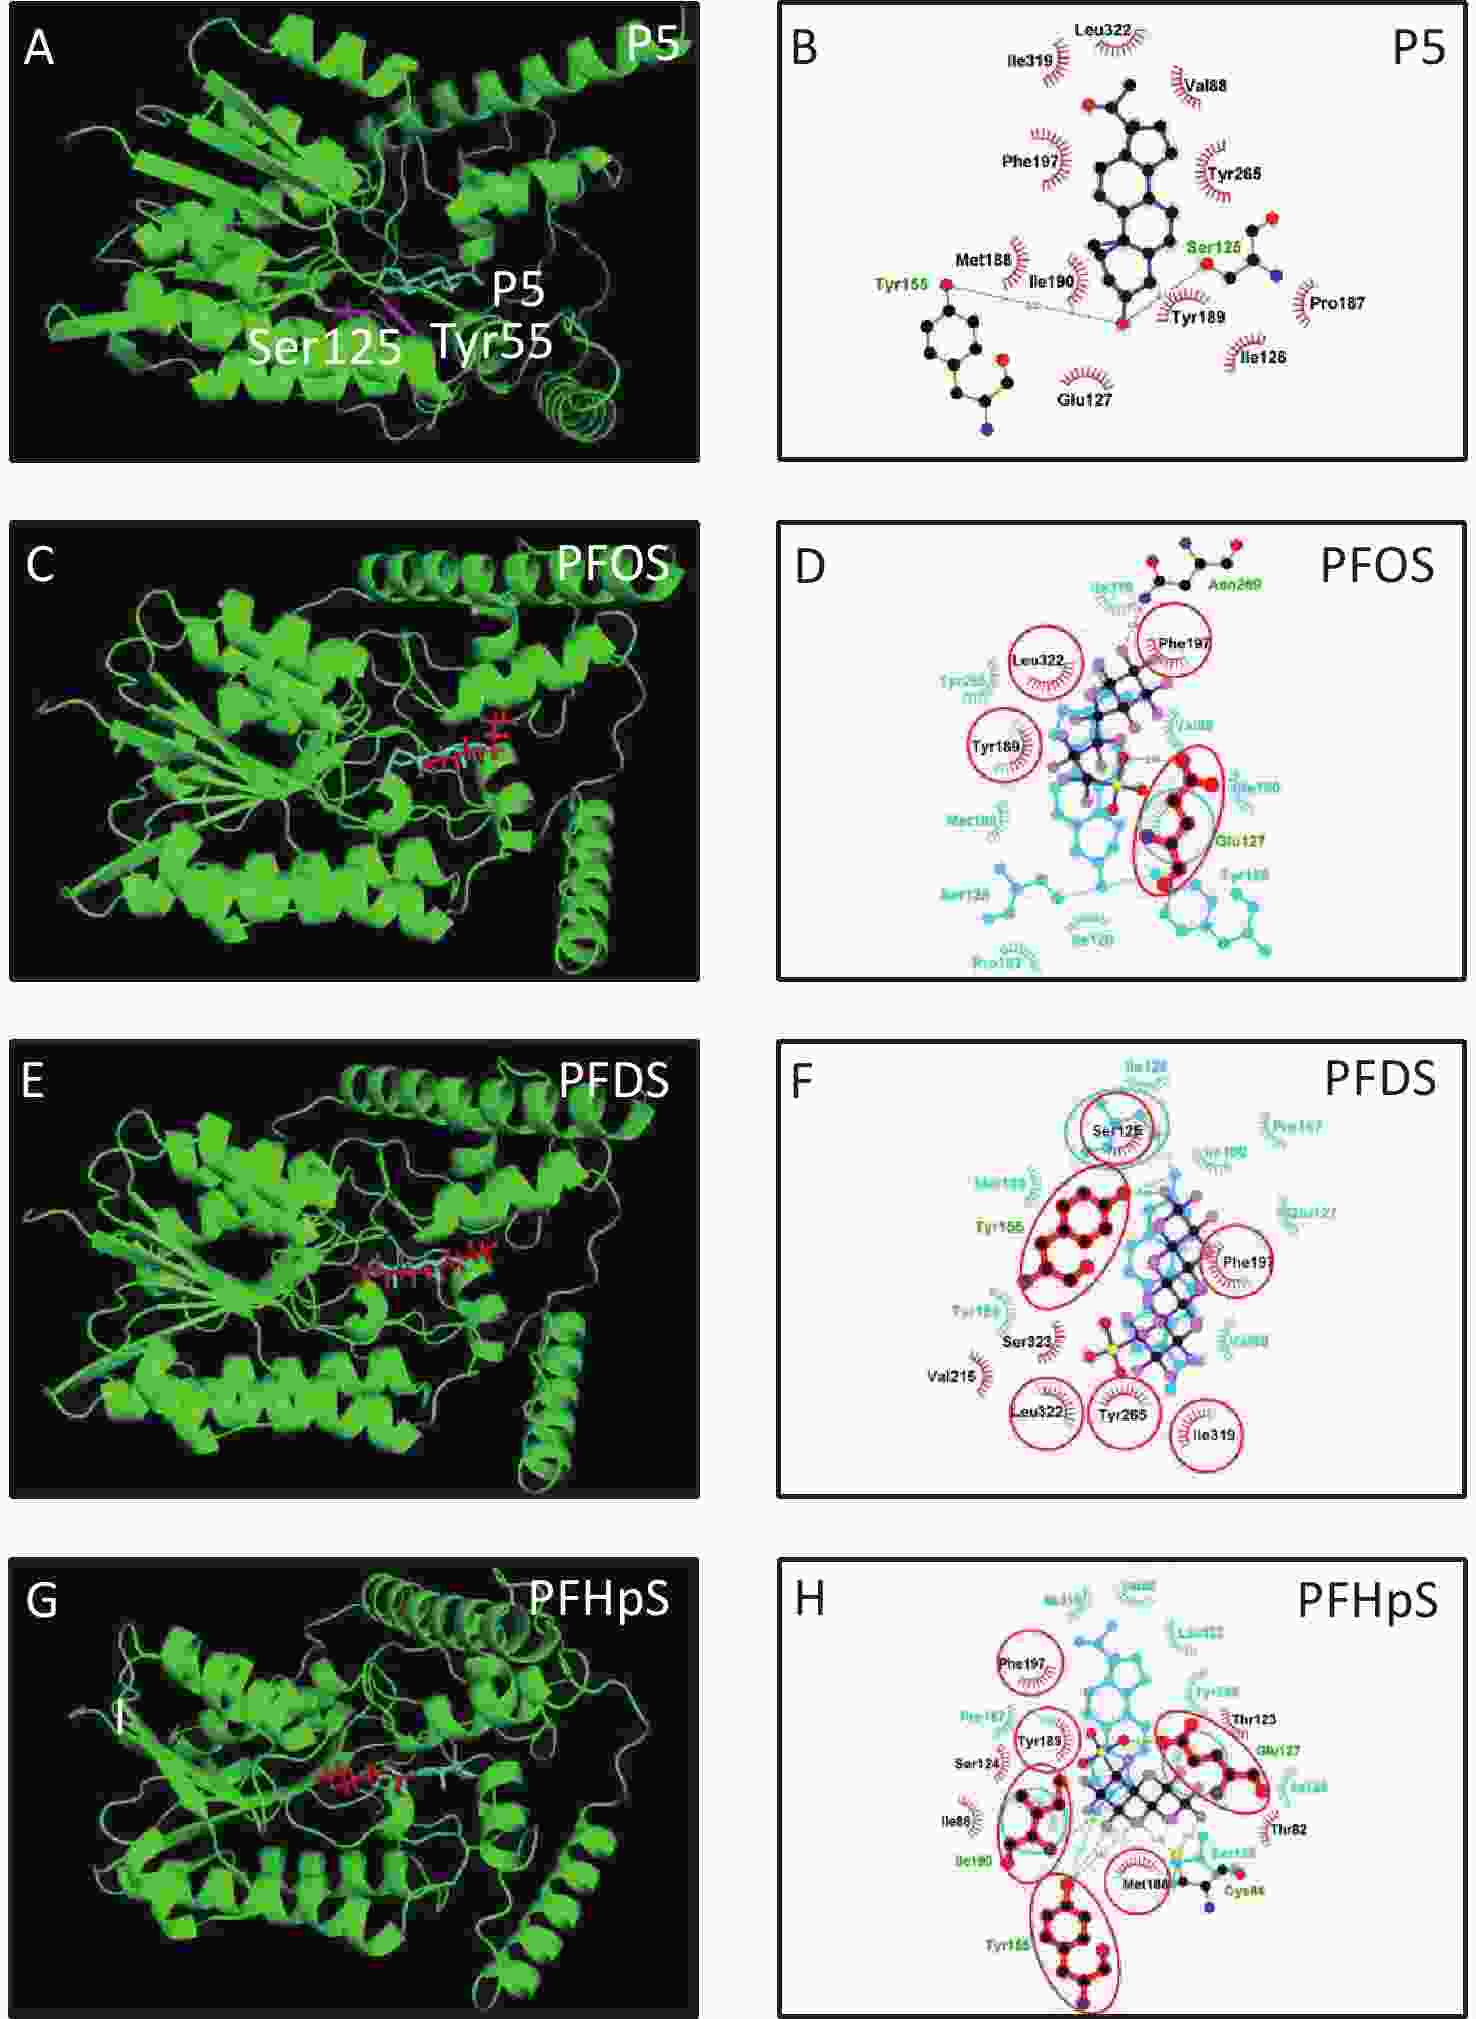
Figure 4. In silico analysis of perfluoroalkyl sulfonic acid with h3β-HSD1. The 3D model of h3β-HSD1 contains the catalytic residues Ser125 and Tyr155 (pink in A). (A, C, E, G) 3D structure of P5 (cyan), PFOS (red), PFDS (red), PFHpS (red), respectively; (B) 2D for P5; (D, F, H) superimposed images for PFOS (purple), PFDS (purple), PFHpS (purple): hydrogen bonds (green line), overlapping residues (red circled), P5 (cyan) as background. h3β-HSD1, human 3β-hydroxysteroid dehydrogenase 1; P5, pregnenolone; PFDS, perfluorodecanesulfonic acid; PFHpS, perfluoroheptanesulfonic acid; PFOS, perfluorooctanesulfonic acid.
Compd. Contacting residues H bonds Overlapping residues PFBS Ile86, Glu127, Tyr155, Val88, Tyr189, Ile190, Phe197, Leu322 Glu127(3.27Å), Tyr155(2.76Å) Val88, Glu127, Tyr155, Tyr189, Ile190, Phe197, Leu322 PFPS Ile86, Val88, Glu127, Tyr189, Phe197, Leu322 Glu127(2.84Å) Val88, Glu127, Tyr189, Phe197, Leu322 PFHxS Ile86, Val88, Glu127, Phe197 Glu127(2.71Å) Val88, Glu127, Phe197 PFHpS Thr82, Cys84, Ile86, Thr 123, Ser124, Glu127, Tyr155, Met188, Tyr189, Ile190, Phe197 Cys84(3.01Å), Tyr155(2.88Å), Glu127(2.88Å), Ile190(2.92Å) Glu127, Tyr155, Met188, Tyr189, Ile190, Phe197 PFOS Glu127, Tyr189, Phe197, Asn269, Leu322 Glu127(2.78Å), Asn269(3.32Å) Glu127, Tyr189, Phe197, Leu322 6:2FTS Glu127, Ser125, Tyr155, Met188, Tyr189, Ile190, Phe197 Tyr155(2.80Å) Glu127, Ser125, Tyr155, Met188, Tyr189, Ile190, Phe197 PFDS Ser125, Tyr155, Phe197, Val215, Tyr265, Ile319, Ser323, Leu322 Tyr155(2.78Å), Ser125, Tyr155, Phe197, Tyr265, Ile319, Leu322 8:2FTS Ser124, Ser125, Tyr155, Tyr189, Ile190, Phe197, Tyr265, Leu322 Ser155(2.89Å), Tyr155(3.00Å), Ser125, Tyr155, Tyr189, Ile190, Phe197, Tyr265, Leu322 PFDoS Ile86, Ser125, Glu127, Tyr155, Tyr189, Ile190, Phe197, Ans269, Leu322 Asn269(3.00Å) Ser125, Glu127, Tyr155, Tyr189, Ile190, Phe197, Ans269, Leu322 Note. PFBS, perfluorobutanesulfonic acid; PFDS, perfluorodecanesulfonic acid; PFHpS, perfluoroheptanesulfonic acid; h3β-HSD1, human 3β-hydroxysteroid dehydrogenase 1; PFHpS, perfluoroheptanesulfonic acid; PFHxS, perfluorohexanesulfonic acid; PFOS, perfluorooctanesulfonic a. Table 2. Contacting residues, hydrogen (H) bonds, and overlapping residues of PFSA with pregnenolone to human 3β-HSD1
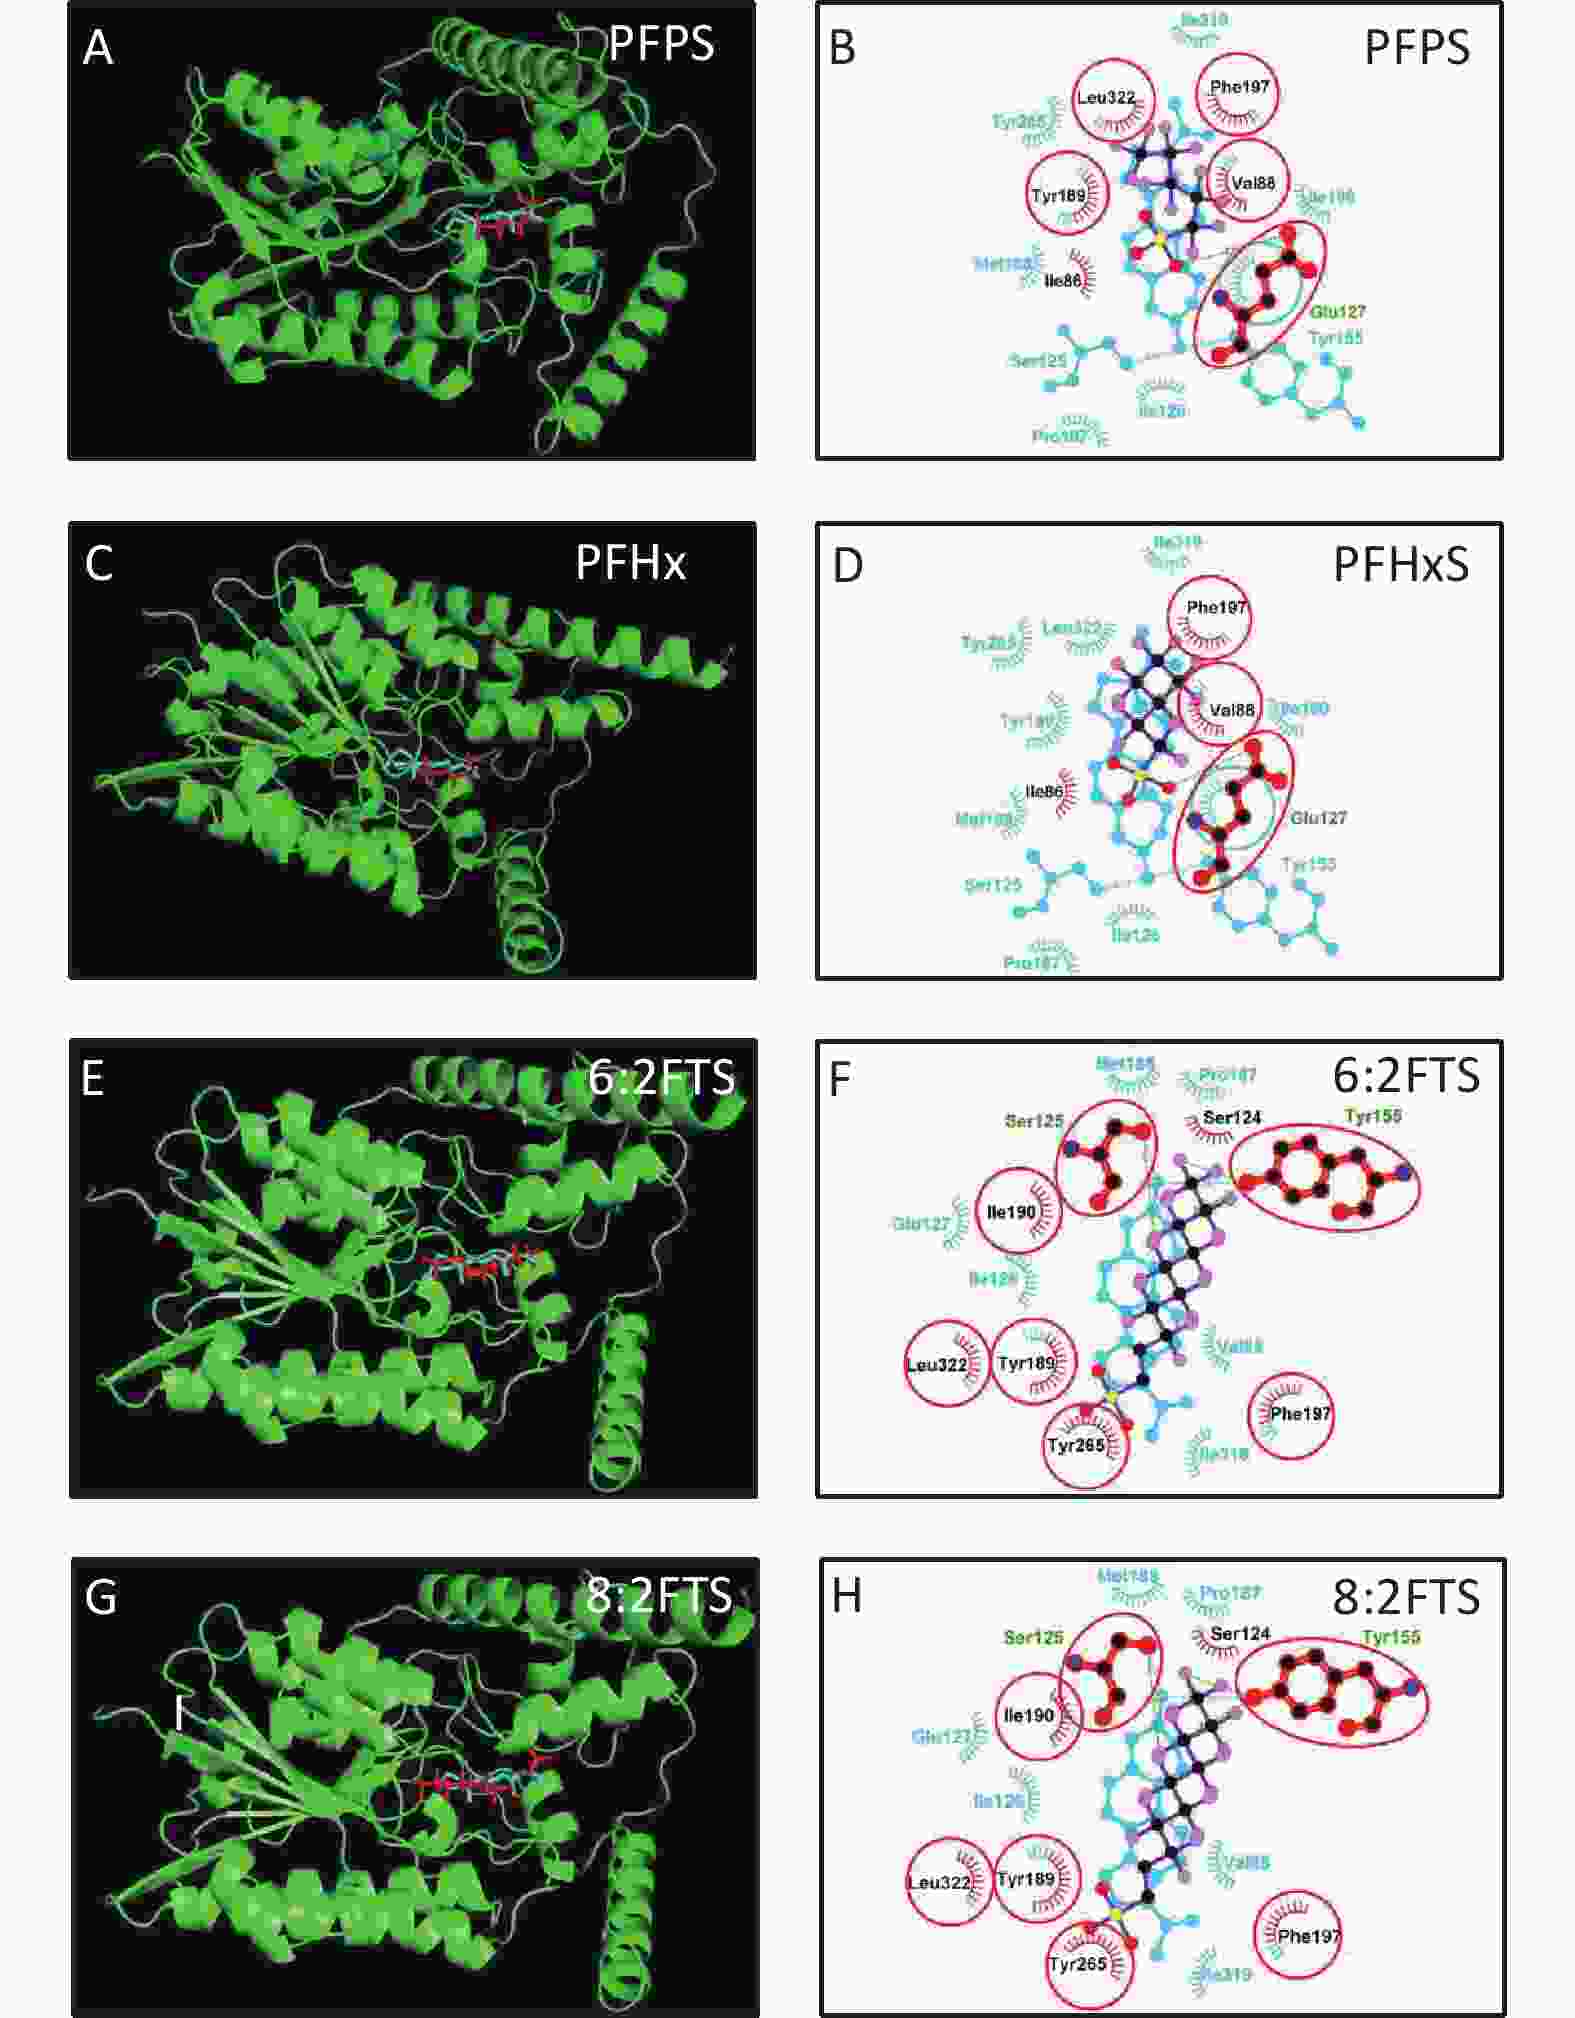
Figure S1. In silico analysis of PFSA with h3-HSD1
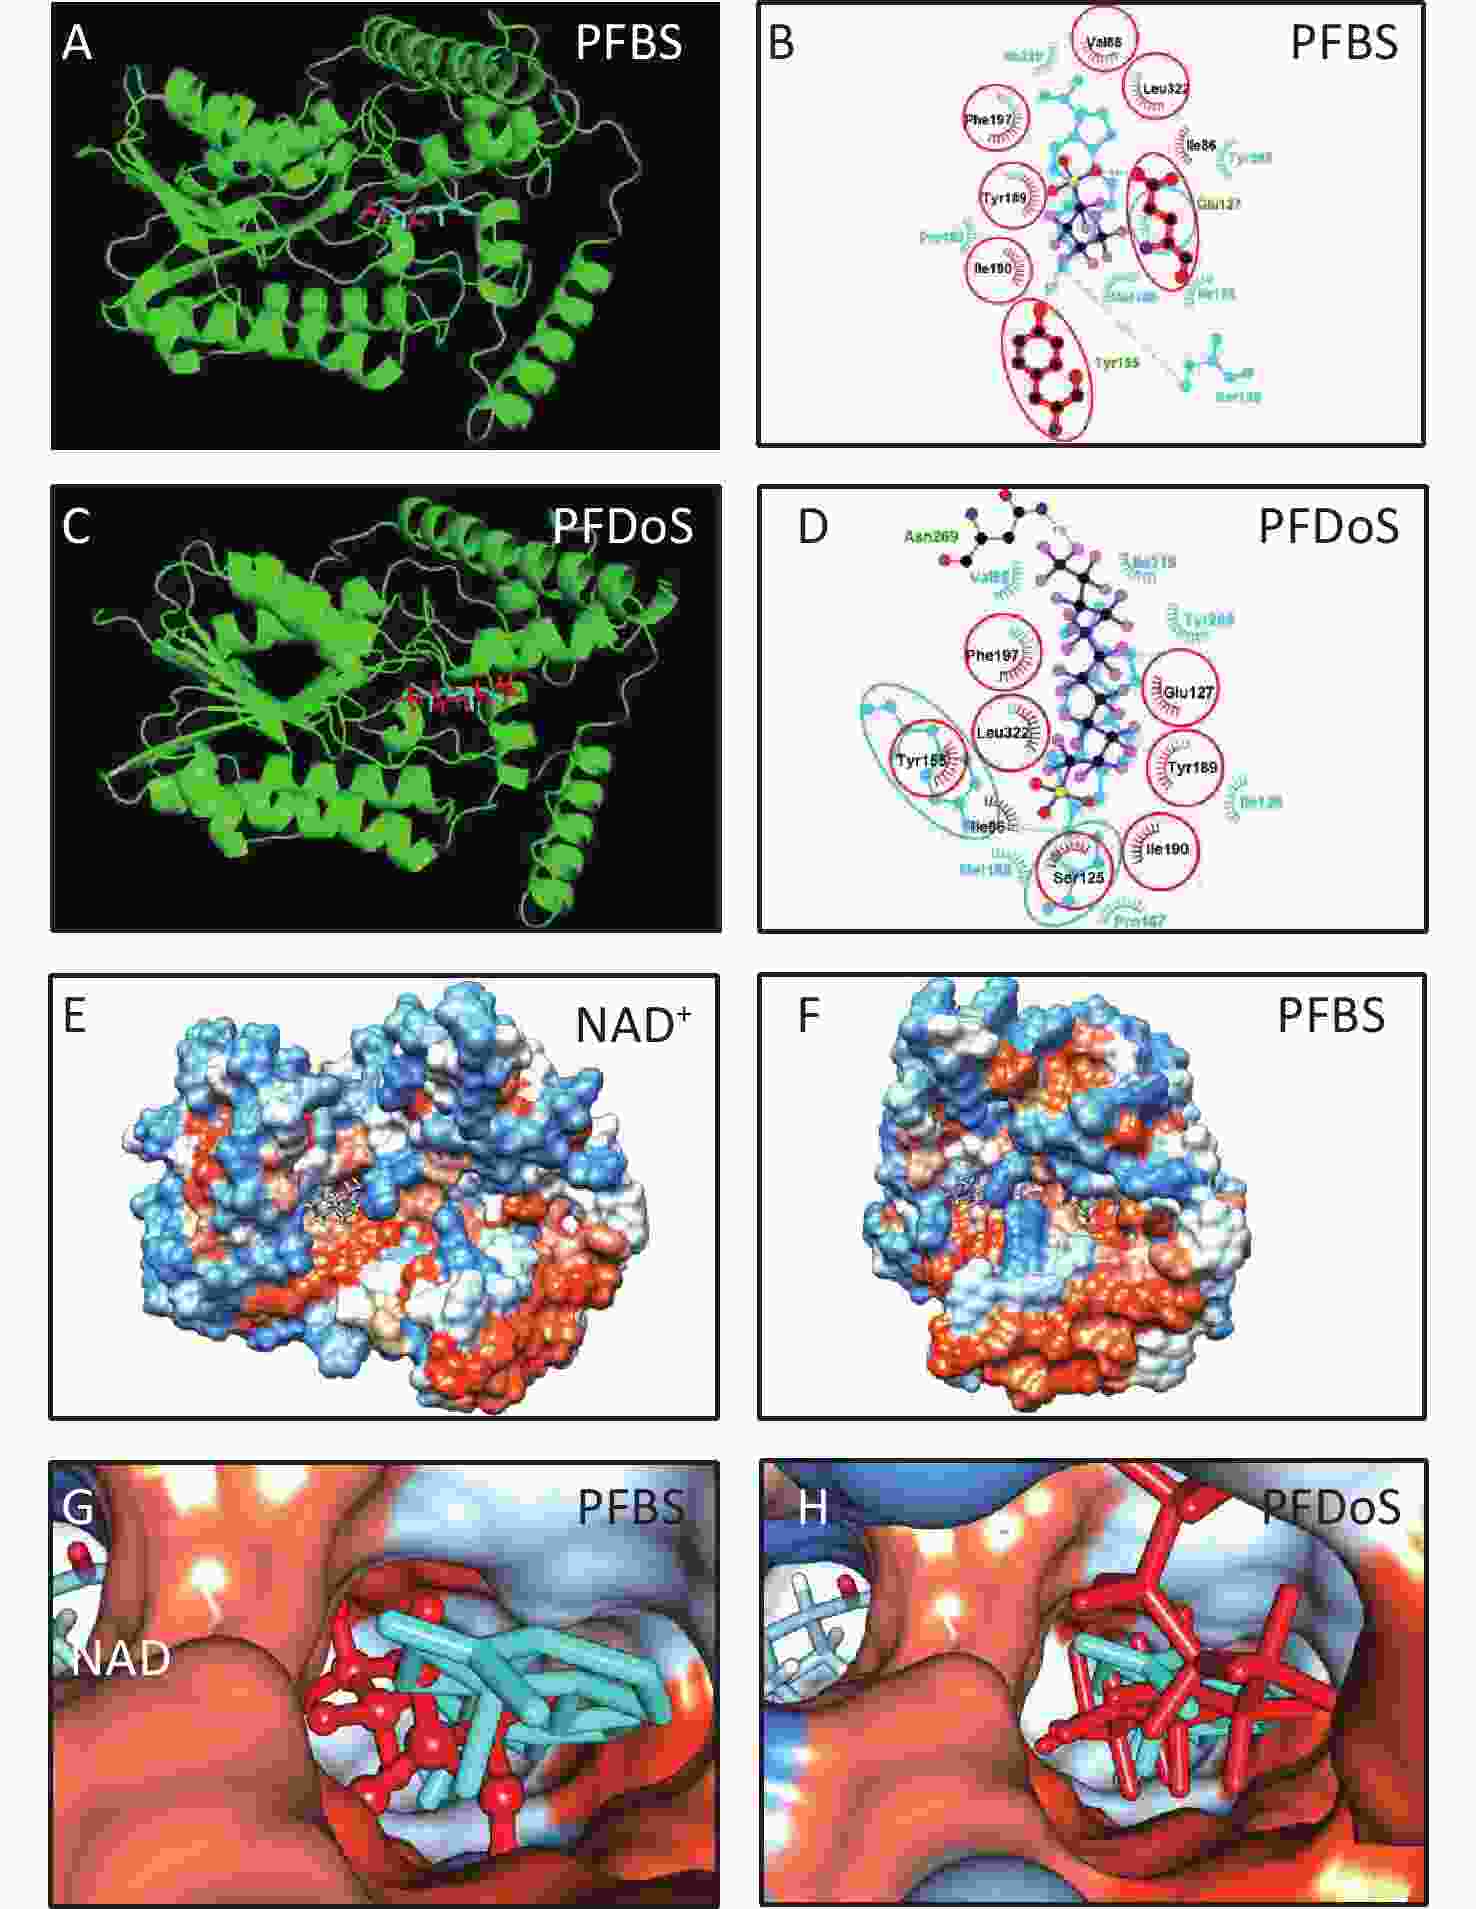
Figure S2. In silico analysis of PFSA with h3-HSD1
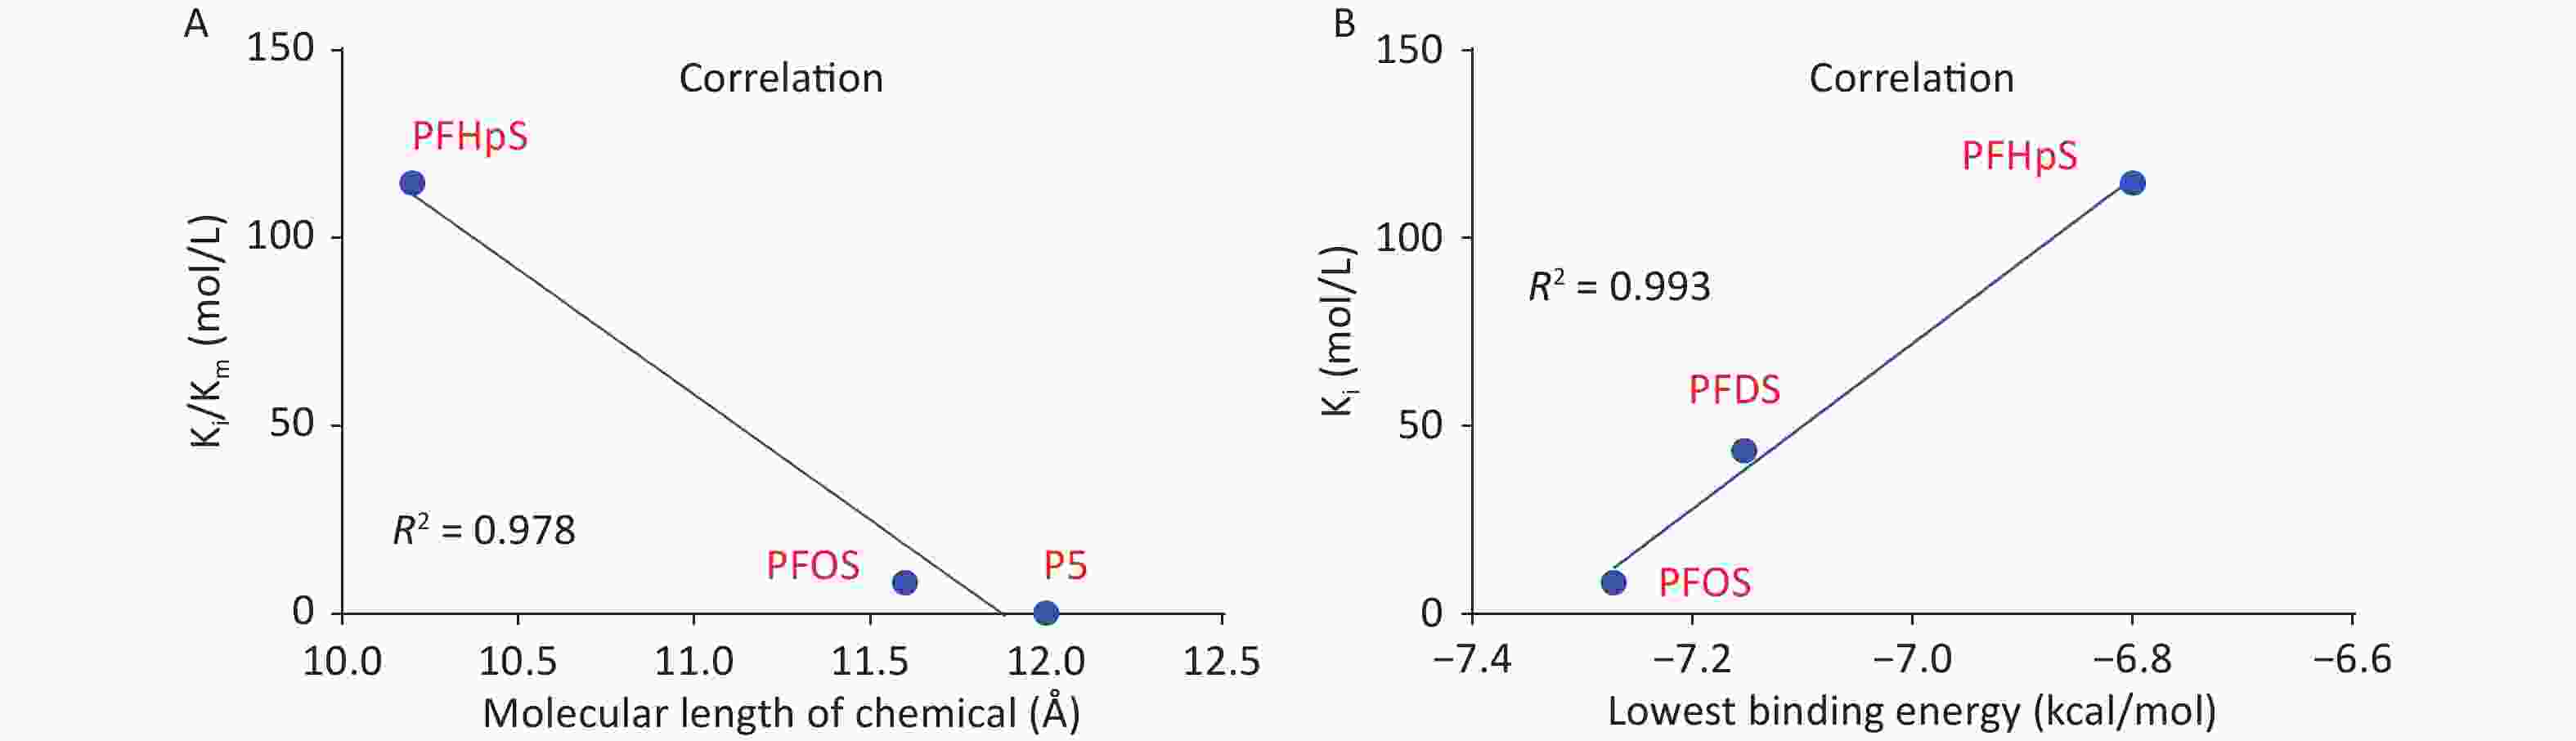
Figure 5. Correlation between Ki and (A) molecular length of P5 and perfluoroalkyl sulfonic acid and (B) lowest binding energy. Ki, inhibition constant; P5, pregnenolone; PFDS, perfluorodecanesulfonic acid; PFHpS, perfluoroheptanesulfonic acid.
-
To test whether PFOS and PFDS can inhibit P4 synthesis, JEG-3 cells were treated with 1–100 μmol/L PFOS and PFDS, where the highest concentration (100 µmol/L) was based on the highest serum PFSA levels (114.1 mg/L, 100–250 μmol/L PFOS) in occupational workers[28]. We found that ≥ 1 μmol/L PFOS significantly decreased P4 output and 10–100 μmol/L PFDS significantly reduced P4 levels (Figure 6). These results indicated that PFOS and PFDS can inhibit P4 biosynthesis.
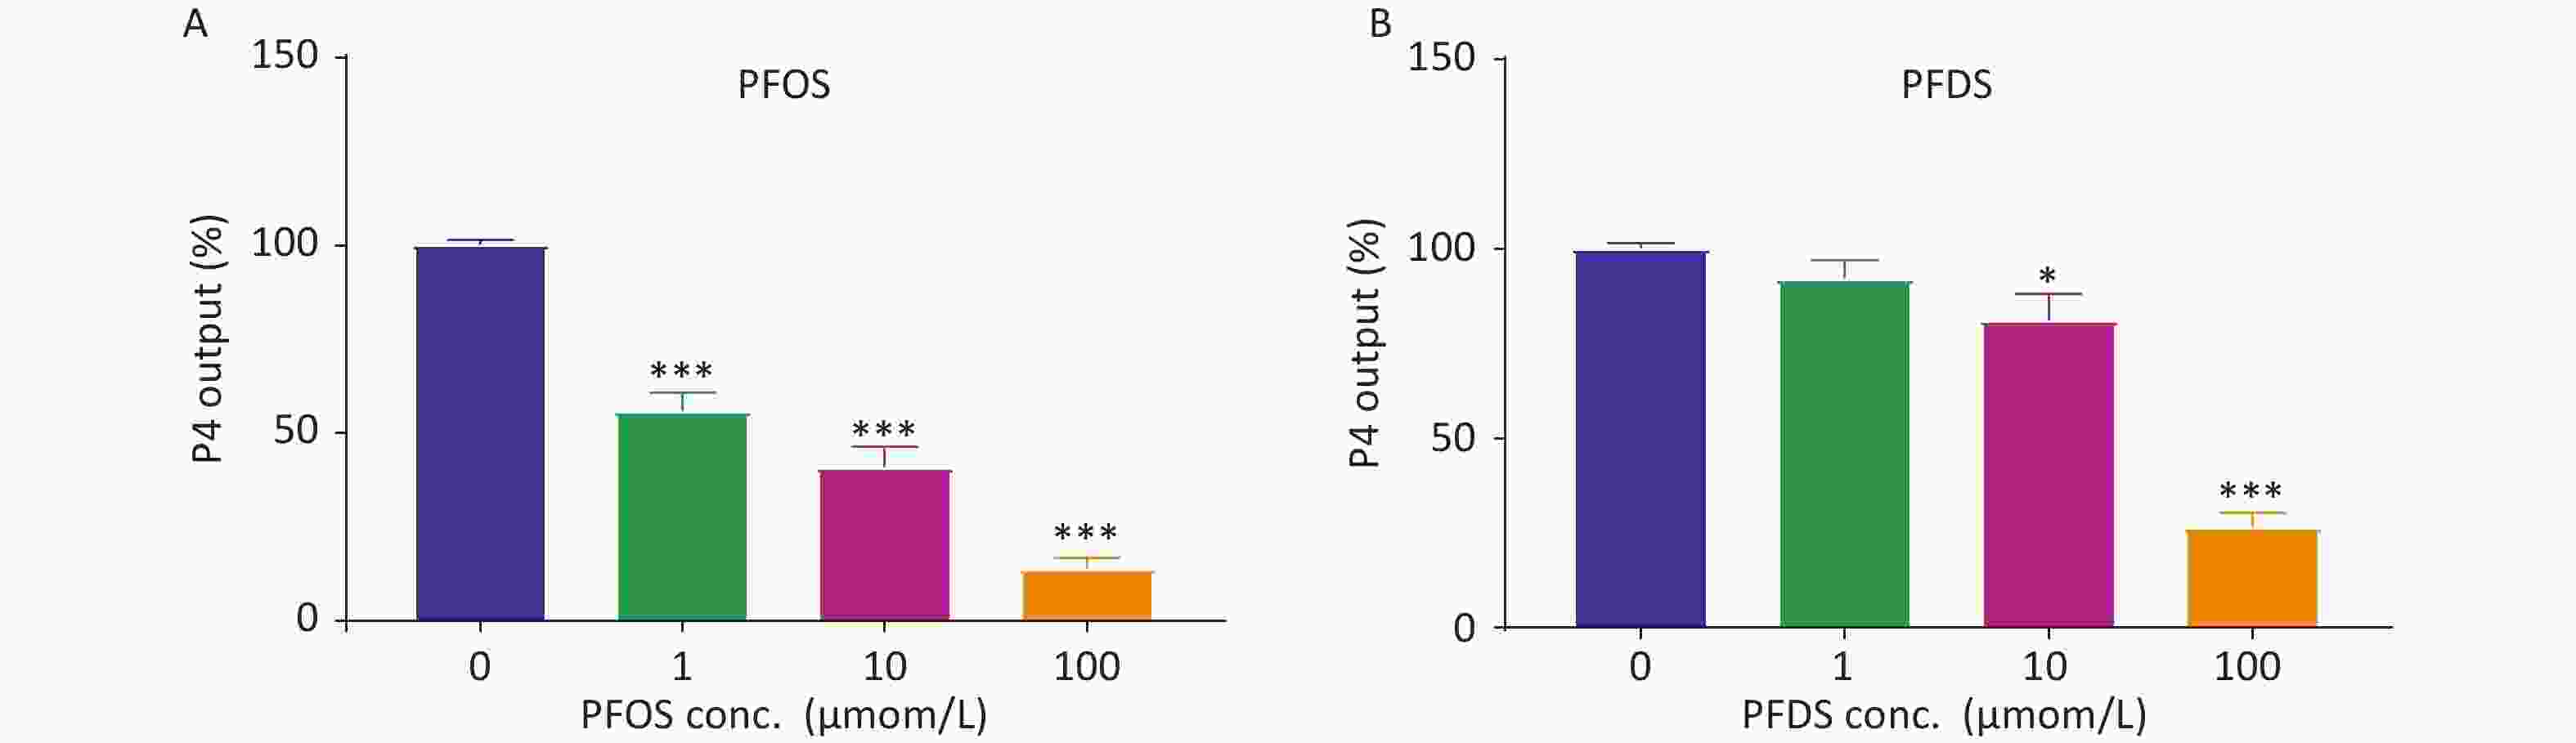
Figure 6. (A) PFOS- and (B) PFDS-mediated inhibition of P4 production by human JEG-3 cells after 24 h. means ± SD (n = 4); *P < 0.05, ***P < 0.001 compared to control. CON, control; P4, progesterone; PFDS, perfluorodecanesulfonic acid; PFOS, perfluorooctanesulfonic acid; SD, standard deviation.
-
Rat placental r3β-HSD4 is a human placental h3β-HSD1 homologue that is highly similar to human h3β-HSD1[15]. Previous studies have shown that some PFAS molecules, such as perfluoroundecanoic acid (PFUnA), inhibit rat r3β-HSD4 activity[16]. Michaelis–Menten kinetics analysis showed that the Km and Vmax of r3β-HSD4 were 0.228 ± 0.078 μmol/L and 37.38 ± 4.06 pmol/mg/min, respectively, (Figure 7A), and the Km is similar to the previously reported value[15]. We screened the inhibitory effect of 100 μmol/L PFSA on r3β-HSD4. None of the PFSA tested inhibited rat 3β-HSD4 (Figure 7B), indicating species-dependent difference in placental 3β-HSD inhibition.
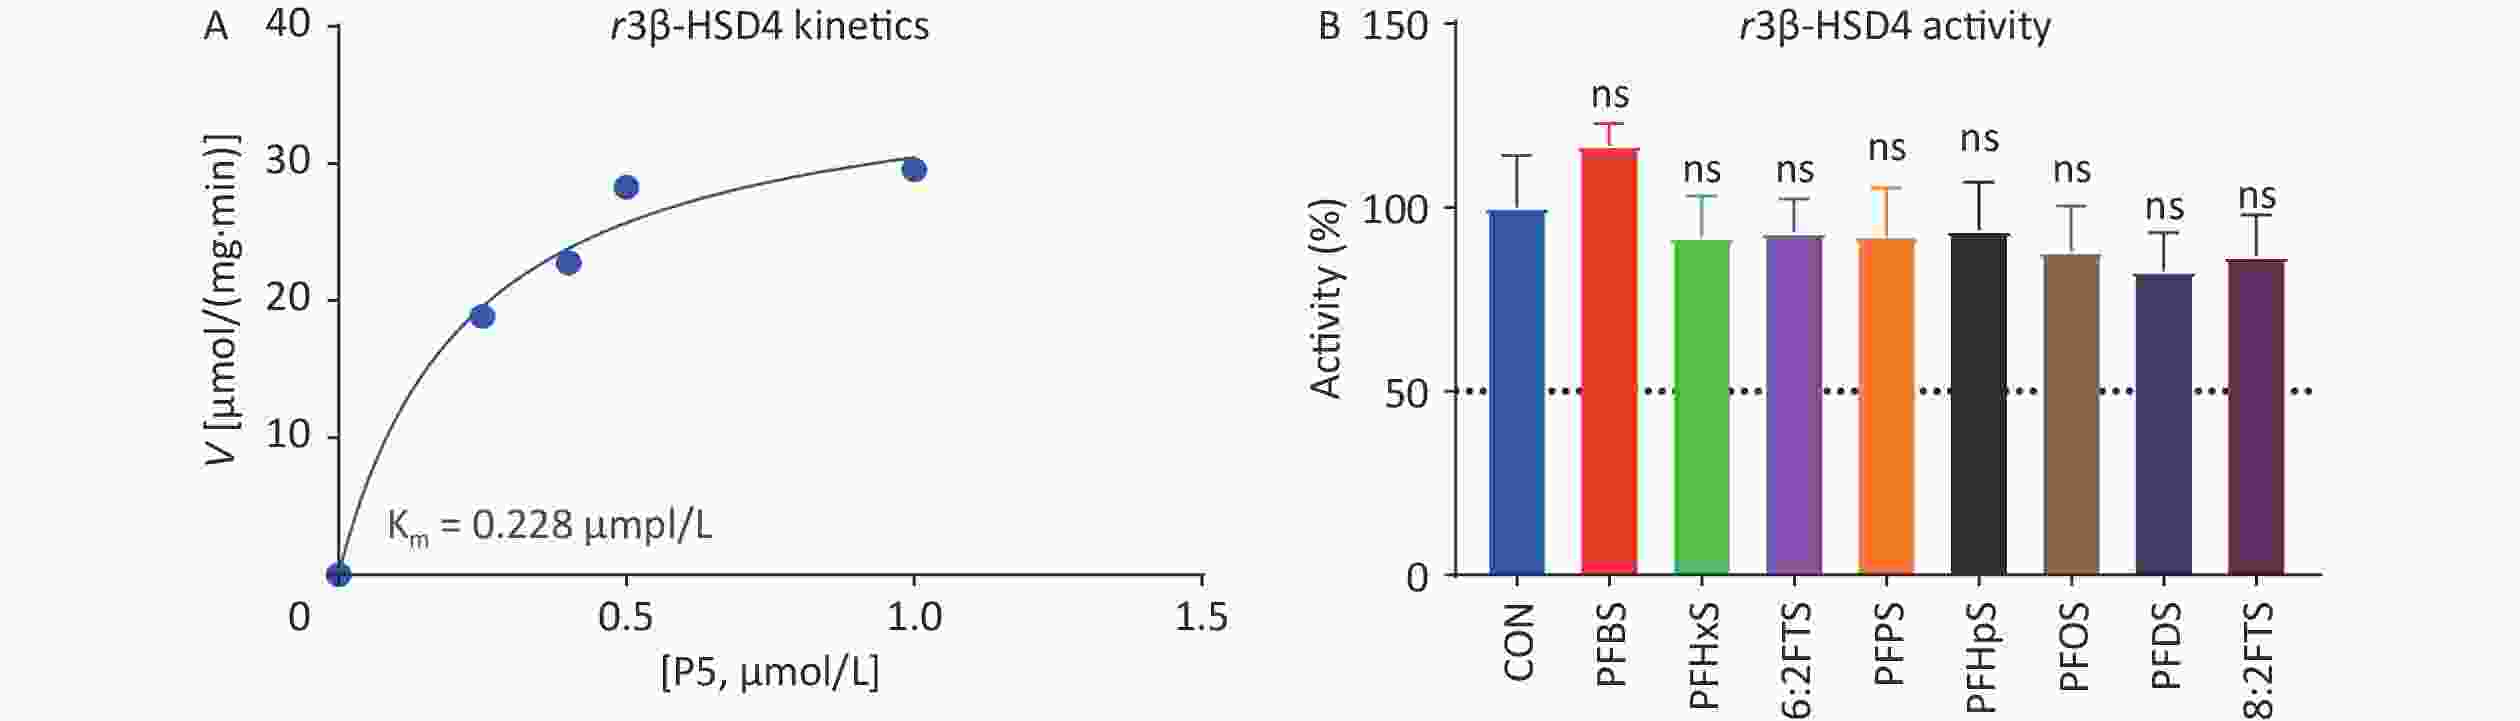
Figure 7. (A) Michaelis–Menten kinetics and (B) screening assay of perfluoroalkyl sulfonic acid to inhibit rat placental r3β-HSD4 activity. means ± SD (n = 4); No significant (“ns”) difference compared to CON was observed. CON, control; r3β-HSD4, rat 3β-hydroxysteroid dehydrogenase 4; SD, standard deviation.
-
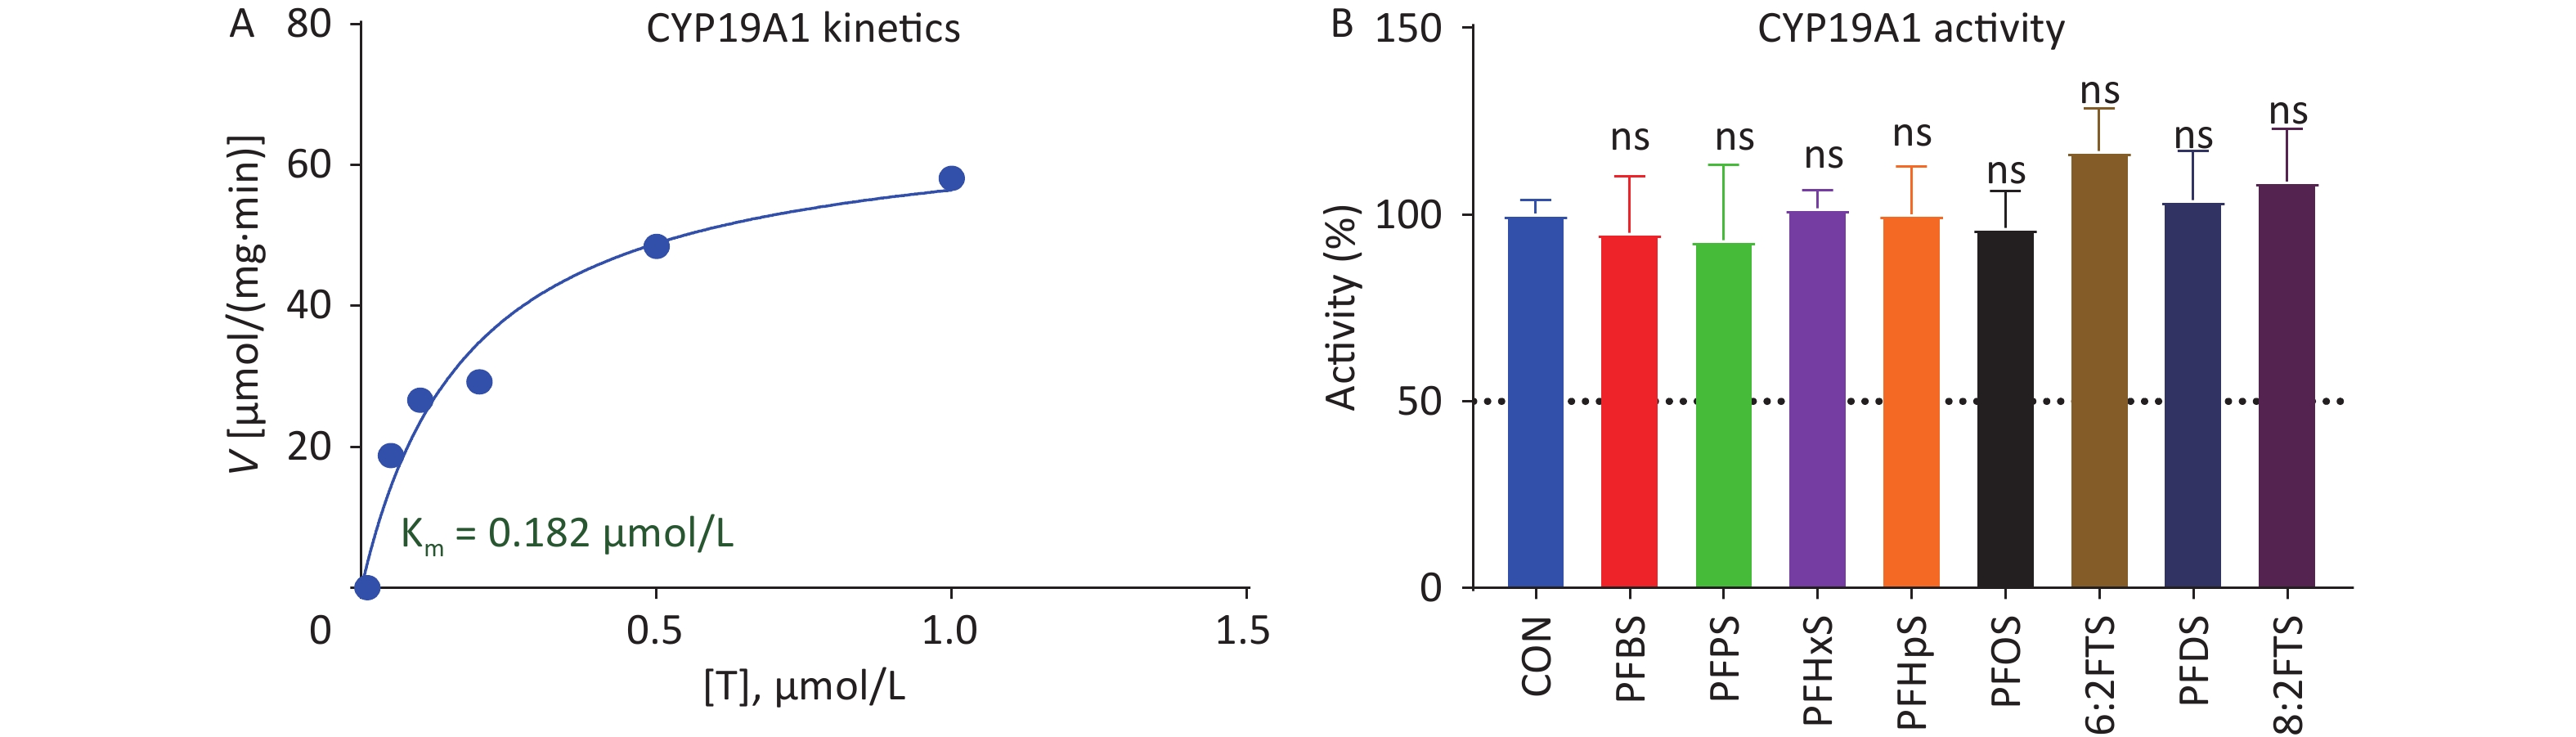
Human placental CYP19A1 catalyzes E2 formation from T. Michaelis–Menten kinetics analysis showed that the Km and Vmax of human placental CYP19A1 were 0.183 ± 0.053 μmol/L and 66.81 ± 6.63 pmol∙mg−1∙min−1, respectively (Figure 8A), and the Km is similar to the previously reported value [21]. We screened the inhibitory effect of 100 μmol/L PFSA on human placental CYP19A1. None of the PFSA tested inhibited human CYP19A1 (Figure 8B), indicating that PFSA specifically inhibits human placental 3β-HSD1 activity.
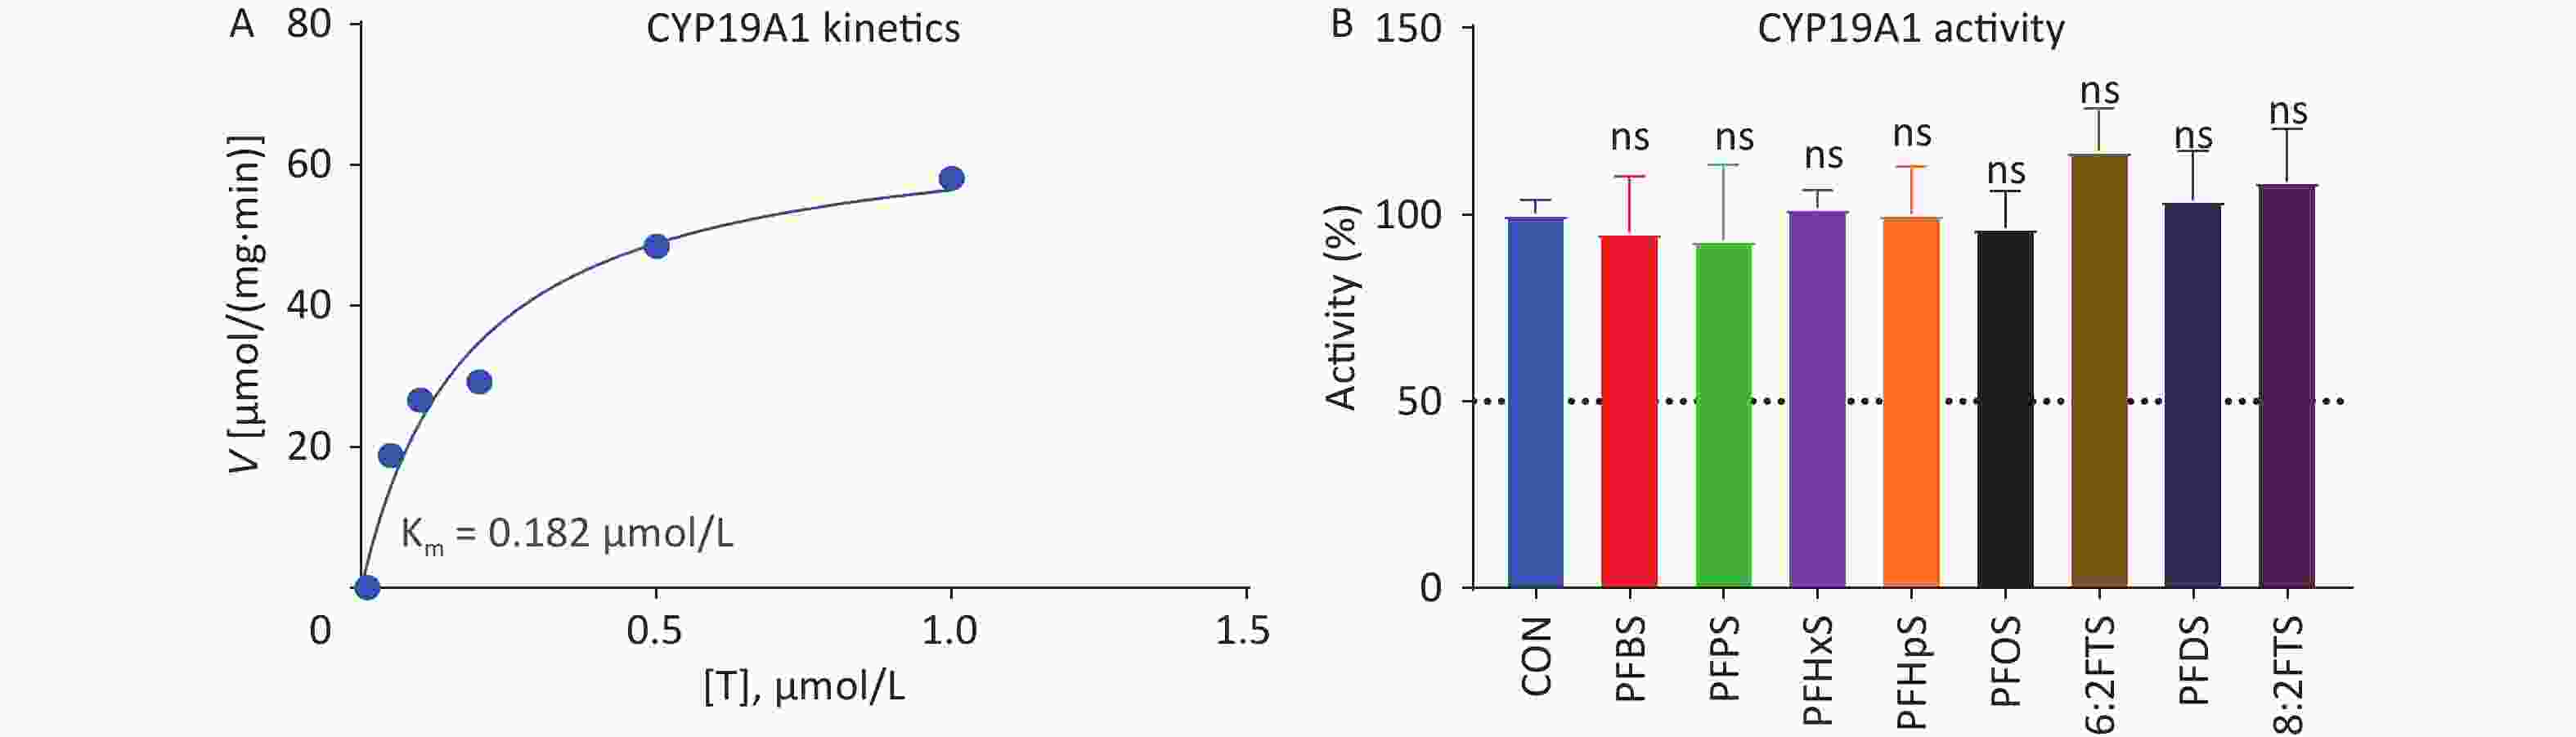
Figure 8. (A) Michaelis–Menten kinetics and (B) screening assay of PFSA to inhibit human placental CYP19A1 activity. means ± SEM (n = 4); No significant (“ns”) difference compared to CON was observed. CON, control; CYP19A1, aromatase; PFSA, polyfluoroalkyl sulfonic acid; SEM, standard error of mean.
-
This study shows that PFSA molecules structure-dependently inhibit human placental h3β-HSD1 activity in the order PFOS > PFDS > PFHpS > PFBS = PFPS = PFHxS = PFDoS = 6:2FTS = 8:2FTS. Since h3β-HSD1 is critical for P4 biosynthesis in the human placenta, some PFSA molecules may disrupt placental function by directly inhibiting h3β-HSD1 activity.
We have previously shown that inhibitory potency gradually increased in C9–C11 PFCA molecules, showed a V-shaped transition, and gradually lost in C11–C14 molecules[16]. Interestingly, we also observed this phenomenon in the PFSA subclass in this study: some PFSA from inhibitory potency gradually increased in PFHpS (C7) to PFOS (C8), followed by a V-shaped transition, and gradually lost in C8 to PFDoS (C12). However, the structure-dependent inhibition between PFCA and PFSA subclasses is slightly different: in PFCA subclass, 100 μmol/L PFHpA (C7) and PFOA (C8) did not inhibit h3β-HSD1 activity as previously reported[16], while in the PFSA subclass, 100 μmol/L PFHpS (C7) and PFOS (C8) significantly inhibited this enzyme activity (this study). These results indicate that the extra sulfur atom extends the carbon chain length and different functional groups (such as sulfonic acid in PFSA) change the inhibitory pattern.
Previous studies showed that h3β-HSD1 contains critical three catalytic residues: Ser124, Tyr154, and Lys158[27]. Due to the extra amino acids in our h3β-HSD1 model, our docking analysis showed that the catalytic residues of h3β-HSD1 are Ser125, Tyr155, and Lys159, and that P5 forms two hydrogen bonds with Ser125 and Tyr155, confirming Thomas’s model prepared using Autodock[27]. The molecular length of P5 is 12 Å. Docking analysis showed that all PFSA bound to the active site of the steroid-binding cavity of h3β-HSD1. However, the lowest binding affinity differs depending on the carbon chain length, additional sulfur atoms, and functional groups (sulfonic acid). The binding affinity gradually increased in C4–C8 PFSA molecules, as judged by the lowest binding energy, indicating that the inhibitory potency increased with size. However, the binding affinity gradually decreased in C8–C12 PFSA molecules, as judged by the lowest binding energy, indicated a decrease in inhibitory potency, leading to a V-shaped turn. The molecular length of PFSA, due to carbon and sulfur atom number, should be adequate to occupy the catalytic cavity for maximum binding with h3β-HSD1. Short-chain PFSA molecules, such as PFBS (7.2 Å), are small for significant hydrophobic interactions with h3β-HSD1 (Supplementary Figure S2). Long-chain PFSA molecules, such as PFDoS (16.7 Å), are easily stretched out from the catalytic cavity to form hydrophobic interactions with the catalytic residues of h3β-HSD1 (Supplementary Figure S2). PFOS molecule is 11.6 Å long, approximating the molecular length of substrate P5 (12.0 Å). This may explain why PFOS was the most potent PFSA to inhibit h3β-HSD1. Interestingly, 6:2FTS and 8:2FTS were ineffective than their analogs, PFOS and PFDS, although 6:2FTS and PFOS had the same number of carbon atoms and sulfonic acid group, and 8:2FTS and PFDS had the same number of carbon atoms and sulfonic acid group. Both 6:2FTS and P5 are 12 Å molecules, indicating that 6:2FTS may not have more negative charges from additional fluorine atoms compared to PFOS to form enough affinity. This could also be true for 8:2FTS.
Moreover, some PFAS can inhibit testicular h3β-HSD2, an h3β-HSD1 isoform[29]. Although h3β-HSD1 and h3β-HSD2 protein sequences are highly similar (93.6%)[30], they showed different sensitivity toward PFAS[29]. PFOS potently inhibits h3β-HSD1 (in this study), but did not affect h3β-HSD2 activity[29], indicating that h3β-HSD1 and h3β-HSD2 have different secondary structures.
PFAS also suppresses several hydroxysteroid dehydrogenase activities structure-dependently: PFOS > PFHxS = PFBS in inhibiting testicular r3β-HSD1 and human testicular 17β-hydroxysteroid dehydrogenase 3[29]; PFOS > PFHxS > PFBS in inhibiting human 11β-hydroxysteroid dehydrogenase 2; PFOS > PFHxS > PFBS in inhibiting rat 11β-hydroxysteroid dehydrogenase 2[31]; and PFOS > PFHxS = PPFBS in inhibiting human and rat 11β-hydroxysteroid dehydrogenase 1[32]. PFOS is the most potent inhibitor of these enzymes.
Previous studies showed that some PFCA molecules, such as perfluorodecanoic acid (PFDA), PFUnA, and perfluorododecanoic acid (PFDoA), moderately inhibits rat placental r3β-HSD4, although they were 4–5-fold less potent to inhibit r3β-HSD4 than h3β-HSD1[16]. Surprisingly, in this study, we found that all 100 μmol/L PFSA did not affect r3β-HSD4 activity. Therefore, there are clear species-dependent differences between humans and rats. However, PFOS potently inhibits rat testicular r3β-HSD1 (IC50: 1.35 μmol/L)[29], supporting the notion that PFOS specifically inhibits different 3β-HSD isoforms. We speculate that this may be due to the differences in the catalytic residue, for example, the catalytic residue Ser125 in h3β-HSD1 versus Thr125 in r3β-HSD4. Mutating Ser125 to Thr125 in h3β-HSD1 reduces the affinity for the inhibitor trilostane by approximately 10-fold[26,27], possibly explaining the insensitivity of r3β-HSD4 toward PFAS, including PFCA[16].
In this study, we showed that PFOS potentially inhibits h3β-HSD1 (IC50: 9.03 μmol/L) and PFDS was a moderate inhibitor of this enzyme. h3β-HSD1 inhibition apparently suppressed P4 production in JEG-3 cell line after PFOS and PFDS treatment (Figure 6). In this study, PFSA did not inhibit human placental CYP19A1 activity, indicating that PFSA specifically inhibit h3β-HSD1 activity.
Apparently, PFOS inhibits h3β-HSD1 activity, with IC50 within low micromolar range. The IC50 of PFOS for inhibiting h3β-HSD1 activity (approximately 60 nmol/L) was higher than the average serum PFOS level (33.3 ng/mL) in China[7]. However, for occupational workers, the concentration of some PFAS (such as PFOS) can exceed 100 μmol/L[3,28], so people raised concerns about occupational workers.
P4 production in the human placenta is important for maintaining pregnancy. Some PFSA molecules inhibit h3β-HSD1 activity, possibly impairing placental function. Human studies have identified associations between PFOS, preeclampsia, and low birth weight[11-14]. Direct placental h3β-HSD1 inhibition by PFOS may also cause these adverse effects. However, data from direct inhibition studies and human cell lines should be extrapolated cautiously.
In conclusion, this study demonstrated the structure-dependent PFSA-mediated inhibition of human h3β-HSD1 activity. The inhibitory potency of PFSA was in the order PFOS > PFDS > PFHpS > PFBS = PFPS = PFHxS = PFDoS = 6:2FTS = 8:2FTS, and an adequate molecule size and functional group (sulfonic acid) of PFSA were critical for the inhibition of h3β-HSD1 activity. PFOS is the most potent inhibitor of human h3β-HSD1 among PFSA.
-
The authors declare no conflicts of interest. L.T., B. M., and B.Z. designed the study, analyzed the data, and wrote the manuscript. J. L. and Y.T. conducted the study. H.L. helped with the design and docking analysis. R.G. helped with the design, editing, and funding.
HTML
Chemicals and Animals
Microsomal Preparation
3β-HSD Assay
P4 Amount Determination Using HPLC–MS/MS
JEG-3 Cell Culture and Treatment
CYP19A1 Activity Assay
Dose Response and Enzyme Kinetics Inhibition Analysis
Molecular Simulation Analysis for PFSA with h3β-HSD1
Statistics
PFSA Structure-Dependently Inhibit h3β-HSD1 Activity
Docking Analysis of PFSA with h3β-HSD1
PFOS and PFDS Inhibit P4 Production in JEG-3 Cells
PFSA Do not Affect Rat Placental r3β-HSD4 Activity
PFSA Do not Affect Human Placental CYP19A1 Activity
 22411+Supplementary Materials.pdf
|

|

 Quick Links
 DownLoad: