

-
With the increasing aging of society, dementia has become one of the most important health issues worldwide. Alzheimer’s disease (AD) is the most prominent form of dementia, accounting for over half of the dementia population[1]. AD is a neurodegenerative condition manifested with progressive cognitive decline and impaired learning memory. It is characterized by the overproduction of senile plaques induced by the extracellular deposition of amyloid β-peptide (Aβ) and intracellular nerve fiber entanglements consisting of highly phosphorylated tau protein (p-Tau) in the brain. The prevalence of AD increases progressively with age, and the prevalence among people aged 65 years or older in China is as high as 4%–6%. The treatment and care costs of patients with AD are high[2]; however, existing therapies are symptomatic in nature and only temporarily improve the quality of life of patients in the late stages[3]. Therefore, it is of great social significance to explore the pathogenesis of AD to find effective prevention and treatment strategies.
Well-established studies have shown that there are many factors influencing the occurrence of AD, including the external environment, lifestyle, genetics, aging, and stress response of the organism[4]. Among them, hippocampal oxidative stress induced by elevated levels of reactive oxygen species (ROS) can promote Aβ deposition, tau hyperphosphorylation, and synaptic and neuronal loss[5], thereby playing an important role in the pathogenesis of AD[6]. Nuclear factor erythroid 2-related factor 2 (Nrf2) is a redox-regulated transcription factor that protects cells from oxidative stress injury by counteracting the deteriorating effects of persistent oxidative protein expression[7]. Notably, activation of the Nrf2/heme oxygenase-1 (HO-1) signaling pathway has been shown to reduce oxidative damage and improve cognitive performance in AD transgenic mice[8,9]. Moreover, activation of Nrf2 promotes the autophagic clearance of p-Tau and subsequently leads to increased autophagic flux and lysosomal-mediated protein degradation and clearance of damaged organelles. Previous studies have shown that Nrf2 deficiency is associated with reduced autophagic flux[10-12]. Adenylate-activated protein kinase (AMPK) is a key energy sensor that promotes autophagy and regulates cellular metabolism to maintain energy homeostasis. Mammalian target of rapamycin (mTOR) is a major regulator of autophagy, regulating cell proliferation, death, and protein synthesis under starvation or cellular stress[13]. Multiple studies have emphasized that AMPK/mTOR signaling acts as an important regulatory pathway of autophagy[14-16] and plays a significant role in improving cognitive function and neurological deficits in Aβ precursor protein (APP)/presenilin 1 (PS1) double transgenic mice[17].
Recently, deglycase protein 1 (DJ1) was discovered to have a variety of neuroprotective properties and may be a promising target for AD intervention[18,19]. DJ1 is associated with Nrf2 stability and can stimulate Nrf2’s separation from its repressor kelch-like hydrates-associated protein 1 (Keap1), thereby promoting the intranuclear translocation of Nrf2[20,21]. Up-regulation of DJ1 is associated with the inhibition of synaptic nuclear protein α-synuclein and non-soluble Aβ42 expression[22]. However, direct evidence connecting DJ1 dysregulation with cognitive decline and AD-like lesions is still lacking, and comprehensive research into the precise mechanisms of action is still needed.
There are many types of mouse models used in AD research, such as SAMP8, APP transgene animals, and APP/PS1 double transgenic animals; however, APP/PS1 transgenic mice were shown to express both mutant human beta amyloid precursor protein SWE (APPswe) and mutant presenilin 1 (PS1DeltaE9)[23]. Around three months of age, APP/PS1 mice exhibit altered behavior and cognitive performance. At five to six months, overexpression and development of fibrous plaques in the hippocampus were observed[23], which gradually increased with age. Compared with other mouse models, APP/PS1 mice have more obvious pathological symptoms and can better simulate the development of AD[24,25]. Therefore, APP/PS1 mice have been widely used in AD research and were chosen for use in this study as an AD model. The effects of DJ1 on AD-like changes in APP/PS1 mice were examined by the overexpression or down-regulation of adeno-associated virus (AAV)-DJ1, and whether DJ1 could control oxidative stress and autophagy was examined by activating the Nrf2/HO-1 and AMPK/mTOR signaling pathways.
-
The Adeno-associated virus (AAV) was provided by Shanghai Jima Pharmaceutical Technology Co., LTD (Qingdao, China). The brain stereoscopic locator was purchased from Anhui Zhenghua Biological Instrument Equipment Co., LTD (Anhui, China). The Morris Maze was purchased from Shanghai Xin Soft Information Technology Co., LTD (Shanghai, China). Commercial assay kits for total antioxidant capacity (T-AOC), total superoxide dismutase (T-SOD), malondialdehyde (MDA), and glutathione peroxidase (GSH-PX) were purchased from Nanjing Jiancheng Biological Engineering Institute (Nanjing, China). Detailed information on the primary antibodies used is presented in Table 1. Horseradish-peroxidase (HRP)-conjugated goat anti-rabbit and anti-mouse IgG were purchased from Proteintech (Wuhan, China).
Antibody Producers Catalogue
numberSource Dilution APP Cell Signaling Technology 15126S Rabbit 1:1,000 Aβ40 Cell Signaling Technology 12990S Rabbit 1:1,000 Aβ42 Cell Signaling Technology 14974s Rabbit 1:1,000 p-Tau Cell Signaling Technology 23214S Rabbit 1:1,000 Tau Cell Signaling Technology 46687S Rabbit 1:1,000 Ox-DJ1 Emd Millipore Corporation MABN1773 Rat 1:10,000 DJ1 Abcam ab18257 Rabbit 1:1,000 Nrf2 Cell Signaling Technology 12721S Rabbit 1:1,000 Keap1 Cell Signaling Technology 8047S Rabbit 1:1,000 HO-1 Cell Signaling Technology 86806S Rabbit 1:1,000 p62/SQSTM1 Cell Signaling Technology 23214S Rabbit 1:1,000 LC3 Proteintech 14600-1-AP Rabbit 1:5,000 Beclin1 Servicebio GB11228 Rabbit 1:4,000 p-AMPK Abclonal AP883 Rabbit 1:2,000 AMPK Proteintech 18167-1-AP Rabbit 1:2,000 P-mTOR Abcam ab109268 Rabbit 1:10,000 mTOR Abcam ab32028 Rabbit 1:5,000 Caspase3 Proteintech 19677-1-AP Rabbit 1:2,000 Bax Proteintech 50599-2-Ig Rabbit 1:10,000 Bcl-2 Proteintech 26593-1-AP Rabbit 1:2,000 PCNA Cell Signaling Technology 13110S Rabbit 1:1,000 β-actin Proteintech 20536-1-AP Rabbit 1:5,000 GAPDH Abcam ab181602 Rabbit 1:10,000 Table 1. Detailed information of primary antibodies used
-
Forty male 7-month-old SPF APP/PS1 mice were selected and purchased from Kavenberg Model Animal Research Co., LTD (Suzhou, China). The animals were raised in the barrier environment of the Experimental Animal Center, School of Public Health, Zhengzhou University. The experimental mice were housed in cages with free access to water and food, and had light/dark cycling of 12 h. The ambient temperature was 20–25 °C and the humidity was 50%–60%. After one week of adaptive feeding, the 40 APP/PS1 mice were randomly divided into four equal groups. Overexpression or knockdown of AAV was injected into the hippocampus of two groups of mice through brain localization surgery to construct AD model mice with DJ1 overexpression or knockdown. The four groups were: AD model control group (MC), AAV vector control group (NC), DJ1 up-regulation group (DJ1+), and DJ1 knockdown group (DJ1−). After 21 days of feeding, behavioral tests were performed, followed by anesthesia and euthanasia, and samples were collected. The protocol was reviewed and approved by the Life Science Ethics Committee of Zhengzhou University (ethical approval number zzuGZR2018-03).
-
AAV is a single-stranded linear DNA virus that is a safe, durable, efficient, and highly specific gene-manipulation tool. To date, AAV-based gene vectors have been used in a large number of clinical trials for gene therapy[26]. AAV has multiple serotypes (1-9, Rh10), among which AAV-9 is capable of vectorial translocation and long-term expression in the hippocampus[27]. We used the brain localization injection technique to inject AAV9-DJ1 into the bilateral hippocampal regions of the mice. During localization, a locating needle was used to locate and drill holes 2 mm behind the fontanelle and approximately 2 mm beside the sagittal suture, and then 2 µL of AAV-DJ1 was injected into each hippocampus.
-
The Morris water maze (MWM) behavioral study was performed on APP/PS1 mice in each group three weeks after brain localization injection. MWM was performed according to previous reports with some modifications[28]. Before the formal water maze experiment began, the APP/PS1 mice were acclimatized for two days. In the hidden platform training, the mice were trained for four days and were given a limit of 90 s to find the platform that was submerged 1 cm below the water surface. The mice performed 4 trials per day at 15 min intervals. On the last day of the space exploration test, the platform was removed, and the number of times the mice crossed the platform region for 1 min was recorded. All data were recorded using a computer program.
-
All APP/PS1 mice were fasted overnight, weighed, and euthanized using sodium pentobarbital (40 mg/kg). Blood samples collected by cardiac aspiration were centrifuged at 3,000 rpm at 4 °C for 15 min to separate the upper serum. Samples were stored at –80 °C[29] before further biochemical analysis. For histological studies, the brains of mice were removed and immediately divided into two halves on ice. One half was fixed in 4% paraformaldehyde for morphological identification, and hippocampal tissue from the other half was collected and stored at –80 °C for subsequent experiments.
-
AD is a progressive neurological dysfunction disease and studies have found that as the disease progresses, the brains of patients with AD experience brain cell death and atrophy compared to the brains of healthy individuals[30]. The brain index is a simple and effective index for evaluating brain atrophy and was calculated as: Brain index = brain weight (g)/rat total body weight (g).
-
Mouse brains were fixed in 4% paraformaldehyde for 48 h, followed by graded dehydration in ethanol, xylene removal, and paraffin-embedding. Paraffin sections (10 μm thick) were soaked in hematoxylin stain for 5 min, washed with water, and then fractioned and liquefied. Slides were washed with water and then with performing anti-blue. The sections were dehydrated with gradient alcohol and soaked in an eosin staining solution for 5 min. The stained sections were soaked in anhydrous ethanol and xylene and then sealed with neutral resin. The stained images were acquired and analyzed using an inverted microscope.
-
Paraffin sections were soaked in Congo Red A solution overnight, washed with water for 2 min, and fractioned with Congo Red B solution. The differentiated sections were placed in Congo Red C solution for 1 min, washed with water, and stained with anti-blue. The treated sections were dehydrated with anhydrous ethanol and xylene and finally sealed with neutral gum. The stained images were acquired and analyzed using an inverted microscope. The number of age spots was quantified using ImageJ software.
-
Paraffin sections were fixed in 4% paraformaldehyde for 30 min and washed 3 times with perbenzoic acid (PBA) for 5 min each. After antigen repair, the sections were washed three times with PBA for 5 min. The sections were blocked with BSA in a circle around the tissue for 30 min and incubated overnight at 4 °C with the primary antibody. The corresponding secondary antibody was added to cover the tissue and incubated for 50 min at room temperature in the dark. Sections were double-stained with DAPI for cell nuclei and sealed with a fluorescent quencher. The stained images were acquired and analyzed using a fluorescent microscope. The intensity of the positive product fluorescence images was quantified using ImageJ software.
-
T-SOD, MDA, T-AOC, and GSH-PX are important indicators of the level of oxidative damage in the body. T-SOD plays a crucial role in the balance between oxidation and antioxidant activity in the body, and can scavenge superoxide anion free radicals, thus protecting the body from damage. MDA level often reflects the degree of lipid peroxidation in the body and indirectly reflects the degree of tissue and cell damage. GSH-PX is an important peroxidase enzyme widely present in the body, and its level can reflect the strength of the body’s antioxidant capacity. T-AOC can reflect the strength of the antioxidant capacity of the body’s defense system. These four indicators were measured in the hippocampus and serum of APP/PS1 mice, and the assays were performed strictly according to the manufacturer’s instructions.
-
First, the ipsilateral hippocampal tissue of each group of APP/PS1 mice was weighed using an electronic analytical balance, and protein extract was added at a ratio of 1:10. The protein extract solution was prepared with RIPA lysate, phenyl methane sulfonyl fluoride (PMSF), and phosphatase inhibitor at a ratio of 98:1:1. The tissues were completely ground in an ice and water bath. The supernatant was extracted after centrifugation, and tissue protein content was quantified using the BCA protein assay. Intranuclear Nrf2 protein was extracted using an Intranuclear Protein Extraction Kit (Cell Signaling Technology). The tissue protein solution was mixed with 5 × sodium dodecyl sulfate (SDS) loading buffer at 95 °C and boiled for 5 min to denature the protein. Equal amounts of protein samples (30 μg) were separated by 10% SDS-polyacrylamide gel electrophoresis (PAGE) and transferred to PVDF membranes. Subsequently, the membranes were blocked in 5% skim milk for 2 h at room temperature, after which they were incubated at room temperature for 1.5 h with the following primary antibodies: APP (1:10,000), p-Tau (1:50,000), DJ-1 (1:1,000), Nrf2 (1:2,000), AMPK (1:10,000), mTOR (1:10,000), Bax (1:10,000), Caspase3 (1:2,000), B cell lymphoma-2 (Bcl-2) (1:2,000), and β-actin (1:5,000) (details of primary antibodies are listed in Table 1). The membranes were incubated with an HRP-coupled secondary antibody (1:10,000) for 1.5 h at room temperature. Finally, the proteins were visualized using an enhanced chemiluminescence kit (Biosharp), and the density values of the protein bands were quantified using ImageJ software. Most of the proteins were normalized to β-actin as a control, whereas their phosphorylated and oxidized proteins were normalized to the corresponding total proteins.
-
All experiments were conducted in triplicate, and the experimental data were analyzed using SPSS 25.0 software (SPSS, Chicago, IL, USA). Measures that conform to a normal distribution are expressed as mean ± standard deviation (M ± SD). One-way ANOVA was used for comparisons between groups, and significance was calculated using the LSD test. If the data did not conform to a normal distribution or the variance was not uniform, the Kruskal–Wallis rank-sum test was used. The data from each group of the MWM training period were processed with repeated ANOVA measures and simple effects analysis and are expressed as mean ± standard error (M ± SE). All test levels were bilateral (α = 0.05).
-
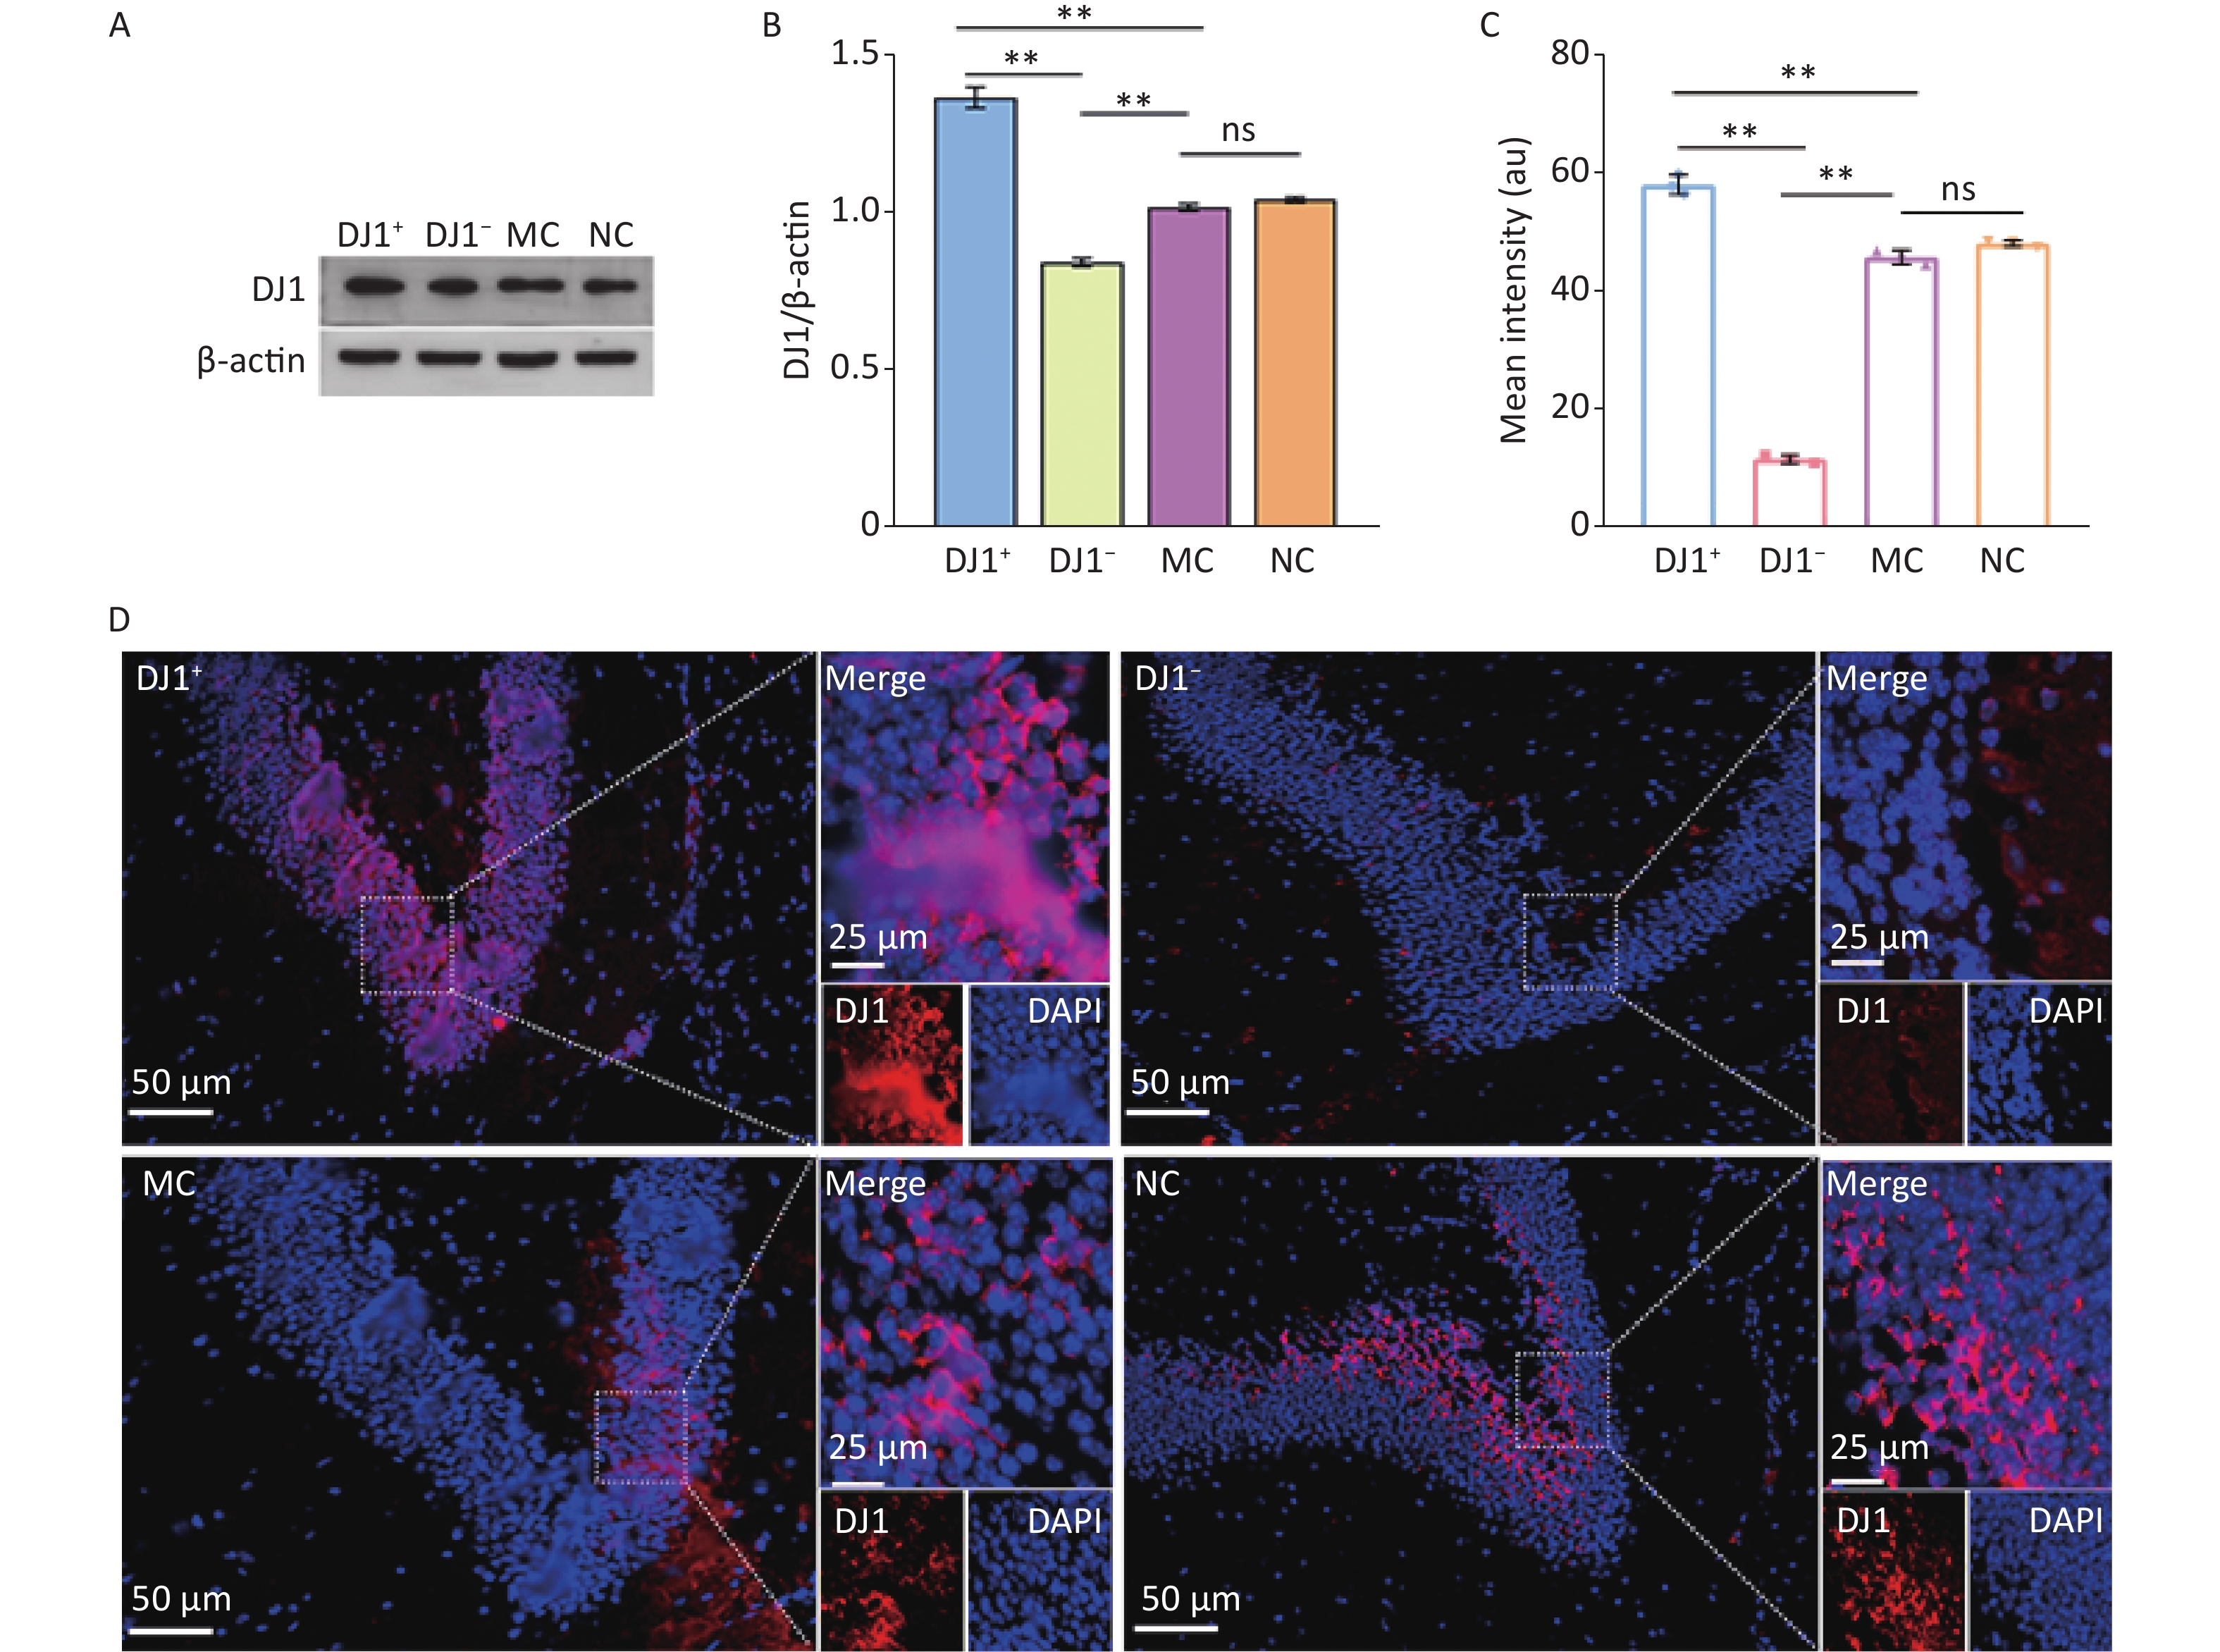
DJ1 expression was modulated by injecting AAV9 bilaterally into the hippocampus. As shown in Figure 1A-C, the expression of DJ1 was significantly higher in the DJ1+ group and lower in the DJ1− group than in the MC group (P < 0.001). For the observation of hippocampal tissues under the same field of view (Figure 1D), it was similarly found that the expression of DJ1 was significantly higher in the DJ1+ group and lower in the DJ1− group than in the MC group. There was no significant difference in DJ1 protein expression between the NC and MC groups. This illustrated that the overexpression or knockdown of DJ1 in APP/PS1 mice was successful, while excluding the effect of the AAV empty vector on DJ1 action in the experiment.
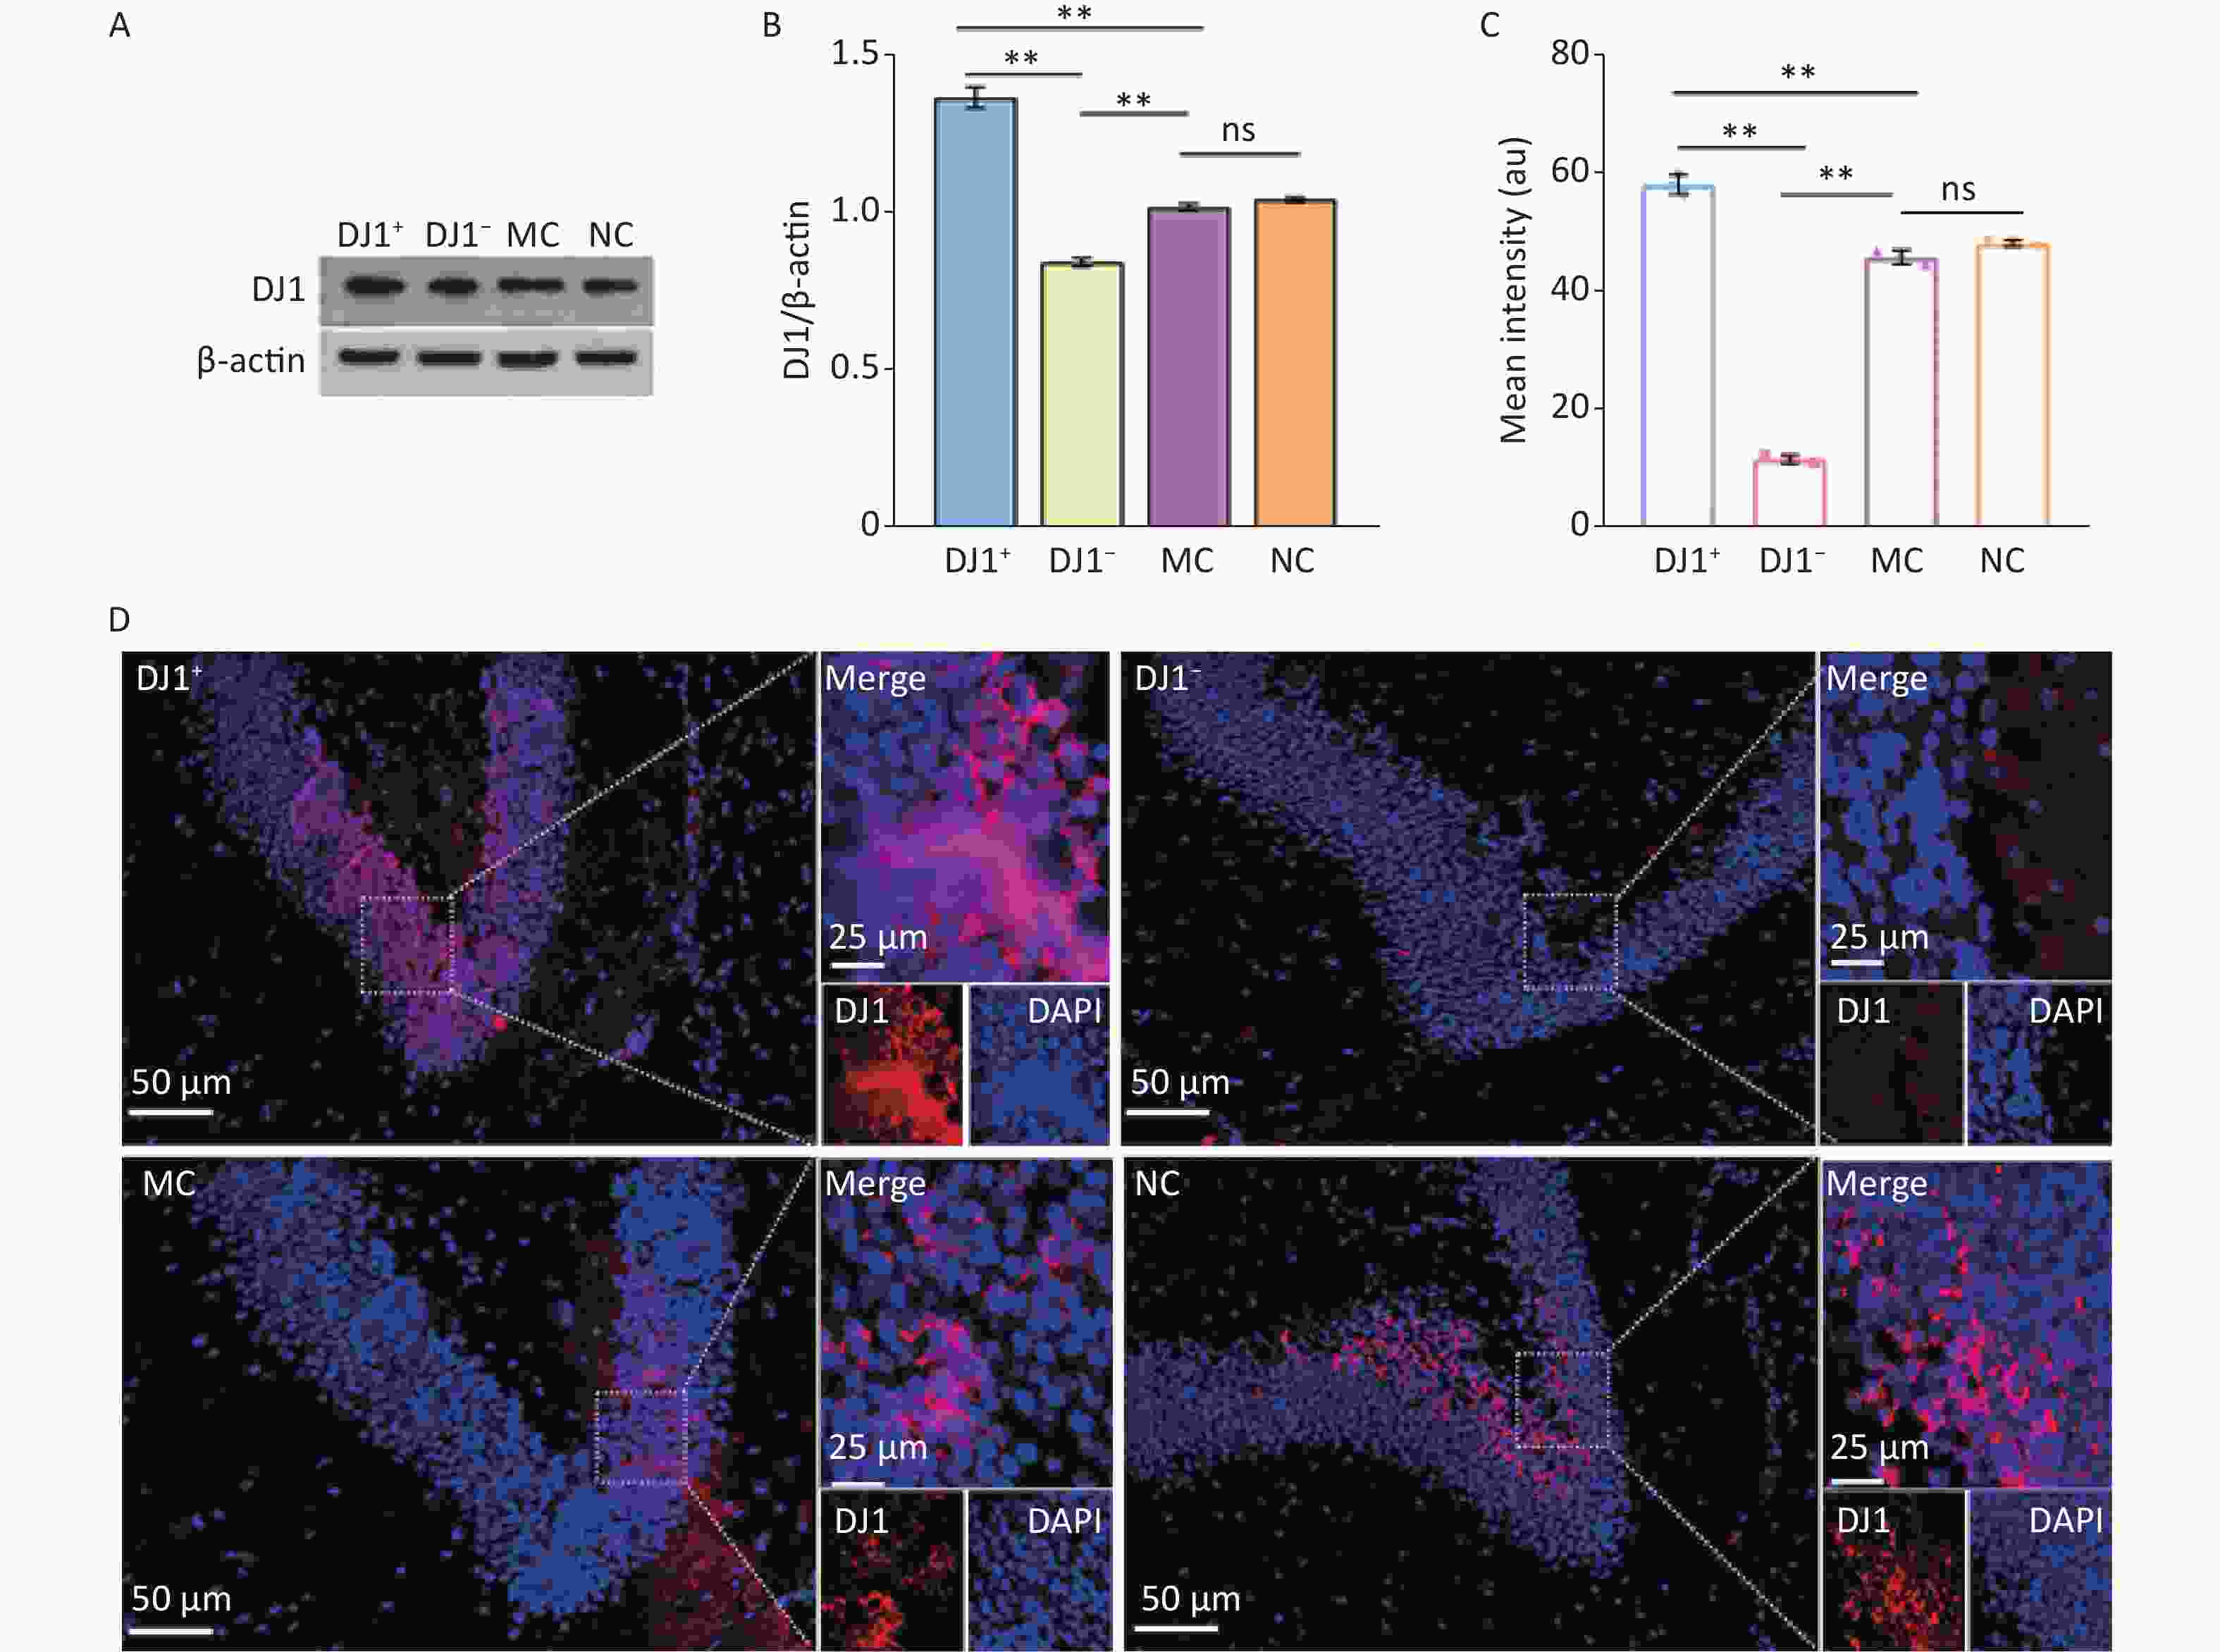
Figure 1. DJ1 expression effects in the up-regulated and down-regulated models in APP/PS1 mice hippocampus. (A) Western blot for DJ1 and β-actin. (B) Densitometry analyses of DJ1 normalized on β-actin. (C) Mean fluorescence intensity of DJ1. (D) Immunofluorescence results of DJ1 protein (red) and DAPI (blue) in the same field of view; MC, AD model control group; NC, AAV vector control group; DJ1+, DJ1 up-regulation group; DJ1−, DJ1 knockdown group. *Р < 0.05, **Р < 0.001. Data are expressed as mean ± SD (n = 3). Scale bar in main image 50 µm and merged inset 25 µm.
-
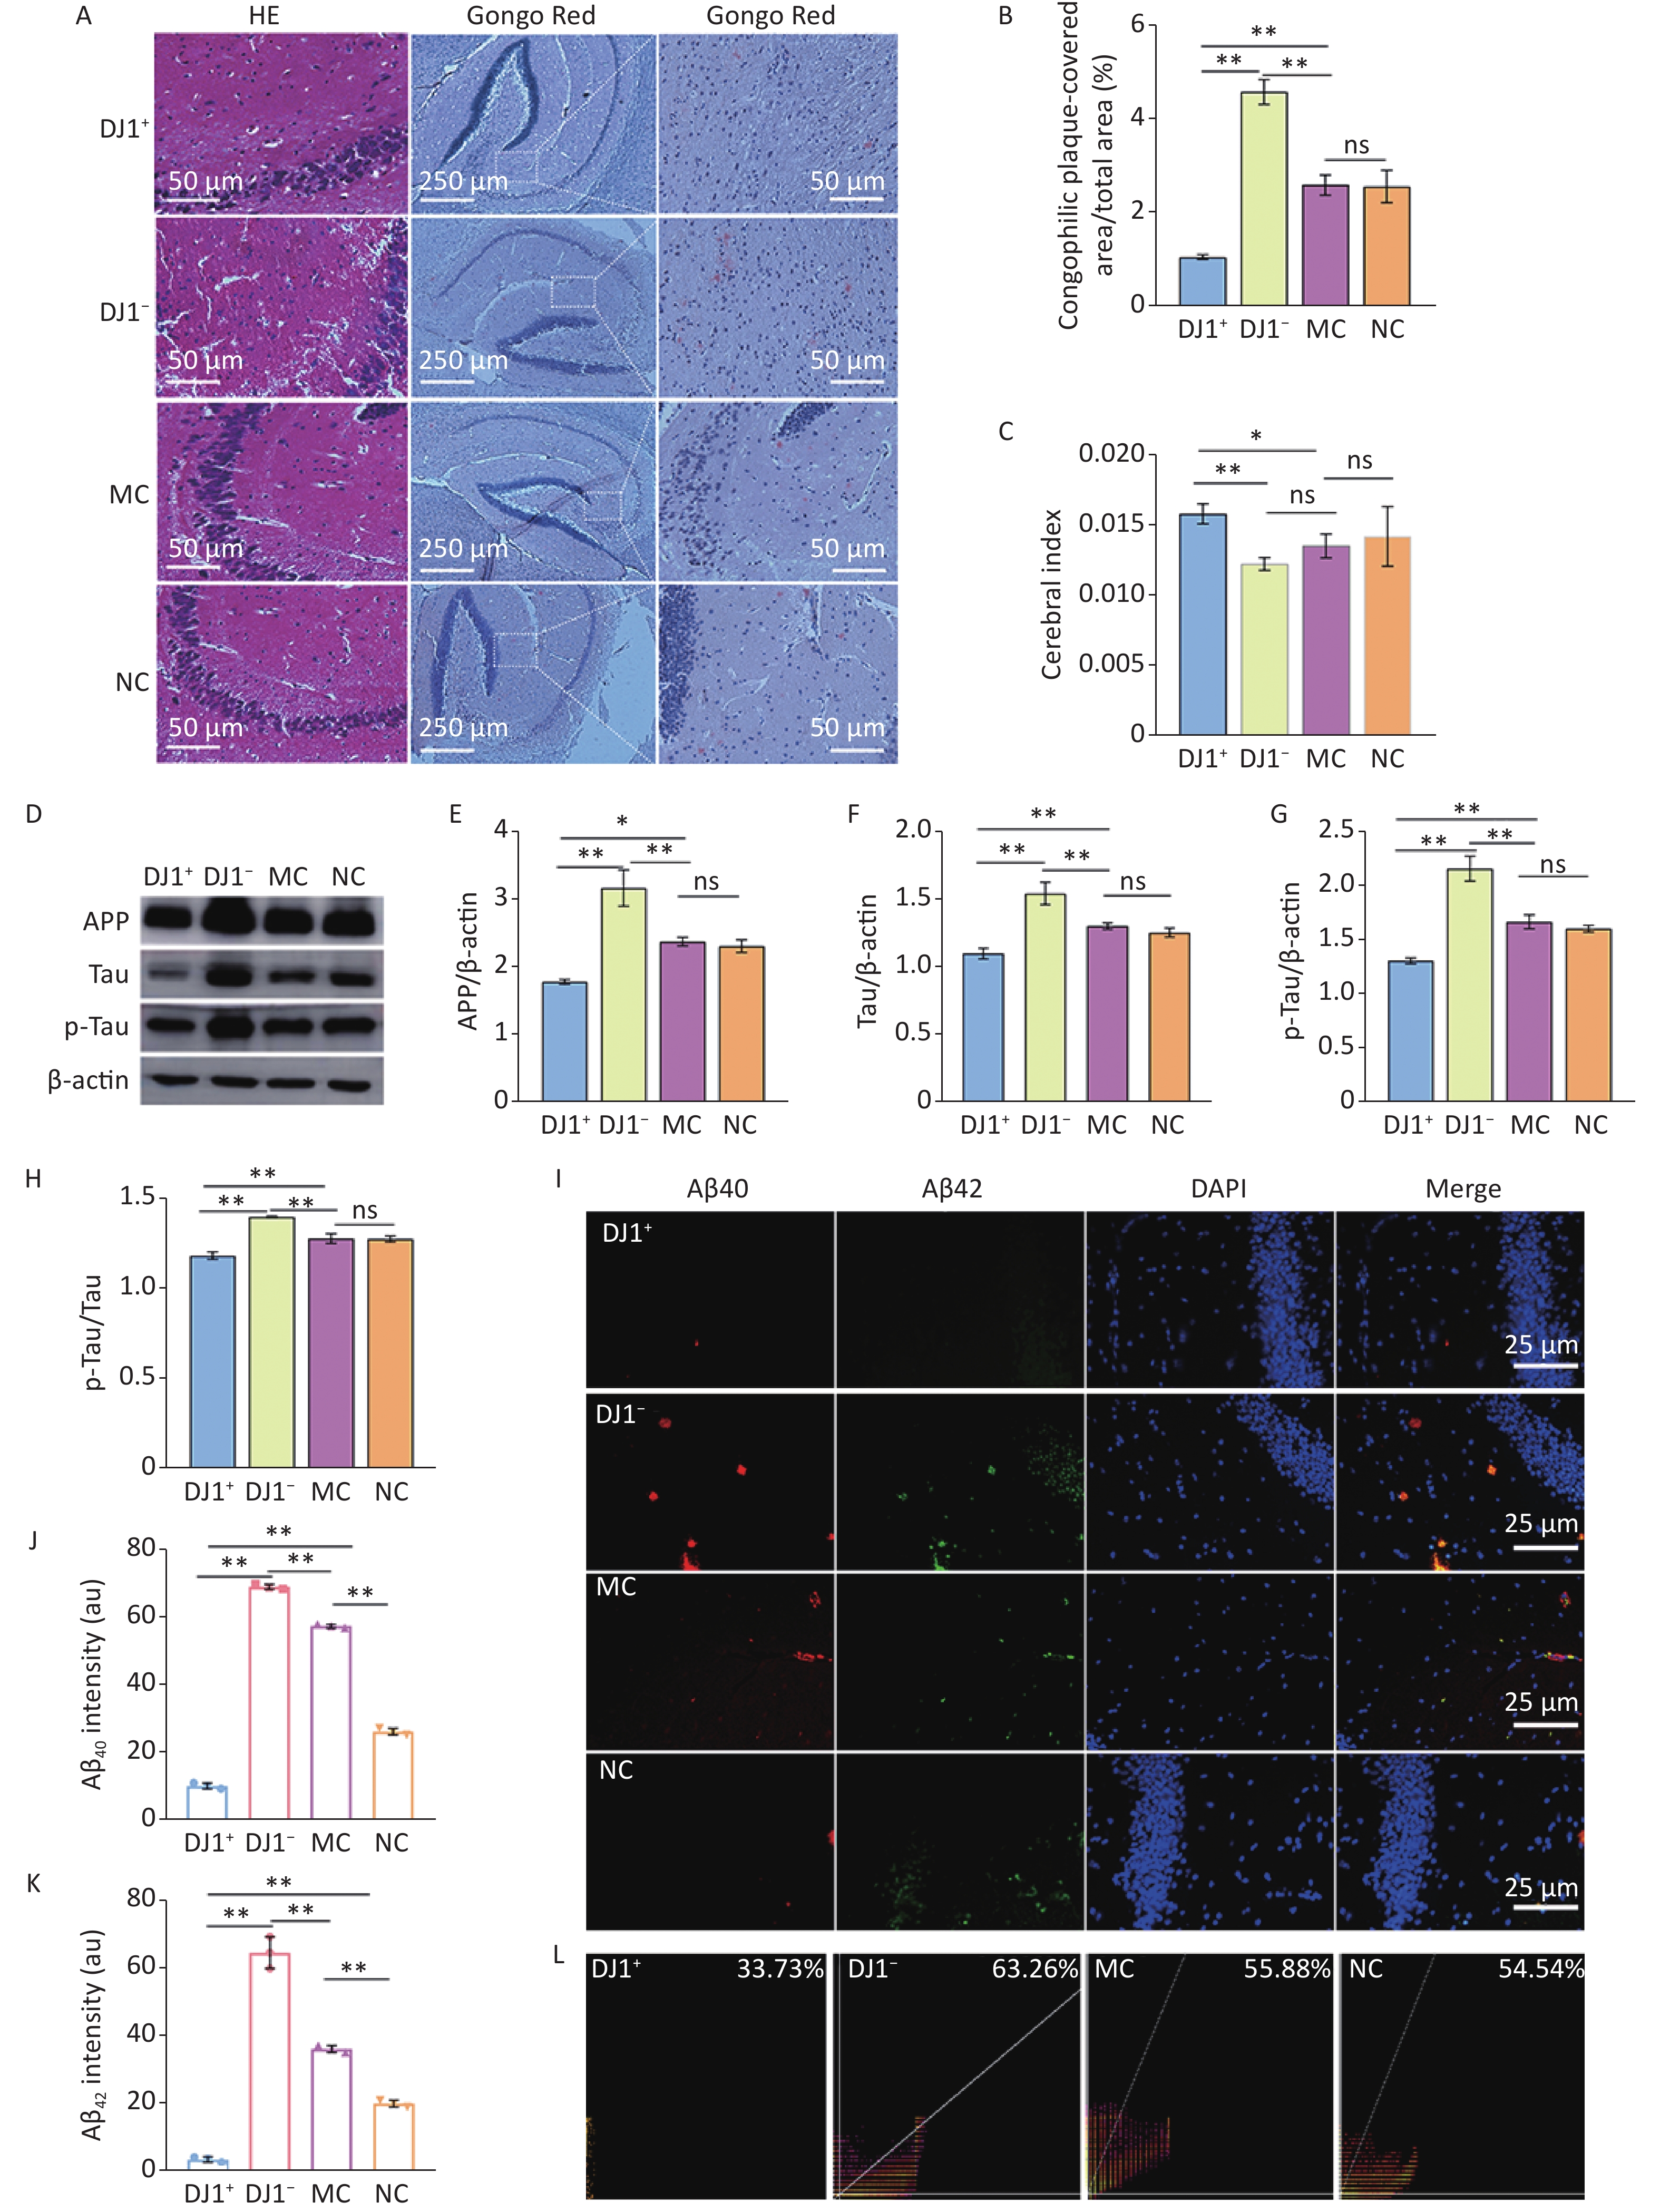
To determine the effect of DJ1 manipulation on AD-like changes in APP/PS1 mice, we analyzed AD characteristics in hippocampal tissue. HE staining showed that compared with the MC group, cells in the hippocampus in the DJ1− group were deeply stained with solidified, atrophied, and relaxed intercellular structures, while the DJ1+ group showed improvement in all of these pathological changes and the NC group showed no significant differences in the structural changes in the intracellular regions (Figure 2A). The results of Congo red staining (Figure 2A and B) showed that, although all groups of mice had positive staining in the hippocampal regions, the number of positive cells in the DJ1+ group was significantly lower than that in the MC group, while the number in the DJ1− group tended to increase (P < 0.05). As expected, there was no significant difference in plaque number between the MC and NC groups. Figure 2C shows that there were differences in the brain indices between the groups. Compared with the MC group, the brain volume of the mice in the DJ1+ group (P < 0.05) was significantly increased, while DJ1 knockdown dramatically reduced the brain volume of the mice (P < 0.05). There was no significant difference in the NC group. The brain indices of mice in the DJ1+ group were significantly higher than those in the DJ1− group (P < 0.001).
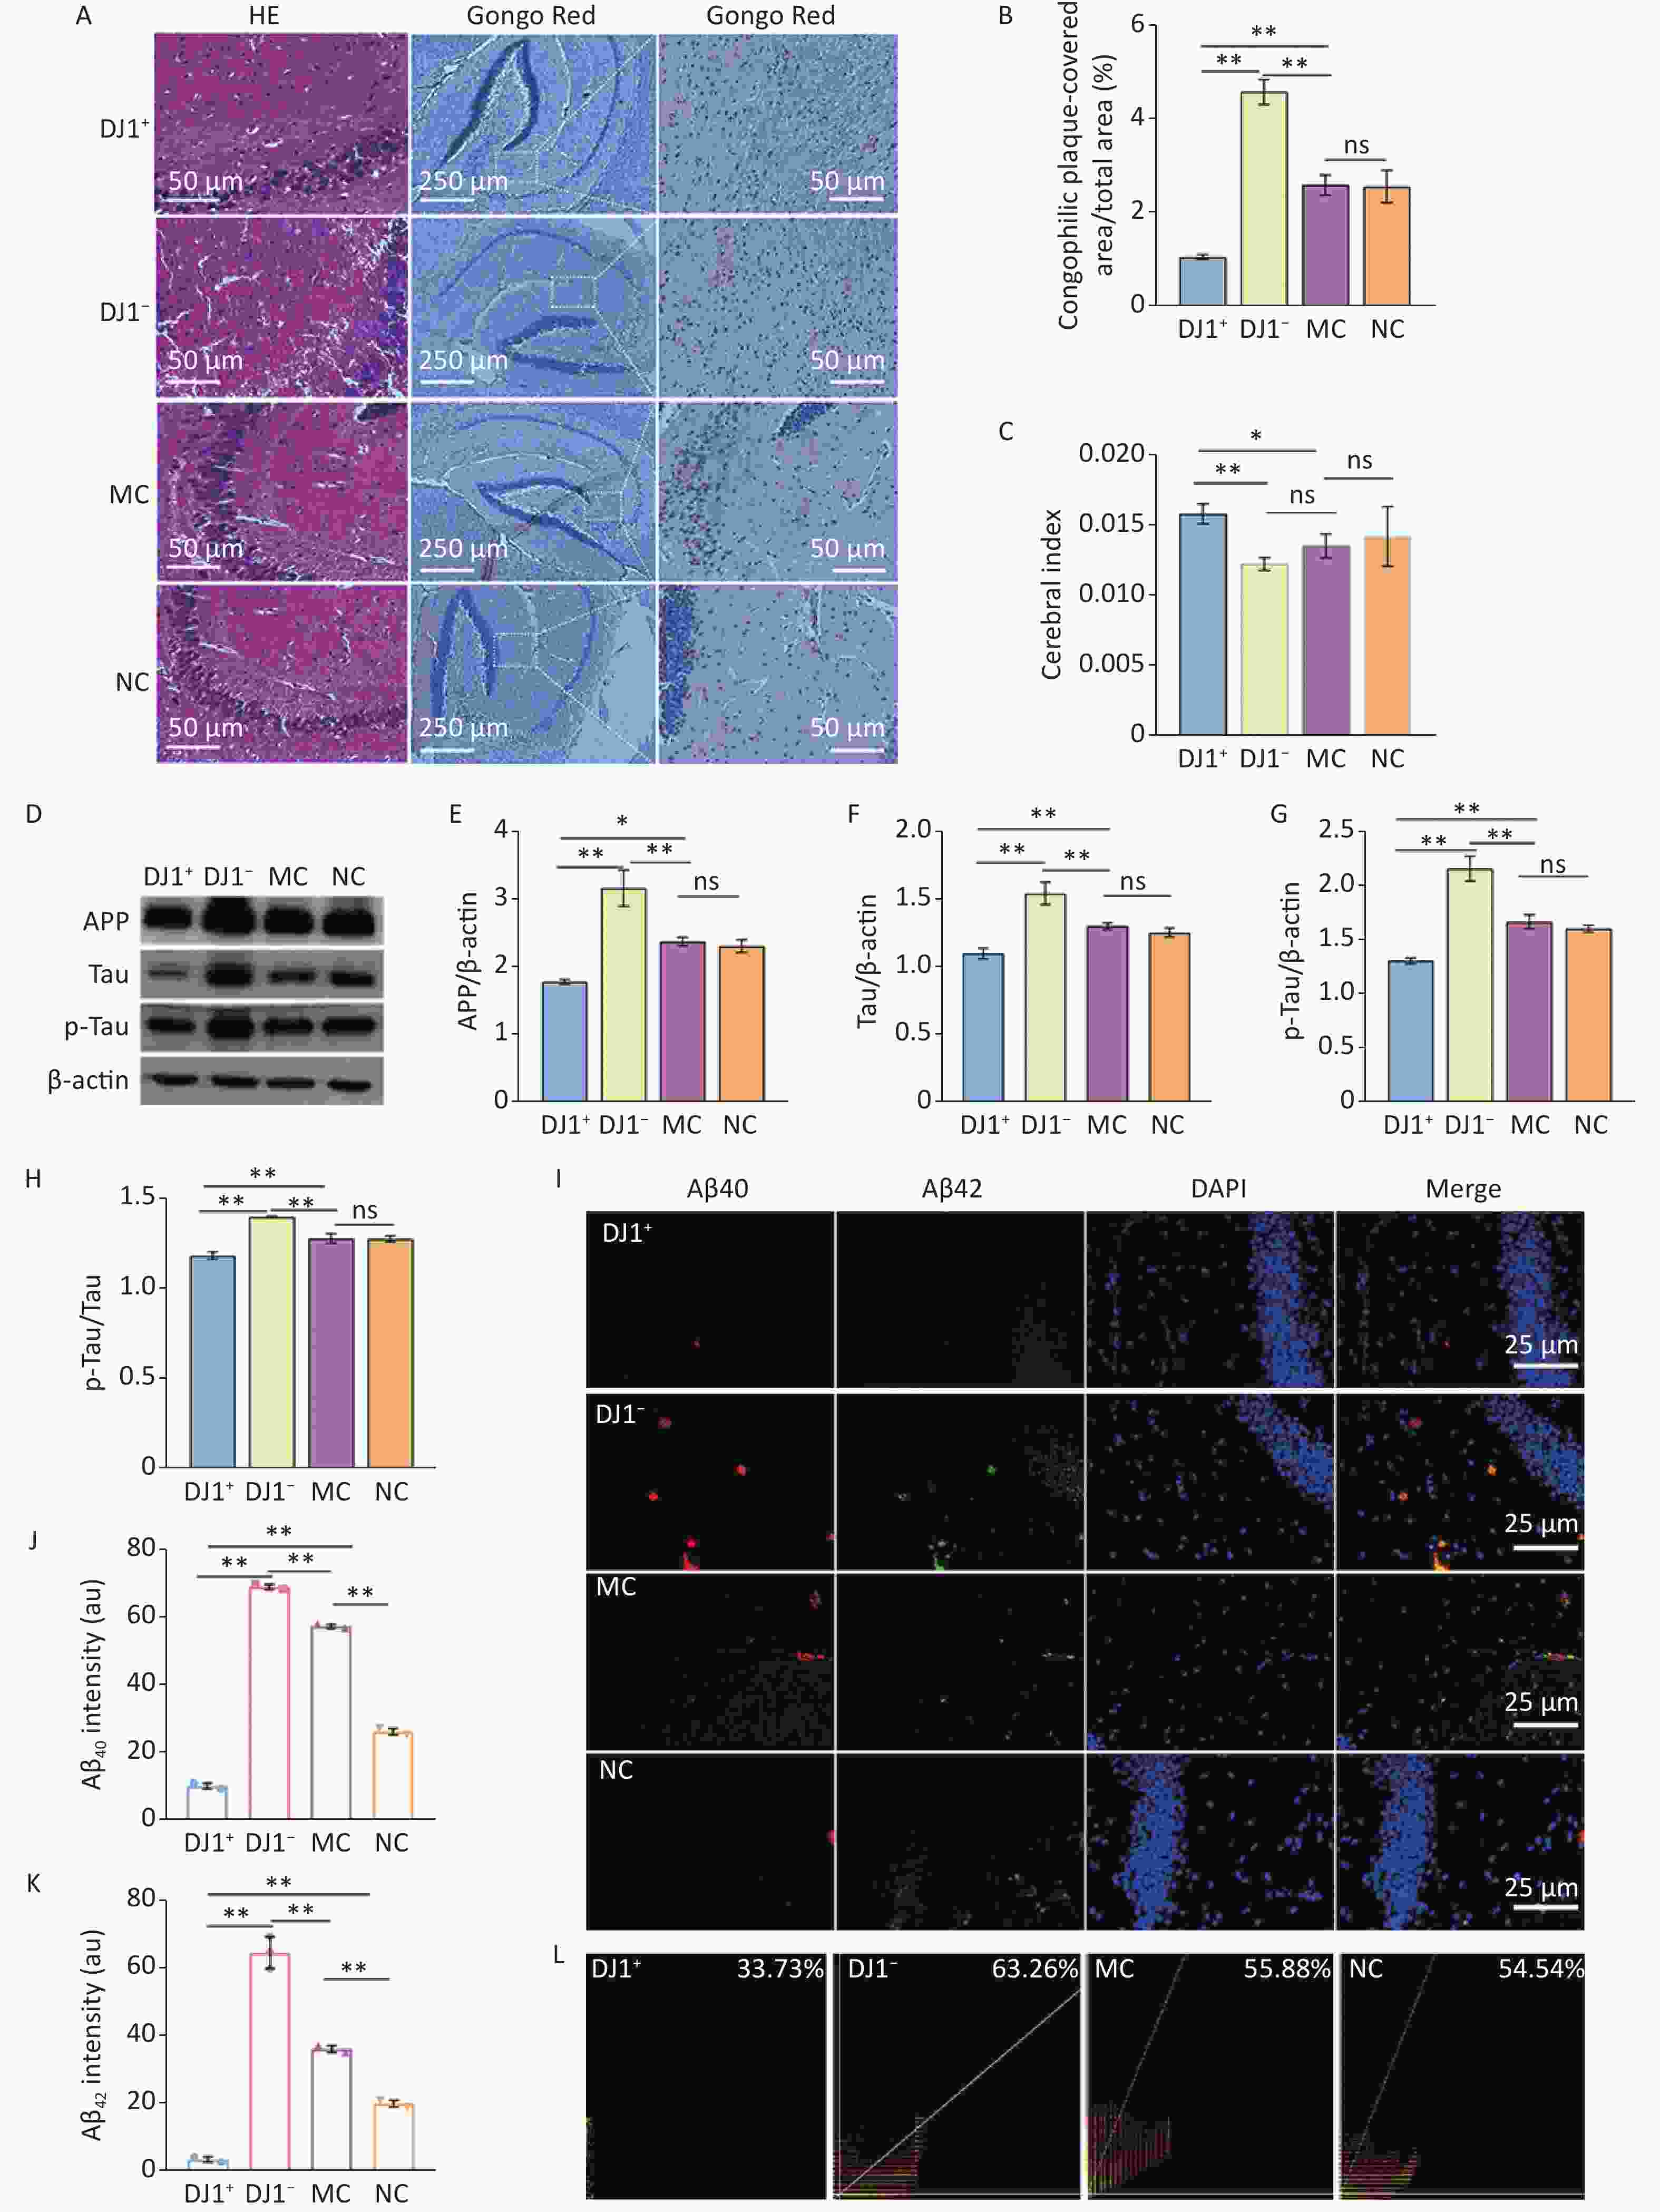
Figure 2. AD characteristic index in APP/PS1 mice hippocampus. (A) HE and Congo red staining. Scale bar for HE and Congo red inset 50 µm and main Congo red image 250 µm. (B) Number of senile plaques. (C) Cerebral index. (D) Western blot for APP, Tau, p-Tau, and β-actin. Densitometry analyses of (E) APP, (G) Tau, and (F) p-Tau normalized on β-actin, and (H) p-Tau/Tau ratio. (I) Immunofluorescence results of Aβ40 (red), Aβ42 (green), and DAPI (blue) and colocalization in hippocampal CA1 region. Scale bar 25 µm. Mean fluorescence intensity of (J) Aβ40 and (K) Aβ42. (L) Colocalization coefficient of Aβ40 and Aβ42. *Р < 0.05, **Р < 0.001. Data are expressed as mean ± SD (n = 3).
Massive extracellular deposition of Aβ protein and the formation of p-Tau are also characteristic markers of AD progression. Therefore, we quantified the expression levels of APP, Tau, p-Tau, Aβ40, and Aβ42 in the hippocampal tissues of APP/PS1 mice. Western blot results (Figure 2D-H) showed that APP, Tau, and p-Tau protein expression and p-Tau/Tau ratio in the hippocampus significantly decreased in the DJ1+ group compared with the MC group , while the DJ1− group significantly increased (P < 0.05). Again, no significant differences were observed in the NC group. Compared to the DJ1− group, these indicators decreased in the DJ1+ group (P < 0.001). Immunofluorescence results also showed that the expression levels of Aβ40 and Aβ42 in the hippocampus were significantly decreased in the DJ1+ group compared with the MC group (P < 0.001), while they were significantly increased in the DJ1− group (Figure 2I-K). Expression levels of Aβ40 and Aβ42 were especially increased in the DJ1− group compared with the DJ1+ group. Pearson coefficient analysis of the fluorescence co-localization of Aβ40 and Aβ42 in the DJ1+ group was 33.73%, while in the DJ1− group it was 63.26% (Figure 2L); the DJ1− group correlation coefficient was twice that of the DJ1+ group.
-
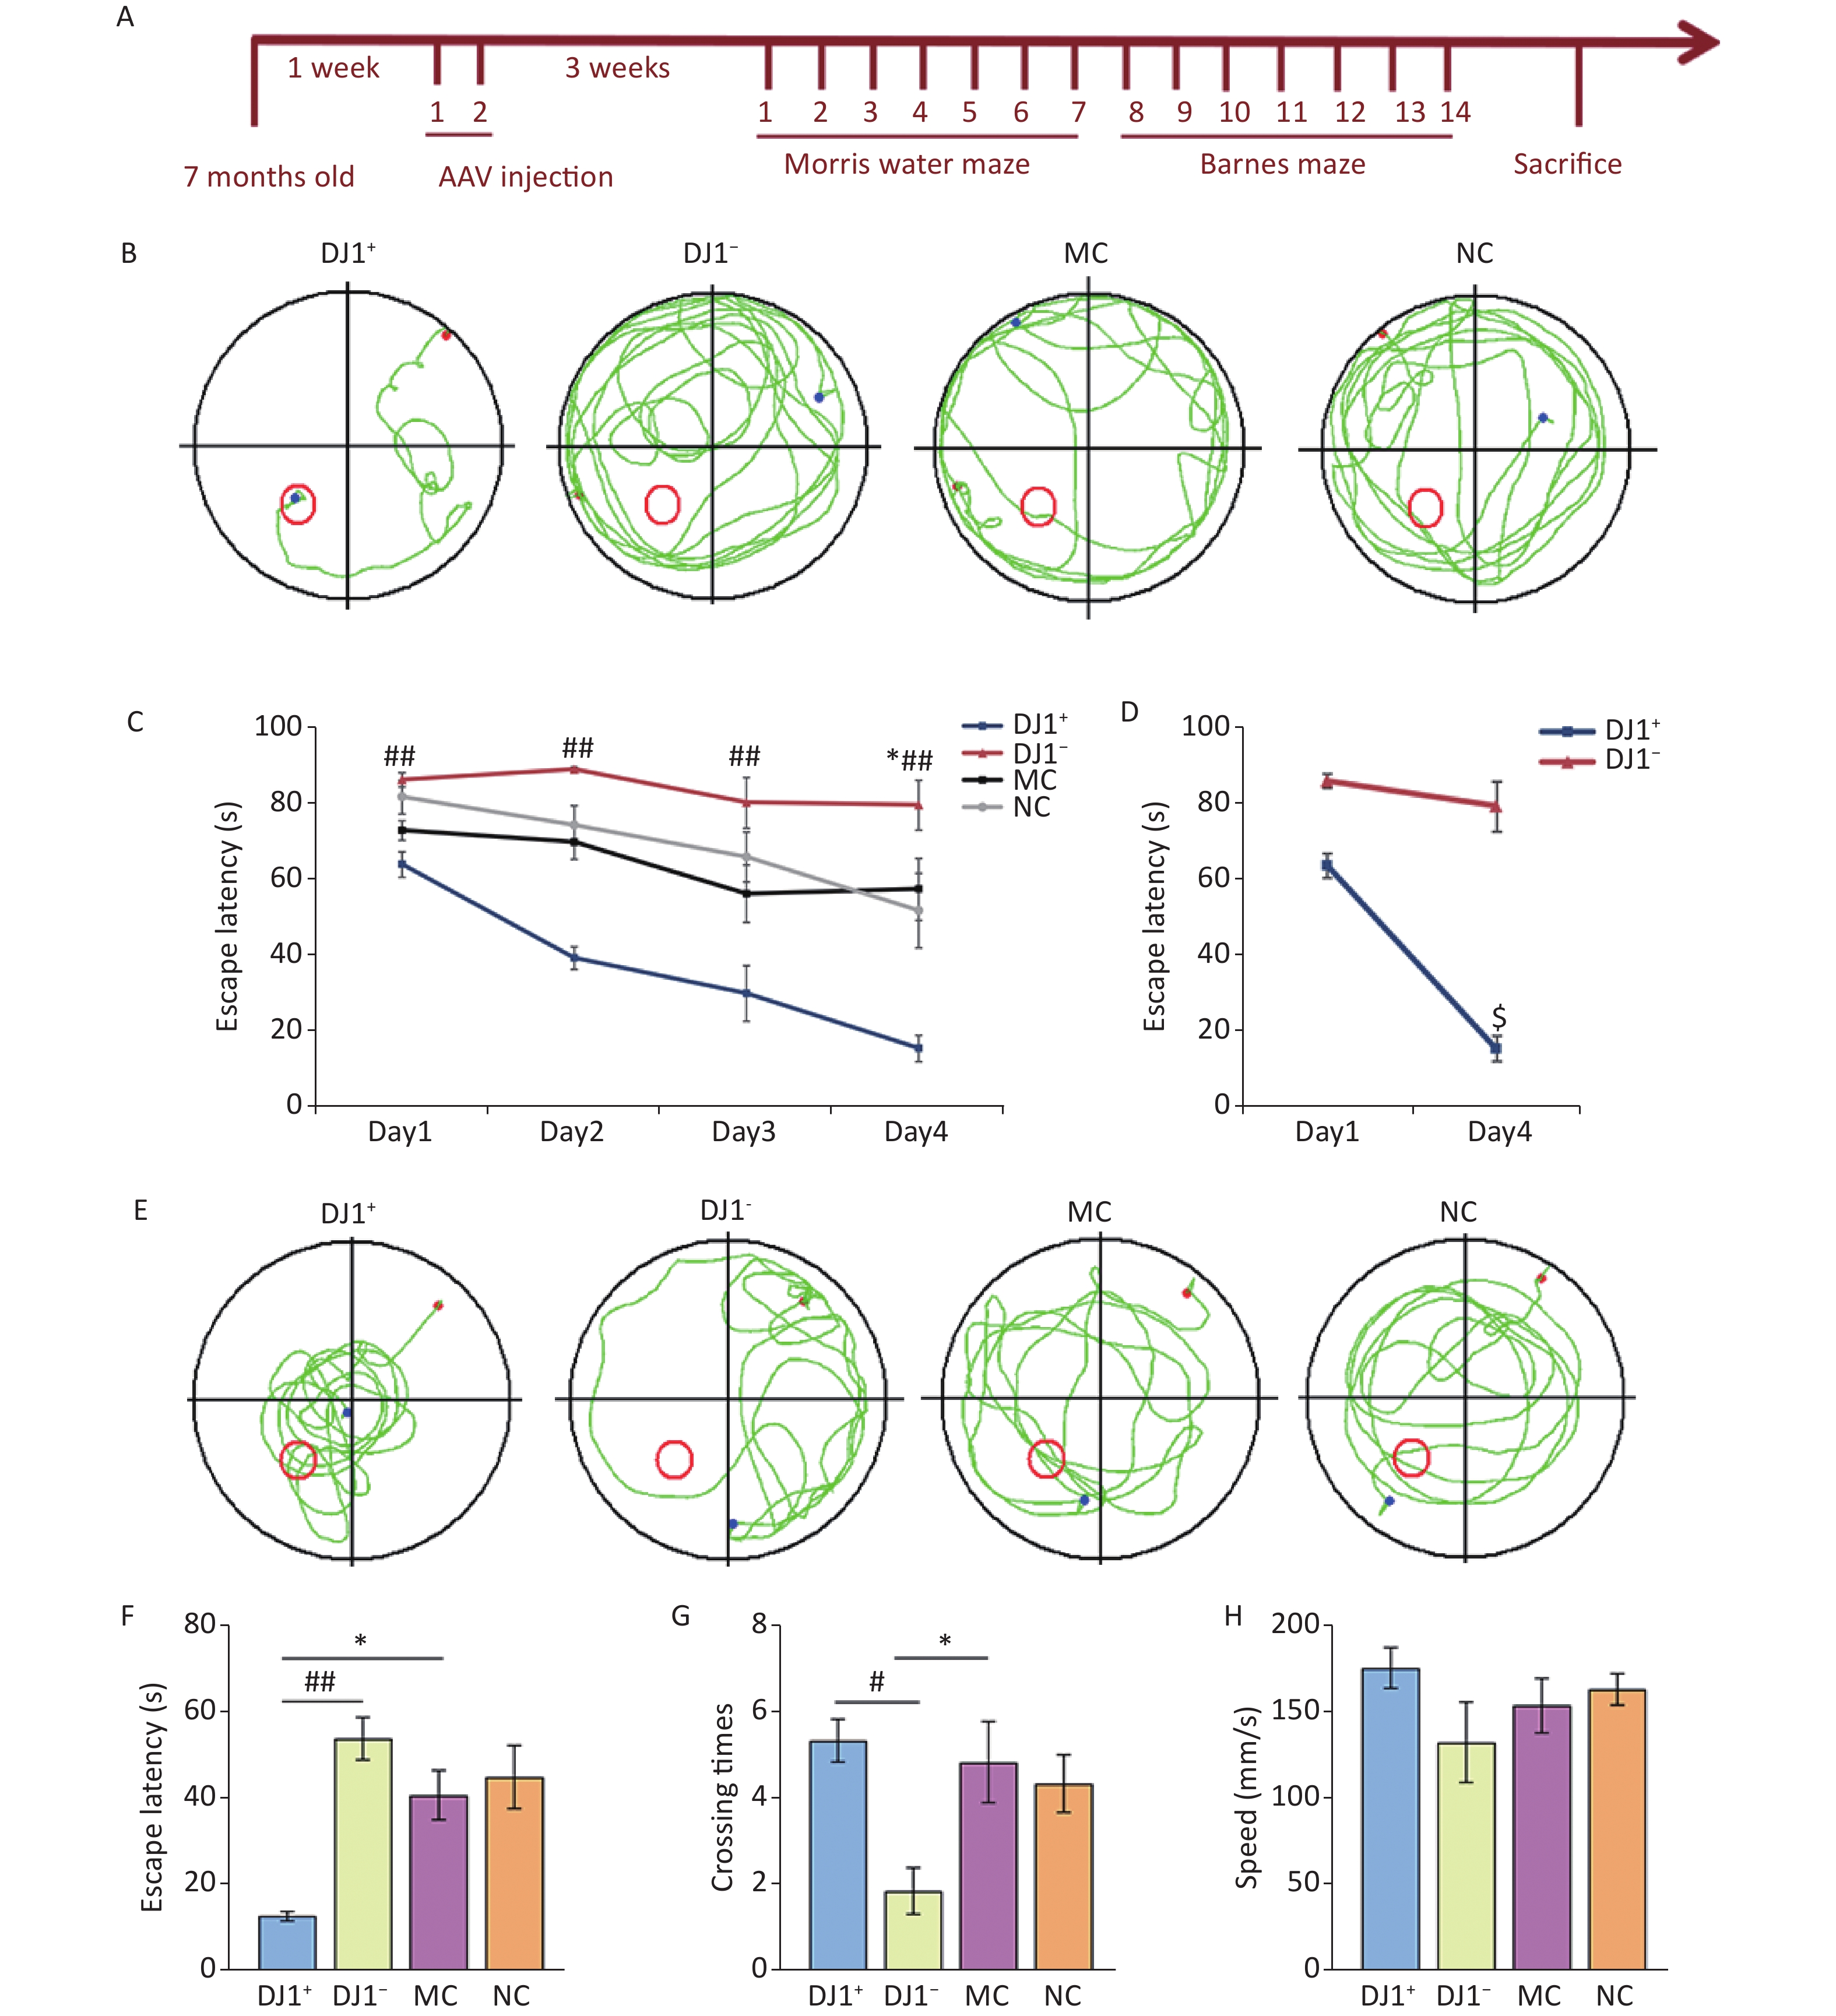
In this study, we found that escape latency was significantly different between groups during the training period with the hidden platform (Figure 3B), and the interaction between group and training days was statistically different. Compared with the MC group, the escape latency of the DJ1+ group was smaller, whereas the DJ1− group was larger (P < 0.05). Simple effect analysis of groups and training days revealed that the latency period on the first day compared to that on the fourth day was statistically different in the DJ1+ group (P < 0.05), while there was no statistical difference in the DJ1− group (Figure 3C). Observation of the locomotor trajectories of the mice in each group revealed that the trajectories of the DJ1−, MC, and NC groups tended to be edge-like, whereas the DJ1+ group tended to be linear toward the target platform (Figure 3A). Through the spatial exploration test experiment, we found that the escape latency and number of target quadrant entries were statistically different in each group (Figure 3E and F). Compared with the MC group, the number of target quadrant crossings increased and the latency period decreased in the DJ1+ group, whereas the number of target quadrant crossings decreased and the latency period increased in the DJ1− group (P < 0.05). Compared with the DJ1− group, the DJ1+ group had a significantly higher number of target quadrant crossings and a significantly shorter latency period (P < 0.05). There was no significant difference in swimming speed between the groups (Figure 3G). The study of mouse movement trajectories revealed that the mice in the MC and NC groups swam throughout the four quadrants, the DJ1+ group was mostly distributed around the target platform, and the DJ1− group was mostly distributed in the non-target platform quadrant (Figure 3D).
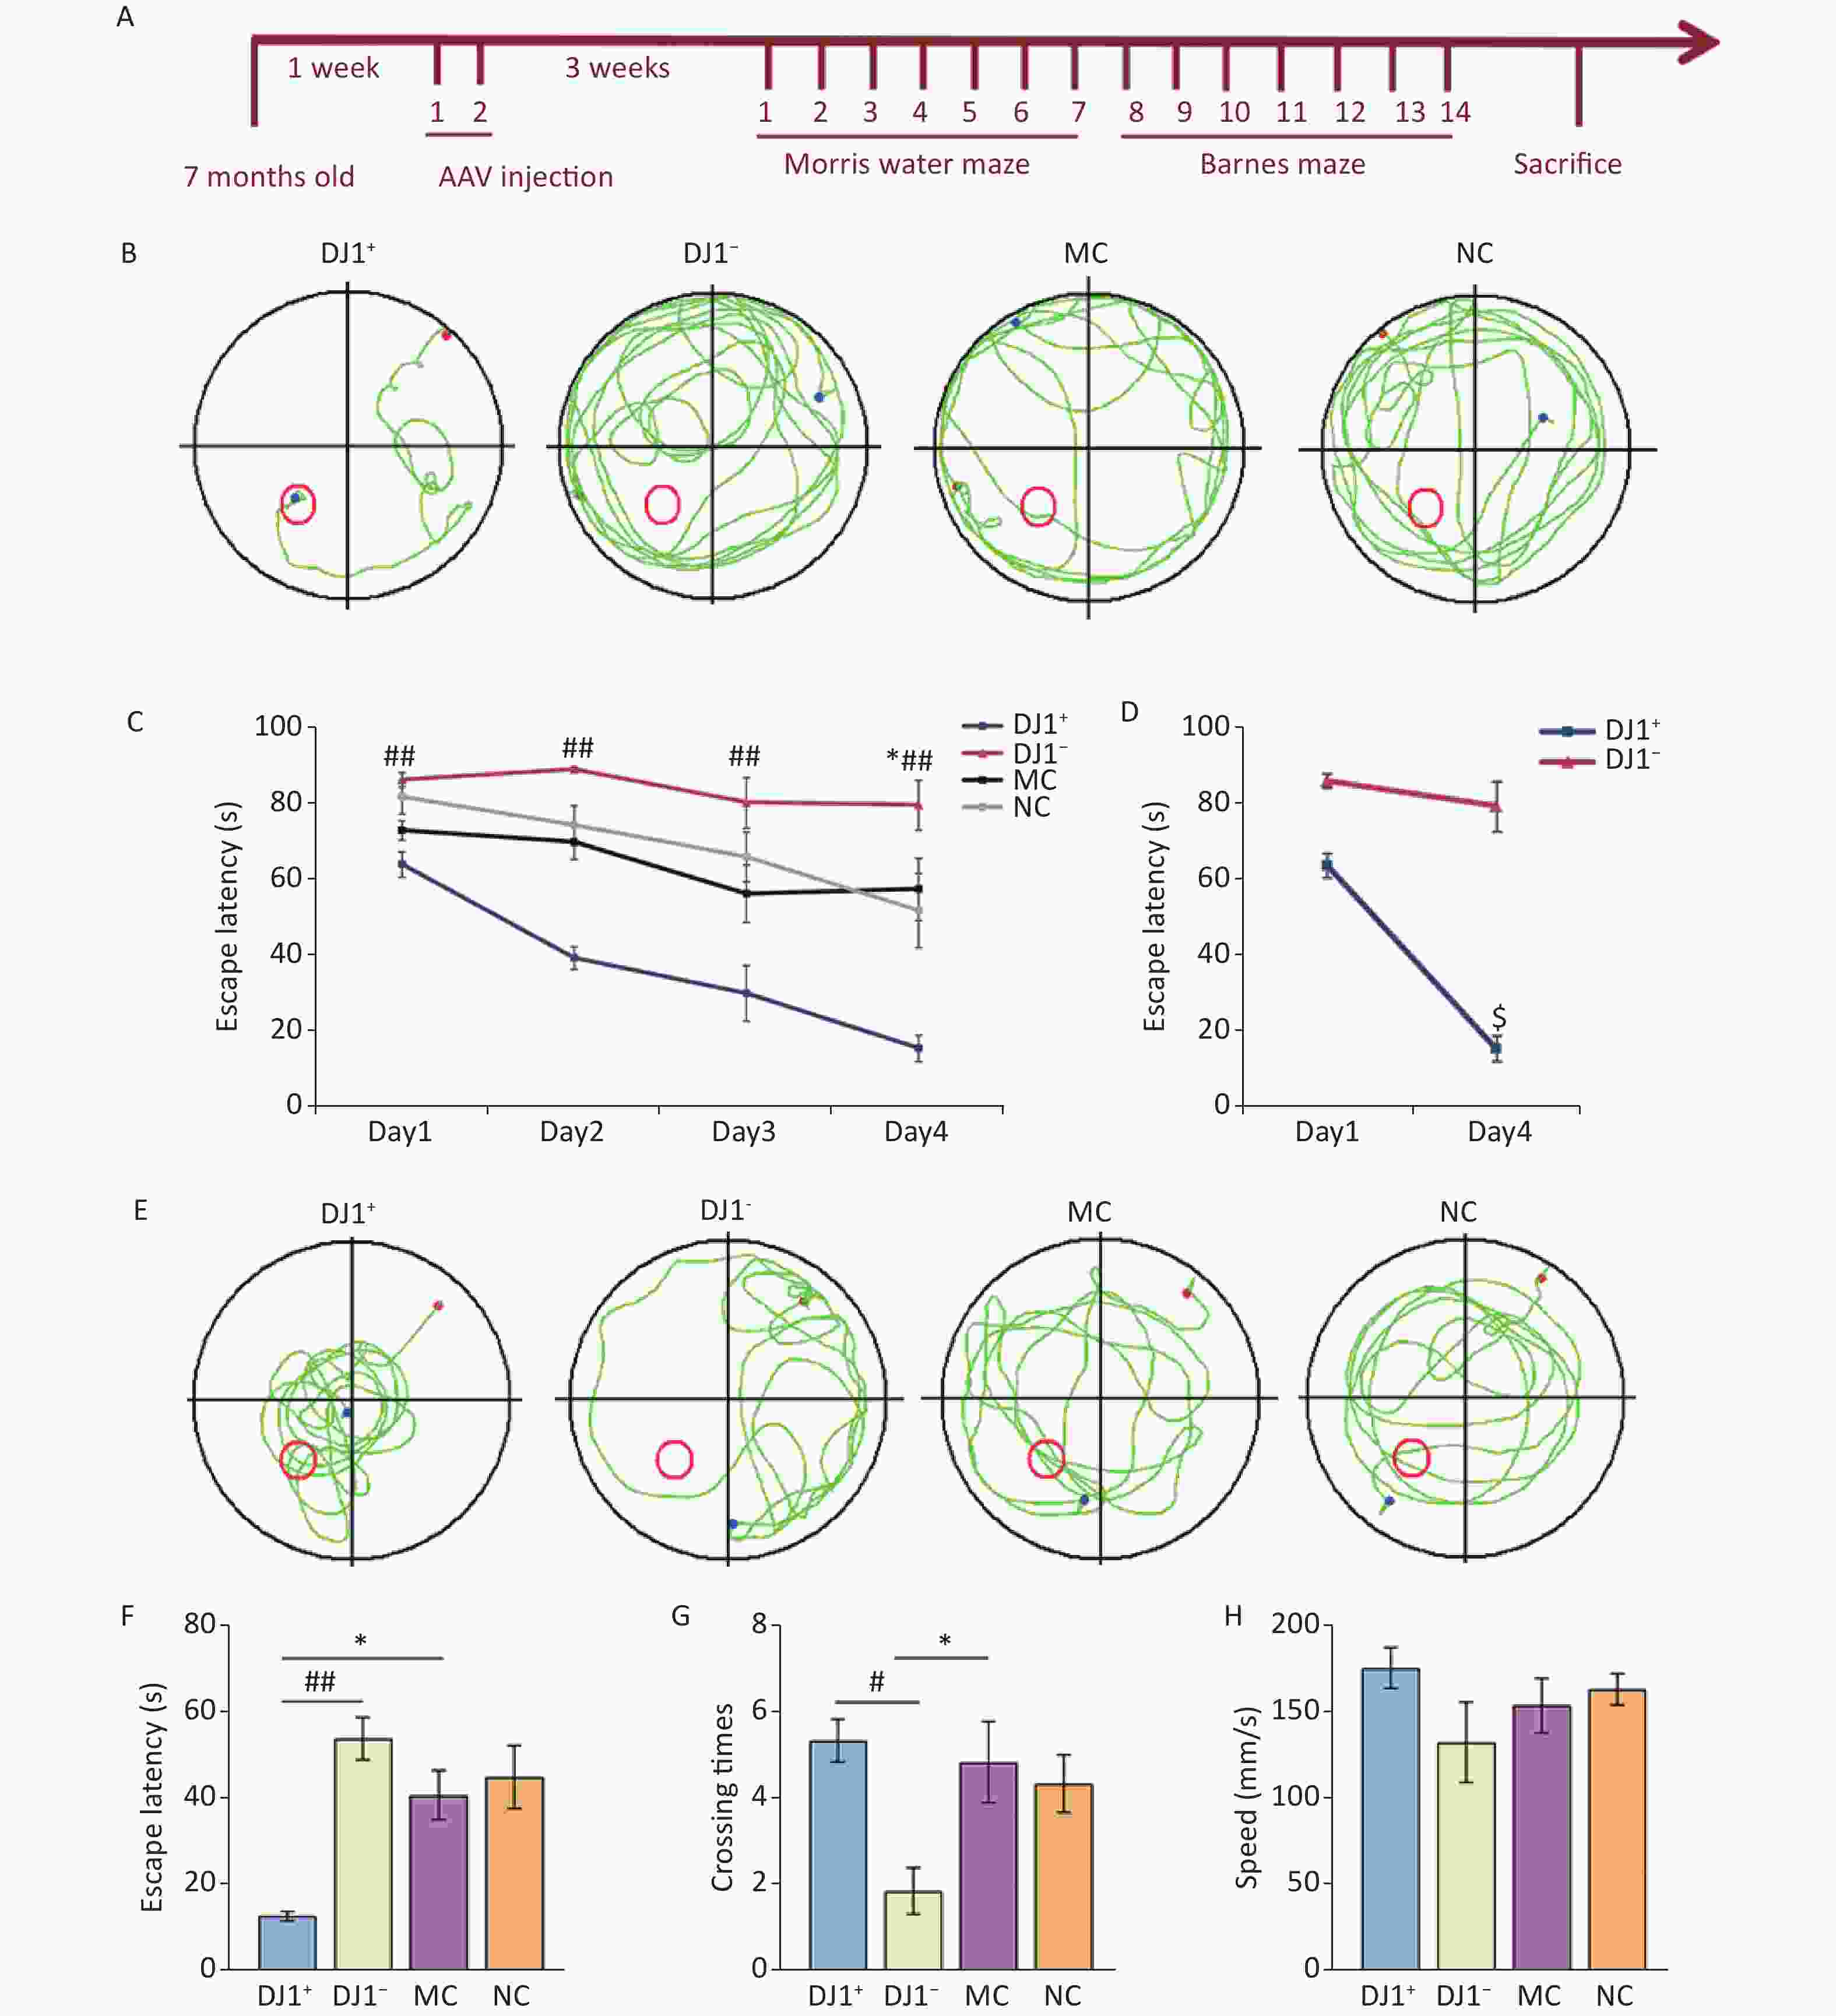
Figure 3. Morris water maze evaluation of the effects of DJ1 expression up-regulation or knockdown on cognitive performance in APP/PS1 mice. (A) Representative movement trajectories of one mouse from each group during the training period. The red dot is the starting position of the mouse, blue dot is the ending position, and red circle is the target platform position. (B) Escape latency of mice in each group during the training period. (C) Escape latency comparison between the DJ1+ and DJ1− groups on day 1 and day 4 during the training period. (D) Representative movement trajectories of one mouse from each group during the test period. (E) Escape latency of mice in each group during the test period. (F) Target quadrant entry times of mice in each group during the test period. (G) Swimming speed of mice in each group during the test period; MC, AD model control group; NC, AAV vector control group; DJ1+, DJ1 up-regulation group; DJ1−, DJ1 knockdown group. *Р < 0.05 and **Р < 0.001 for groups compared with the MC group; #Р < 0.05 and ##Р < 0.001 for DJ1+ group compared with the DJ1− group; $Р < 0.05 for DJ1+ group Day 1 compared with Day 4. Data are expressed as mean ± SEM (n = 6).
-
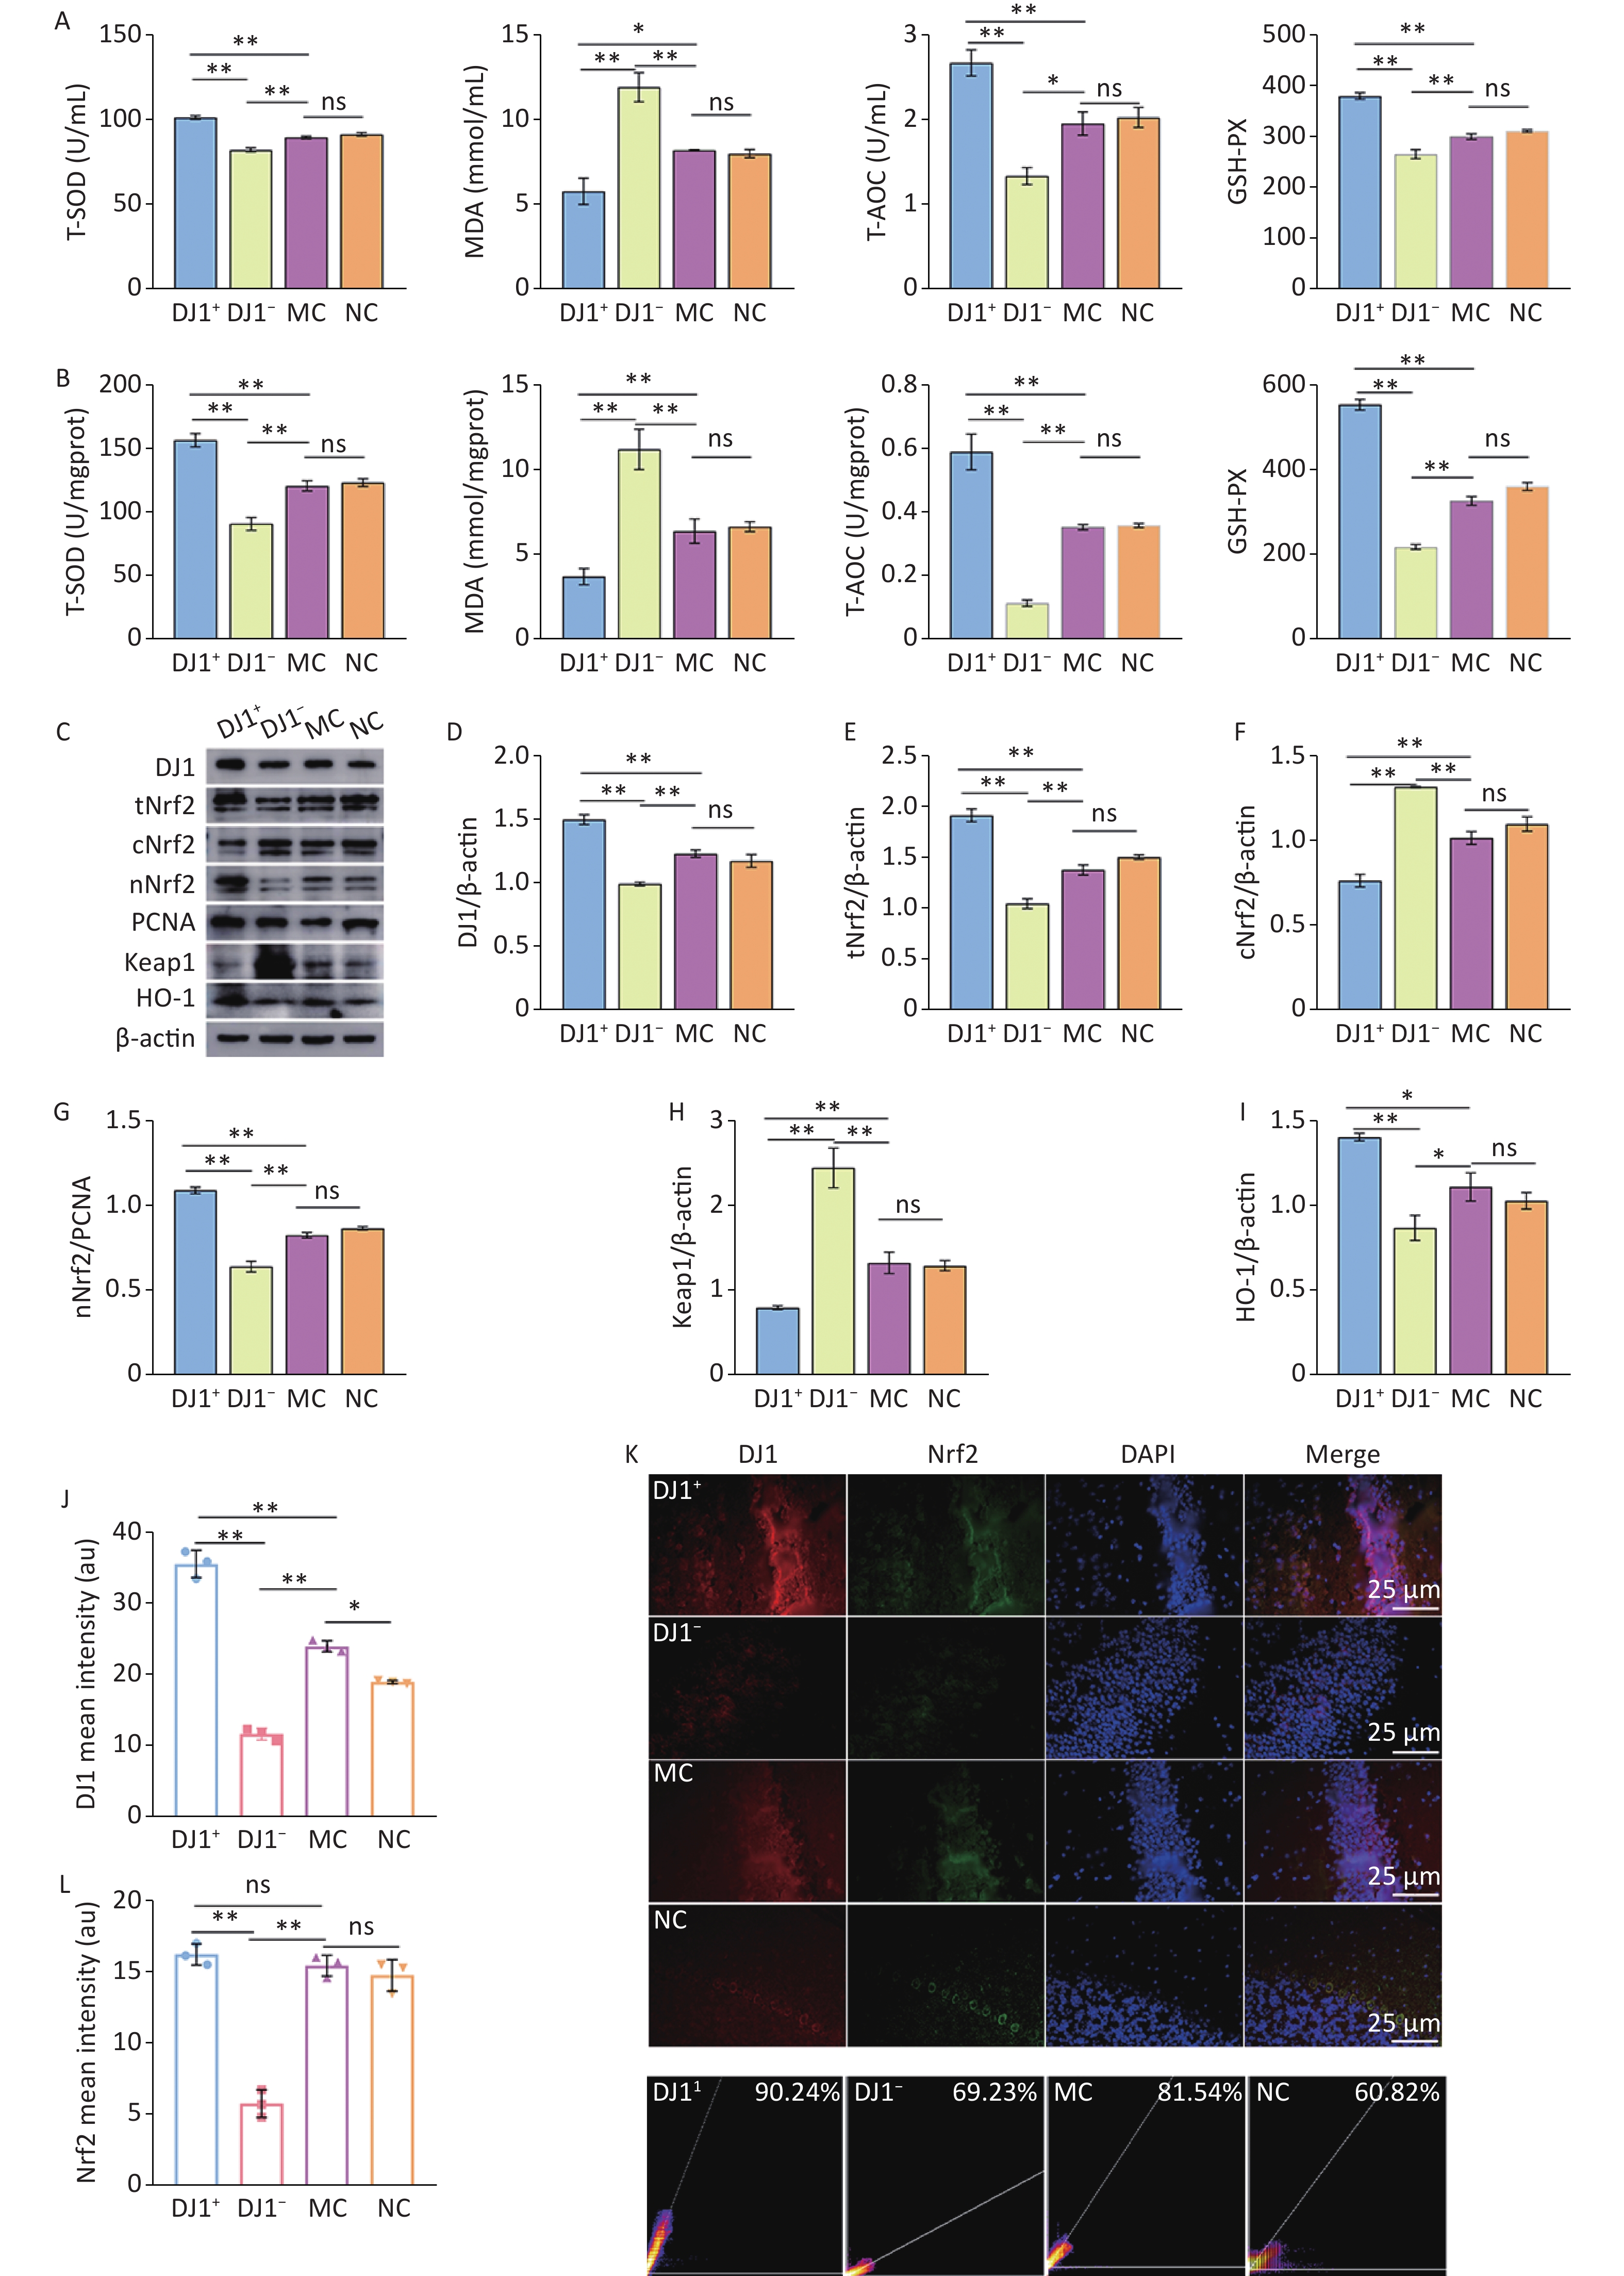
To explore the effects of DJ1 up- and down-regulation on oxidative damage in APP/PS1 mice, the changes in the oxidative stress indicators in the serum and hippocampus and the changes in the related proteins of the Nrf2/HO-1 signaling pathway were analyzed. The oxidative stress indicators were consistent in the serum and hippocampus in all groups (Figure 4A and B). Compared with the MC group, T-SOD, T-AOC, and GSH-PX significantly increased in the DJ1+ group, while they significant decreased in the DJ1− group (P < 0.05). No significant change was observed in the NC group. The levels of the three indices in the DJ1− group were significantly lower than those in the DJ1+ group (P < 0.001). However, compared to the MC group, MDA significantly increased in the DJ1− group and decreased in the DJ1+ group (P < 0.05), with no significant change in the NC group. The MDA level in the DJ1− group was significantly higher than that in the DJ1+ group (P < 0.001). Western blot analysis showed that, compared with the MC group, the expression levels of DJ1, total Nrf2 (tNrf2), nuclear-Nrf2 (nNrf2), and HO-1 in the hippocampal tissue significantly increased in the DJ1+ group and decreased in the DJ1− group (P < 0.05). However, cytoplasmic-Nrf2 (cNrf2) and Keap1 protein expression showed opposite results in the two groups (P < 0.05, Figure 4C-I). Immunofluorescence showed that the fluorescence intensity of DJ1 was significantly higher in the DJ1+ group than in the MC group, while it was significantly lower than both groups in the DJ1− group (P < 0.001). Nrf2 had a trend of higher fluorescence intensity in the DJ1+ group than in the MC group, however it was not statistically significant. Fluorescence intensity of Nrf2 in both the MC and DJ1+ groups was significantly higher than the DJ1− group (Figure 4J-L, P < 0.05). At the same time, it was found that an increase in DJ1 protein expression correlated with a significant increase in Nrf2 protein expression, and the Pearson coefficient of colocalization of the two proteins had a high correlation (DJ1+ group: 90.24%; DJ1− group: 69.23%; MC group: 81.54%; and NC group: 60.82%).
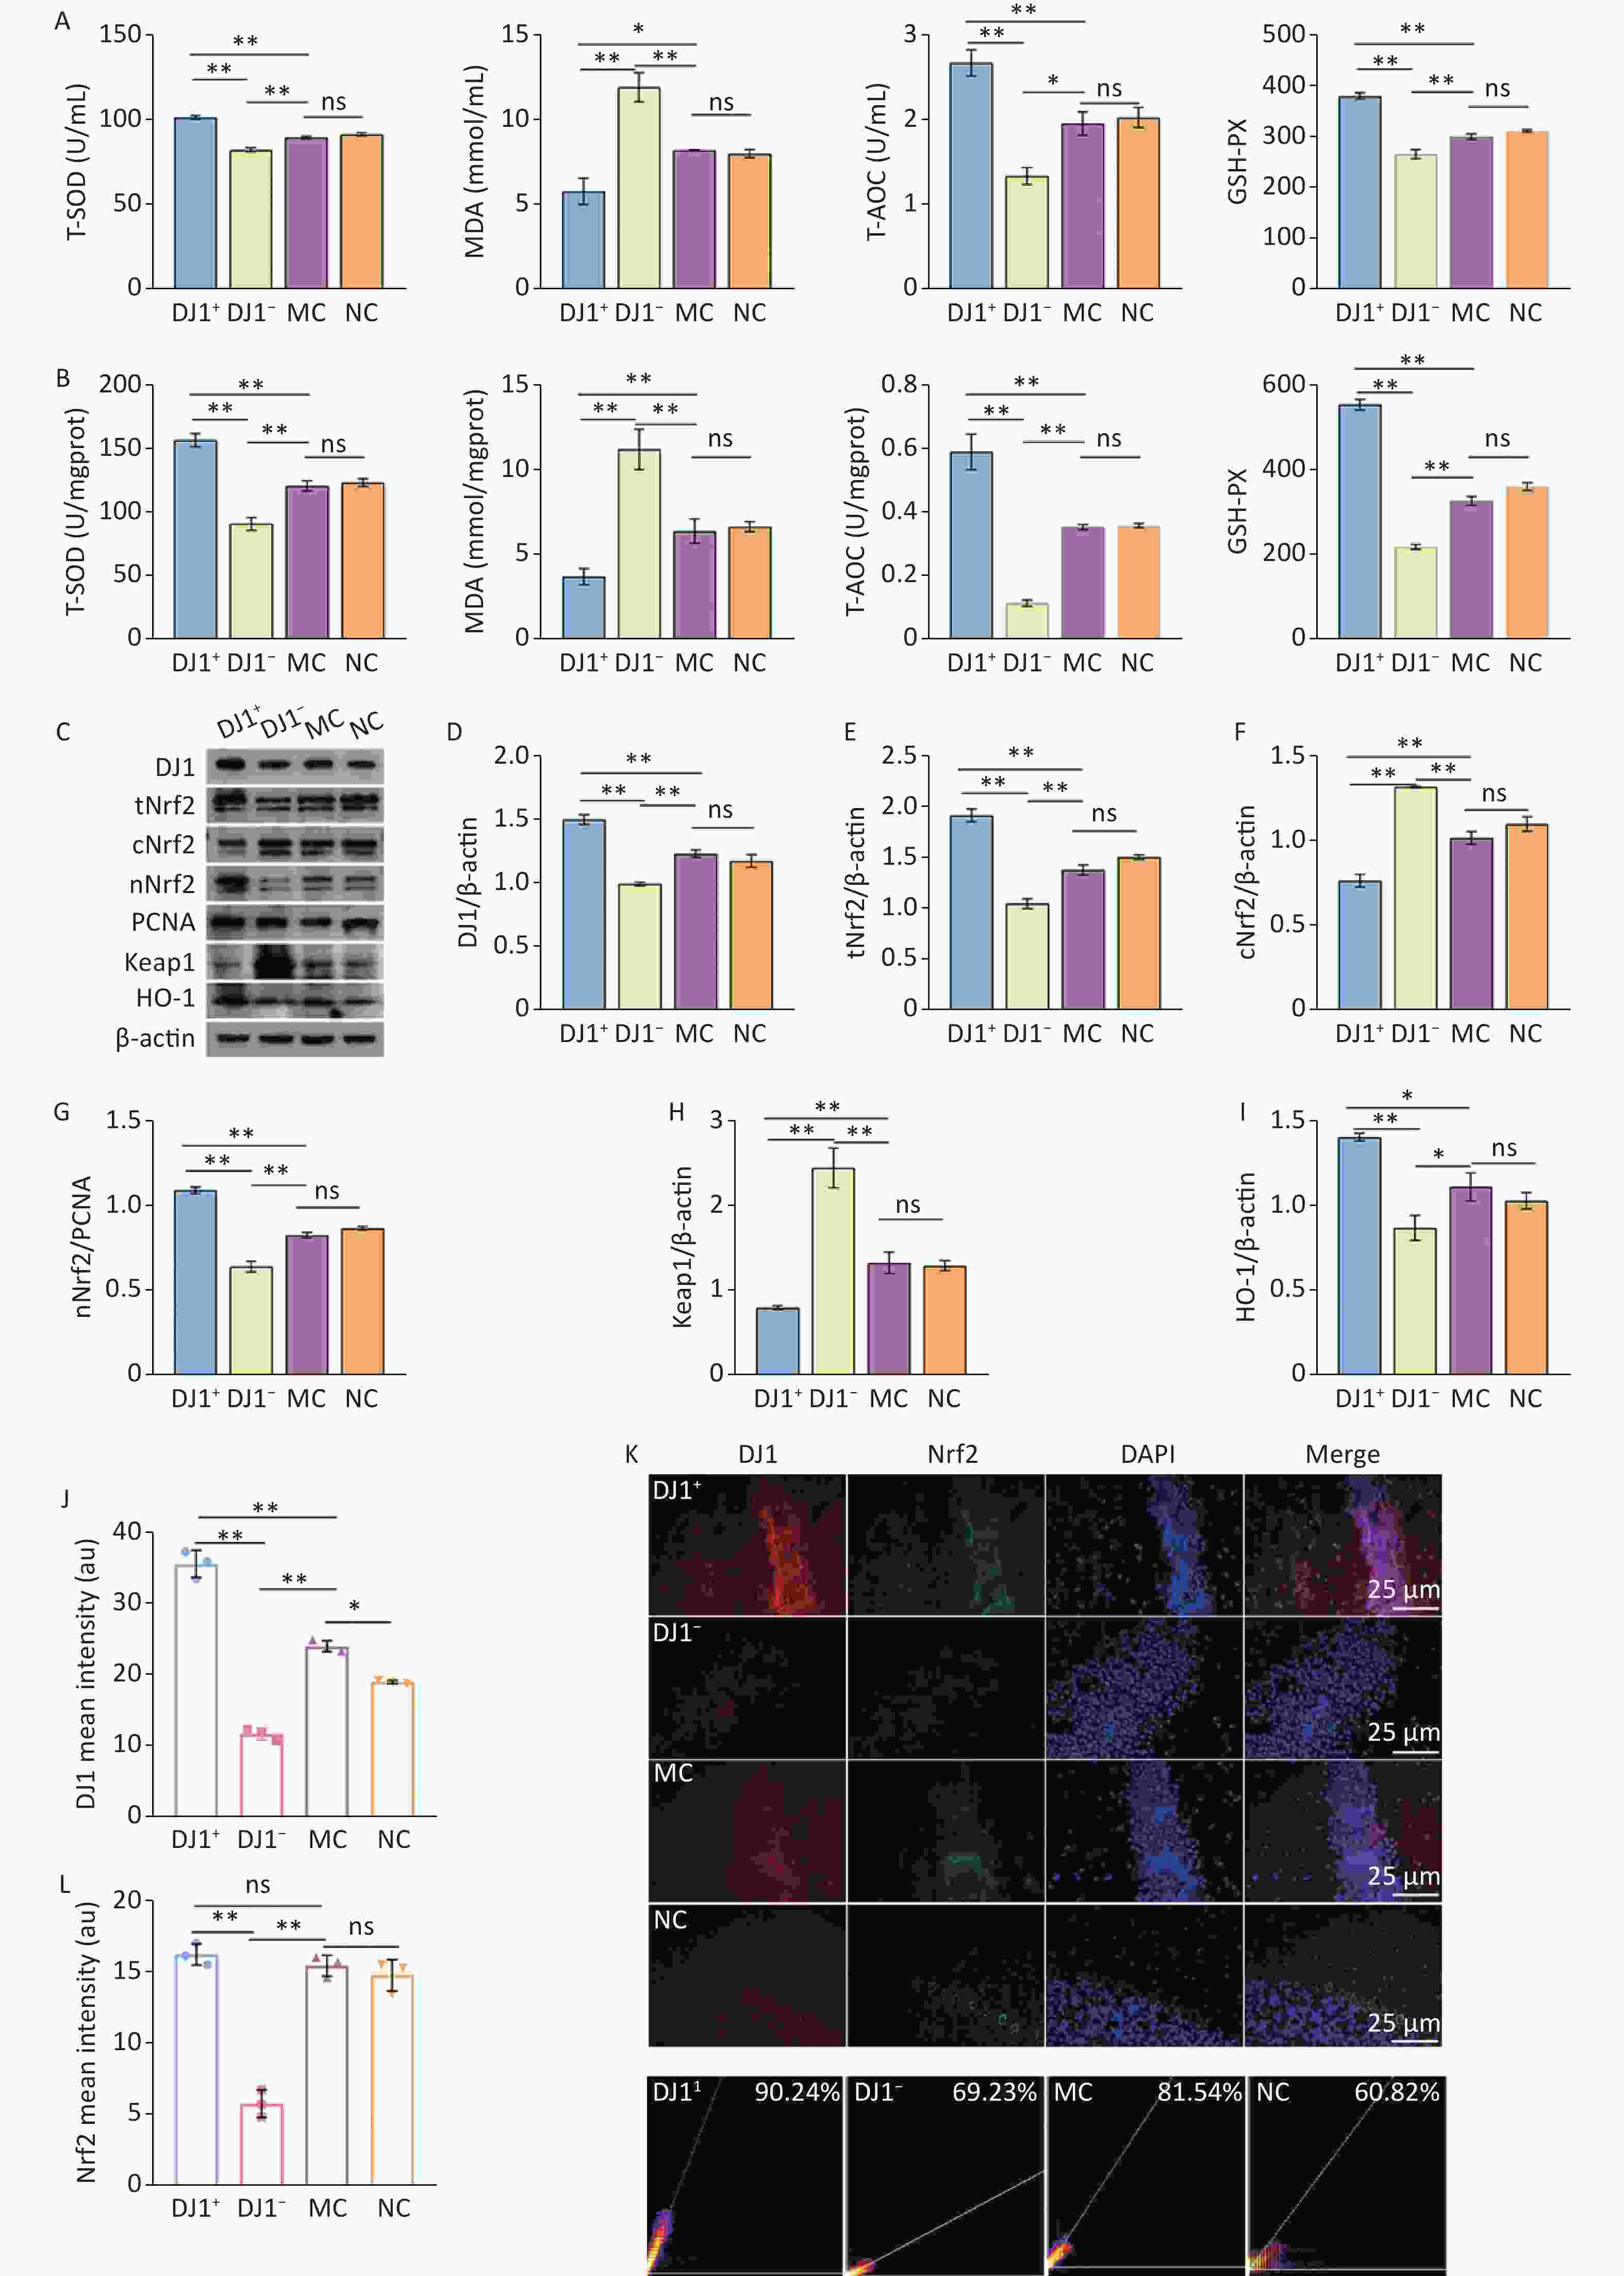
Figure 4. DJ1 up-regulation or knockdown effects on oxidative stress index and Nrf2/HO-1 signaling pathway related proteins in APP/PS1 mice. The levels of oxidative stress in the (A) serum and (B) hippocampus. (C) Western blot analysis of the seven proteins of interest (β-actin used for normalization). Densitometry analyses of (D) DJ1, (E) total Nrf2, (F) cytoplasmic Nrf2, (G) nuclear Nrf2, (H) Keap1, and (I) HO-1. Mean fluorescence intensity of (J) DJ1 and (L) Nrf2. (K) Immunofluorescence co-location of DJ1 (red) and Nrf2 (green), with DAPI nuclear staining (blue). (M) Colocalization coefficient of DJ1 and Nrf2; MC, AD model control group; NC, AAV vector control group; DJ1+, DJ1 up-regulation group; DJ1−, DJ1 knockdown group. *Р < 0.05, **Р < 0.001. Data are expressed as mean ± SD (n = 3). Scale bar 25 µm.
-
To investigate the effects of DJ1 overexpression or knockdown on autophagy in the hippocampal tissues of APP/PS1 mice, the expression of autophagy marker proteins p62/sequestosome1 (SQSTM1), Light chain 3 (LC3), and Beclin1 were examined. The autophagy-related AMPK/mTOR pathway was investigated by detecting the protein expression of phosphorylated AMPK (p-AMPK), AMPK, phosphorylated mTOR (p-mTOR), and mTOR target signals. As shown in figure 5A-J, compared with the MC group, the expression of p62/SQSTM1, p-mTOR, and mTOR and ratio of p-mTOR/mTOR were significantly decreased (P < 0.05), and the expression of LC3, Beclin1, AMPK, and p-AMPK and ratio of p-AMPK/AMPK were significantly increased (P < 0.05) in the DJ1+ group. In contrast, the trend of these indicators in the DJ1− group was the opposite to that in the DJ1+ group. This suggests that DJ1 knockdown inhibited AMPK/mTOR autophagy-related pathways in the hippocampus and induced autophagy defects, while increasing DJ1 expression stimulated autophagic flux and increased autophagy. It is well known that autophagy defects lead to increased mTOR activity, further phosphorylation of Ulk1, and increased cell apoptosis.
The effects of DJ1 overexpression or knockdown on apoptotic events in APP/PS1 mice was evaluated by quantitative analysis of apoptosis markers Caspase3, Bax, and Bcl-2 and detection of TdT-mediated dUTP Nick-End Labeling (TUNEL). Compared with the MC group, the expression levels of Caspase3 and Bax decreased significantly in the DJ1+ group and increased significantly in the DJ1− group, whereas Bcl-2 expression showed an opposite trend in the two groups (P < 0.05). There were no significant changes in the expression levels of these proteins between the MC and NC groups. Compared with the DJ1+ group, the DJ1− group had significantly higher protein expression changes (Figure 5L-O, P < 0.05). The Bax/Bcl-2 ratio is an important indicator that directly reflects the degree of cellular apoptosis, with a higher ratio indicating more severe apoptosis. Compared with the MC group, the Bax/Bcl-2 ratio was significantly decreased in the DJ1+ group and increased in the DJ1− group (Figure 5P, P < 0.001). Similarly, immunofluorescence of Caspase3 protein was consistent with that of western blotting (Figure 5Q and S). The TUNEL test visually reflects the level of cell death, with a higher fluorescence intensity indicating more cell death. Our study showed that the fluorescence intensity of the DJ1+ group was lower than that of the MC group (P < 0.05), but the DJ1− group was significantly higher than that of the MC group (Figure 5R and T, P < 0.001).
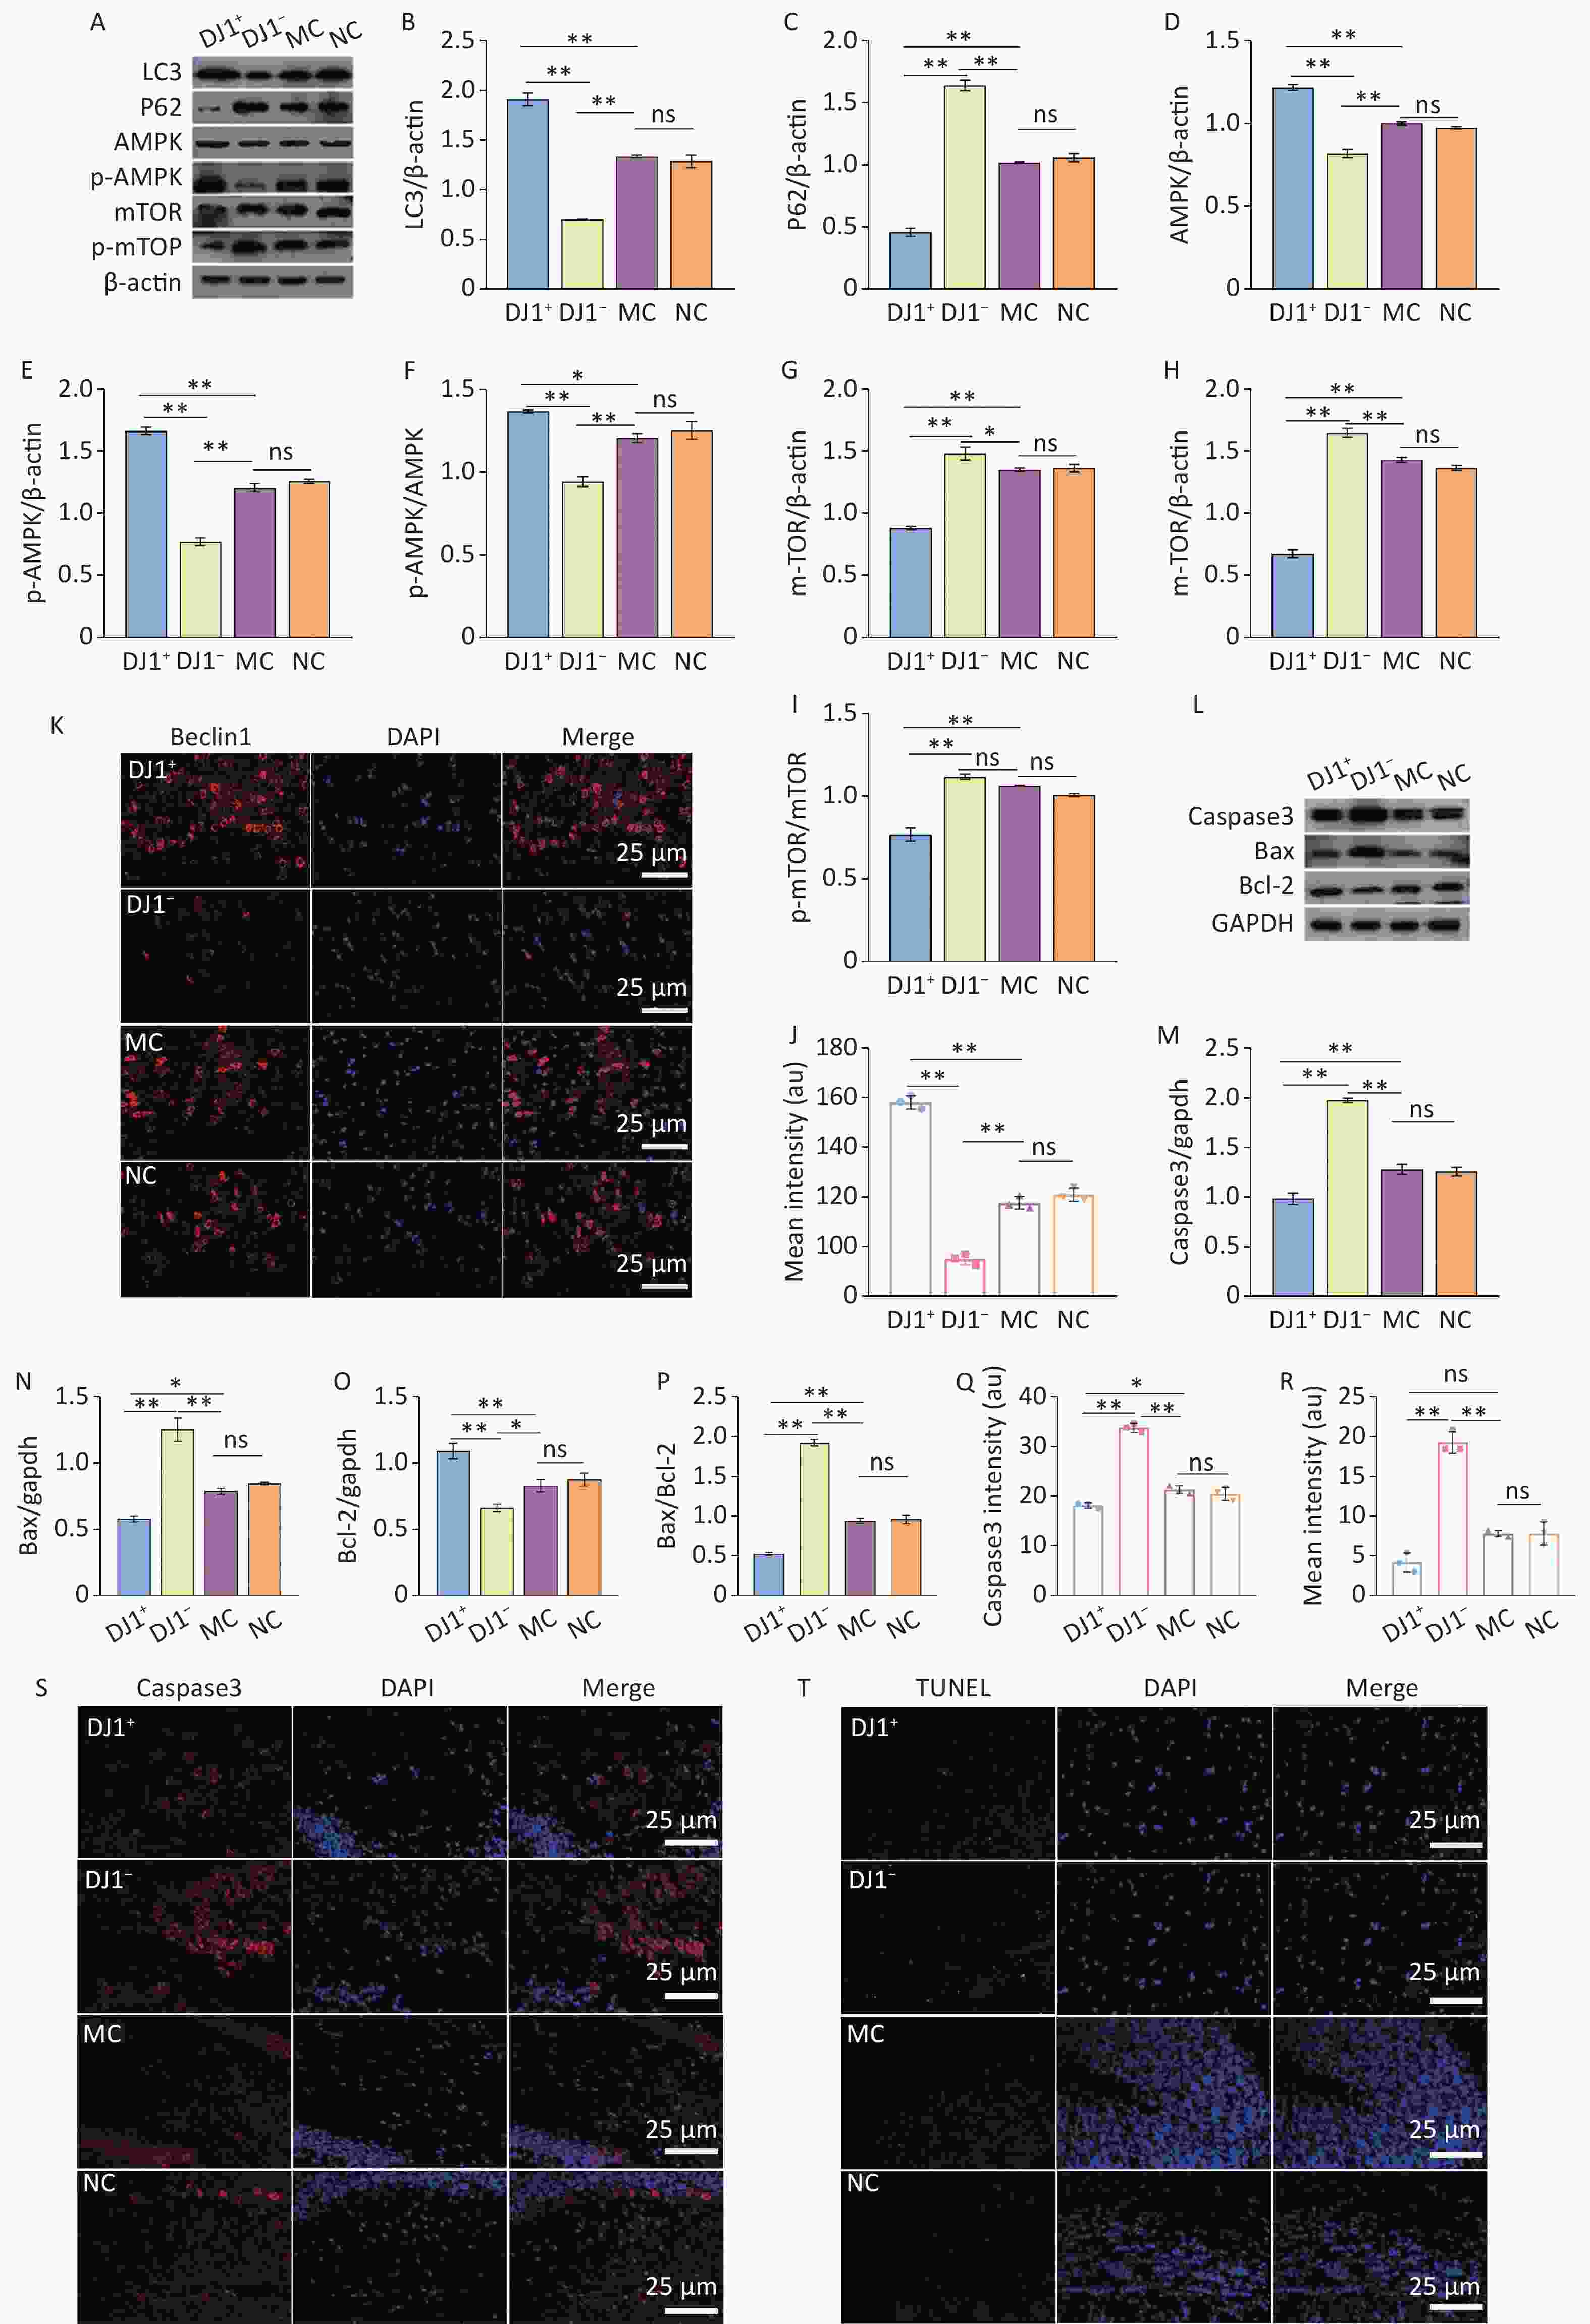
Figure 5. DJ1 up-regulation or knockdown effects on autophagy and apoptosis in the hippocampus of APP/PS1 mice. (A) Western blot analysis of the six proteins of interest in the AMPK/mTOR pathway (β-actin used for normalization). Densitometry analyses of (B) LC3, (C) p62/SQSTM1, (D) AMPK, (E) p-AMPK, (F) AMPK/p-AMPK, (G) mTOR, (H) p-mTOR, and (I) p-mTOR/mTOR. (K) Immunofluorescence results of Beclin1 (red) protein, with DAPI nuclear staining (blue). (J) Mean fluorescence intensity of Beclin1. (L) Western blot analysis of the three proteins of interest involved with apoptosis (GAPDH used for normalization). Densitometry analyses of (M) Caspase3, (N) Bax, (O) Bcl-2, and (P) Bax/Bcl-2. Mean fluorescence intensity of (Q) Caspase3 and (R) TUNEL assay. (S) Immunofluorescence results of Caspase3 (red), with DAPI nuclear staining (blue). (T) Results of TUNEL fluorescence assay; MC, AD model control group; NC, AAV vector control group; DJ1+, DJ1 up-regulation group; DJ1−, DJ1 knockdown group. *Р < 0.05, **Р < 0.001. Data are expressed as mean ± SD (n = 3). Scale bar 25 µm.
-
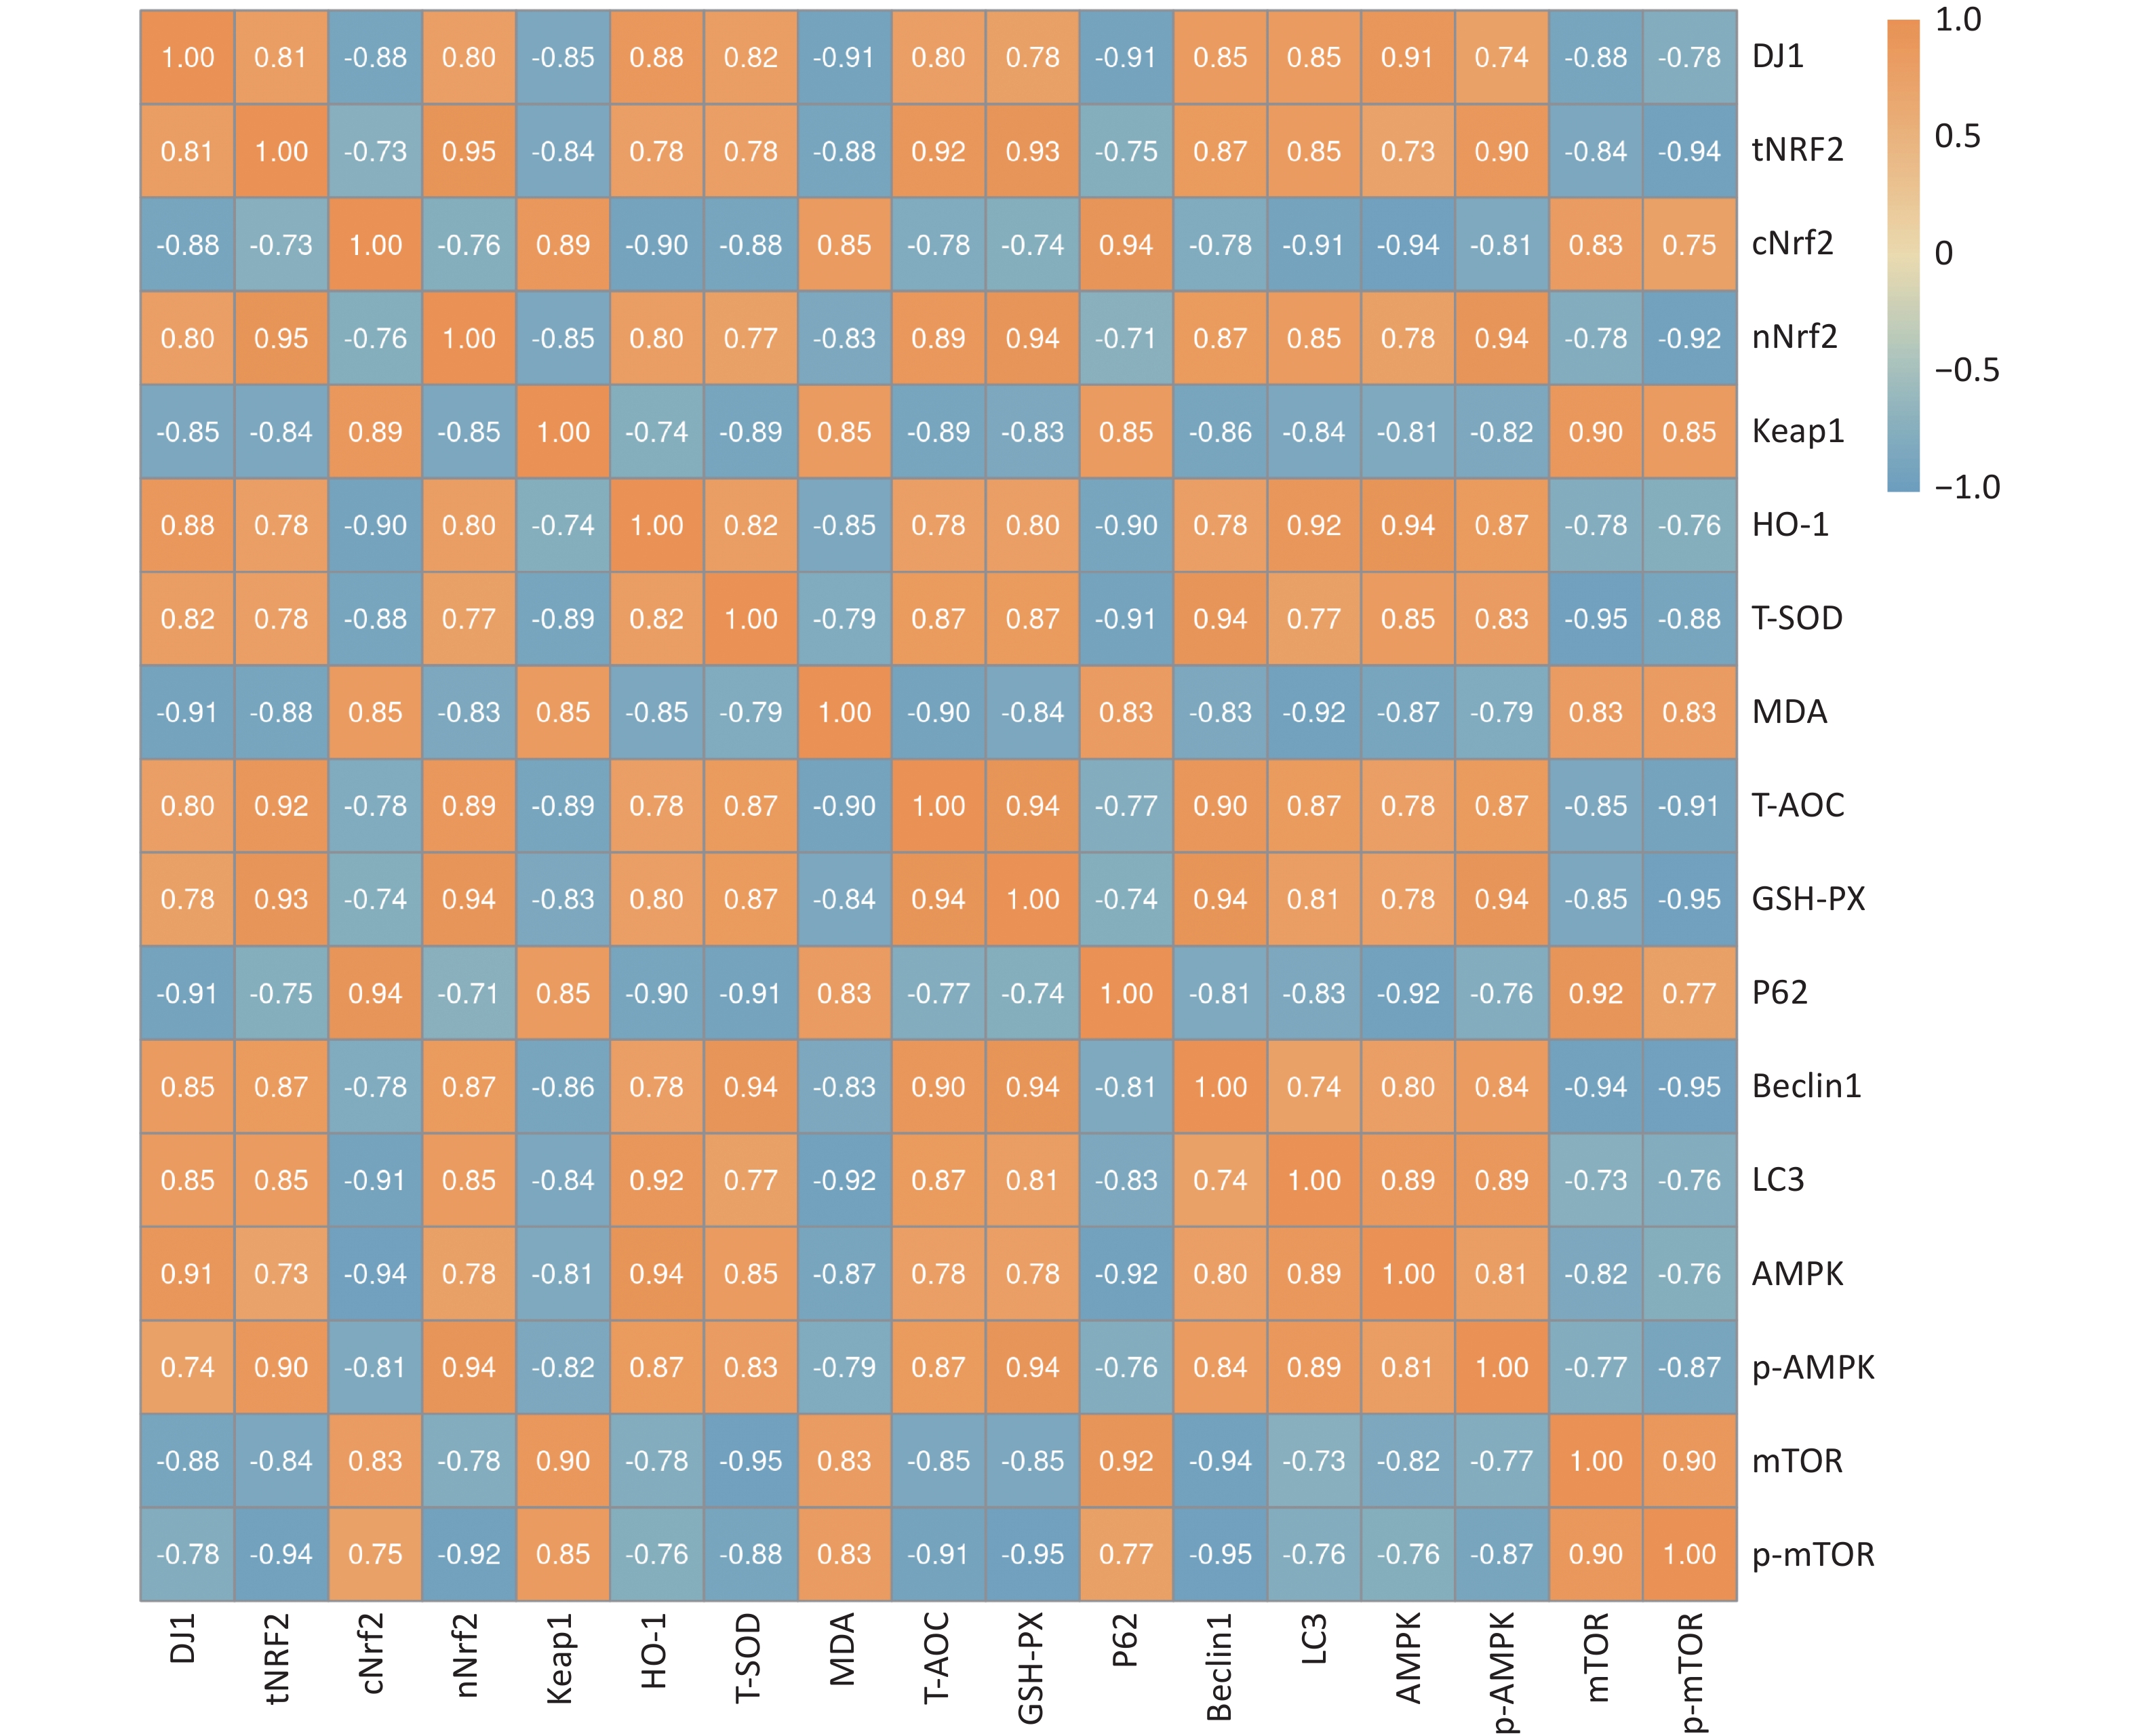
We investigated the effect of DJ1 up-regulation or knockdown on the activity of the Nrf2/HO-1 and AMPK/mTOR signaling pathways and pathway-related protein expression in APP/PS1 mice. To further illustrate the extent of the association between oxidative stress and autophagy after DJ1, a correlation analysis of key indicators was performed. The results showed that the correlation coefficient between oxidative stress indicators and autophagy indicators was 0.998 (P < 0.05) after the up- or down-regulation of DJ1, and there was a strong correlation between the two mechanisms. While there were both positive and negative correlations among the indicators, all correlations were strong. The specific correlation coefficients are shown in Figure 6.
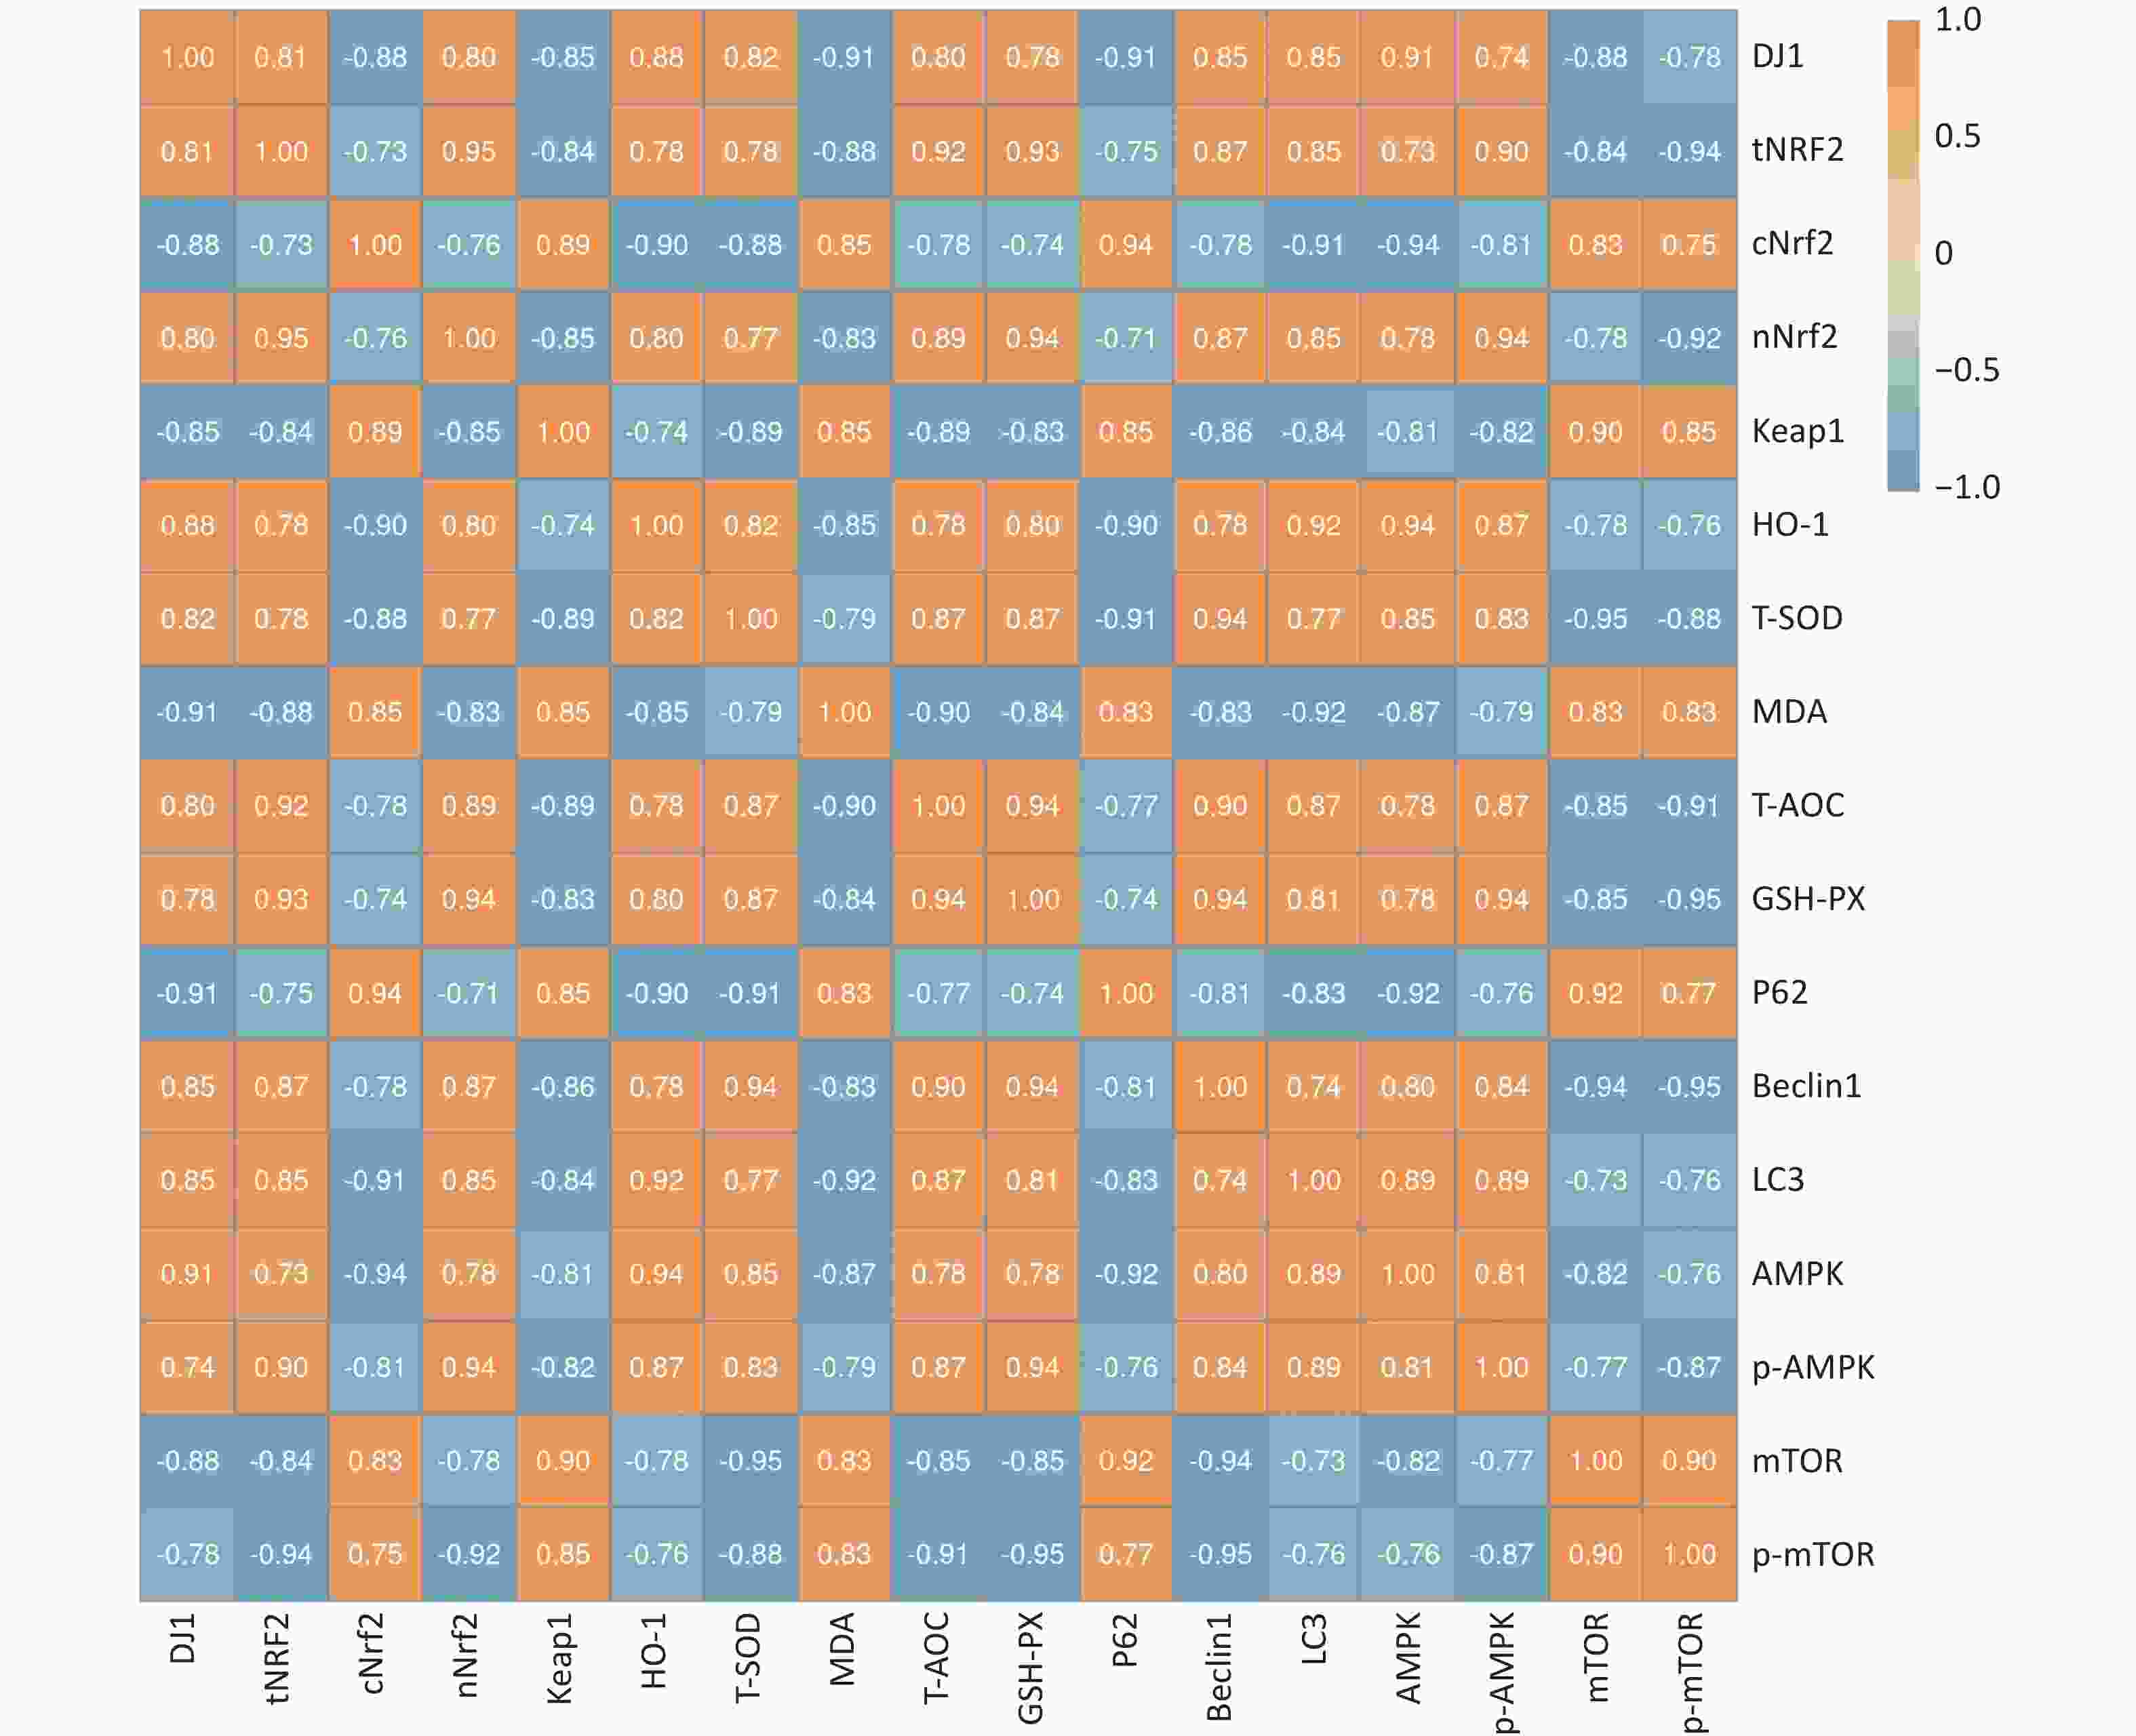
Figure 6. Results of DJ1 up-regulation or knockdown on the correlation between oxidative stress and autophagy-related indices in the hippocampus of APP/PS1 mice.
-
Research on drugs for AD prevention and treatment has received increasing attention in recent years. Evidence confirms that DJ1 has a potent neuroprotective effect, which is capable of resisting the progression of various neurodegenerative diseases in animal models, and may have a positive ameliorative effect on AD[31]. However, the underlying molecular mechanism remains unclear. Current evidence suggests that both oxidative stress and malfunctioning of the autophagic system may contribute to the pathogenesis of AD[32-34], and that the anti-oxidative function of DJ1 may exert a protective effect against certain diseases. Studies have reported that the progressive decline in memory capacity in AD patients is closely related to the function of the hippocampus, which shrinks with age in cognitively impaired patients[35]. Therefore, in this study, the hippocampal tissue of 7-month-old APP/PS1 mice was used as the research object to investigate whether DJ1 overexpression or DJ1 downregulation could improve AD-like lesions by affecting Nrf2/HO-1 and AMPK/mTOR signaling pathways in the hippocampus of APP/PS1 mice, changing oxidative stress and autophagy. This further enriched the understanding of the protective mechanism of DJ1 against AD.
AD is often accompanied by degeneration and death of neuronal cells, as well as a progressive decline in memory and cognitive abilities. Notably, this study showed that DJ1 overexpression ameliorated AD-like pathology and cognitive impairment of APP/PS1 mice, whereas DJ1 knockdown exacerbated the severeness of AD-like changes and cognitive impairment. HE staining and brain index results showed that DJ1 overexpression ameliorated the pathological damage of tissue structural relaxation and massive neuronal cell death, and improved brain atrophy in mice. In contrast, DJ1 knockdown exacerbated neuronal cell death, resulting in severe brain atrophy. Intriguingly, a report by Kitamura et al.[22] showed that, although Aβ40 is more prevalent in AD pathologies, Aβ42 is less distributed but more toxic. In fact, Aβ42 expression significantly increased with the extent of AD injury, which is in accordance with the current findings. Aβ40 and Aβ42 were present in the hippocampus of APP/PS1 mice in multiple combinations, and high expression of DJ1 drastically decreased the levels of hippocampal Aβ40 and Aβ42; whereas DJ1 knockdown significantly increased the expression of Aβ40 and Aβ42, especially the distribution of hippocampal Aβ42. Meanwhile, the Pearson coefficient of Aβ40 and Aβ42 co-localization showed that the DJ1− group was almost twice as high as that of the DJ1+ group, which might be caused by the significant expression of Aβ42 protein in the DJ1− group. This result corroborates the report by Kitamura et al., suggesting that up-regulation of DJ1 activity could suppress the expression of insoluble Aβ42[22]. Moreover, Hijioka et al.[18] reported a decrease in the expression of AD biomarkers Aβ and p-Tau by molecule/compound-mediated DJ1 activation, suggesting an improvement in AD-like degeneration injury. Similarly, in the present study, DJ1 overexpression decreased the expression levels of Aβ and p-Tau, whereas DJ1 knockdown increased their expression. This evidence illustrates that DJ1 has specific ameliorative effects on AD-like injury in APP/PS1 mice. Additionally, the results of the MWM test showed that DJ1 overexpression reduced the escape latency and increased the number of target traversals in APP/PS1 mice, indicating a better cognitive ability, while DJ1 knockdown aggravated the AD-like cognitive impairment. This conclusion was supported by the findings of Fan et al.[28]. Therefore, the data of the present study support the notion that DJ1 may act as a beneficial stimulus in vivo that can improve AD-like impairment and cognitive performance.
Numerous studies have shown that oxidative stress injury induced by excessive ROS production promotes Aβ deposition, tau protein hyperphosphorylation, and neuronal damage[6], playing an important role in the pathogenesis of AD[36]. T-SOD, T-AOC, and GSH-PX are important indicators of antioxidant damage in the body and protect cells and tissues against oxidative stress. Whereas, MDA is the end product of free radical lipid peroxidation, which reflects the rate of lipid peroxidation and the severity of tissue peroxidative injuries[37,38]. Recent studies have shown that the concentrations of Nrf2, HO-1, T-SOD, and GSH-PX are significantly reduced in the brains of AD patients[39], whereas high levels of Nrf2 can ameliorate the damage caused by ROS or mitochondrial dysfunction. In the present study, DJ1 overexpression increased the production of hippocampal T-SOD, T-AOC, GSH-PX, Nrf2, and HO-1, while decreasing the expression of MDA and Keap1. Interestingly, based on the high correlation coefficient from the co-localization analysis, we can assume that increments in DJ1 expression led to up-regulated production of total Nrf2 (60.82%–90.24%). This suggests that the antioxidative effect of DJ1 may be exerted via activation of the Nrf2/HO-1 signaling pathway[20,21,40]. Collectively, these data demonstrate that DJ1 can antagonize oxidative stress damage[41,42] and that disruption of the Nrf2/HO-1 axis may be involved in the pathogenesis of neurodegenerative diseases[43].
Autophagy is a central molecular pathway for maintaining cellular and organismal homeostasis, and autophagic dysfunction can lead to serious human diseases, including cancer and cardiovascular and neurodegenerative diseases[44,45]. Studies[46] previously reported that adrenomedullin can mitigate apoptosis induced by lipopolysaccharide and ROS by promoting autophagy to clear excess ROS and damaged mitochondria[47]. It has also been suggested that autophagy dysfunction in AD pathogenesis is associated with impaired or insufficient Nrf2 activity, regardless of oxidative stress[48,49]. A large body of evidence shows that the Nrf2/HO-1 pathway is capable of modulating the activity of the autophagy adapter p62/SQSTM1 protein[50,51], thereby enhancing organismal autophagy that translocates Aβ from autophagosomes to lysosomes for degradation[52]. In this study, the correlation analysis of oxidative stress and autophagy-related indicators after DJ1 action also showed a strong correlation between the Nrf2/HO-1 and AMPK/mTOR signaling pathways. The accumulation of p62/SQSTM1 protein and reduced Beclin1 protein expression are considered indicators of defective autophagy and are associated with impaired autophagosome degradation and reduced autophagic flux[53,54]. Interestingly, the present study showed that DJ1 knockdown increased p62/SQSTM1 protein accumulation and decreased Beclin1 and LC3 expression; whereas DJ1 overexpression increased Beclin1 and LC3 expression and decreased p62/SQSTM1 protein accumulation, possibly through Nrf2 activation. These alterations in autophagic markers suggest that DJ1 affects autophagy in APP/PS1 mice. Moreover, it has also been reported that activation of the AMPK/mTOR cascade can induce autophagy bio-activity[55-58] and improve the neurodegenerative pathology of AD[17]. Consistent with this view, the current study showed that DJ1 up-regulation activated the AMPK/mTOR pathway, as evidenced by the increased p-AMPK/AMPK and decreased p-mTOR/mTOR ratio. At the molecular level, activation of autophagy markers and the AMPK/mTOR signaling pathway in hippocampal tissue suggests a favorable role for DJ1 in APP/PS1 mice, which may be associated with an ameliorative mechanism for AD-like pathological changes.
Defective autophagy may contribute to the aberrant activation of certain signaling pathways that lead to apoptosis[59]. In vivo and in vitro studies on the prevention of atherosclerosis and coronary restenosis have shown that mTOR inhibitors can promote autophagy, thereby improving apoptosis[46]. Consistently, it has also been shown that defective autophagy due to excessive mTOR activity allows the accumulation of damaged organelles and proteins and accelerates cell death and tissue damage[45,54]. This is consistent with the results of the present study, which showed that DJ1 overexpression decreased Caspase3 expression, Bax/Bcl-2 ratio, and the proportion of apoptotic cells detected by TUNEL, whereas DJ1 knockdown had the opposite effects on cell fate. Thus, it can be assumed that DJ1 overexpression may enhance autophagy in the mouse hippocampus, leading to up-regulation of anti-apoptotic Bcl2 and preventing the transfer of pro-apoptotic Bax to the mitochondria, thereby inhibiting apoptosis. At the same time, under this pro-apoptotic condition of DJ1 knockdown, Caspase3 can induce the degradation of Beclin1, thus hindering the initiation of autophagy[60]. In summary, the present study suggests that DJ1 can ameliorate AD-like pathology and cognitive impairment in APP/PS1 mice, and the beneficial effect might be partly through the activation of the Nrf2/HO-1 and/or AMPK/mTOR pathways, while alleviating oxidative damage injury and autophagy defects.
However, the present study has several limitations that need to be considered. First, because this was a preliminary exploratory experiment, we only studied the oxidative stress-related Nrf2/HO-1 signaling pathway, autophagy-related AMPK/mTOR signaling pathway, and apoptotic marker proteins in the hippocampus. This study did not investigate the full range of signaling pathways or other key molecules involved in signaling pathways. Therefore, a more comprehensive assessment of the signaling pathway and transduced proteins is necessary in future studies to more accurately demonstrate the role of DJ1 in AD-like changes. Second, we evaluated the role of DJ1 deficiency in AD-like changes by knocking down DJ1, but not by knocking out DJ1. To gain more insight into the role of DJ1 in AD-like changes, future studies will need to explore more comprehensive combinations including DJ1 knockout mice.
-
In summary, the present study confirmed that DJ1 overexpression inhibited oxidative stress injury, enhanced autophagy, and suppressed apoptosis in the hippocampal tissue of APP/PS1 mice, whereas DJ1 knockdown had the opposite effect. DJ1 overexpression ameliorated AD-like changes and cognitive impairments in the double transgenic mice. Furthermore, the ameliorative effect of DJ1 on AD-like changes may be partially mediated by activation of the Nrf2/HO-1 and AMPK/mTOR signaling pathways. Our study provides a proof-of-concept framework for DJ1 experimental AD improvement, and suggests that DJ1 may be a viable potential intervention target for AD. However, further studies are needed to test this conclusion and to probe the detailed signally pathways underlying these findings more deeply .
DJ1 Ameliorates AD-like Pathology in the Hippocampus of APP/PS1 Mice
doi: 10.3967/bes2023.133
Funds:
This work was supported by the National Natural Science Foundation of China [grant numbers 81872626 and 82003454]; Chinese Nutrition Society - Bright Moon Seaweed Group Nutrition and Health Research Fund [grant number CNS-BMSG2020A63]; Key R&D and promotion projects in Henan Province [grant number 212102310219 and 212102310110].
- Received Date: 2022-11-22
- Accepted Date: 2023-03-13
-
Key words:
- Alzheimer’s disease /
- DJ1 /
- NRF2/HO-1 /
- Oxidative stress /
- AMPK/mTOR /
- Autophagy /
- Apoptosis.
Abstract:
The authors declare that they have no known competing financial interests or personal relationships that could have influenced the work reported in this study.
&These authors contributed equally to this work.
| Citation: | PENG Yang Yang, LI Meng Xin, LI Wen Jie, XUE Yuan, MIAO Yu Fan, WANG Yu Lin, FAN Xiao Chen, TANG Lu Lu, SONG Han Lu, ZHANG Qian, LI Xing. DJ1 Ameliorates AD-like Pathology in the Hippocampus of APP/PS1 Mice[J]. Biomedical and Environmental Sciences, 2023, 36(11): 1028-1044. doi: 10.3967/bes2023.133

|

 Quick Links
 DownLoad: