


-
Caesarean section is a well-established surgical procedure that allows for maximum fetal rescue under special circumstances, such as intrauterine distress and intrauterine hypoxia, and minimizes injuries to pregnant women who cannot tolerate vaginal delivery. Emergency caesarean section is a special type of caesarean section that plays an important role in protecting the lives of pregnant mothers and fetuses[1]. Allergic diseases, including allergic asthma, allergic rhinitis, and atopic dermatitis, affect at least 20% of the global population and their incidence continues to increase annually, affecting both the physical and mental health of patients and imposing a huge economic burden on society and families[2]. Immunoglobulin E (IgE)-mediated type I hypersensitivity reactions are the most common type of allergic disease, and the eosinophil percentage in blood tests is one of the most common clinical indicators.
In recent years, the debate and research on the relationship between caesarean section and allergic diseases have increased each year. A meta-analysis of one randomized control trial (RCT) and 79 cohort studies showed that children delivered by caesarean section had a higher risk of asthma[3]. However, one study followed 4,779 children for 4 years and found insufficient evidence of a correlation between caesarean section and eczema, asthma, and food allergies[4]. Considering the maturity of caesarean section techniques and the increasing incidence of allergic diseases worldwide every year, it is important to clarify whether a causal relationship exists between caesarean sections and different allergic diseases. Moreover, there is an urgent need to find new epidemiological techniques because traditional epidemiological methods, such as cohort studies, are subject to confounding factors and ethics and thus fail to obtain exact causal relationships[5].
Advances in genomics and genetic epidemiology have led to the identification of numerous genetic variants associated with various human diseases. Mendelian randomization (MR) is an epidemiological technique that is used to assess causality using genetic data. As the human genome cannot be changed at will once it is identified, MR greatly reduces the influence of confounding factors and thus obtains more reliable causal associations[5]. Following the principles of random assignment and free association and combining the three core assumptions of instrumental variables (IVs), namely, the assumption of association, independence, and exclusivity, we used MR analysis to analyze the effects of emergency caesarean section on different allergic diseases and associated blood markers.
Data for this study were obtained from the OpenGWAS database (https://gwas.mrcieu.ac.org//). Data from exposure subjects (emergency caesarean section) and outcome subjects (allergic disease, childhood allergy (age < 16 years), allergic asthma, allergic rhinitis, atopic dermatitis, eczema, allergic urticaria, allergic purpura, allergic conjunctivitis, lactose intolerance, IgE, eosinophil percentage, and basophil percentage were extracted for subsequent analysis using the TwoSampleMR package in R software (version 4.3.0, Publisher: R Foundation for Statistical Computing, Place of publication: Vienna, Austria). IVs were screened for the following conditions: 1) correlation with emergency caesarean section (P < 1 x 10⁻⁵); 2) exclusion of linkage disequilibrium (LD) (r2 > 0.001, kb = 10,000); 3) validation of the strength of association between IVs and exposed subjects (F > 10); and 4) removal of confounding factors using the Phenoscanner database (http://www.phenoscanner.medschl.cam.ac.uk/)[6]. The above conditions screened for more reliable IVs in this study, thus increasing the reliability of the results. A flowchart and word cloud chart outlining the process of data collection are shown in Figure 1. This Genome-Wide Association Study (GWAS) contained 9,538 and 969 SNPs, and 18 IVs were included after rigorous screening. The GWAS ID for emergency caesarean sections was ukb-d-41221_8 and contained 8,019 samples, including 1,158 from the experimental group and 6,861 from the control group. The relevant studies of the outcome subjects were mainly published between 2016–2021, and the study populations were mainly from European and Greater Middle Eastern regions (Supplementary Tables S1–S2, available in www.besjournal.com).
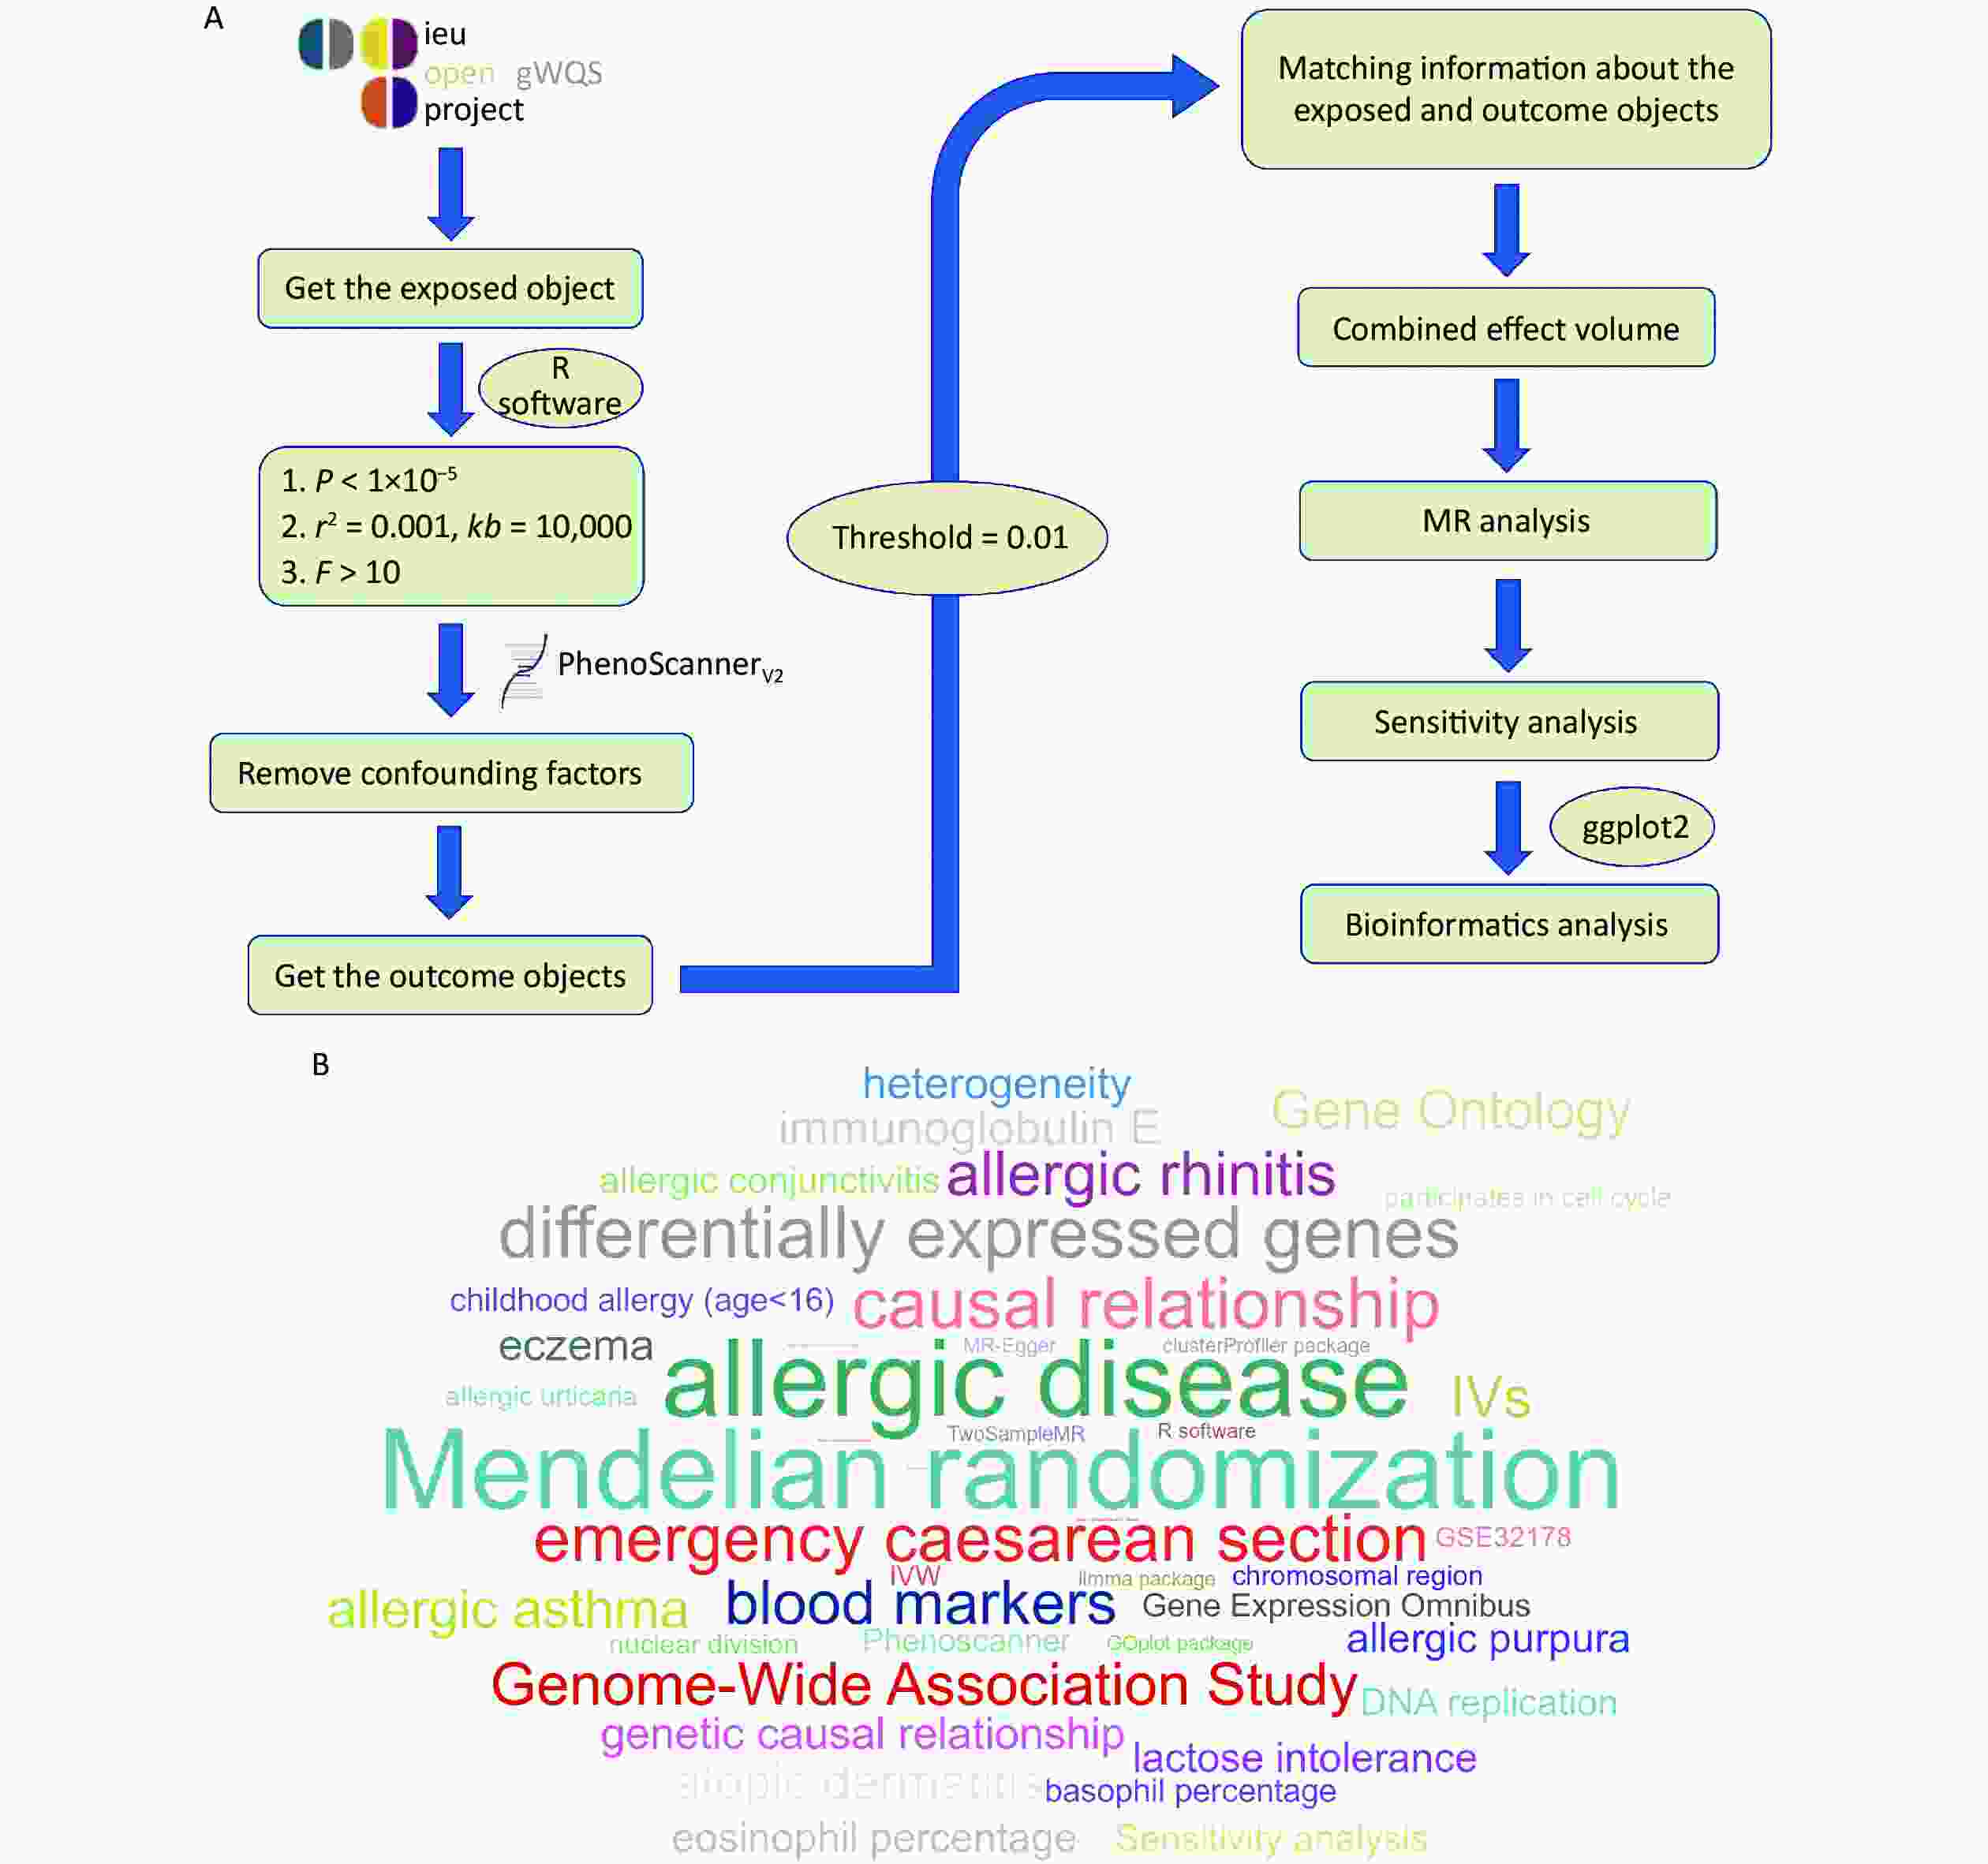
Figure 1. Outline of data acquisition. (A) flow chart. (B) word cloud chart.
MR analysis includes five analysis methods, among which inverse variance weighted (IVW) and MR-Egger are the most important for this study. A P < 0.05, indicated that emergency caesarean section affected patient outcomes. Heterogeneity between each IV was verified using a heterogeneity test. When P > 0.05, no heterogeneity was considered to exist, and a fixed-effects model was selected for MR analysis. When P < 0.05, heterogeneity was considered to exist, and a random-effects model was selected. The sensitivity of MR analysis results to individual IV was verified using leave-one-out sensitivity analysis. The presence of horizontal pleiotropy among multiple IVs was verified using a multiple validity test that ensured both correlation and independence between the IVs and exposed objects. The results of IVW analysis were used as the main results of MR analysis when P > 0.05 was considered as no horizontal pleiotropy, and the results of MR-Egger analysis were used as the main results of MR analysis when P < 0.05 was considered as horizontal pleiotropy. MR analysis showed no causal relationship between emergency caesarean section and allergic disease or childhood allergies (age < 16 years) (P > 0.05). Additionally, there was no causal relationship between emergency caesarean section and eight specific allergic diseases (allergic asthma, allergic rhinitis, atopic dermatitis, eczema, allergic urticaria, allergic purpura, allergic conjunctivitis, and lactose intolerance) (P > 0.05) (Table 1, Figure 2, and Supplementary Figure S1, available in www.besjournal.com). Finally, MR analysis of emergency caesarean sections and blood markers of allergic diseases showed no causal relationship between emergency caesarean sections and IgE, eosinophil percentage, or basophil percentage (P > 0.05) (Table 1 and Supplementary Figure S2, available in www.besjournal.com). The results of the heterogeneity test were considered significant at P > 0.05. Therefore, it can be concluded that there was no heterogeneity among the IVs, and the fixed-effects model was selected to present the results of the MR analysis (Supplementary Figure S3, available in www.besjournal.com). The multiplicity test also showed P > 0.05. Therefore, we concluded that there was no horizontal multiplicity among the IVs, and the results of the IVW analysis were selected as the main results of the MR analysis (Supplementary Table S3 and Supplementary Figures S4–S5, available in www.besjournal.com).
Outcome No. SNP IVW MR Egger OR (95% CI) P OR (95% CI) P Allergic disease 14 0.917 (0.802−1.050) 0.210 0.893 (0.663−1.201) 0.467 Childhood allergy (age < 16) 18 1.105 (0.656−1.864) 0.707 1.370 (0.391−4.799) 0.629 Allergic asthma 18 1.224 (0.829−1.806) 0.309 1.547 (0.594−4.029) 0.385 Allergic rhinitis 18 1.237 (0.877−1.744) 0.226 1.093 (0.479−2.493) 0.835 Atopic dermatitis 18 1.138 (0.794−1.632) 0.482 1.196 (0.491−2.918) 0.699 Eczema 15 1.060 (0.648−1.733) 0.818 1.306 (0.431−3.952) 0.645 Allergic urticaria 18 0.941 (0.456−1.945) 0.870 0.777 (0.137−4.418) 0.780 Allergic purpura 18 1.164 (0.373−3.631) 0.794 2.446 (0.160−37.342) 0.529 Allergic conjunctivitis 18 1.154 (0.884−1.508) 0.293 0.998 (0.526−1.896) 0.996 Lactose intolerance 18 0.392 (0.116−1.323) 0.131 4.732 (0.289−77.529) 0.292 Immunoglobulin E 16 1.195 (0.725−1.971) 0.485 0.531 (0.188−1.499) 0.252 Eosinophill percentage 18 0.719 (0.352−1.468) 0.365 0.835 (0.158−4.400) 0.834 Basophil percentage 18 0.969 (0.911−1.031) 0.326 0.916 (0.801−1.047) 0.217 Note. MR, Mendelian randomization; IVW, Inverse variance weighted; No. SNP, number of SNPs. Table 1. Main results of MR analysis
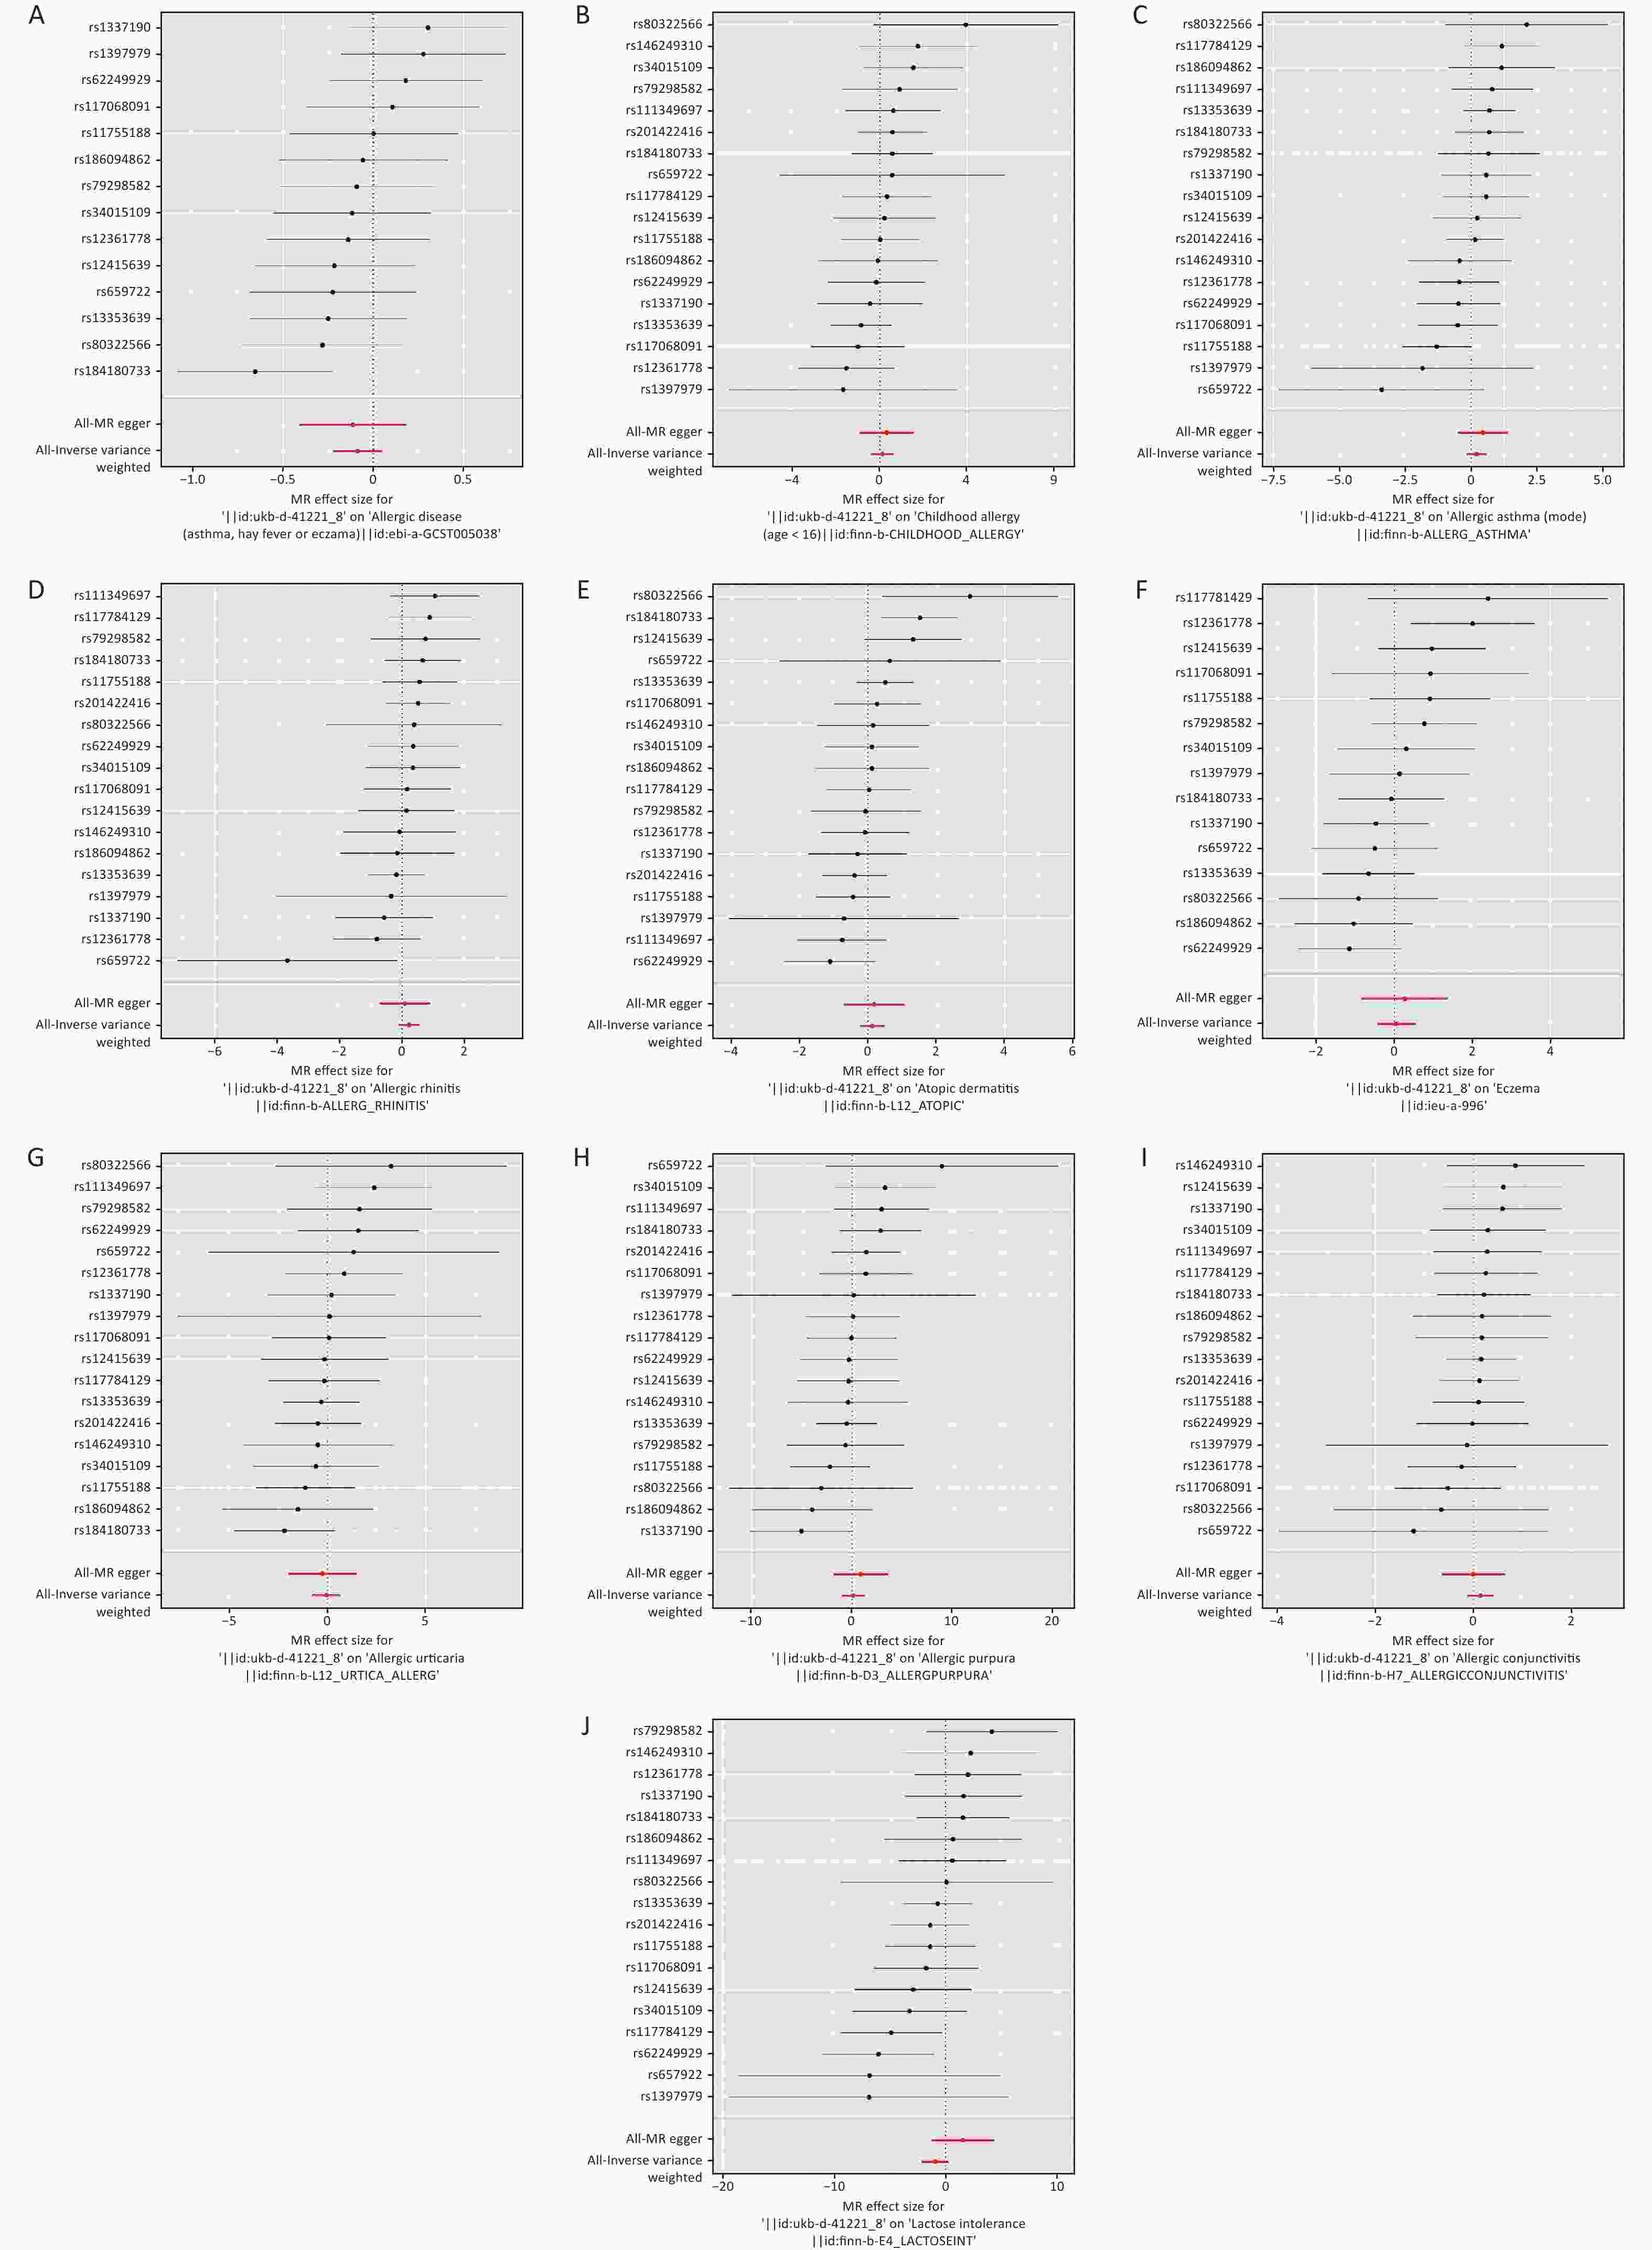
Figure 2. Forest diagram of MR analysis. (A) allergic disease. (B) childhood allergy (age < 16). (C) allergic asthma. (D) allergic rhinitis. (E) atopic dermatitis. (F) eczema. (G) allergic urticaria. (H) allergic purpura. (I) allergic conjunctivitis. (J) lactose intolerance. MR: Mendelian randomization.
GSE18850 is a dataset related to caesarean sections obtained from the Gene Expression Omnibus (GEO) database (https://www.ncbi.nlm.nih.gov/gds/). Differential expression analysis was performed using the limma package to obtain caesarean section-related differentially expressed genes (DEGs), and the results were visualized using the ggplot2 package. The results of the MR analysis were validated by comparing whether the identified DEGs intersected with caesarean section-associated blood marker genes. The obtained DEGs were analyzed for Gene Ontology (GO) and Kyoto Encyclopedia of Genes and Genomes (KEGG) enrichment using clusterProfiler and GOplot packages to understand the main functions and pathways associated with the DEGs. A total of 21 DEGs (|log2(FC)| > 2 and P adj < 0.05) were obtained, of which five were highly expressed and 16 were lowly expressed. Genes capable of expressing allergic disease-related blood markers were not detected among the 21 DEGs (Supplementary Figure S6A–B and Supplementary Table S4, available in www.besjournal.com). Enrichment analysis revealed that the main functions of the DEGs included nuclear speckling and muscle tissue development, and the corresponding pathways were not predicted (Supplementary Figure S6C–D).
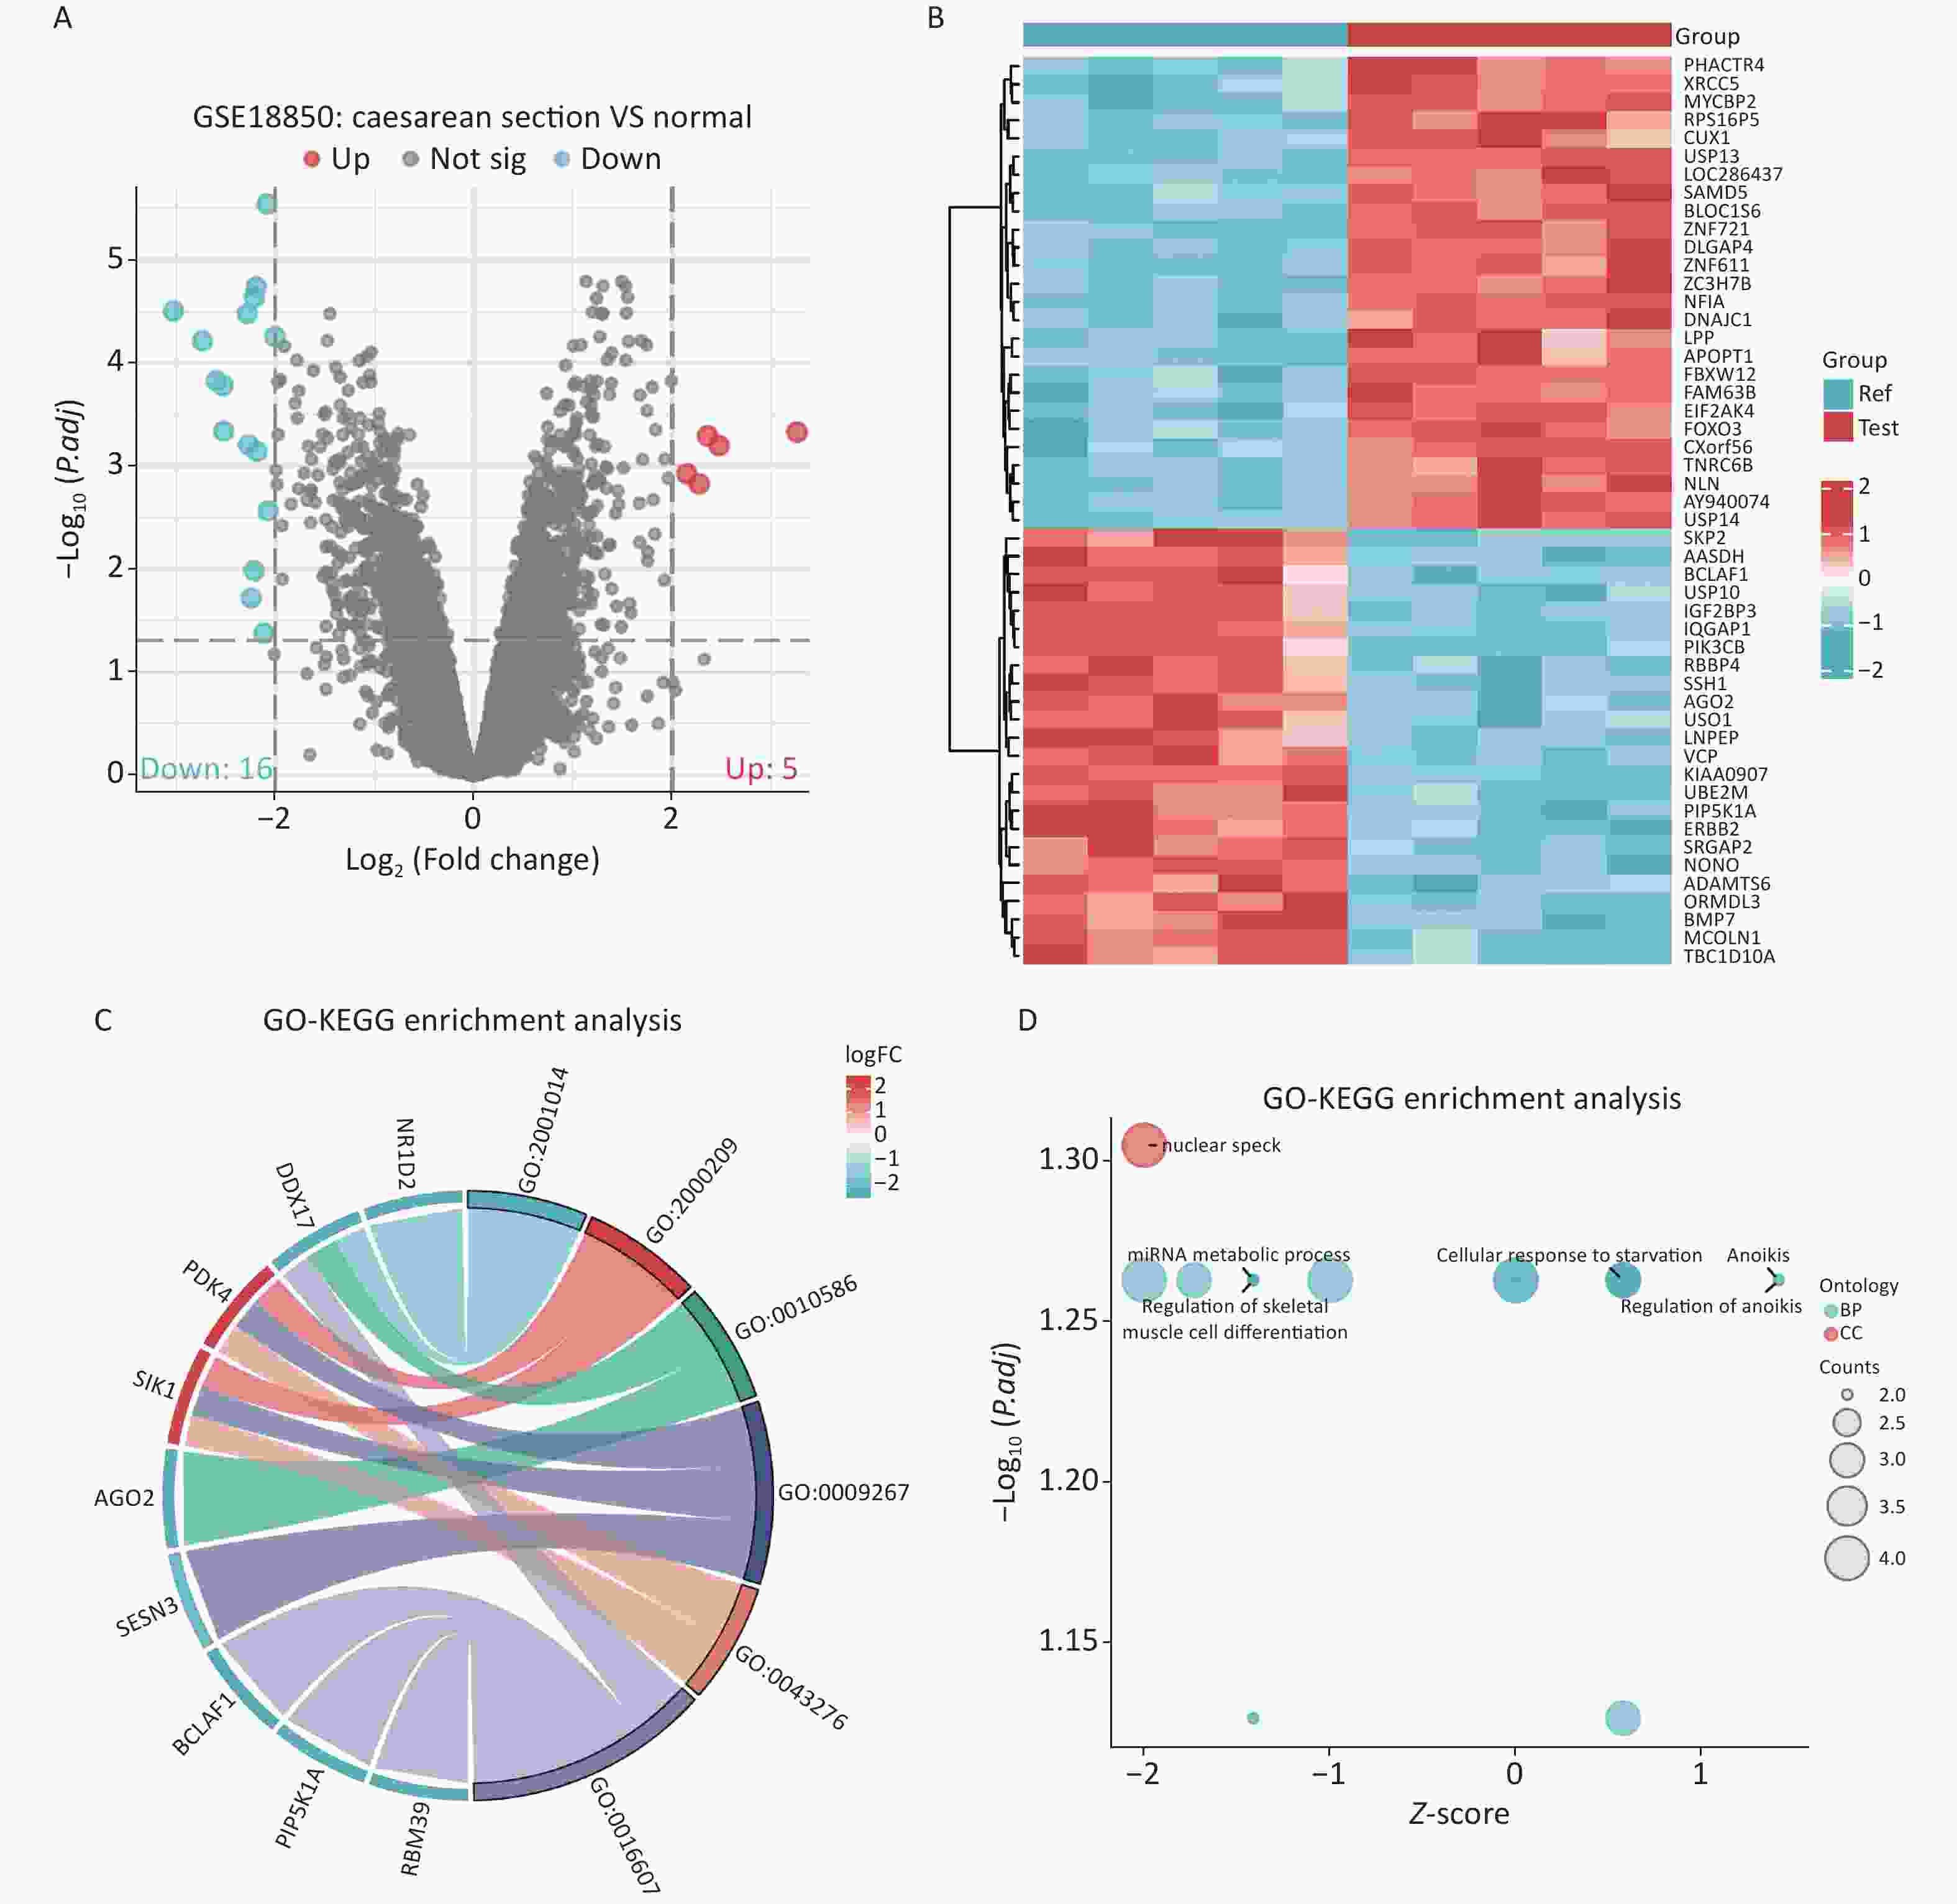
Figure S6. Screening and enrichment analysis of DEGs for caesarean section. (A) Volcano map. (B) Heat map. (C–D) GO enrichment analysis of DEGs. DEGs: differentially expressed genes; GO: Gene Ontology.
Gene ID logFC adj.P.Val Expression HINT3 228697_at 3.259010636 0.000469954 up IGF2BP3 216493_s_at −3.027401576 3.14647E-05 down BMP7 209591_s_at −2.734693518 6.10673E-05 down LNPEP 243532_at −2.595499519 0.000148732 down BCLAF1 201101_s_at −2.527165559 0.000166675 down SVEP1 224543_at −2.520435946 0.00046041 down APOLD1 221031_s_at 2.472906932 0.000634009 up CFDP1 210701_at 2.358095612 0.000511744 up AGO2 225827_at −2.283314268 3.33373E-05 down PDK4 1562321_at 2.275045549 0.001499066 up NR1D2 209750_at −2.271033433 0.000622949 down DDX17 208151_x_at −2.243062921 0.019070058 down RABGAP1L 215342_s_at −2.215114208 0.010436147 down PIP5K1A 211205_x_at −2.21060312 2.30491E-05 down IQGAP1 213446_s_at −2.193546636 1.83871E-05 down RBM39 227223_at −2.185378461 0.00072474 down SIK1 208078_s_at 2.148953725 0.001194315 up DNAJC3 235341_at −2.112963349 0.042014383 down KIAA0907 230028_at −2.083202112 2.88288E-06 down SESN3 235150_at −2.071194078 0.00272332 down ORMDL3 235136_at −2.004201728 5.59057E-05 down Table S4. Differentially expressed genes associated with caesarean section
The results of the MR analysis in this study are contradictory to previous traditional epidemiological and observational studies. A study by Gürdeniz showed that caesarean section could increase the risk of asthma by interfering with the immune response and the development of gut microbes[7]. In this study, the most recent and largest sample size of GWAS datasets were used. The absence of heterogeneity and horizontal pleiotropy in the analysis and the smallest F-value of 20 suggest that there were no weak IVs in this study. Therefore, the finding that there was no causal relationship between the exposure and outcome was more accurate. Traditional epidemiological statistical methods may not be able to exclude unknown confounding factors well, while MR analysis can better exclude the interference of confounding factors on causality from a genetic perspective that cannot be easily changed[5]. In a large cohort study, there was no correlation between caesarean section and allergic rhinitis in children at 6, 8, and 10 years after birth, after correcting for confounders[8]. However, most patients undergoing emergency caesarean section often have multisystem diseases associated with allergic diseases, such as premature birth, immune abnormalities, and genetic metabolic diseases. Patients with allergic diseases often have abnormalities in immune and inflammatory factors or a history of living in a particular environment, such as haze[9]. These known or unknown immune, inflammatory, and environmental pathways as well as the comorbidities associated with these pathways may lead to false-positive statistical results in traditional epidemiology.
Bioinformatics, a research method that has received considerable attention in recent years, was used to reverse-validate the results of this study. Genes significantly associated with blood markers of allergic diseases were not among the 21 DEGs identified by differential expression analysis. HINT3 was the most significantly differentially expressed gene and was primarily associated with breast cancer[10]. In addition, no major functions or DEG pathways were significantly associated with blood markers of allergic diseases, which validated the results of the MR analysis in this study and suggested the influence of confounding factors on the results of previous epidemiological studies.
The present study has some limitations. First, the samples included in this study were mainly from European and Greater Middle Eastern countries, and a geographical selection bias may have occurred. Therefore, the findings of this study may not apply to other Asian ethnic groups. In addition, to enable rigorous sensitivity analysis, P < 1 x 10⁻⁵ was chosen as the association threshold for screening IVs in this study. Although the r2 and F values were strictly limited and the results were secondarily validated using bioinformatics, the possibility of false-positive or false-negative results could not be completely excluded. Finally, although we used MR analysis and bioinformatics to validate the results of this study, experimental molecular validation of the mechanism and pathway is still lacking, and more in-depth studies should be considered on this basis subsequently.
In conclusion, the two-sample MR analysis in this study showed no causal relationship between emergency caesarean section and allergic diseases such as allergic asthma, allergic rhinitis, and atopic dermatitis or blood markers such as IgE and eosinophil percentage. Our study provides a new direction for subsequent research on the mechanisms and risk factors of allergic diseases and alleviates public misconceptions and fears about caesarean sections.
The authors would like to thank the OpenGWAS database (https://gwas.mrcieu.ac.uk/) and GEO databases (https://www.ncbi.nlm.nih.gov/gds/).
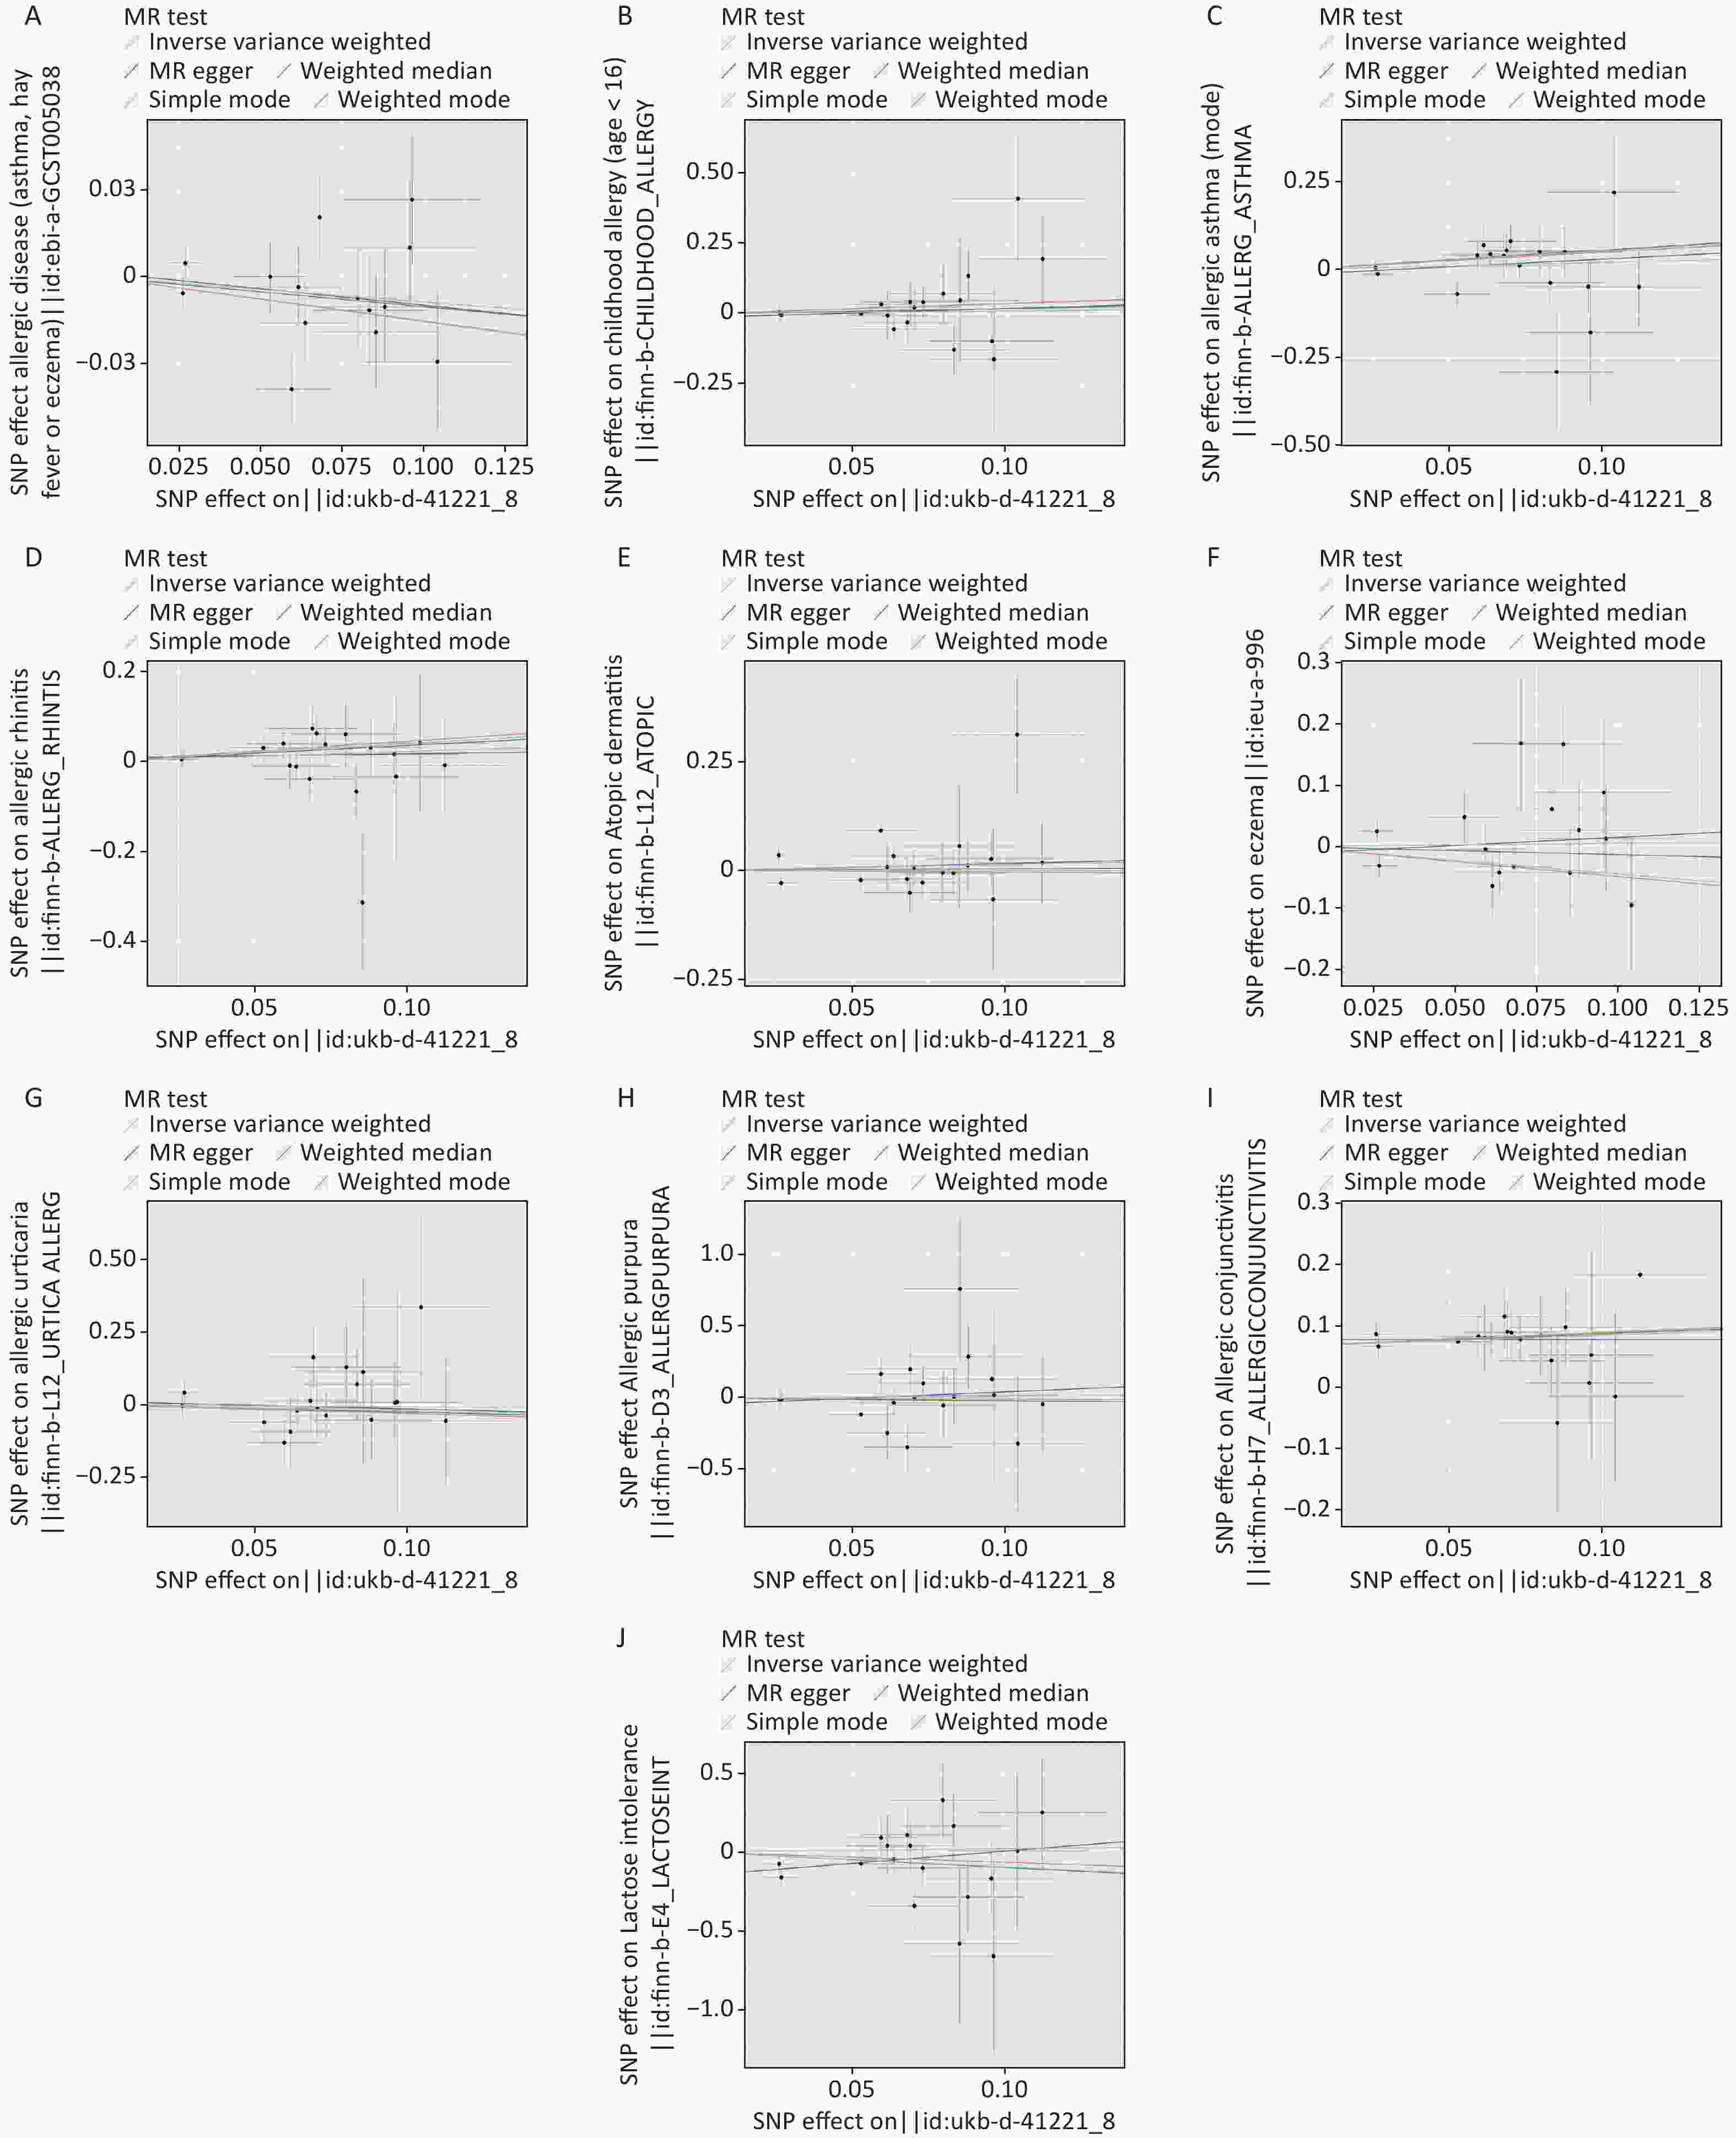
Figure S1. Scatter plot of MR analysis. (A) allergic disease. (B) childhood allergy (age < 16). (C) allergic asthma. (D) allergic rhinitis. (E) atopic dermatitis. (F) eczema. (G) allergic urticaria. (H) allergic purpura. (I) allergic conjunctivitis. (J) lactose intolerance. MR: mendelian randomization.
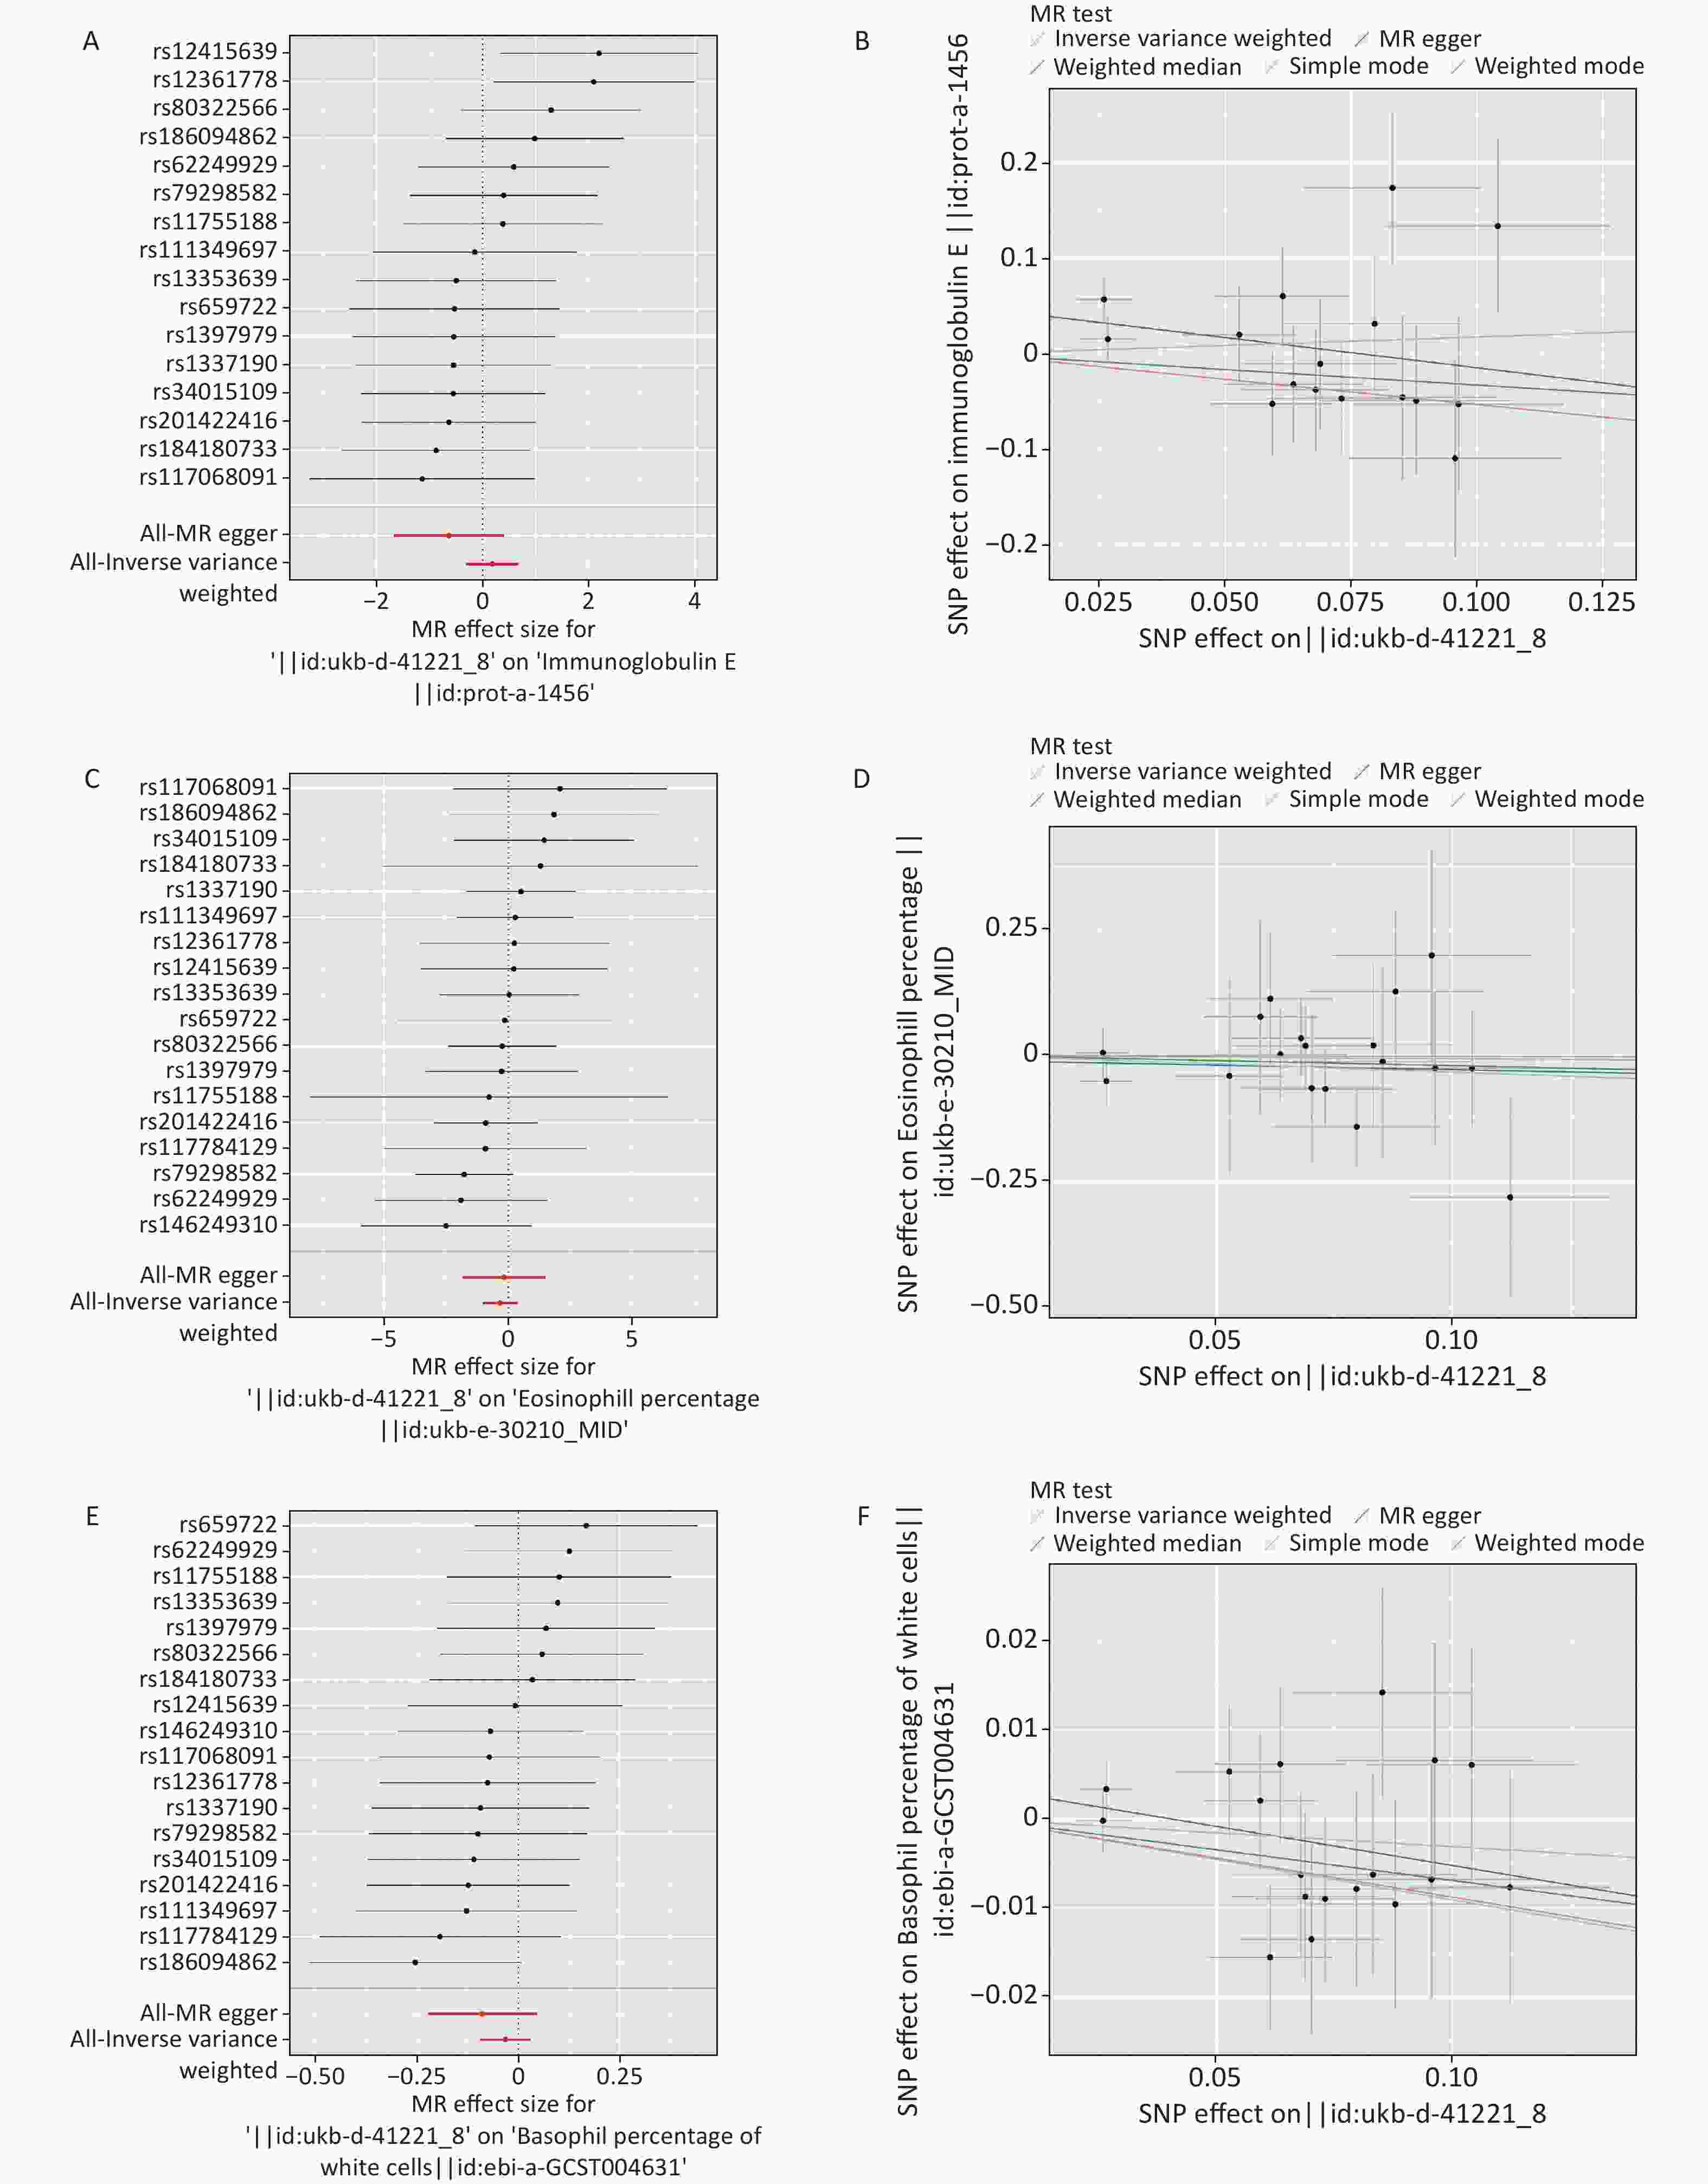
Figure S2. Forest diagram and scatter plot of MR analysis. (A–B) Ig E. (C–D) eosinophil percentage. (E–F) basophil percentage. MR: mendelian randomization; Ig E: Immunoglobulin E.
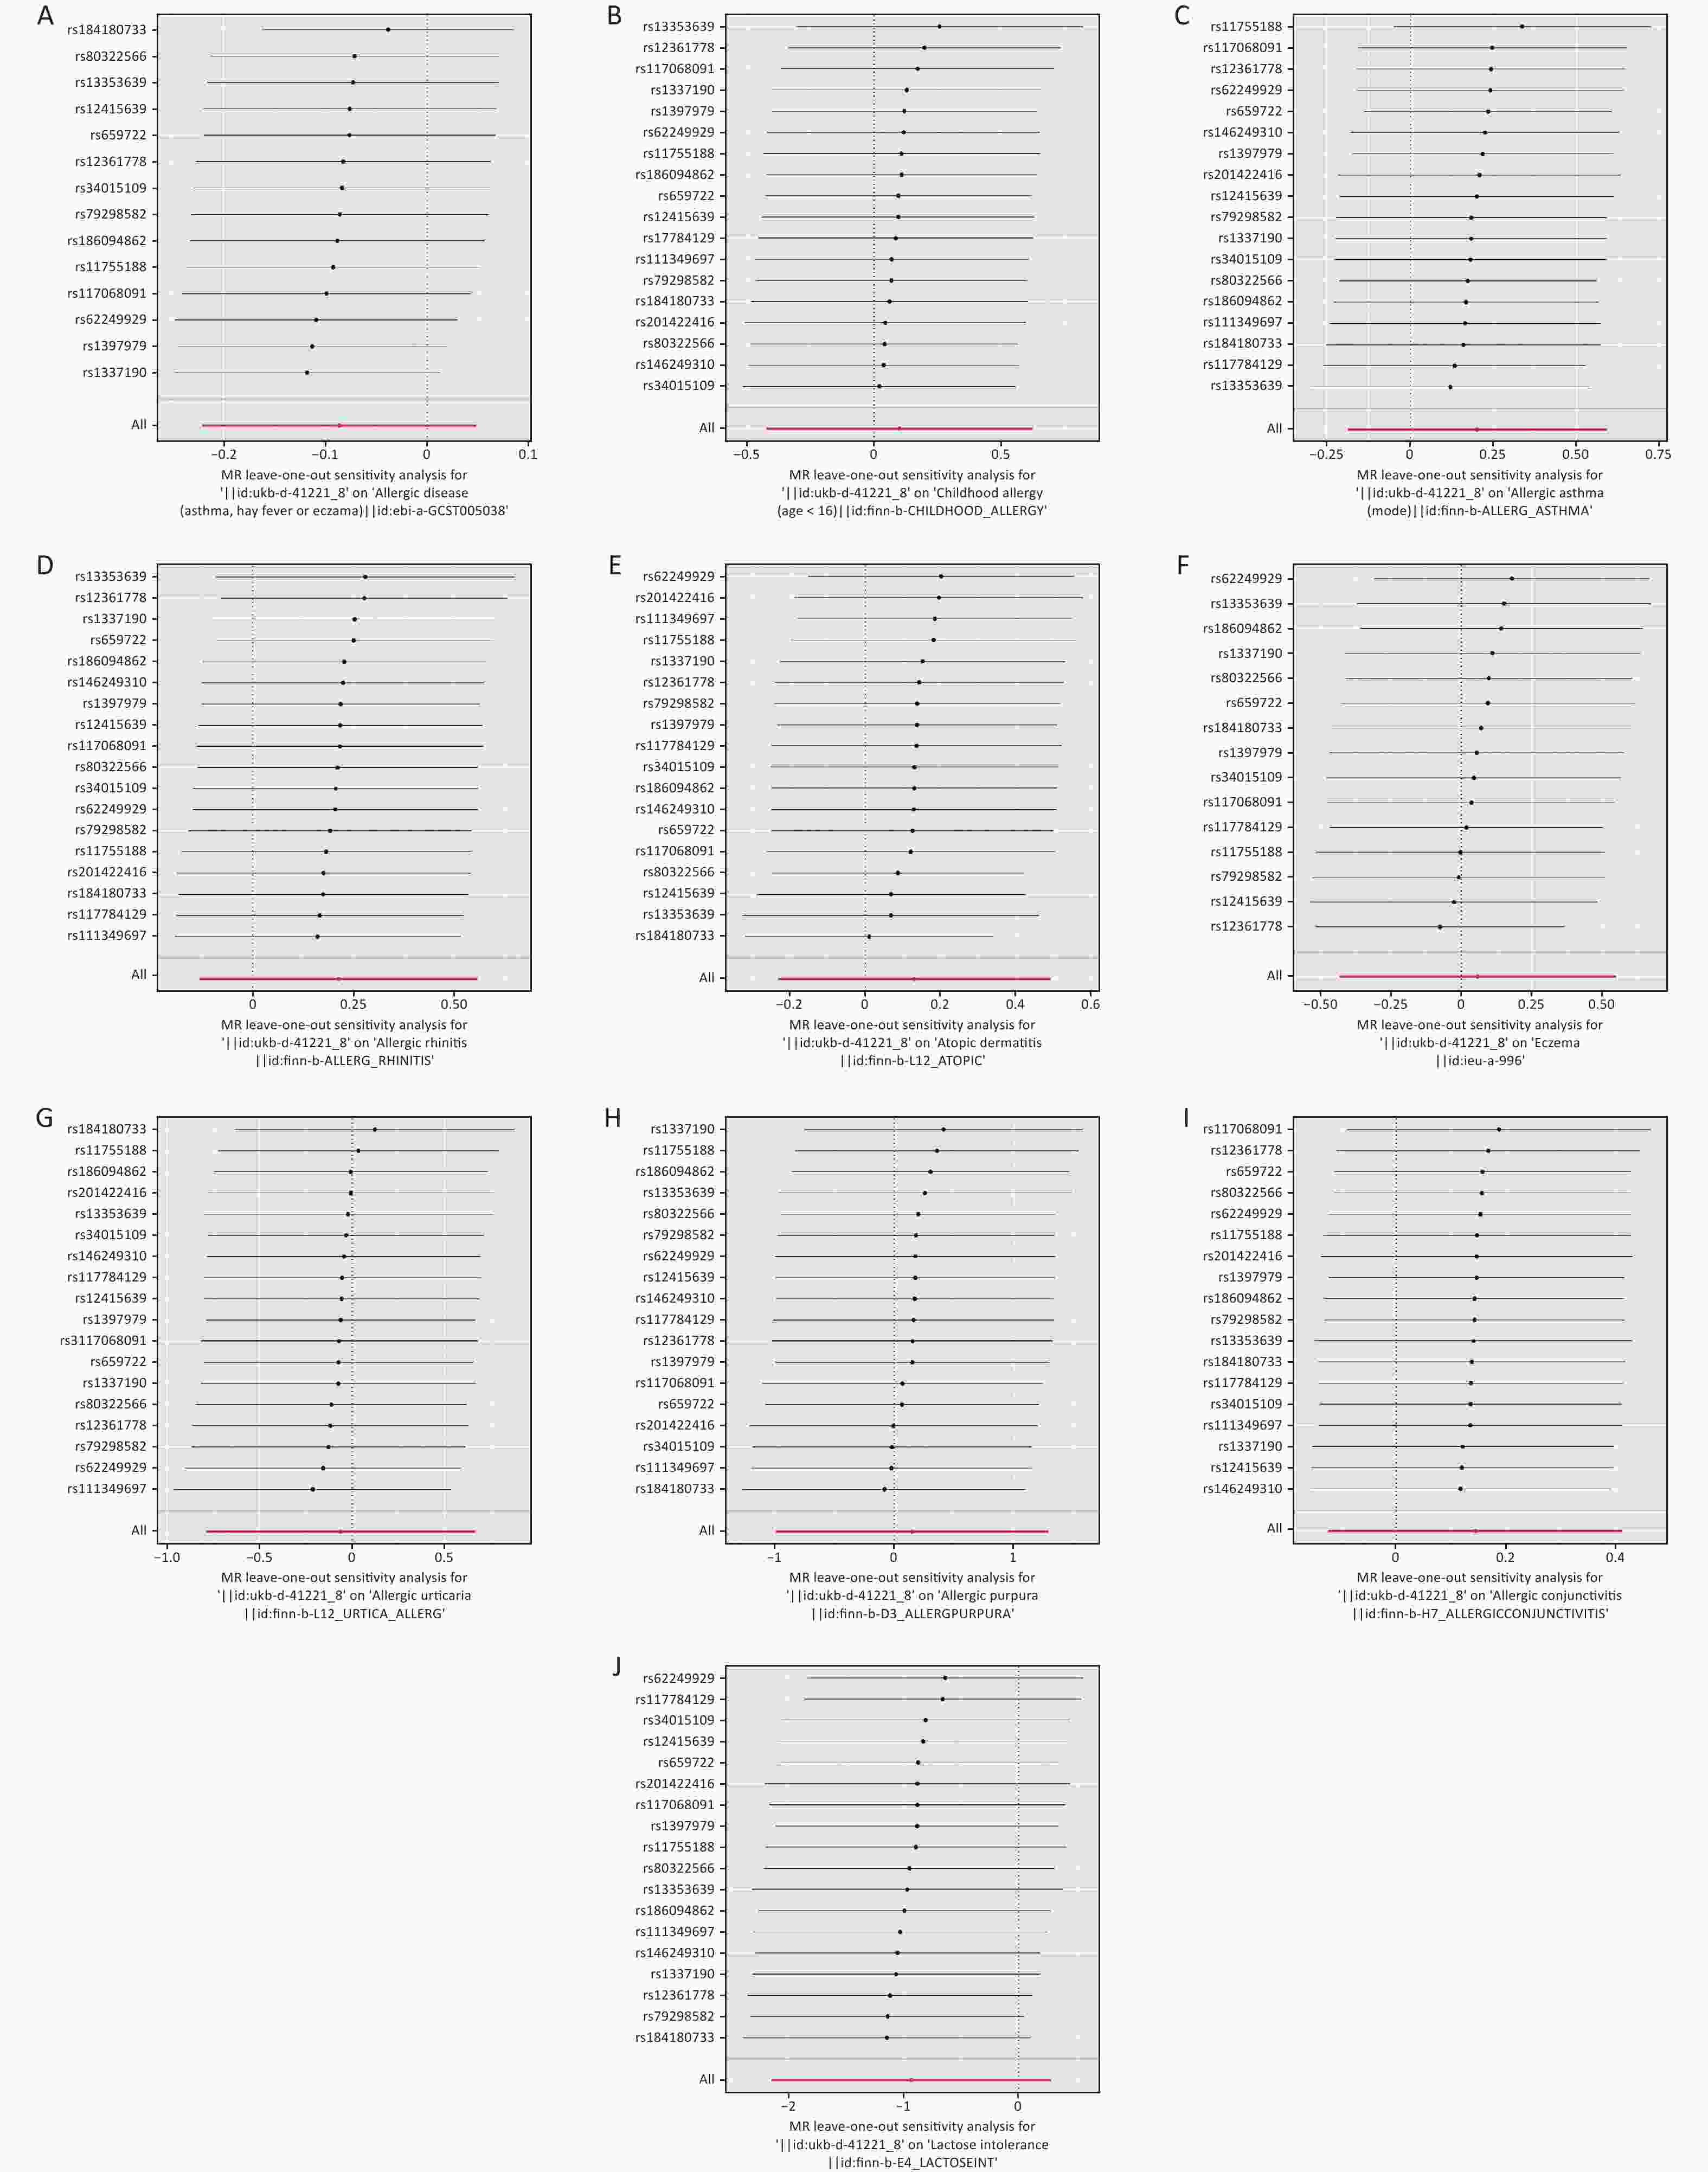
Figure S3. The leave-one-out sensitivity analysis. (A) allergic disease. (B) childhood allergy (age < 16). (C) allergic asthma. (D) allergic rhinitis. (E) atopic dermatitis. (F) eczema. (G) allergic urticaria. (H) allergic purpura. (I) allergic conjunctivitis. (J) lactose intolerance.
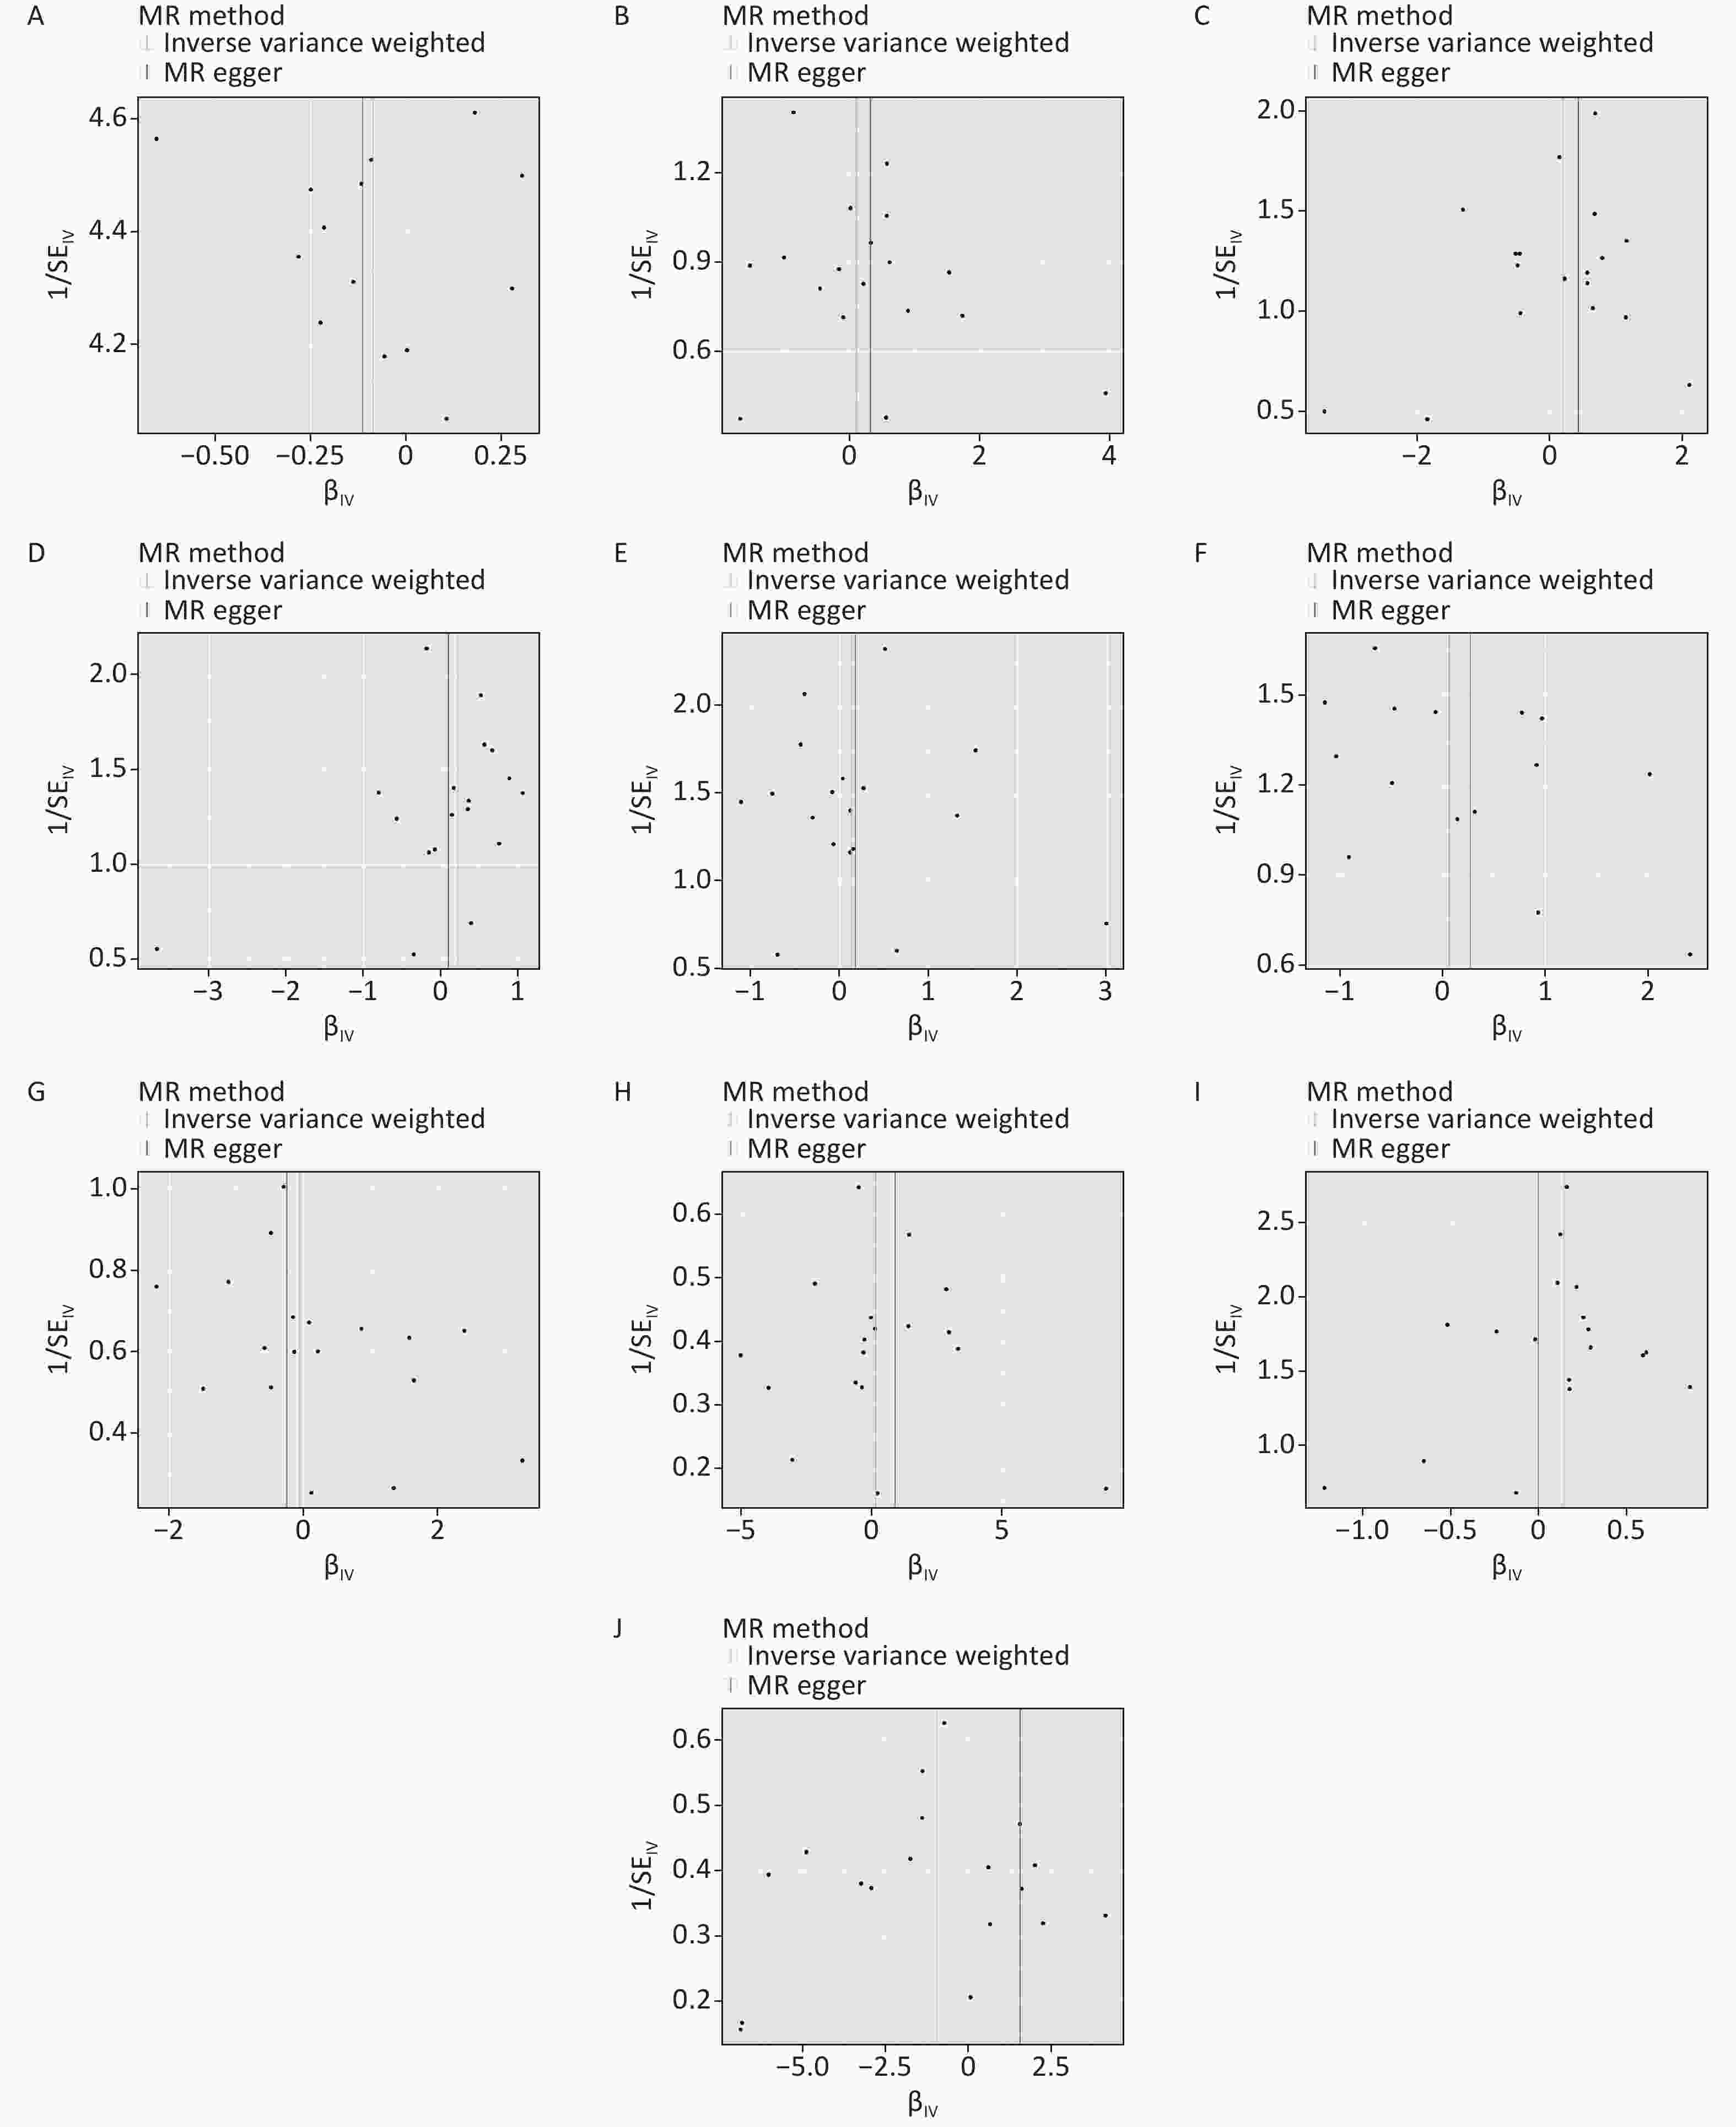
Figure S4. Funnel diagram of MR analysis. (A) allergic disease. (B) childhood allergy (age < 16). (C) allergic asthma. (D) allergic rhinitis. (E) atopic dermatitis. (F) eczema. (G) allergic urticaria. (H) allergic purpura. (I) allergic conjunctivitis. (J) lactose intolerance. MR: mendelian randomization.
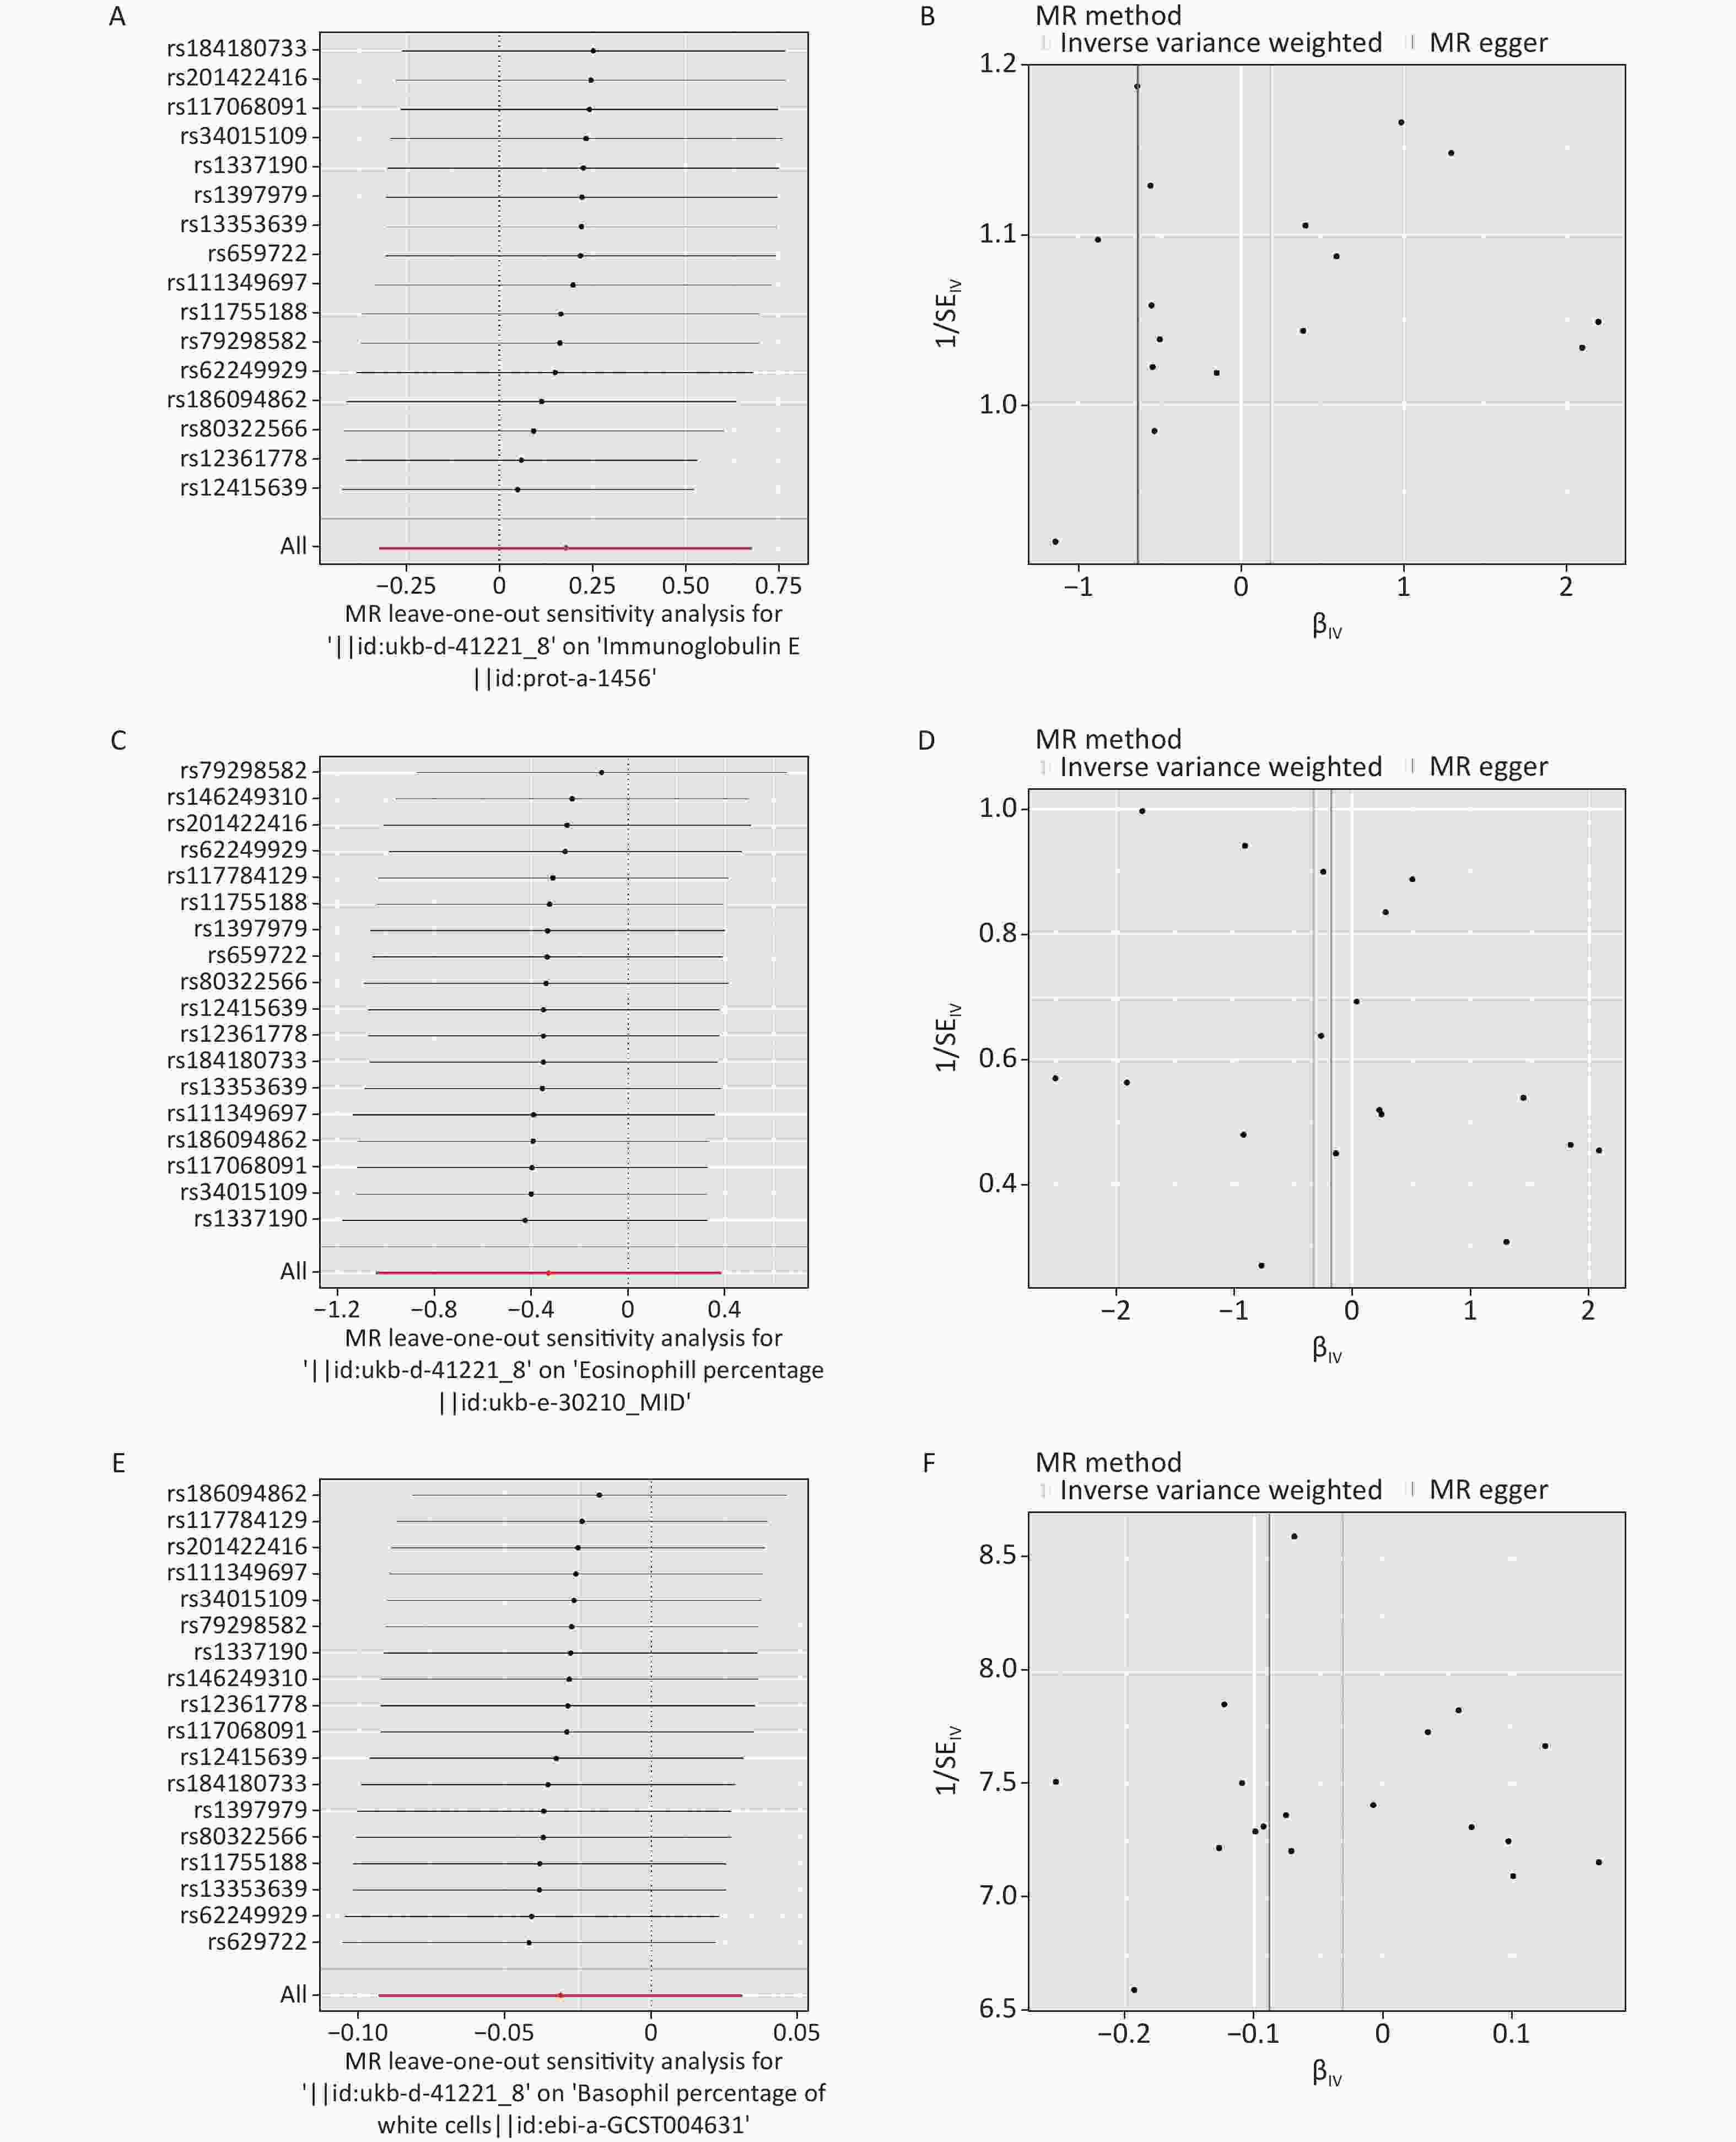
Figure S5. The leave-one-out sensitivity analysis and funnel diagram of MR analysis. (A–B) Ig E. (C–D) eosinophil percentage. (E–F) basophil percentage. MR: mendelian randomization; Ig E: Immunoglobulin E.
Subject Year Population Author GWAS ID Sample size n case n control n SNP Exposed subject Emergency caesarean section 2018 European Neale lab ukb-d-41221_8 8,019 1,158 6,861 9,538,969 Outcome subjects Allergic disease 2017 European Ferreira MA ebi-a-GCST005038 360,838 180,129 180,709 8,133,670 Childhood allergy
(age < 16)2021 European − finn-b-CHILDHOOD_ALLERGY 218,792 2,748 216,044 16,380,466 Allergic asthma 2021 European − finn-b-ALLERG_ASTHMA 140,308 4,859 135,449 16,379,987 Allergic rhinitis 2021 European − finn-b-ALLERG_RHINITIS 217,914 5,527 212,387 16,380,461 Atopic dermatitis 2021 European − finn-b-L12_ATOPIC 205,764 7,024 198,740 16,380,443 Eczema 2014 European Paternoster ieu-a-996 40,835 10,788 30,047 11,059,641 Allergic urticaria 2021 European − finn-b-L12_URTICA_ALLERG 213,633 1,169 212,464 16,380,463 Allergic purpura 2021 European − finn-b-D3_ALLERGPURPURA 216,569 470 216,099 16,380,461 Allergic conjunctivitis 2021 European − finn-b-H7_ALLERGICCONJUNCTIVITIS 218,792 9,833 208,959 16,380,466 Lactose intolerance 2021 European − finn-b-E4_LACTOSEINT 197,704 445 197,259 16,380,377 Immunoglobulin E 2018 European Sun BB prot-a-1456 3,301 − − 10,534,735 Eosinophill percentage 2020 Greater Middle Eastern Pan-UKB team ukb-e-30210_MID 1,546 1,546 − 11,885,437 Basophil percentage 2016 European Astle WJ ebi-a-GCST004631 171,996 − − 29,167,217 Table S1. Baseline information table for exposed subject and outcome subjects
Exposed object SNP Beta SE EA NEA EAF F Emergency caesarean section rs1337190 −0.068 0.015 T G 0.037 21 Emergency caesarean section rs62249929 −0.027 0.006 T G 0.552 23 Emergency caesarean section rs1397979 0.096 0.021 T C 0.018 21 Emergency caesarean section rs13353639 0.064 0.014 G A 0.040 20 Emergency caesarean section rs80322566 0.104 0.022 T C 0.017 22 Emergency caesarean section rs79298582 0.080 0.018 T C 0.024 20 Emergency caesarean section rs111349697 0.069 0.015 A G 0.035 20 Emergency caesarean section rs117784129 0.070 0.015 C T 0.037 22 Emergency caesarean section rs11755188 −0.053 0.011 T C 0.065 22 Emergency caesarean section rs184180733 −0.059 0.012 A G 0.055 24 Emergency caesarean section rs117068091 0.096 0.021 T C 0.019 20 Emergency caesarean section rs146249310 0.112 0.021 A G 0.020 28 Emergency caesarean section rs12415639 −0.026 0.006 C T 0.417 22 Emergency caesarean section rs201422416 0.073 0.015 A C 0.039 25 Emergency caesarean section rs12361778 0.083 0.018 A C 0.024 22 Emergency caesarean section rs659722 0.085 0.019 G C 0.022 20 Emergency caesarean section rs186094862 0.061 0.013 T C 0.054 21 Emergency caesarean section rs34015109 0.088 0.019 G A 0.022 22 Note. SNP: single nucleotide polymorphism; SE: standard error; EA: effect allele; NEA: non-effect allele; EAF: effect allele frequency. Table S2. Screening results of single nucleotide polymorphism
Outcome Heterogeneity Pleiotropy Q P Intercept p Allergic disease 16 0.224 0.002 0.841 Childhood allergy (age <16) 13 0.735 −0.013 0.717 Allergic asthma 19 0.346 −0.014 0.605 Allergic rhinitis 13 0.762 0.007 0.751 Atopic dermatitis 22 0.174 −0.003 0.905 Eczema 21 0.099 −0.011 0.684 Allergic urticaria 10 0.888 0.012 0.815 Allergic purpura 15 0.571 −0.045 0.565 Allergic conjunctivitis 6 0.995 0.009 0.632 Lactose intolerance 18 0.360 −0.150 0.073 Immunoglobulin E 18 0.268 0.049 0.108 Eosinophill percentage 9 0.933 −0.010 0.848 Basophil percentage 13 0.768 0.004 0.363 Table S3. Sensitivity analysis
HTML
 23166+Supplementary Materials.pdf
|

|

 Quick Links
 DownLoad:


