


-
Varicella, commonly known as chickenpox, arises from primary infection with the varicella-zoster virus (VZV)[1]. Although chickenpox is typically mild in children, it can lead to severe complications such as central nervous system involvement, pneumonia, secondary bacterial infections, and the development of severe encephalitis. In some cases, these complications can be fatal outcomes[1-3]. Following the initial infection, VZV enters a latent state within neuronal cells, potentially reactivating after years, leading to herpes zoster (HZ) and profoundly impacting the quality of life of affected individuals[4,5]. The World Health Organization reports a substantial global burden of chickenpox cases, with approximately 63% of pediatric infections resulting in neurological conditions, including seizures and developmental delays[6].
Chickenpox outbreaks are prevalent in specific geographical regions or communities, particularly where susceptible individuals aggregate[7,8]. Epidemiological variation in chickenpox is associated with factors such as population density, climatic conditions affecting VZV transmissibility, and socioeconomic factors[9-11]. Socioeconomic factors such as income level, employment opportunities, and living conditions, significantly influence susceptibility to VZV exposure and access to healthcare services[12-14].
Healthcare infrastructure, which encompasses vaccination coverage, quality of healthcare facilities, and disease surveillance systems, is important in controlling chickenpox outbreaks[15,16]. Vaccination has demonstrated efficacy in reducing the incidence and transmission rates, particularly in regions with well-established healthcare standards[17].
Furthermore, education plays an important role in shaping public awareness, undertaking preventive measures, and promoting healthcare-seeking behaviors. Higher levels of education were correlated with heightened awareness, promoting preventive measures, and adhering to vaccination protocols[18,19].
Rapid urbanization in developing countries contributes to population concentrations, with limited data on chickenpox outbreaks in these regions[20]. Southern China, comprising Yunnan, Guangdong, Hainan, Fujian, and Guangxi, has varying socioeconomic and environmental characteristics, and provides a diverse study area. Furthermore, this region is situated in the humid subtropical and tropical monsoon climate zones, with an average annual rainfall exceeding 800 mm and an average annual temperature of over 16 °C. The warm and humid climatic characteristics prevalent in these areas can increase the risk of exposure to diseases and may affect the inactivation of chickenpox virus[10]. Regarding the socioeconomic environment, this region encompasses both highly developed and relatively underdeveloped subregions in China; this provides insights into the situation faced by many developing countries. Therefore, focusing on South China as a study area could provide valuable references for the prevention and treatment of chickenpox and other infectious diseases in developing countries.
This study examines the relationship between spatial clustering, heterogeneity of chickenpox outbreaks, and socioeconomic factors in Southern China, and aims to elucidate the influence of socioeconomic factors, particularly medical infrastructure, educational attainment, and population density, on disease dynamics. The findings will contribute to evidence-based public health strategies, especially in developing countries, to help mitigate the impact of chickenpox outbreaks and enhance the overall population health and well-being.
-
This study area was South China, with counties serving as the fundamental units for analysis. The dataset covering chickenpox outbreaks from 2006 to 2021 in the Southern China region was systematically collected from the Public Health Emergency Event Reporting Information System of the Chinese Center for Disease Control and Prevention.
Following established reporting protocols, occurrences of over ten chickenpox cases manifested within the same facilities, such as kindergartens or schools, within a single week were promptly reported and documented by the reporting system[21]. The dataset comprised comprehensive information on the reporting locality, temporal occurrence of events, and the recorded number of reported cases associated with each outbreak.
A recent study reported that individuals < 20 years were at the highest risk of contracting chickenpox[22]. Therefore, to account for college students who constitute a significant proportion of cases and align with the age segmentation of the Seventh National Population Census, this study considered the population < 24 years as the susceptible population.
The chickenpox outbreak risk, as described here, was characterized by the ratio of reported cases of chickenpox outbreaks to the population aged < 24 years within each region. The numerator denotes the reported cases during chickenpox outbreaks, whereas the denominator represents the population aged < 24 years within that specific region. Socioeconomic factors are outlined in Table 1 with statistical information for the analysis.
Category Potential factors Min P25 P50 P75 Max Status of vaccination Per capita gross domestic product (GDP; yuan) 3,487.66 33,935.50 47,270.50 82,637.74 658,554.70 Percentage of educated population (%) 0.03 2.59 3.48 5.01 100 Social economy Urbanization rate (%) 15.08 42.63 60.33 99.84 100 Hospital beds of 1,000 people 0.23 4.04 5.18 6.23 76.68 Road density (km/km2) 0.02 0.53 0.91 1.34 9.84 Living environment Per capita residential building area (m3) 17.75 35.5475 42.885 50.145 98.87 Percentage of rental housing (%) 0.48 4.96 8.03 15.18 88.98 Percentage of households with toilets (%) 6.18 8.83 9.18 9.53 11.12 Demographics Population density (number of people/
100 m2)7.50 111.61 200.97 539.99 41,346.24 Proportion of the population under 24 years of age (%) 0.89 27.88 30.79 34.65 63.27 Percentage of floating population (%) 0.00 10.13 18.82 32.94 209.27 Table 1. Statistical information for socioeconomic factors
This study examined the impact of socioeconomic factors on the susceptibility to chickenpox outbreaks, specifically focusing on two pivotal variables: the incidence rate of outbreak cases and the exposed population. Socioeconomic factors include population size, educational attainment, healthcare infrastructure, and economic development. These variables were operationalized using a range of proxy measures, including population density, proportion of the population < 24 years, per capita residential building area, road density, percentage of rental housing, percentage of households equipped with toilets, per capita gross domestic product (GDP), number of hospital beds per thousand people, urbanization rate, percentage of education expenditure, and percentage of floating population. Notably, the socioeconomic data employed in this study originated from the Statistical Yearbooks of various counties and cities within the southern region of China, specifically for 2020. The chickenpox vaccine falls within the range of voluntary vaccination. Vaccine production establishments or disease prevention and control institutions at the county level are mandated to deliver the vaccine to grassroots-level vaccination units after purchase. Direct vaccination information is transmitted through the National Immunization Program Information Management System (NIPIS) to the national centers for disease control and prevention reporting. However, owing to constraints related to data security and permissions, these data were unavailable. In response to the absence of chickenpox vaccine data, we utilized regional socioeconomic and educational levels as indirect proxies to measure vaccination status[23,24], thereby bolstering the reliability of the findings.
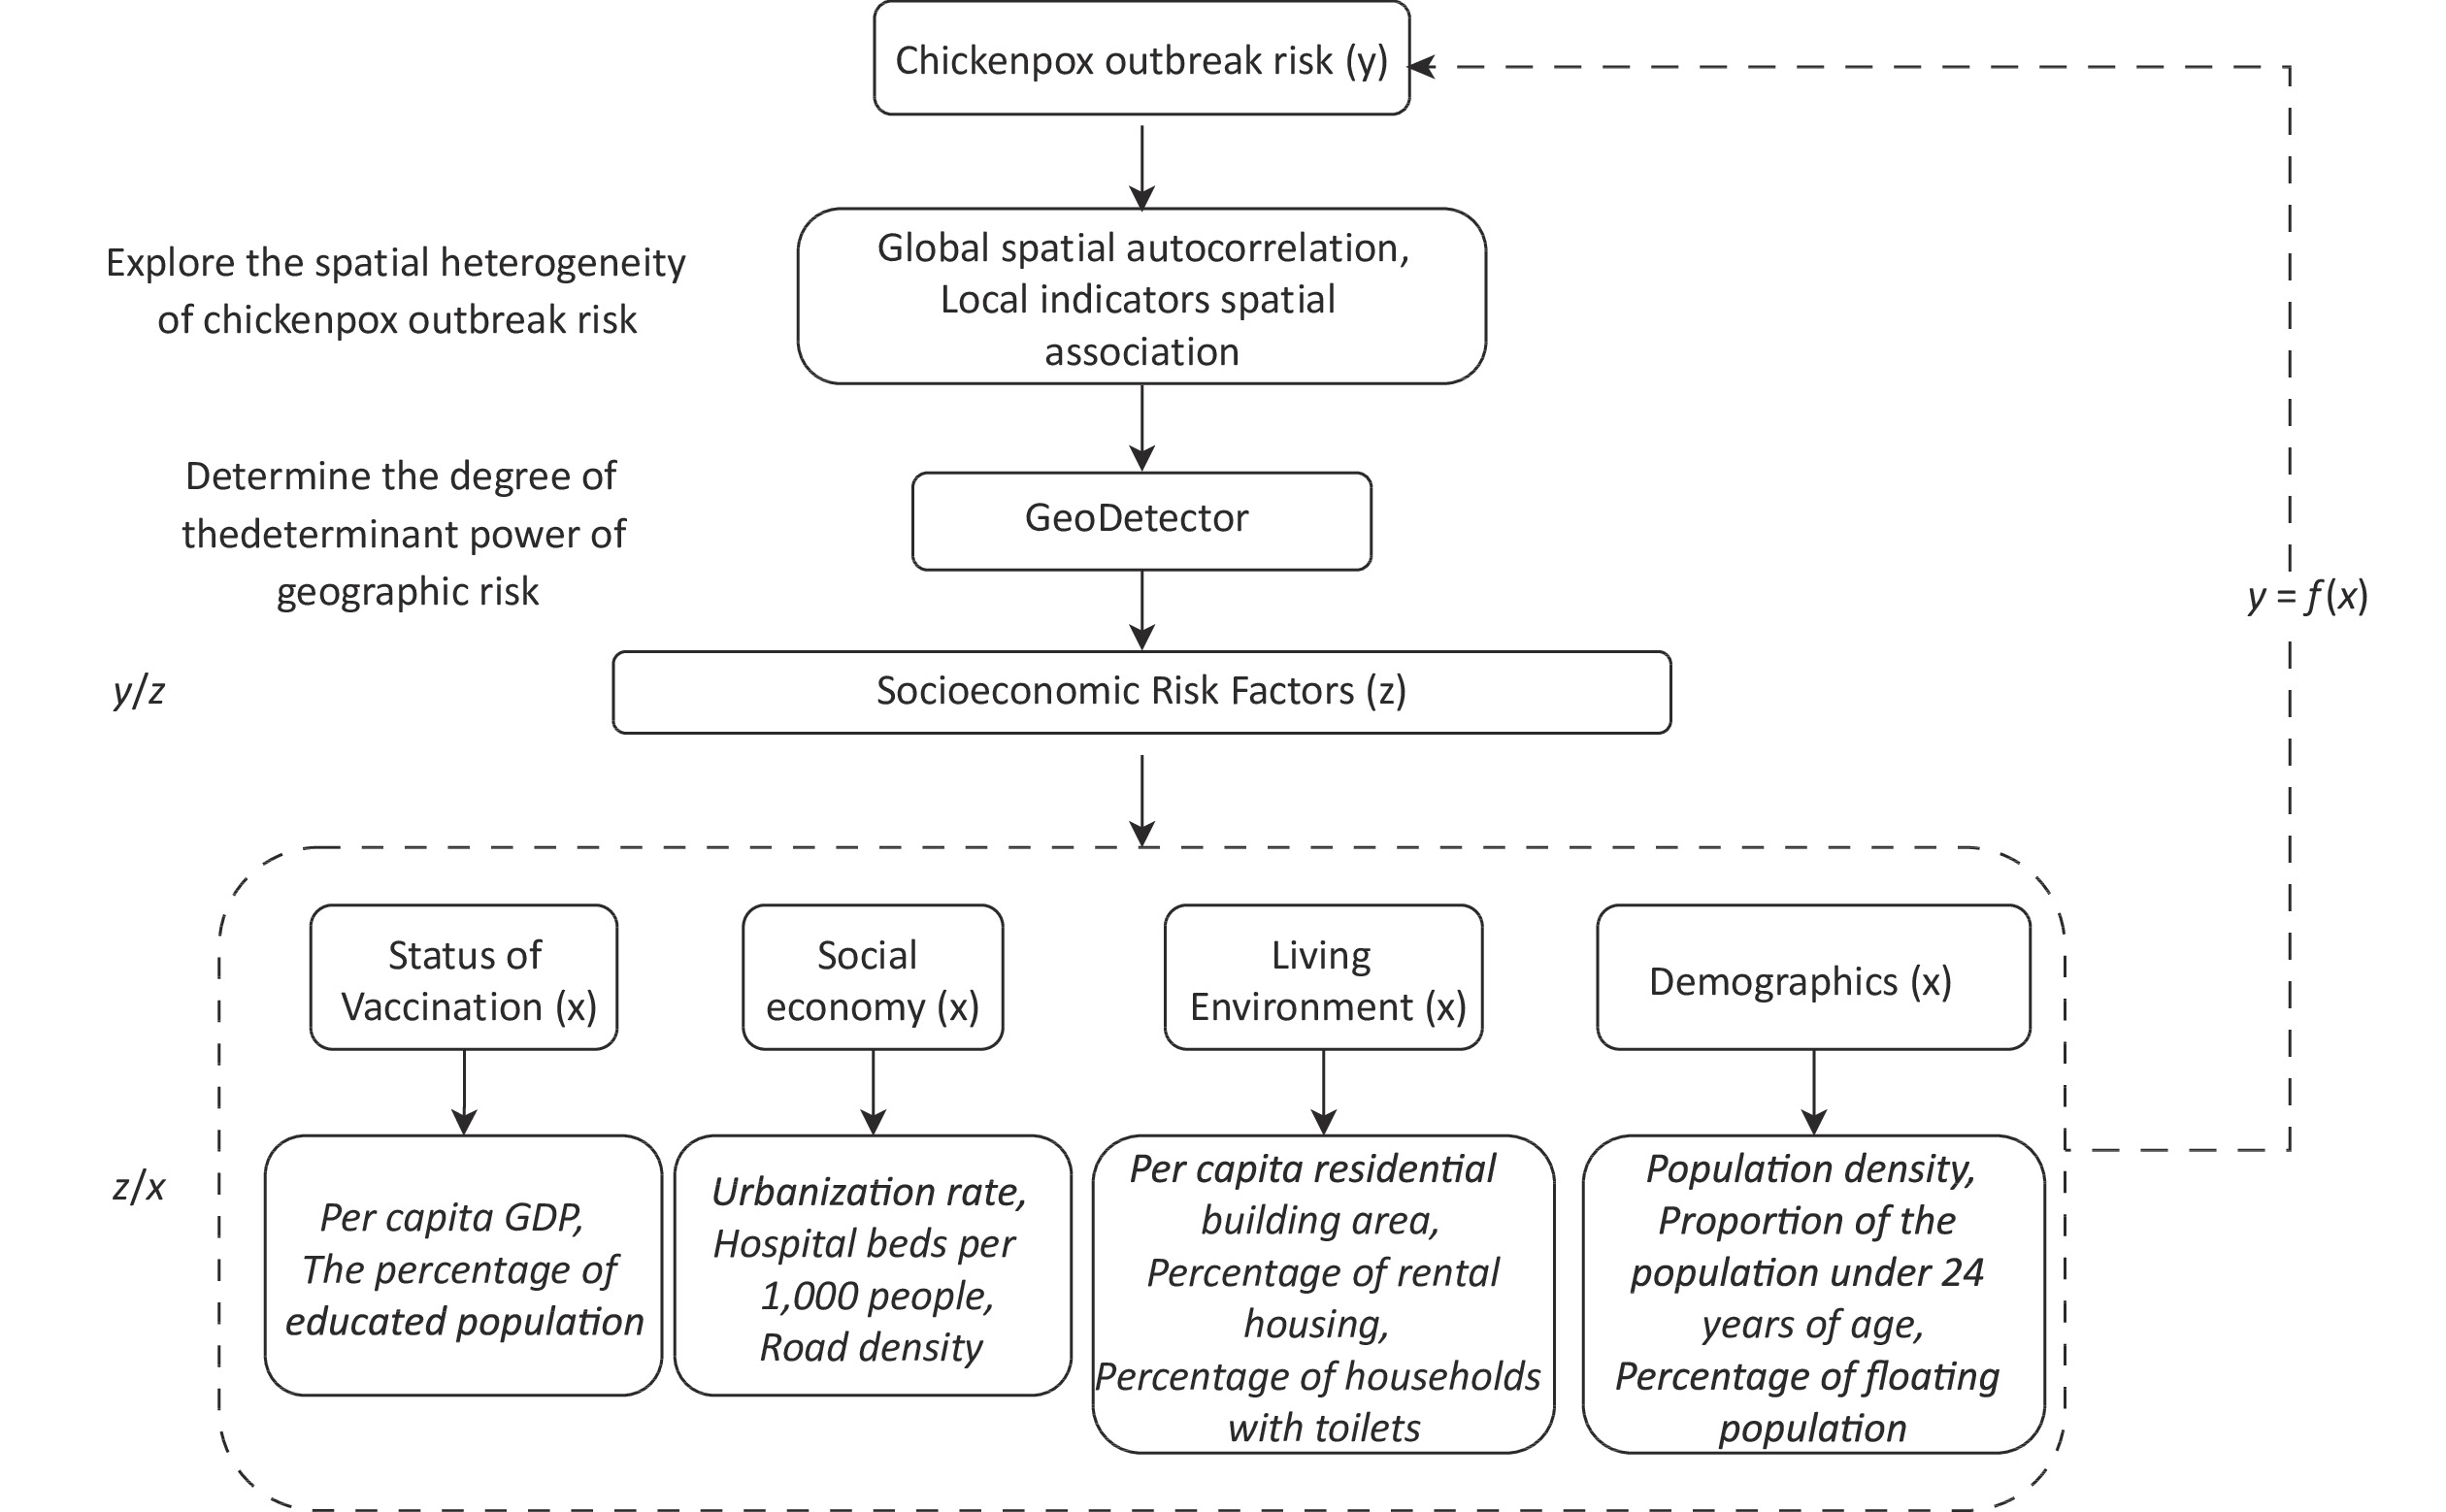
The occurrence of chickenpox outbreaks and all the potential socioeconomic variables were computed at the county level. Figure 1 shows the correlation between chickenpox outbreaks and their proxy variables.
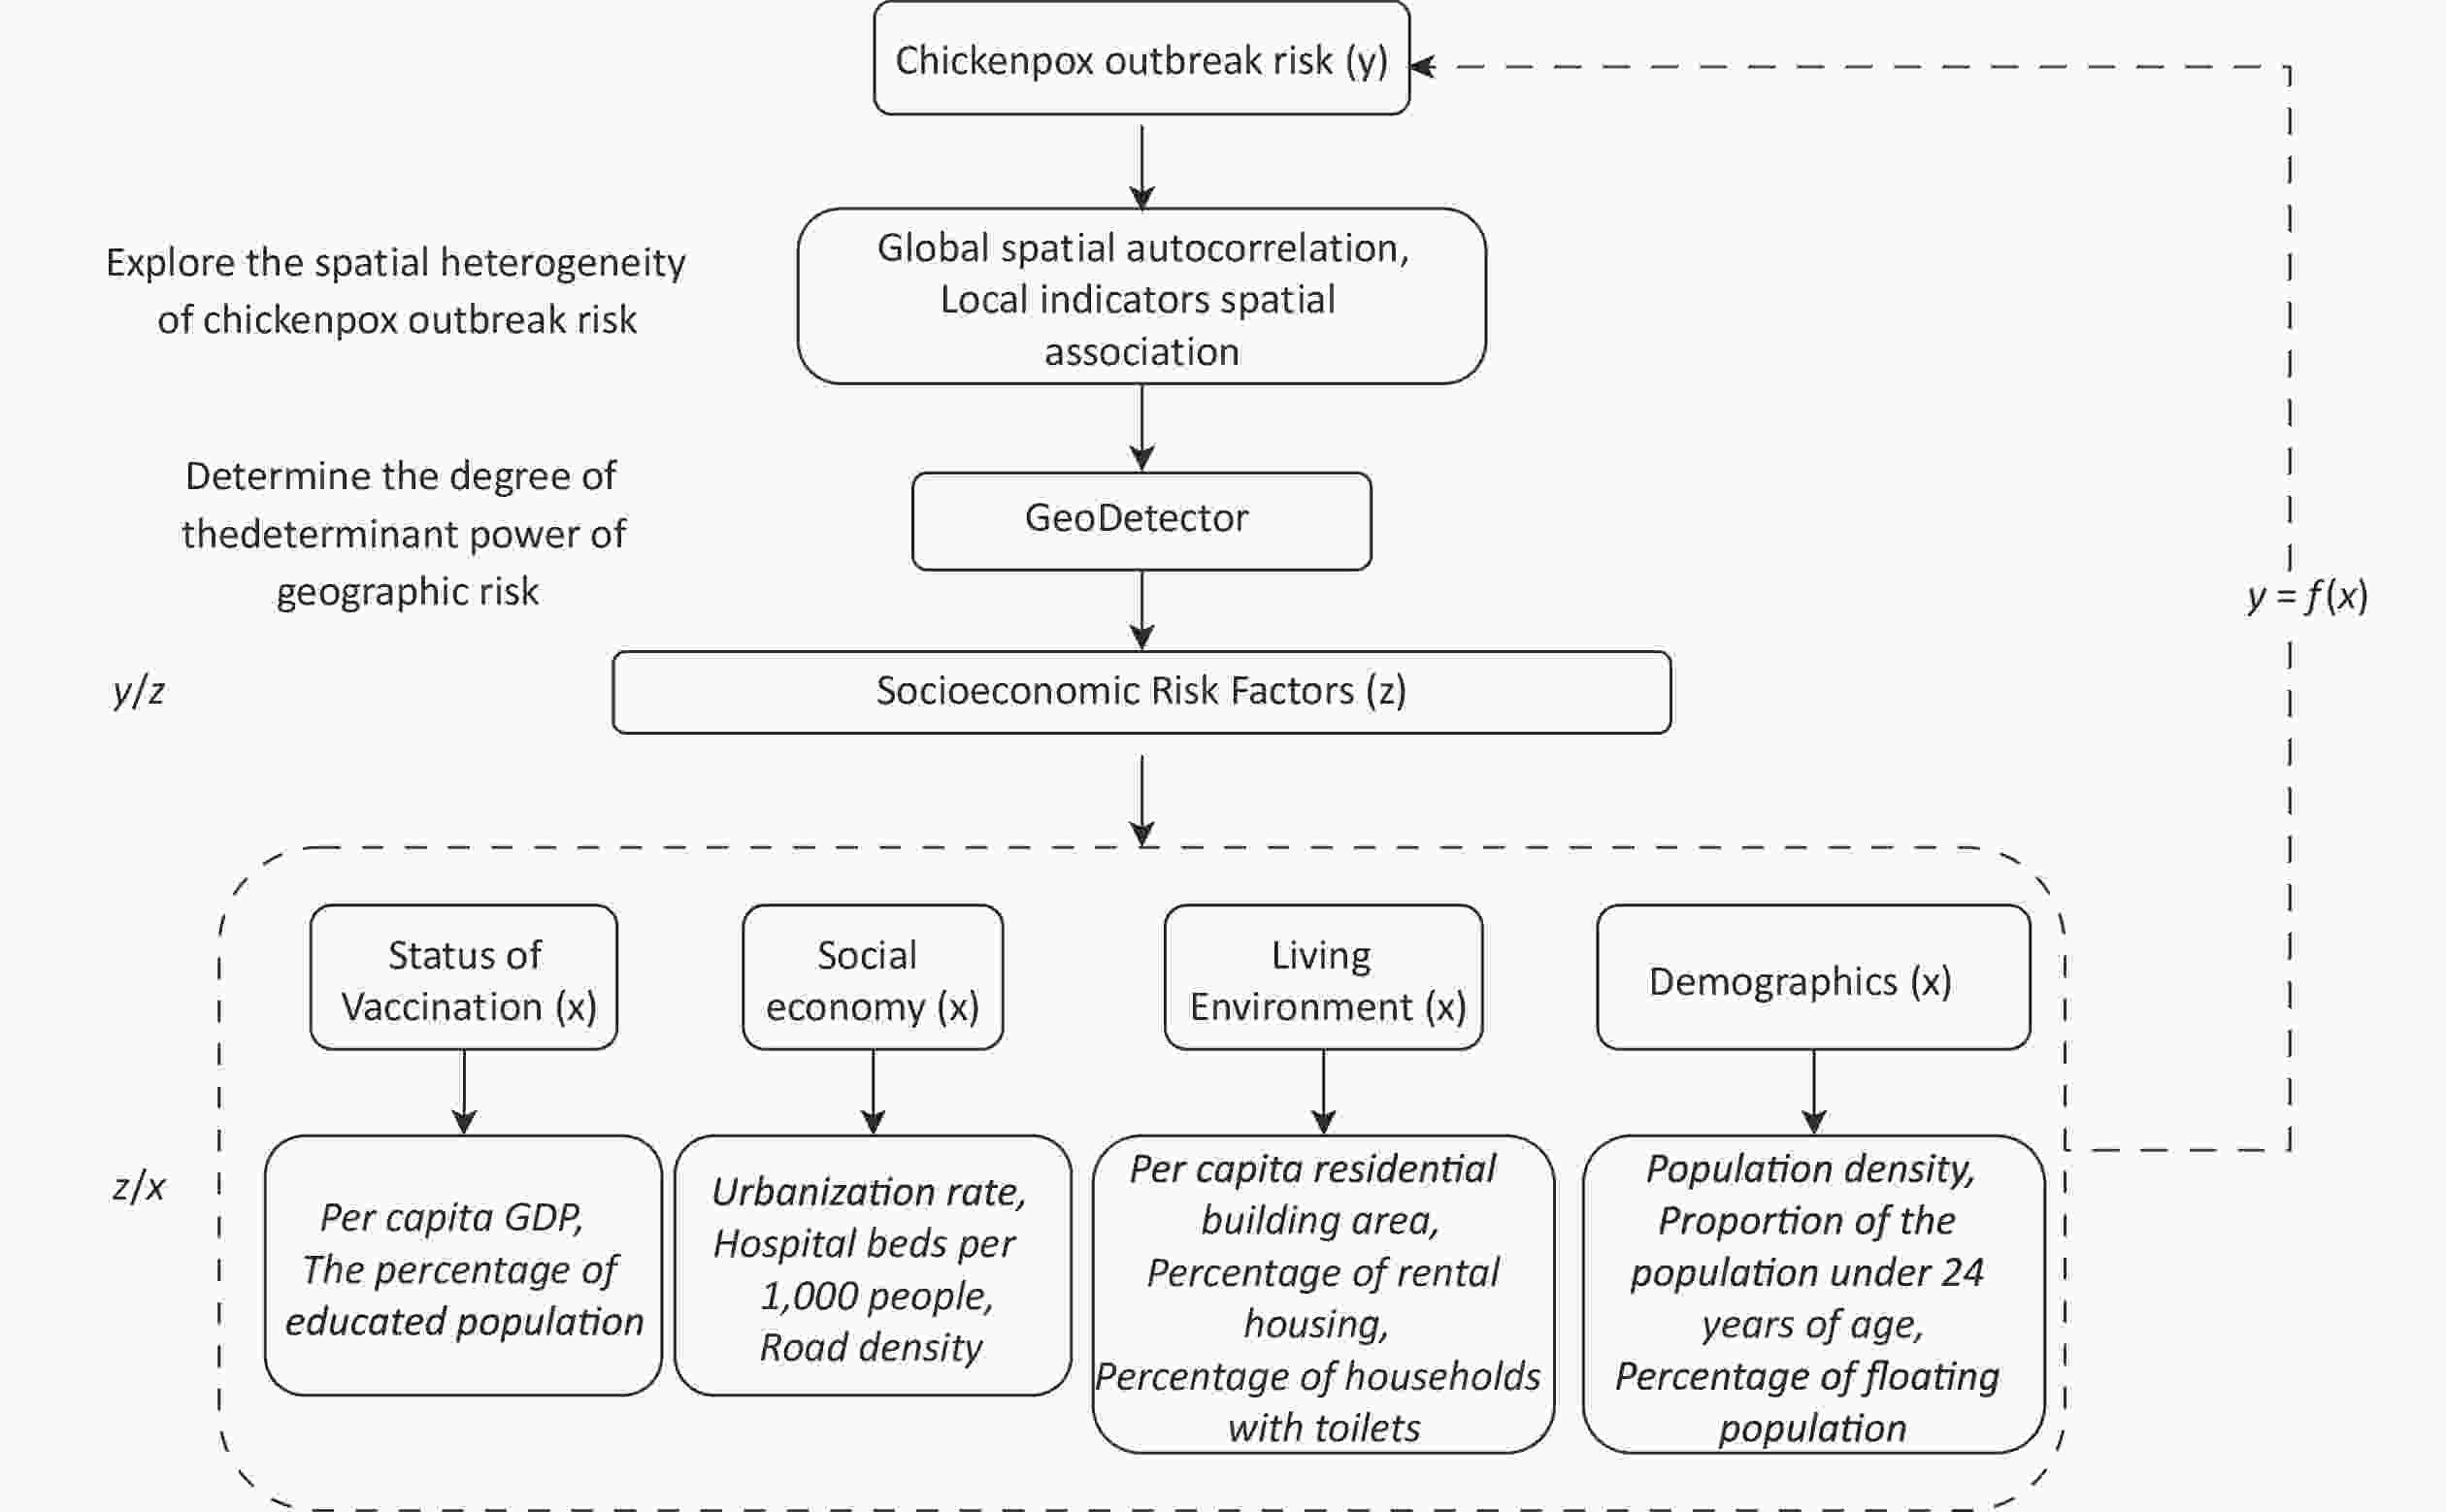
Figure 1. The relationship between the chickenpox outbreaks and their proxy variables. z represents direct variables, and x characterizes indirect variables.
-
Moran’s I reflect the similarity between spatially adjacent or adjacent regional unit attribute values[25]. This study explored the global spatial autocorrelation of the chickenpox outbreaks chickenpox outbreaks in Southern China using Moran’s I index. The formula used is as follows:
$$ I=\frac{\displaystyle\sum\nolimits _{i=1}^{n}\displaystyle\sum\nolimits _{j\ne 1}^{n}{w}_{ij}\left({x}_{i}-\bar{x}\right)\left({x}_{j}-\bar{x}\right)}{{S}^{2}\displaystyle\sum\nolimits _{i=1}^{n}\displaystyle\sum\nolimits _{j\ne 1}^{n}{w}_{ij}} $$ $$ {S}^{2}={\sum }_{i=1}^{n}{\left({x}_{i}-\bar{x}\right)}^{2} $$ $$ Z=\frac{I-E\left(I\right)}{\sqrt{VAR\left(I\right)}} $$ Where: i = 1, …, n; j = 1, …, n; i $ \ne j;{x}_{i} $ and $ {x}_{j} $ are the values of the chickenpox outbreaks at position i and position j respectively; $ \bar{x} $ is the mean of the chickenpox outbreaks; $ {S}^{2} $ is the variance; $ {w}_{ij} $ is the spatial weight matrix of the chickenpox outbreaks.
-
Local Indicators of Spatial Association (LISA) is a fundamental tool in epidemiology used to discern spatial clusters and evaluate the spatial homogeneity of diseases relative to geographical location[26-28]. Here, the LISA method was used to ascertain the spatial clustering characteristics of chickenpox outbreak risk, facilitating the identification of areas exhibiting statistically significant clustering of high or low values, thereby indicating regions with analogous or dissimilar attributes compared with neighboring areas. The objective was to pinpoint “hotspots” and “cold spots” of chickenpox outbreak risk, by using LISA.
LISA is measured using the following formula:
$$ {I}_{i}=\frac{({p}_{i}-\overline{P}){\displaystyle\sum\nolimits }_{j=1}^{n}{w}_{ij}({p}_{j}-\overline{P})}{{{S}_{i}}^{2}} $$ where, n represents the number of statistical units (counties); pi and pj represent the chickenpox outbreak risk of the i and j statistical units, respectively; $ \overline P $ represents the mean outbreak risk; and w represents the spatial connectivity matrix. Furthermore, Si2 was measured using:
$$ {{S}_{i}}^{2}=\frac{{\displaystyle\sum\nolimits }_{j=1,j\ne i}^{n}({p}_{j}-\overline{P}{)}^{2}}{n-1}-{\overline{P}}^{2} $$ When $ {I_i} $ > 0, there is a positive correlation, indicating spatial clustering. When $ {I_i} $ was less than 0, a negative correlation was observed. When $ {I_i} $ = 0, the phenomenon exhibits a random spatial distribution.
In the LISA calculation results, high-high (HH) indicates a clustering pattern of high values, wherein areas with high values are surrounded by other areas with high values, indicating concentrated hotspots. Low-low (LL) signifies a clustering pattern of low values where areas with low values are surrounded by other areas with low values, denoting concentrated cold spots. High-low (HL) indicates a clustering pattern of high values surrounded by low values, representing dispersed hotspots. Low-high (LH) indicates a clustering pattern of low values encompassed by high values, indicative of dispersed cold spots.
To assess the statistical significance of the Local Moran’s I value, a permutation test was conducted by iteratively shuffling the values across the study areas. This iterative process generated a distribution of Moran’s I value under the null hypothesis of no spatial autocorrelation, enabling us to determine whether the observed clustering patterns were statistically significant.
-
Geodetector q statistics can detect spatial variations and unveil the underlying driving forces[29,30], making them extensively utilized in the field of public health. This method enables researchers to efficiently understand and analyze the associations between environmental factors and disease prevalence, thereby providing insights into the relationship between environment and human health outcomes[11,31,32].
Here, we used the Geodetector q statistic to analyze the underlying factors influencing chickenpox outbreak risk in southern China. The fundamental principle of the Geodetector q statistic relies on the observation that if two variables exhibit congruent spatial distributions, a statistical association between them can be inferred.
The formula for the q statistic is:
$$ q=1-\frac{SSW}{SST}=1-\frac{{\displaystyle\sum\nolimits }_{h=1}^{L}{N}_{h}{{\sigma }_{h}}^{2}}{N{\sigma }^{2}}, $$ $$ SSW={\sum }_{h=1}^{L}{N}_{h}{{\sigma }_{h}}^{2} $$ $$ SST=N{\sigma }^{2} $$ where, SSW represents the sum of within-stratum variances of chickenpox outbreak risk, h = 1, 2, …, L is the number of strata of the selected risk factors X, $ {N}_{h} $ is the number of counties within stratum h, and $ {{\sigma }_{h}}^{2} $ is the variance of chickenpox outbreak risk among all counties within stratum h. SST represents the total variance of chickenpox outbreak risk among all strata. N represents the total number of counties in the entire study area, and $ {\sigma }^{2} $ is the variance in chickenpox outbreak risk among all counties. Each dependent variable was spatially stratified. The q statistic is within the range of q∈[0, 1], a higher value of the q statistic indicates a stronger spatial association between the spatial distribution of chickenpox outbreaks and the dependent variable.
Besides the spatial association between chickenpox outbreak risk and a single factor, the interactive effect of two different dependent variables, $ {X}_{1} $ and $ {X}_{2} $, was also quantified using the Geodetector q statistic. This was accomplished through the utilization of geographical information system (GIS) spatial overlay analysis of two variables $ {X}_{1} $ and $ {X}_{2} $ and can obtain a new layer variable $ {X}_{1}\cap {X}_{2} $. This aids in understanding how the interactive effects of the two factors affect the spatial distribution of chickenpox risk between variables.
-
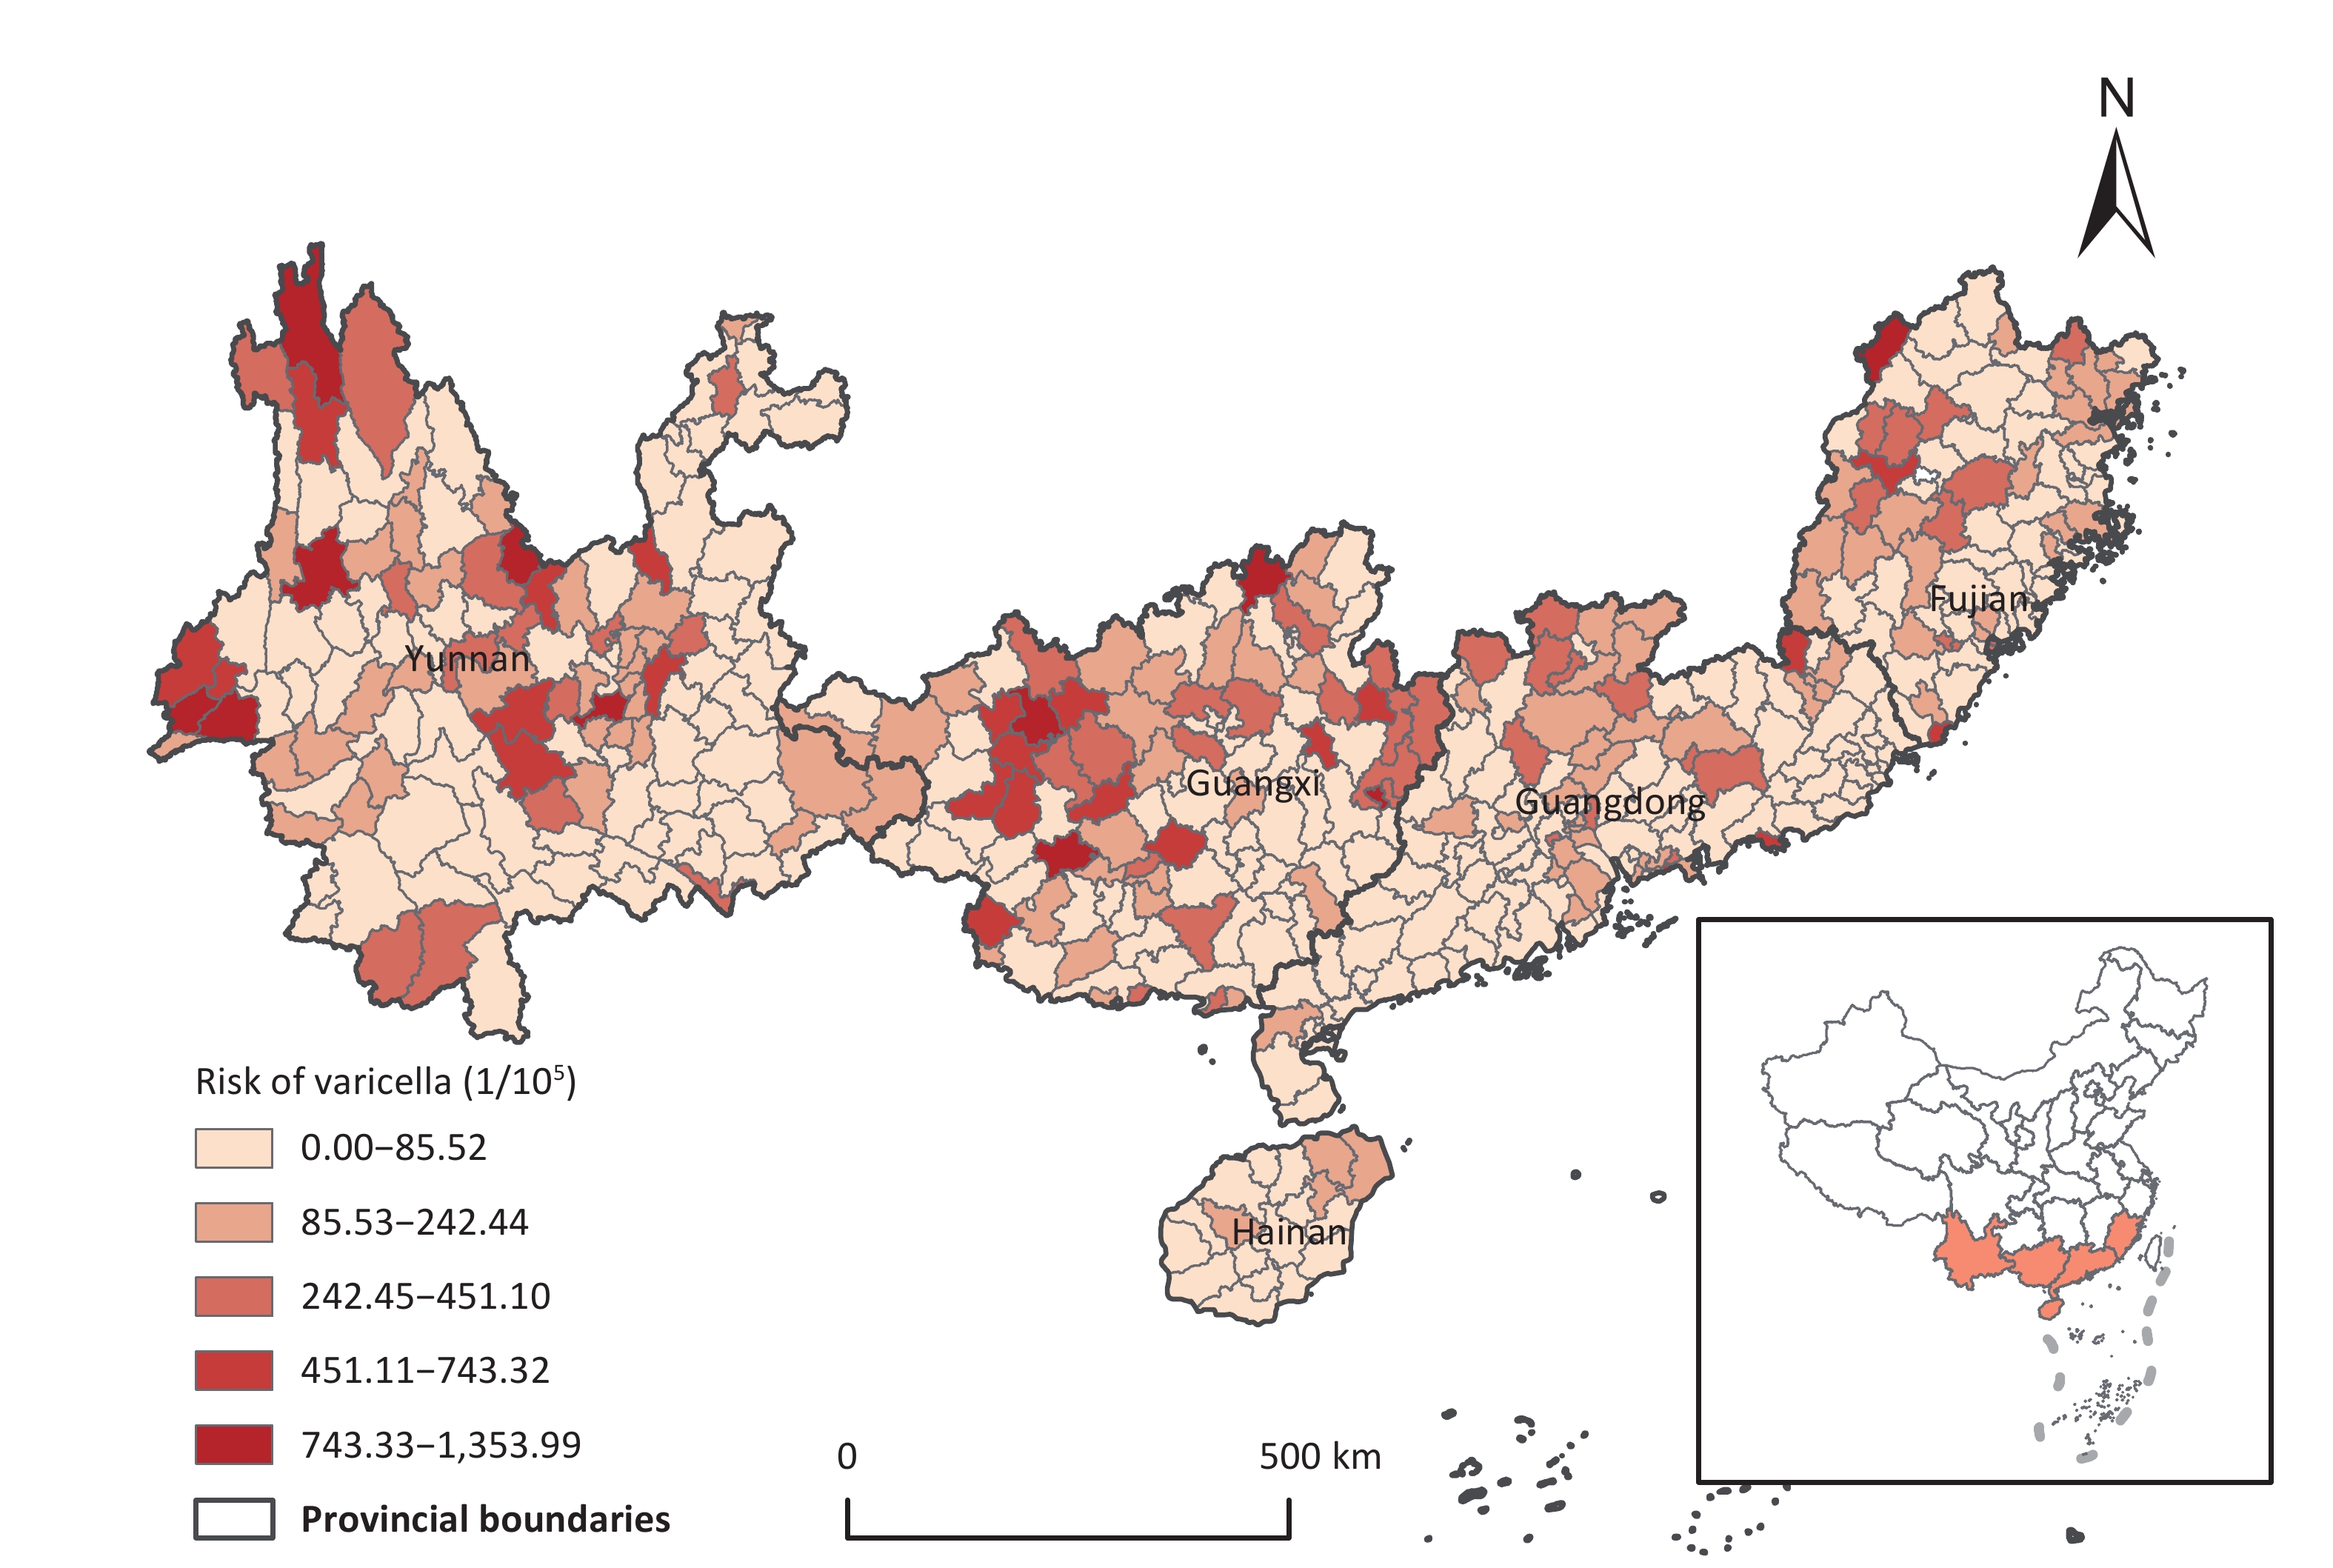
In Southern China, significant spatial heterogeneity has been observed regarding the risk of chickenpox outbreaks. Elevated risk zones were primarily concentrated in the northern sectors of the investigated region, specifically in north-central Yunnan, northern Guangxi, north-western Guangdong, and western Fujian (Figure 2). Notably, Donglan in Guangxi and Puning in Guangdong had the highest (1,353.99/105 individuals) and lowest (5.44/105 individuals) outbreak risks, respectively.
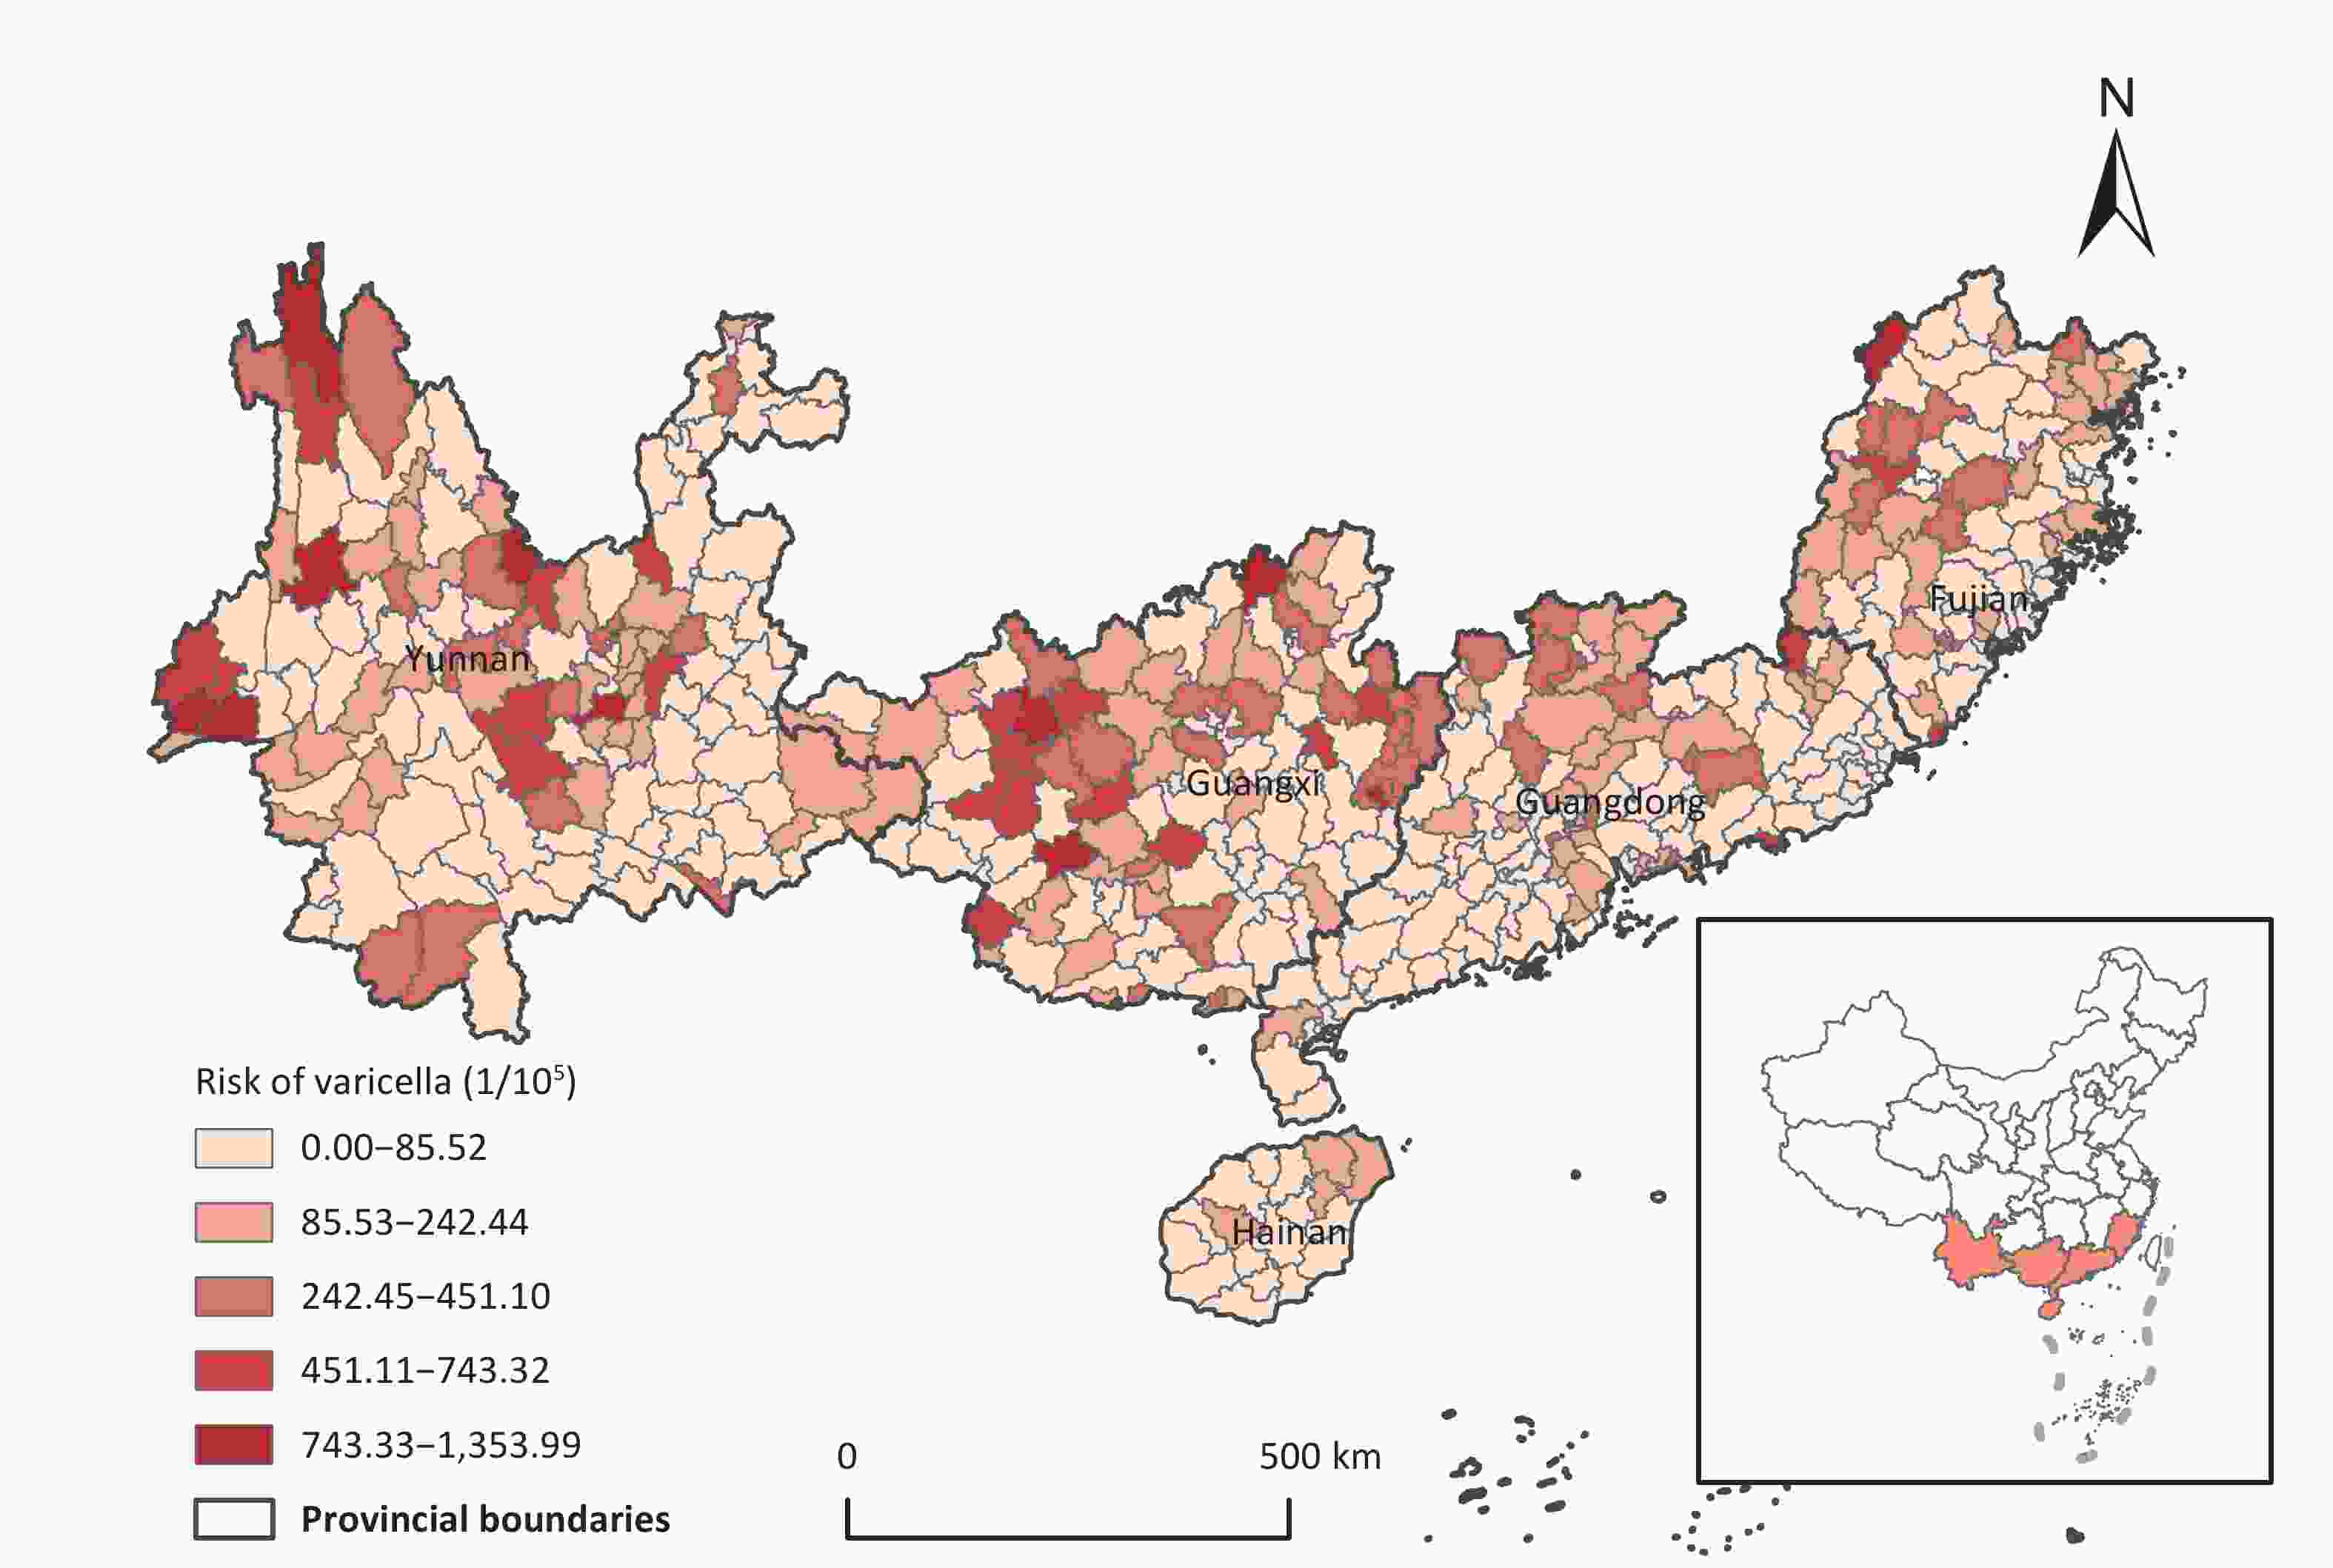
Figure 2. The spatial distribution of annual mean chickenpox outbreak risk in the South China from 2006 to 2021.
Moran’s I indicated spatial autocorrelation in the risk of chickenpox outbreaks (Moran’s I = 0.136, P < 0.01). Furthermore, LISA statistical analysis revealed that HH cluster regions were predominantly located in the northwest regions of Guangxi and Yunnan. In contrast, the LL clusters were mainly situated in the southwestern and southeastern regions of Guangdong, southern Hainan, southeastern Yunnan, and central and eastern Fujian (Figure 3). These findings highlight the distinct spatial patterns of chickenpox outbreak risks across Southern China.
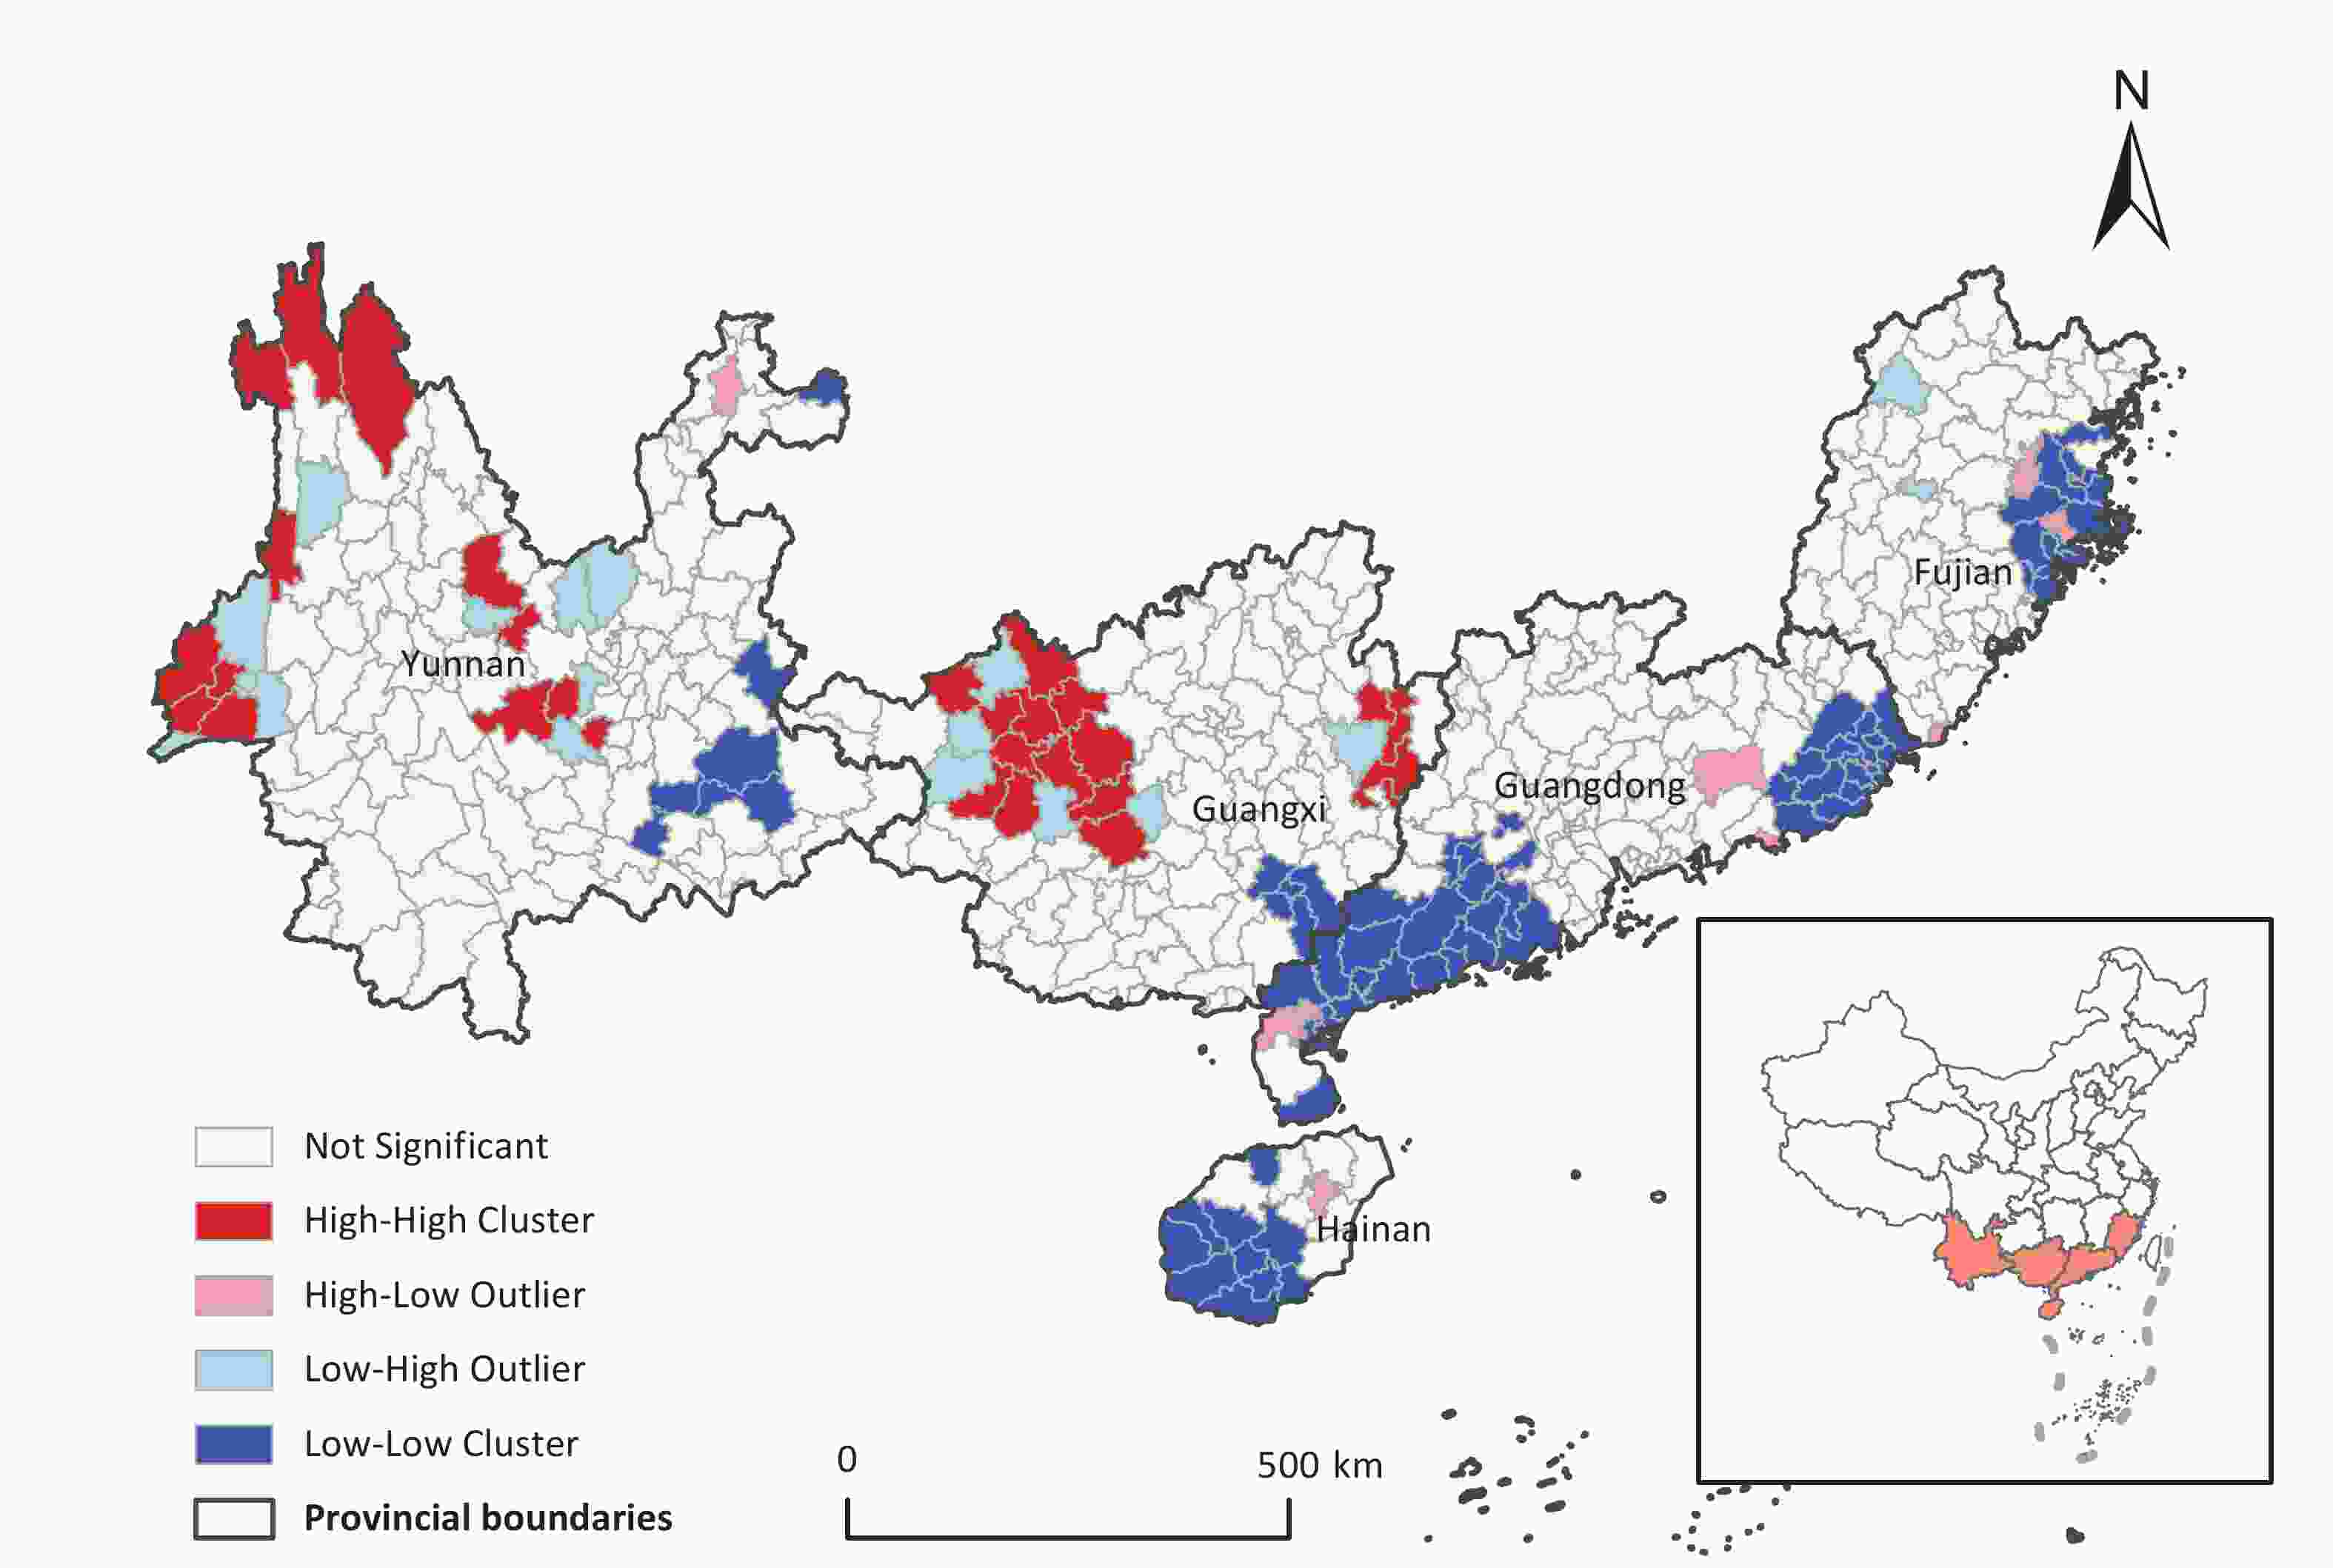
Figure 3. The spatial clustering characteristics of chickenpox risk in the South China.
-
This study used the geographical detector method to identify the dominant socioeconomic factors influencing chickenpox transmission across different geographical environments (Table 2). The factors considered include population size, housing conditions, and transportation accessibility. The findings revealed that various factors, including population size, housing conditions, transportation modes, socioeconomic indicators, medical parameters, and educational indicators, exerted varying degrees of influence on chickenpox risk.
Category Potential factors q-statistic P Status of vaccination Per capita GDP (yuan) 0.05 0.01 Percentage of educated population (%) 0.03 0.01 Social economy Urbanization rate (%) 0.05 0.02 Hospital beds of 1,000 people 0.05 0.01 Living environment Per capita residential building area (m3) 0.10 0.01 Percentage of rental housing (%) 0.06 0.01 Percentage of households with toilets (%) 0.06 0.01 Demographics Population density (number of people/100 m2) 0.12 0.01 Proportion of the population under 24 years of age (%) 0.10 0.01 Percentage of floating population (%) 0.03 0.05 Note. GDP, gross domestic product. Table 2. q-statistics for each factor on chickenpox risk
Population size emerged as the most critical determinant of the significance of individual factors. Specifically, the population density accounted for 12% of the variation in chickenpox risk, whereas the proportion of the population < 24 years accounted for 10% of the observed risk. Housing conditions, particularly per capita residential building area, contributed significantly to 10% of the risk. The combined effect of the percentage of rented houses and per capita residential building area accounted for 6% of the risk. Regional population connectivity, as assessed by road density, emerged as another noteworthy influencing factor, accounted for 8% of the risk associated with chickenpox.
Although the impacts of socioeconomic indicators, medical conditions, and educational parameters were modest compared with the aforementioned factors, they retained statistical significance. Variables such as per capita GDP, urbanization rate, and number of hospital beds per thousand people each accounted for 5% of the chickenpox risk. Additionally, the proportion of the educated population accounted for 3% of the risk. These findings provide valuable insights into the multifaceted dynamics of chickenpox transmission across different regions.
-
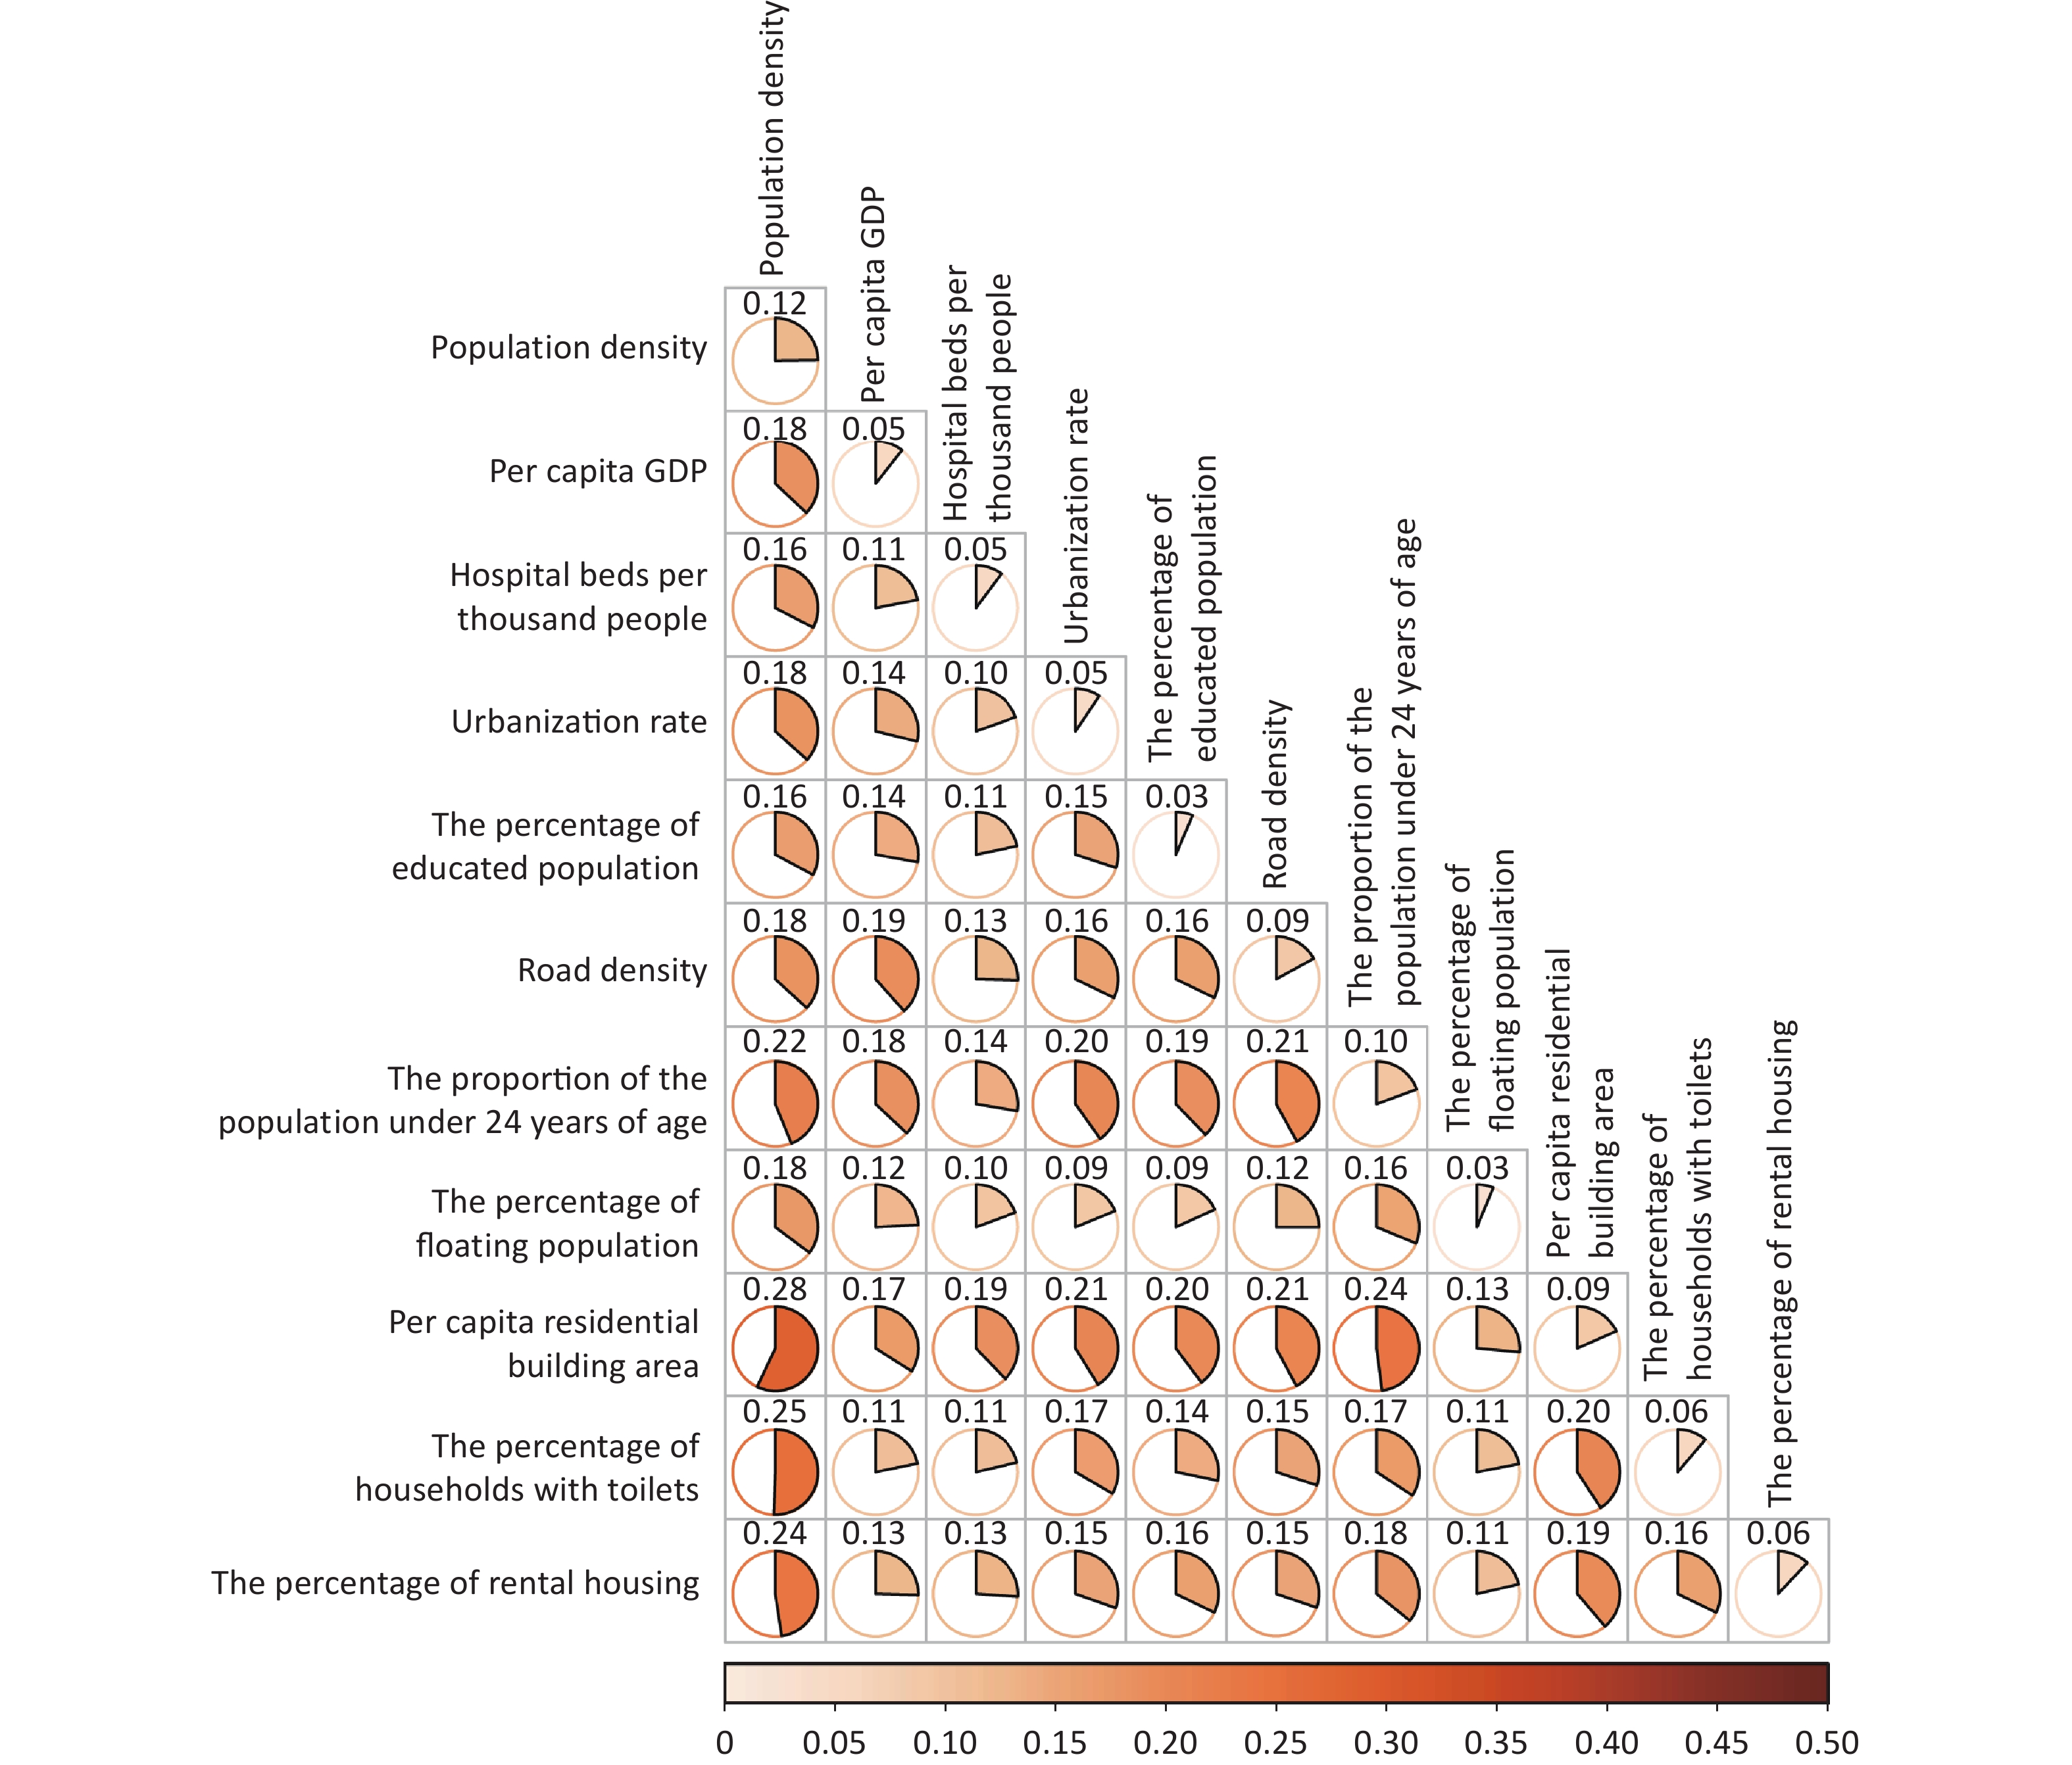
Chickenpox transmission stems from the interplay between VZV and susceptible groups under various geographical and socioeconomic conditions. This study utilized an interaction analysis using the geographical detector method to explore the combined effects of different socioeconomic factors on the pathological mechanisms of chickenpox. Notably, the interactive effect of multiple factors influencing chickenpox transmission surpassed that of individual factors.
The analysis revealed a noteworthy enhancement in the q statistic for the interactive effects between population density and other factors. The most significant interaction was observed between population density and per capita residential building area, with a q statistic of 0.28, followed by population density and percentage of households with toilets (q = 0.25), population density, and percentage of rental housing (q = 0.24). Additionally, the interactive effect between population density and the proportion of the population < 24 years was noteworthy, with a q statistic of 0.22. These results suggest that among the interactive effects of population density and various economic factors, per capita residential building area and the percentage of households with toilets had the most substantial impact on chickenpox transmission.
Simultaneously, significant increases in the interactive effects involving the per capita residential building area and other factors were observed (Figure 4). Notable interactions included those between the per capita residential building area and the proportion of the population < 24 years (q = 0.24), per capita residential building area and urbanization rate (q = 0.21), and per capita residential building area and road density (q = 0.21). Furthermore, interactions involving the proportion of the population < 24 years and other factors, such as road density (q = 0.21) and urbanization rate (q = 0.20), significantly enhanced the q value. Similarly, the interaction between the percentage of households with toilets and per capita residential building area also had a substantial impact (q = 0.20). These findings underscore the complex relationships between the socioeconomic factors influencing chickenpox transmission.
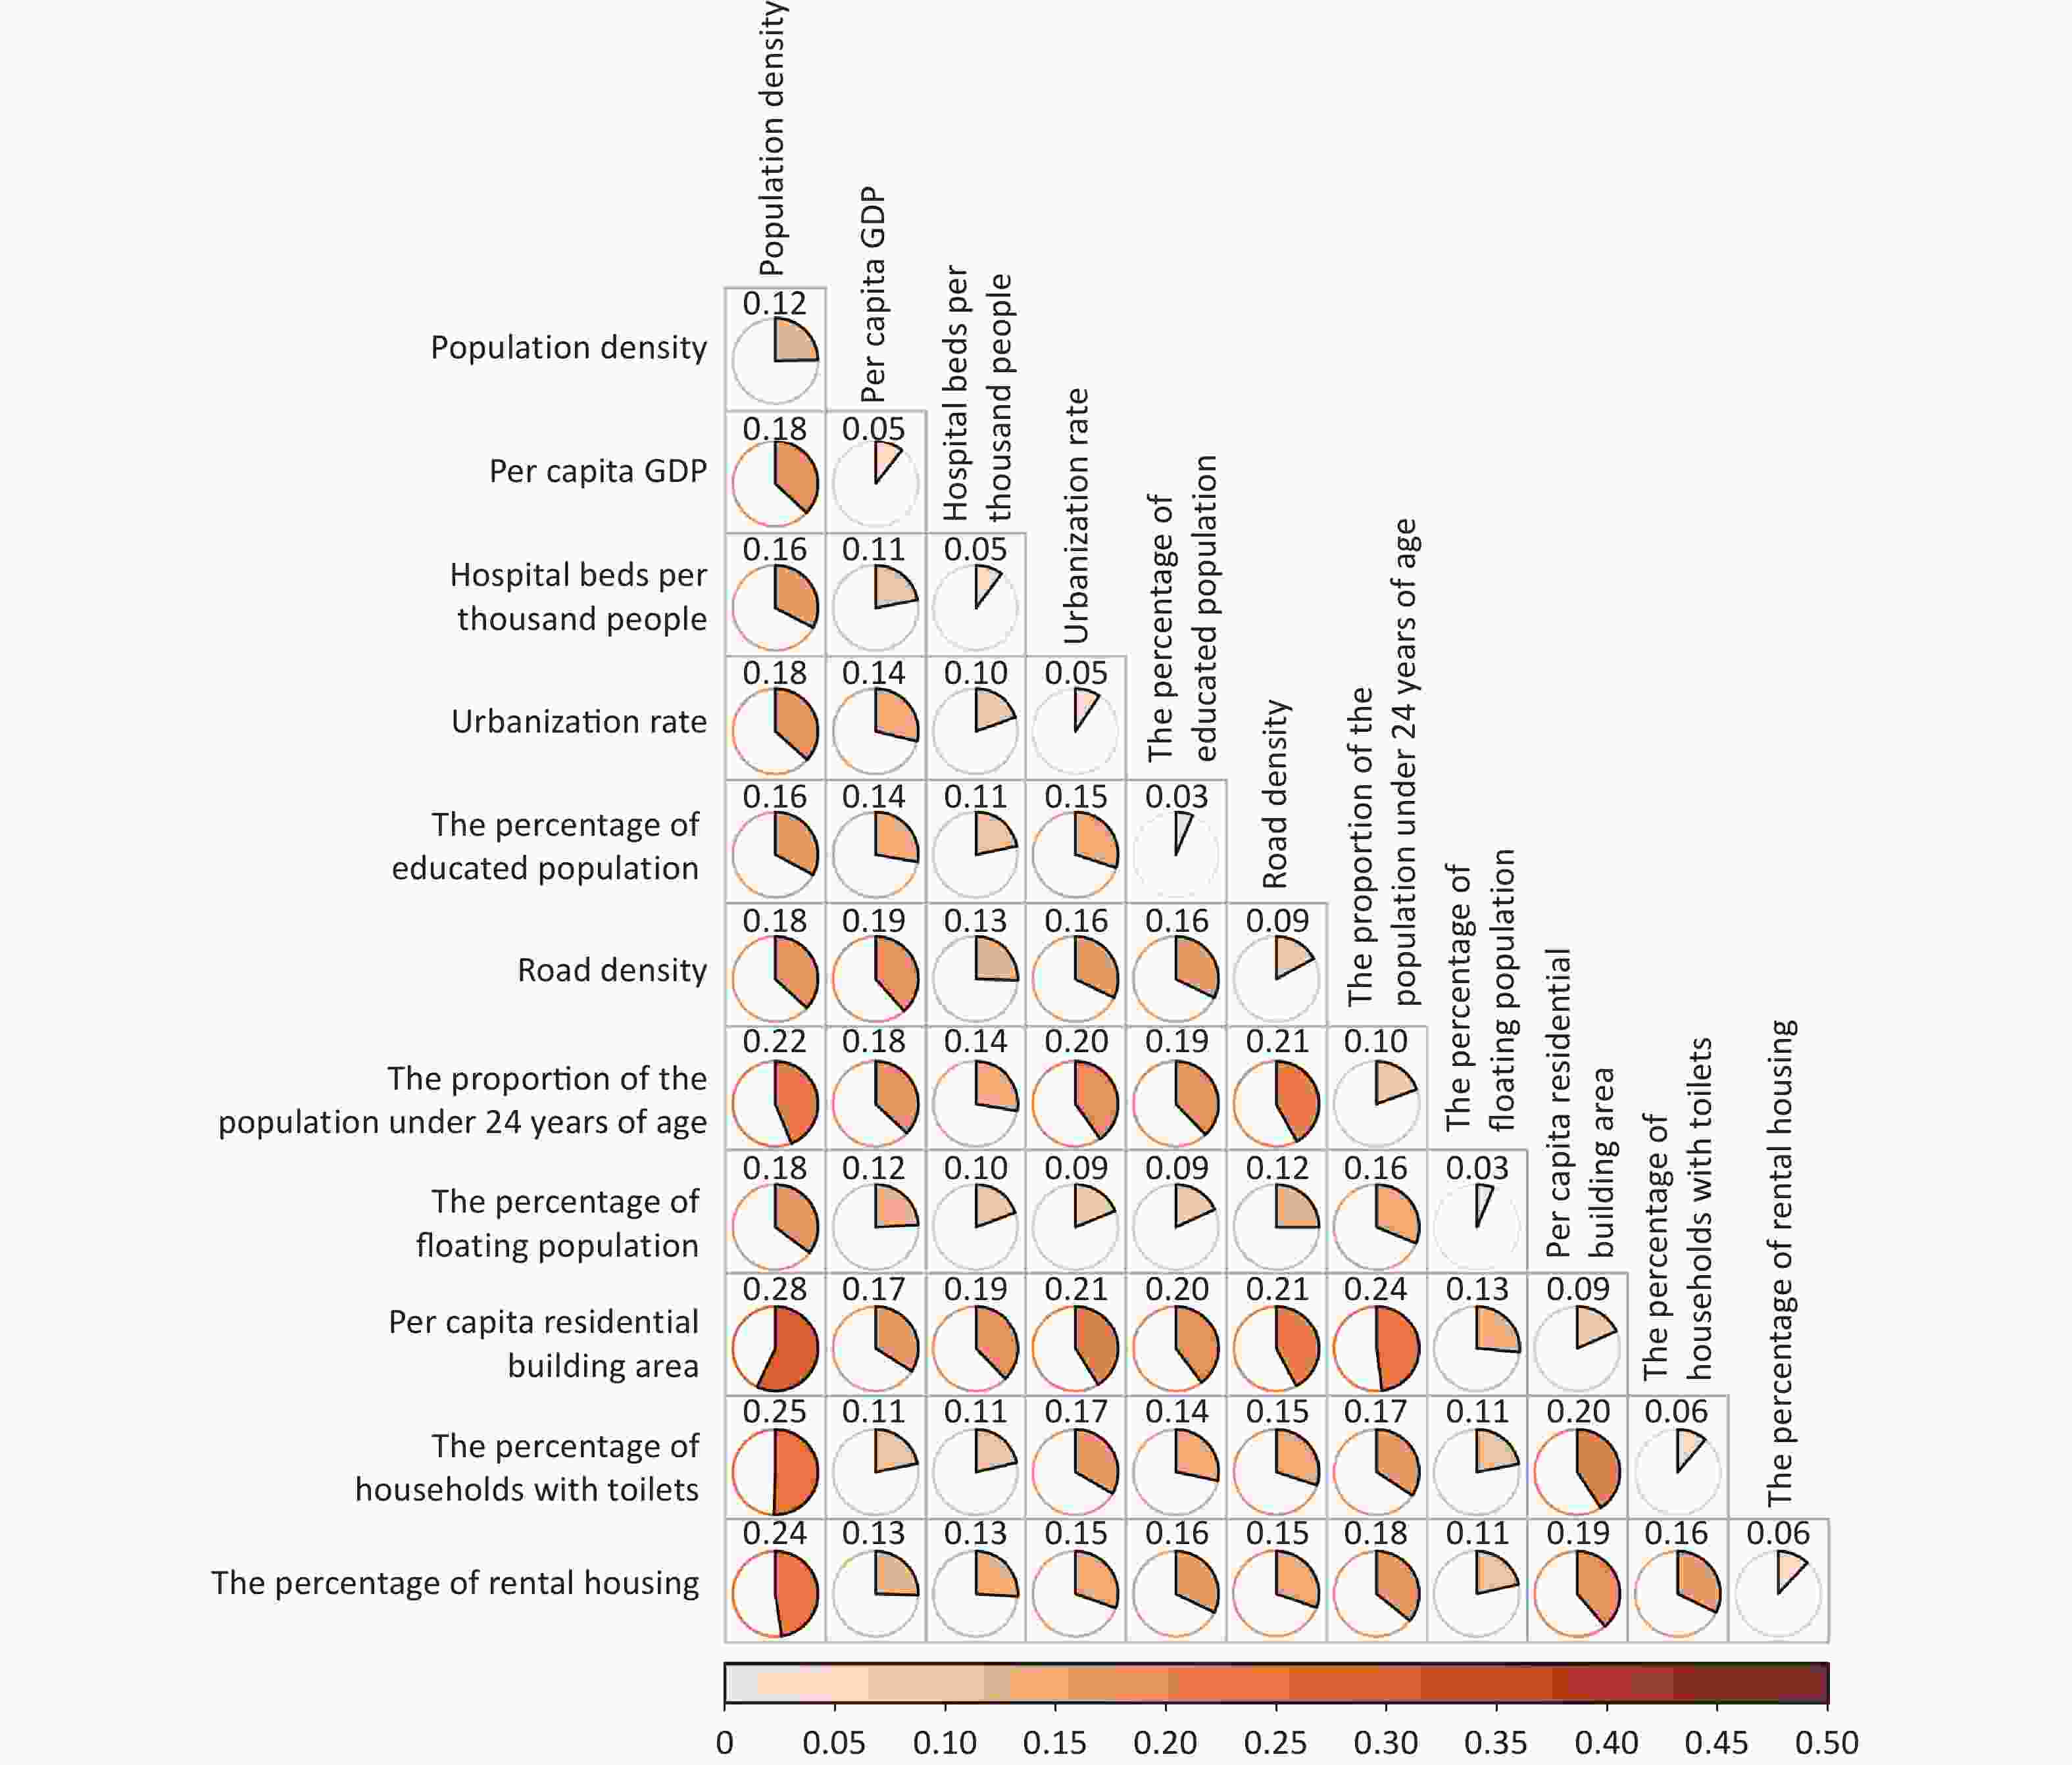
Figure 4. Interactive effects of factors on chickenpox risk.
-
This study provides a comprehensive analysis of the epidemiological and spatial characteristics of chickenpox outbreaks in Southern China and explores the interactive and nonlinear associations between socioeconomic factors and chickenpox outbreaks, which is explained by the geographic detector results.
This study highlights significant spatial heterogeneity in the risk of chickenpox outbreaks in rapidly developing regions. The correlations identified the relationship between chickenpox risk and various socioeconomic factors, particularly demographic and living environment indicators, which underscore the complex relationship between human settlement factors and disease transmission dynamics.
The observed interactive effects among factors such as population density, per capita residential building area, percentage of households with toilets, and percentage of rental housing emphasize the multifaceted nature of the determinants influencing chickenpox outbreaks. These findings suggest that socioeconomic factors play a pivotal role in shaping the vulnerability of populations to infectious diseases in rapidly evolving urban environments.
Furthermore, this study highlighted the importance of considering spatial clustering attributes and socioeconomic determinants when devising targeted public health strategies and interventions to mitigate the risk of chickenpox outbreaks in similar global contexts. By understanding the underlying factors driving disease transmission, policymakers and healthcare professionals can better allocate resources and implement tailored interventions to effectively prevent and control chickenpox outbreaks in rapidly developing countries.
Understanding spatial clustering is crucial for understanding infectious disease outbreaks. This study identified the spatial heterogeneity in chickenpox outbreaks in Southern China, with specific regions exhibiting an elevated risk. These findings are consistent with those of previous studies conducted in the Guangxi Zhuang Autonomous Region and Chongqing[33,34], and highlight the enduring nature of spatial clustering over time. At the national level, the incidence of chickenpox in Korea also showed significant spatial heterogeneity, with spatially high clustering areas evolving over time. During 2006–2014, HH clusters concentrated in and around northeastern Korea shifted to neighboring areas during 2015–2018[12]. The spatial distribution of chickenpox outbreaks is shaped by various socioeconomic factors and their complex interactions influence disease transmission.
Furthermore, this study underscores the role of economic development in disease control efforts using per capita GDP. A higher per capita GDP is associated with a reduced risk of chickenpox transmission, which is attributed to improved healthcare infrastructure and increased vaccination coverage[3,35]. Economically developed regions are better equipped to tackle outbreaks, highlighting the pivotal role of economic prosperity in disease prevention and control.
Education is a key factor influencing chickenpox transmission dynamics. Higher education levels are associated with better health knowledge and practices, thereby reducing the risk of chickenpox transmission. Education plays a critical role in promoting healthcare-seeking behaviors, including vaccination adherence and practicing hygiene. Regions characterized by higher education levels are more likely to achieve higher vaccination rates, thereby establishing a protective barrier against the spread of the virus.
Furthermore, this study challenges the conventional notion that a higher population density leads to increased transmission rates. Contrary to usual notions, areas experiencing high-risk chickenpox outbreaks are located in regions with lower population density[3]. This finding was supported by Lee et al., who used a spatial regression analysis to study the factors influencing chickenpox incidence in the Republic of Korea and found that the regression coefficient of population density was negative[12]. This discrepancy may be related to the economic status of these areas and their potentially low vaccination rates.
The proportion of floating population is a significant factor in chickenpox transmission. Areas with a higher proportion of floating populations often exhibit lower socioeconomic status and limited access to healthcare facilities. Tailoring public health interventions to address the specific needs of floating populations is crucial for controlling chickenpox transmission and improving health outcomes in vulnerable communities[36,37]. These findings underscore the complex interplay between the spatial and socioeconomic factors that contribute to chickenpox outbreaks. The relationship between chickenpox transmission and the proportion of the floating population is crucial for understanding disease dynamics in regions with significantly mobile populations[3,35]. Moreover, tailoring public health interventions to address the specific needs of the floating population can effectively control chickenpox transmission.
This study has several limitations, particularly the absence of official or private statistical data on vaccination rates. Proxy variables were used to account for the influence of vaccination, introducing uncertainty into the results. Despite these limitations, this study provides valuable insights into the multifaceted dynamics of chickenpox transmission in Southern China.
-
This study underscores the crucial role of spatial and socioeconomic dynamics in the epidemiology of chickenpox outbreaks in Southern China, and highlights the significant spatial heterogeneity in the risk of outbreaks within rapidly developing regions and demonstrates the correlations between chickenpox risk and various socioeconomic factors, particularly demographics and indicators related to the living environment. These findings emphasize the intricate interplay between human settlement factors and disease transmission dynamics. Moreover, this study showed interactive effects among specific factors, highlighting the multifaceted nature of the factors influencing chickenpox outbreaks, and suggests that socioeconomic factors play a pivotal role in shaping the vulnerability of populations to infectious diseases in rapidly evolving urban environments. Additionally, this study highlights the significance of considering spatial clustering attributes and socioeconomic determinants when designing targeted public health strategies and interventions. By comprehending the underlying factors that drive disease transmission, policymakers and healthcare professionals can effectively allocate resources and implement tailored interventions to prevent and control chickenpox outbreaks in developing countries. These findings provide valuable insights for formulating evidence-based public health strategies, especially in developing countries, with the potential to enhance the overall health and well-being of the population.
HTML
Study Area and Data Sources
Global Spatial Autocorrelation
Local Indicators of Spatial Association
Geodetector
Spatial Pattern of Chickenpox Outbreak
Dominant Factors in Chickenpox Transmission
Multifactor Interactive Effects on Chickenpox Transmission
DECLARATION OF CONFLICTING INTERESTS The authors declare no potential conflicts of interest regarding the research, authorship, or publication of this article.

 Quick Links
 DownLoad: