


-
Hypertension, obesity, type 2 diabetes, and dyslipidemia are the metabolic risk factors of cardiovascular disease[1] and the major causes of death and disability worldwide[2]. The prevalence of these cardiometabolic risk factors is relatively high in China, and it is increasing year by year[3]. Several national surveys have showed that the prevalence of hypertension, obesity, diabetes, and dyslipidemia among Chinese adults is about 23.2%[4], 8.1%[5], 12.4%[6], and 34.0%[7], respectively. Previous studies have also found that genetic mechanisms, demographic characteristics (such as advanced age), and factors related to lifestyle (such as smoking, drinking alcohol, poor dietary habits, and lack of physical activity) are related to the abovementioned diseases[8–11]. However, the exact etiology of these cardiometabolic risk factors has not been clarified adequately owing to the complexity of their pathophysiological mechanisms.
In recent years, the effects of environmental factors on diseases have attracted increasing attention, especially with regard to residential greenness. Some studies[12–20] found associations between residential greenness and the cardiometabolic risk factors mentioned above. The associations between residential greenness and cardiometabolic risk factors may be related to the fact that green vegetation around residences can promote health by promoting physical activity, improving air quality, and reducing psychological stress[21]. Although many studies have explored the associations between residential greenness and cardiometabolic risk factors, their conclusions are inconsistent. Some studies found a beneficial association between residential greenness and hypertension[12–14]. In contrast, no significant association was observed between residential greenness and hypertension or cholesterol in sub-Saharan Africa[22]. Moreover, while a protective effect of residential greenness on blood lipids was observed in northeast[19] and northwest China[20], this result was not observed in children aged 10–15 in Germany[23].
It is noteworthy that most studies only considered the effect of residential greenness on 1–2 cardiometabolic risk factors, without fully clarifying for which cardiometabolic risk factor residential greenness was more protective. Furthermore, most conclusions were based on the data of urban areas with relatively high economic levels. Therefore, further exploration is needed of whether these conclusions apply to economically underdeveloped rural areas.
Xinjiang Uygur Autonomous Region (Xinjiang) is located in the hinterland of Eurasia, which is one of the arid regions of Central Asia. The economic level of rural residents is lower than that of the residents of developed urban areas, and the local medical and health resources are relatively insufficient. This may lead to the metabolic status of rural residents being lower than that of residents in developed areas, and they are more susceptible to differences in environmental exposure as well[24]. Hence, based on the above research background, this study aims to explore the associations between residential greenness and cardiometabolic risk factors among rural adults in Xinjiang and provide a theoretical basis and data support for improving the health of residents in this area.
-
We conducted a large-scale population-based cross-sectional survey in September 2016 among members of the Third Division of the Xinjiang Production and Construction Corps. The Third Division is located in southern Xinjiang, about 3,000 kilometers from Beijing. Most of the local rural residents make a living by growing cotton, grain, and fruits. The 51st Regiment of the Third Division, being the most populous regiment farm in southern Xinjiang, is representative. Therefore, we adopted a typical sampling method to reduce cost and selected the 51st Regiment of the Third Division as the research site.
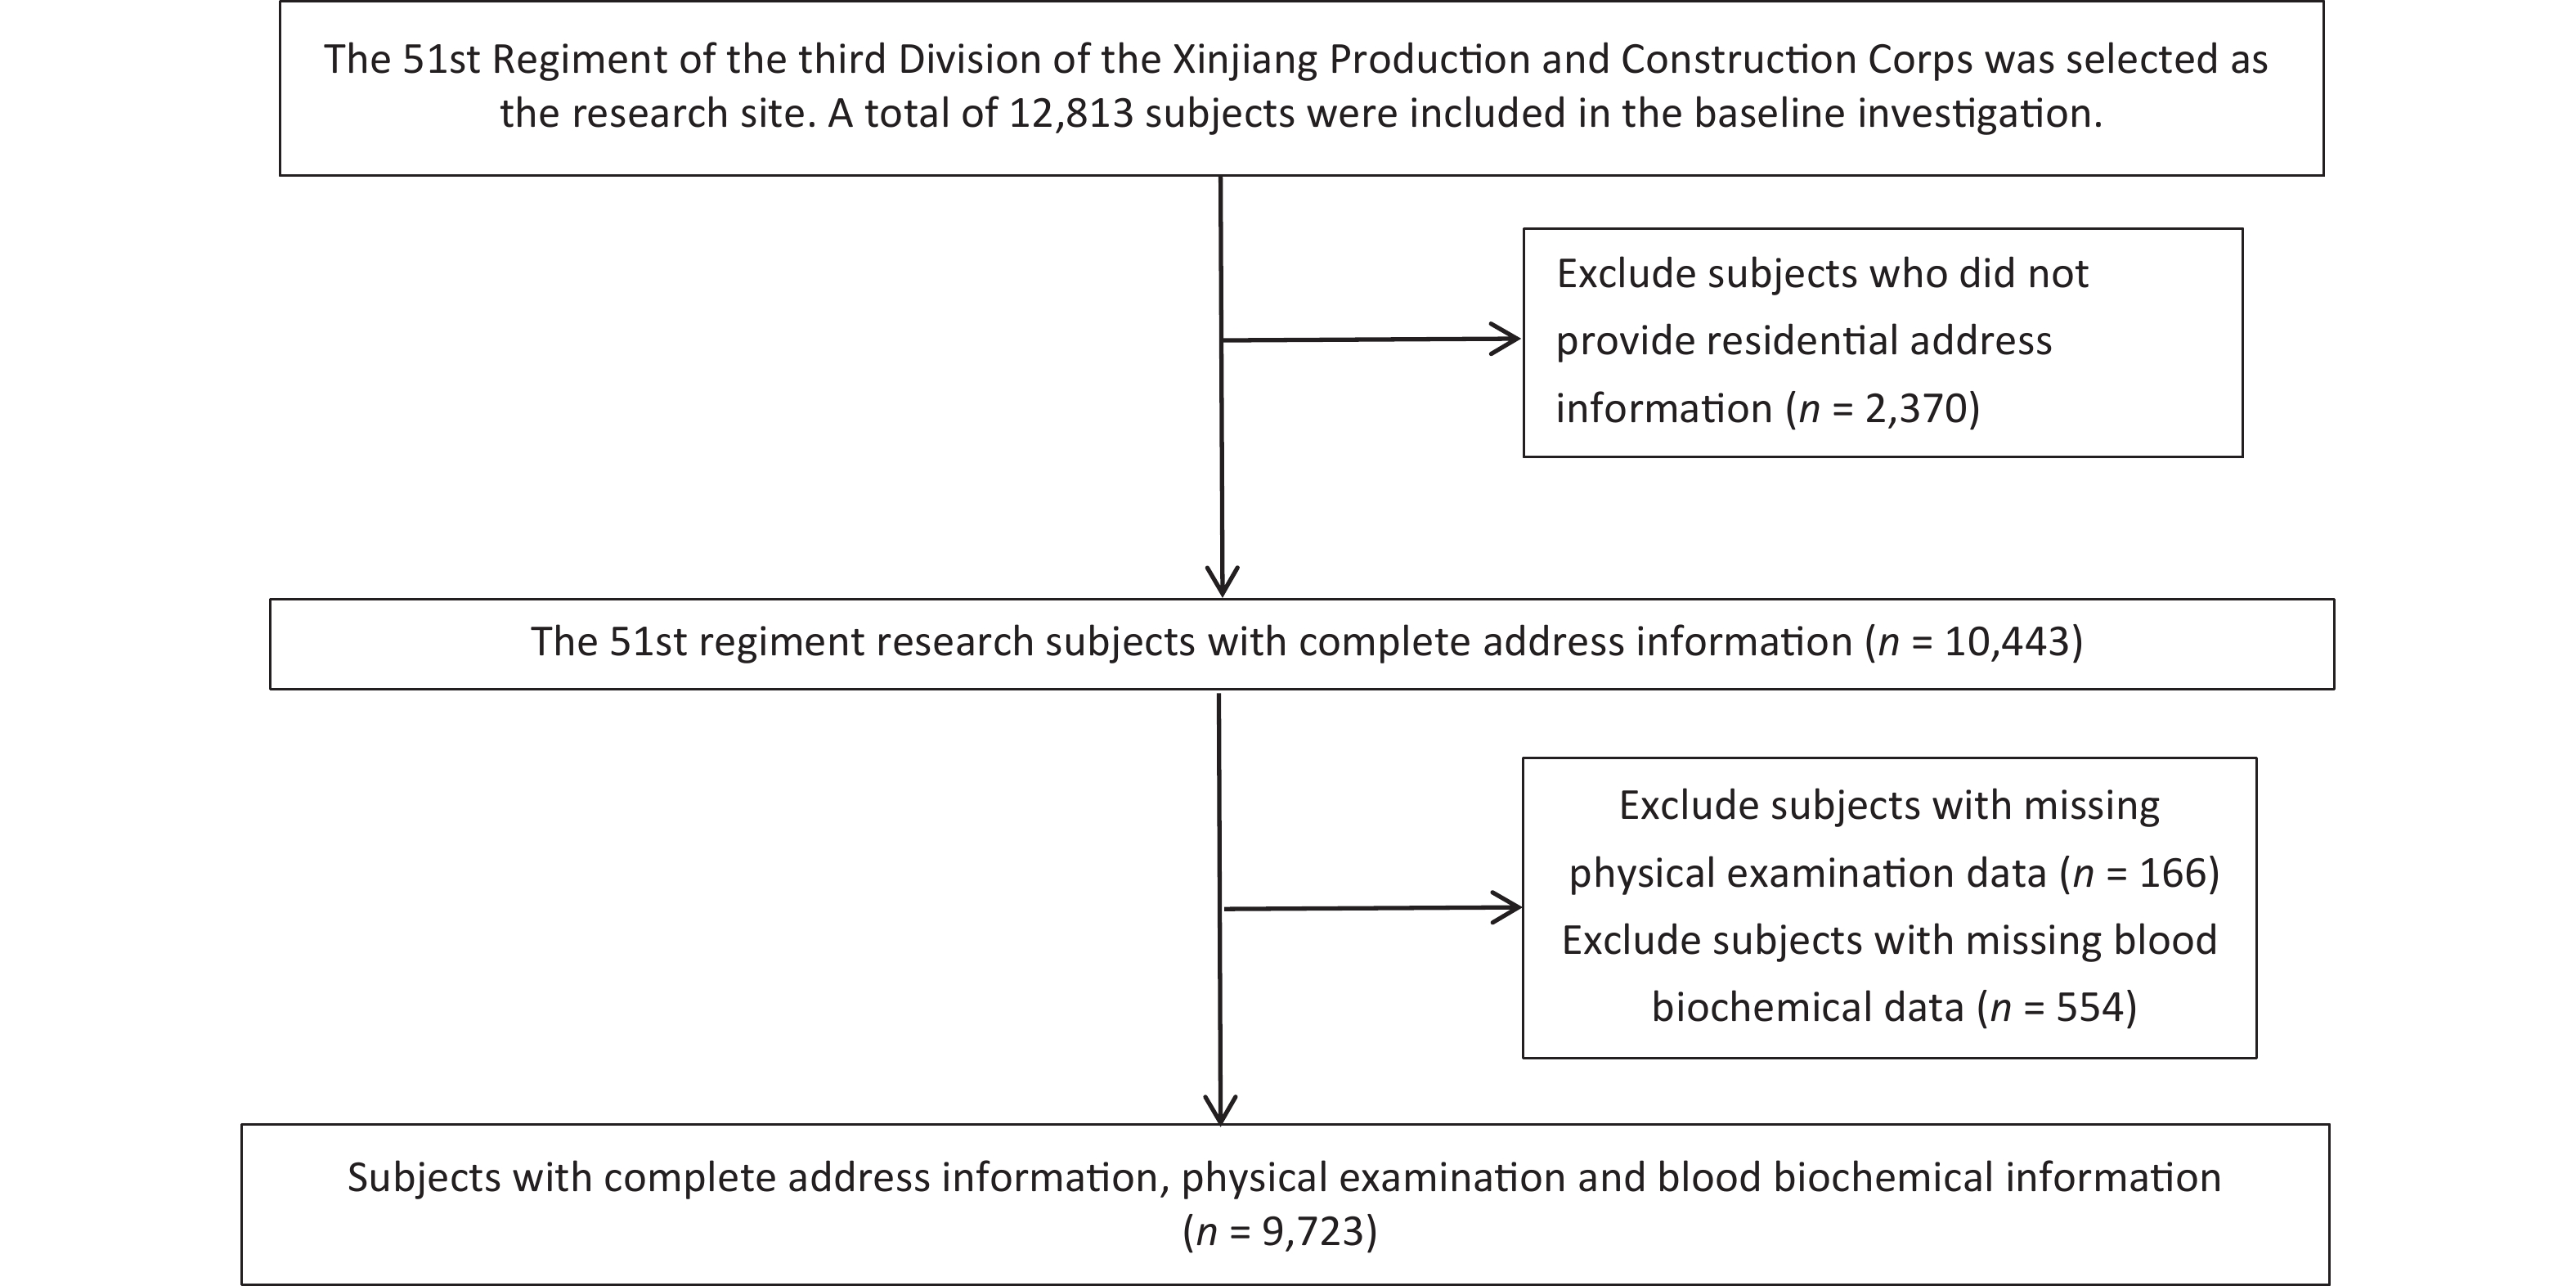
We recruited a total of 12,813 subjects aged 18 years and older who had lived in the local area for at least 1 year and conducted face-to-face interviews with them using a self-designed standardized questionnaire. The standardized questionnaire included age, education level, occupation, marital status, smoking and drinking habits, cardiometabolic and cardiovascular disease history, and family history. We excluded subjects who did not provide address information (n = 2,370), subjects with missing physical examination data (n = 166), and subjects with missing blood biochemical test data (n = 554). Finally, 9,723 subjects were included in the final analysis (Supplementary Figure S1, available in www.besjournal.com). This study was approved by the Ethics Committee of the First Affiliated Hospital of Shihezi University School of Medicine (NO. SHZ2010LL01), and all subjects provided informed consent before participating in the study.
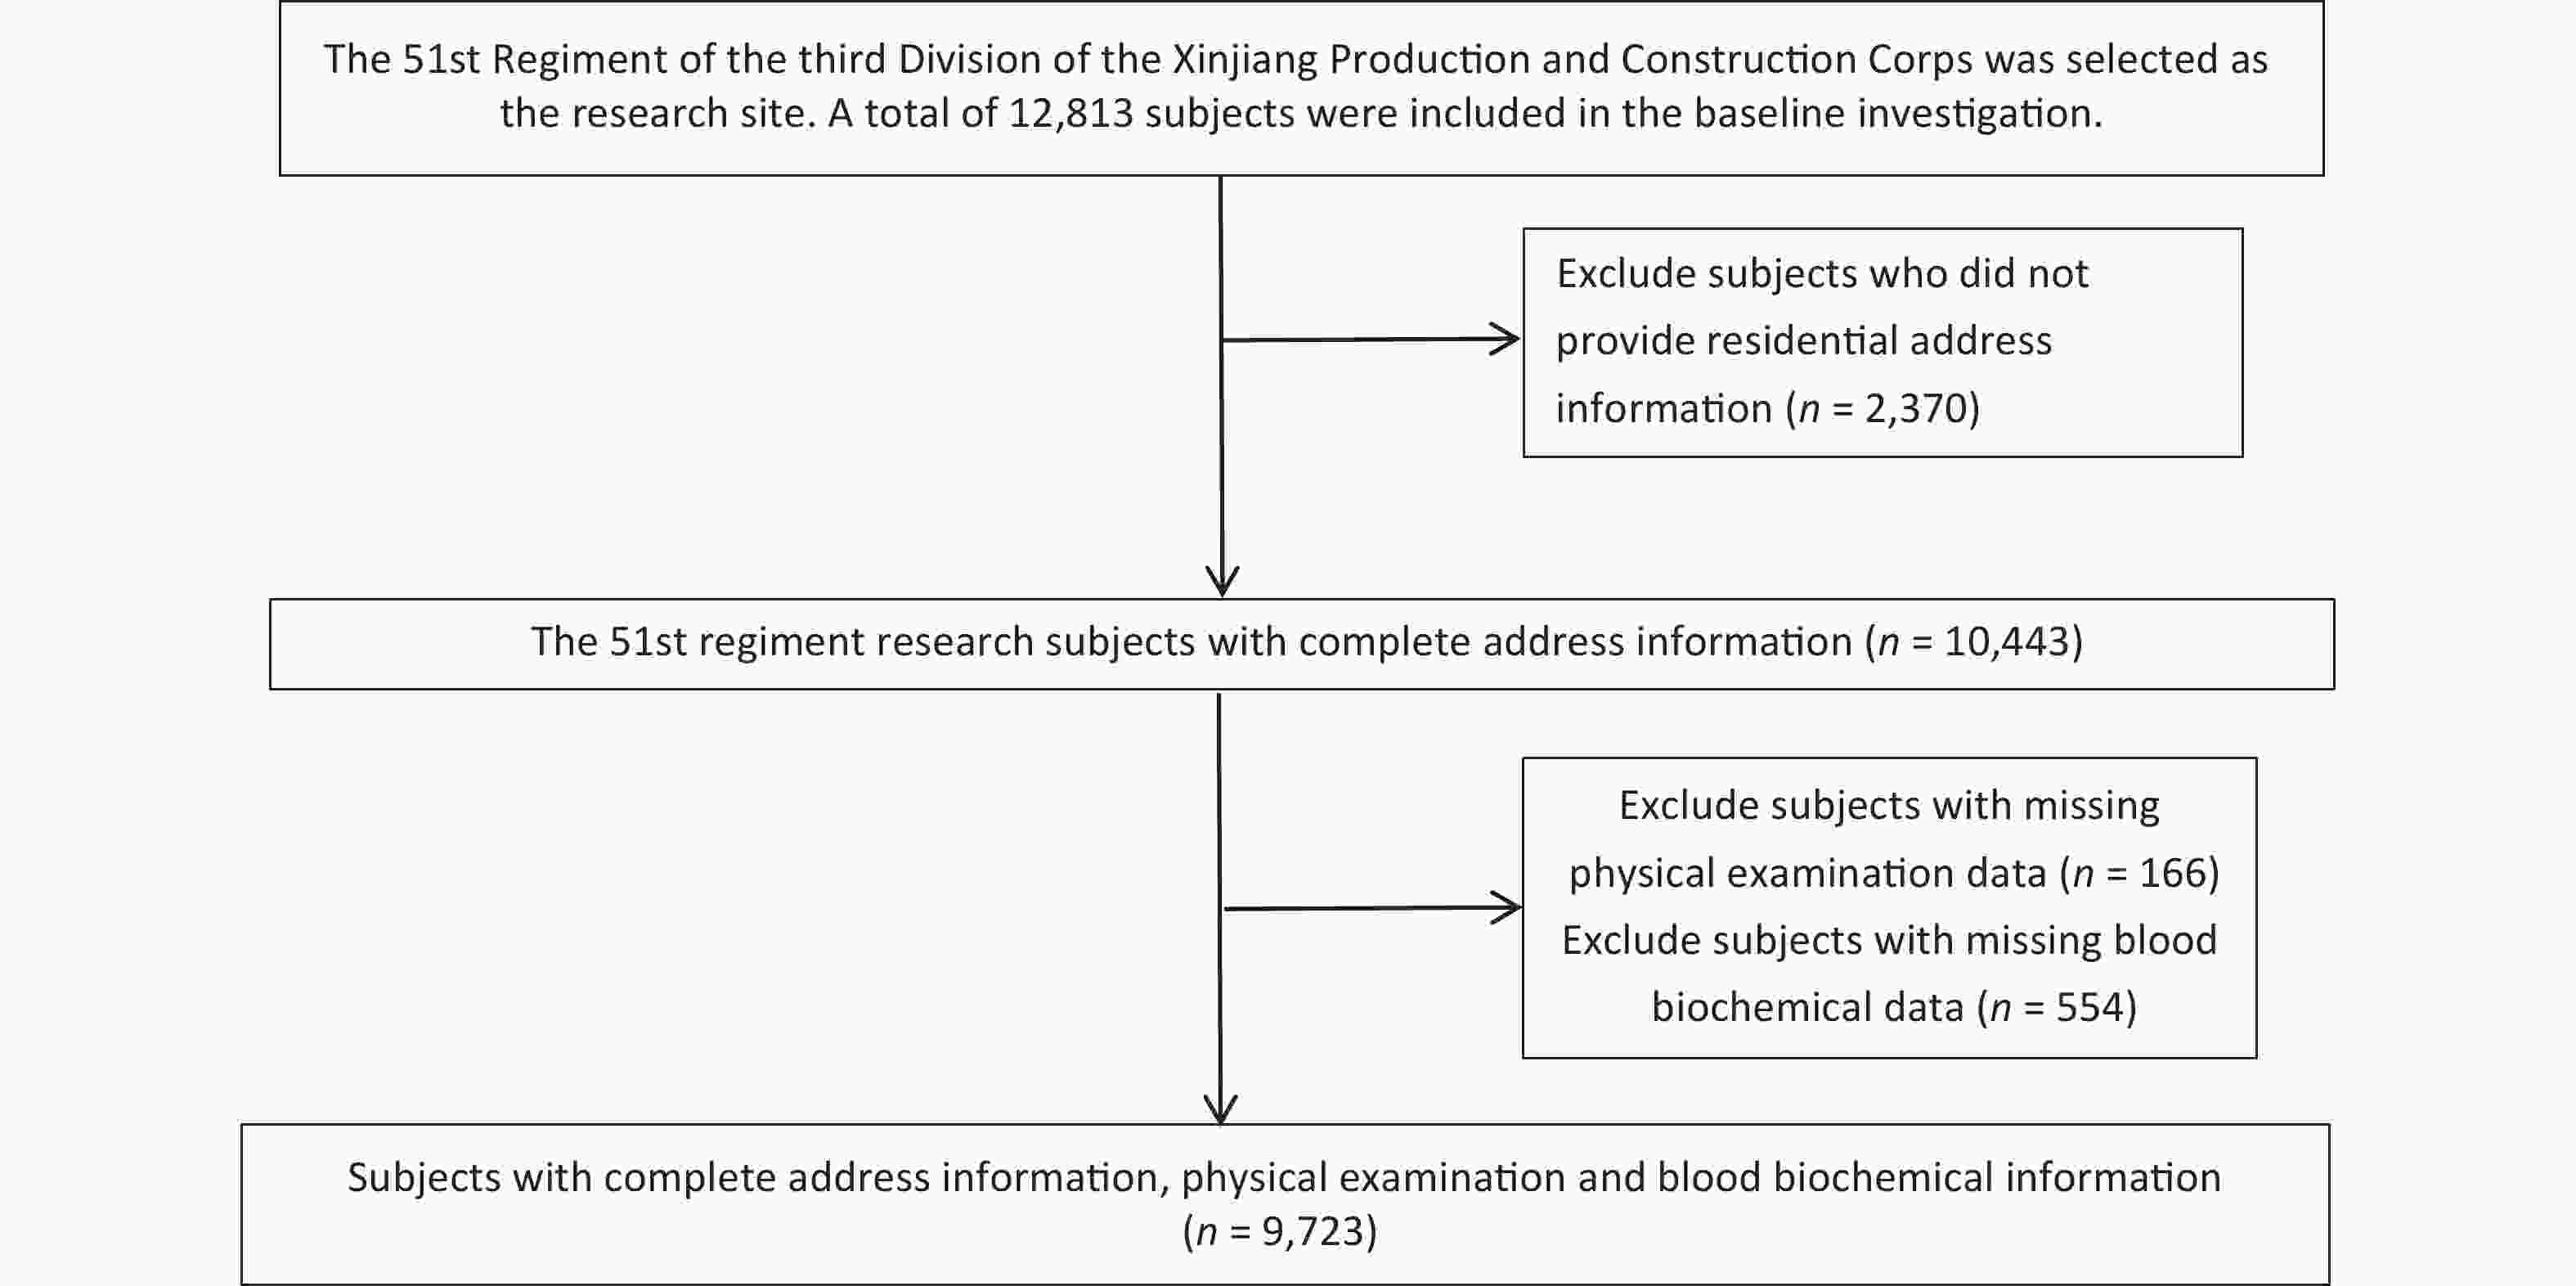
Figure S1. Flow chart of inclusion and exclusion of research subjects.
-
Height and weight were measured using a fully automatic height and weight scale. The subjects were asked to remove their shoes, hats, and coats before measurement. The measurement accuracy for height and weight was 0.1 cm and 0.1 kg, respectively. Waist circumference (WC) was measured at the end of exhalation at the midpoint between the lowest point of the ribs and the upper edge of the iliac crest using a non-elastic soft tape measure with a measurement accuracy of 0.1 cm. Body mass index (BMI) was calculated as the subject’s weight (kg) divided by the square of the height (m2). After the subjects sat and rested for at least 5 minutes, systolic and diastolic blood pressure were measured using an Omron electronic blood pressure monitor (model: HEM-7051). An interval of 30 seconds was maintained between measurements, and the average value of the three measurements was calculated. After the subjects fasted for at least 10 hours the previous night, whole blood was drawn the morning of the next day, anticoagulated with sodium heparin, shaken well, centrifuged at 3,000 r/min for 10 min, and stored in a −20 °C refrigerator. Centralized low-temperature transport was utilized to transport the samples to the −80 °C cryogenic storage refrigerator of the Key Laboratory of Shihezi University School of Medicine. All biochemical indicators were tested with an automatic biochemical analyzer (Olympus AU 2700; Olympus Diagnostics, Hamburg, Germany) in the Laboratory Department of the First Affiliated Hospital of Shihezi University School of Medicine.
-
Hypertension was defined as mean systolic blood pressure (SBP) ≥ 140 mmHg or diastolic blood pressure (DBP) ≥ 90 mmHg or self-reported use of anti-hypertension medicine[25].
Obesity was defined as BMI ≥ 28 kg/m2[26].
Type 2 diabetes was defined as fasting plasma glucose (FPG) ≥ 7.0 mmol/L or previous diagnosis of type 2 diabetes[27].
Dyslipidemia was defined as at least one of the following four conditions: 1) hypercholesterolemia was defined as total cholesterol (TC) ≥ 6.2 mmol/L; 2) hypertriglyceridemia was defined as triglyceride (TG) ≥ 2.3 mmol/L; 3) hyperbetalipoproteinemia was defined as low density lipoprotein cholesterol (LDL-C) ≥ 4.1 mmol/L; 4) hypoalphalipoproteinemia was defined as high density lipoprotein cholesterol (HDL-C) < 1.0 mmol/L[28].
Risk factor aggregation was defined as the simultaneous fulfillment of two or more of the above cardiometabolic risk factors.
-
We evaluated residential greenness through the normalized difference vegetation index (NDVI) of the residential address. The NDVI image was extracted from the thematic map of a Landsat 8 satellite image dated August 2016 (The vegetation in northern China is most luxuriant in August, and it is relatively close to the survey time) The image resolution was 30 m × 30 m (http://earthexplorer.usgs.gov). The NDVI was calculated using the following formula: NDVI = (NIR − RED) / (NIR + RED)[29]. The NDVI value range is −1 to 1, and the larger the value, the higher the green vegetation coverage. We did not exclude the water element, because the research site of this study is adjacent to the desert, with almost no water element. The average NDVI value in the 250-m, 500-m, and 1,000-m circular buffer areas of the community/company center of the research object was used to evaluate residential greenness. All data processing was performed using ArcGIS10.8 (ESRI, Redlands, CA, USA).
-
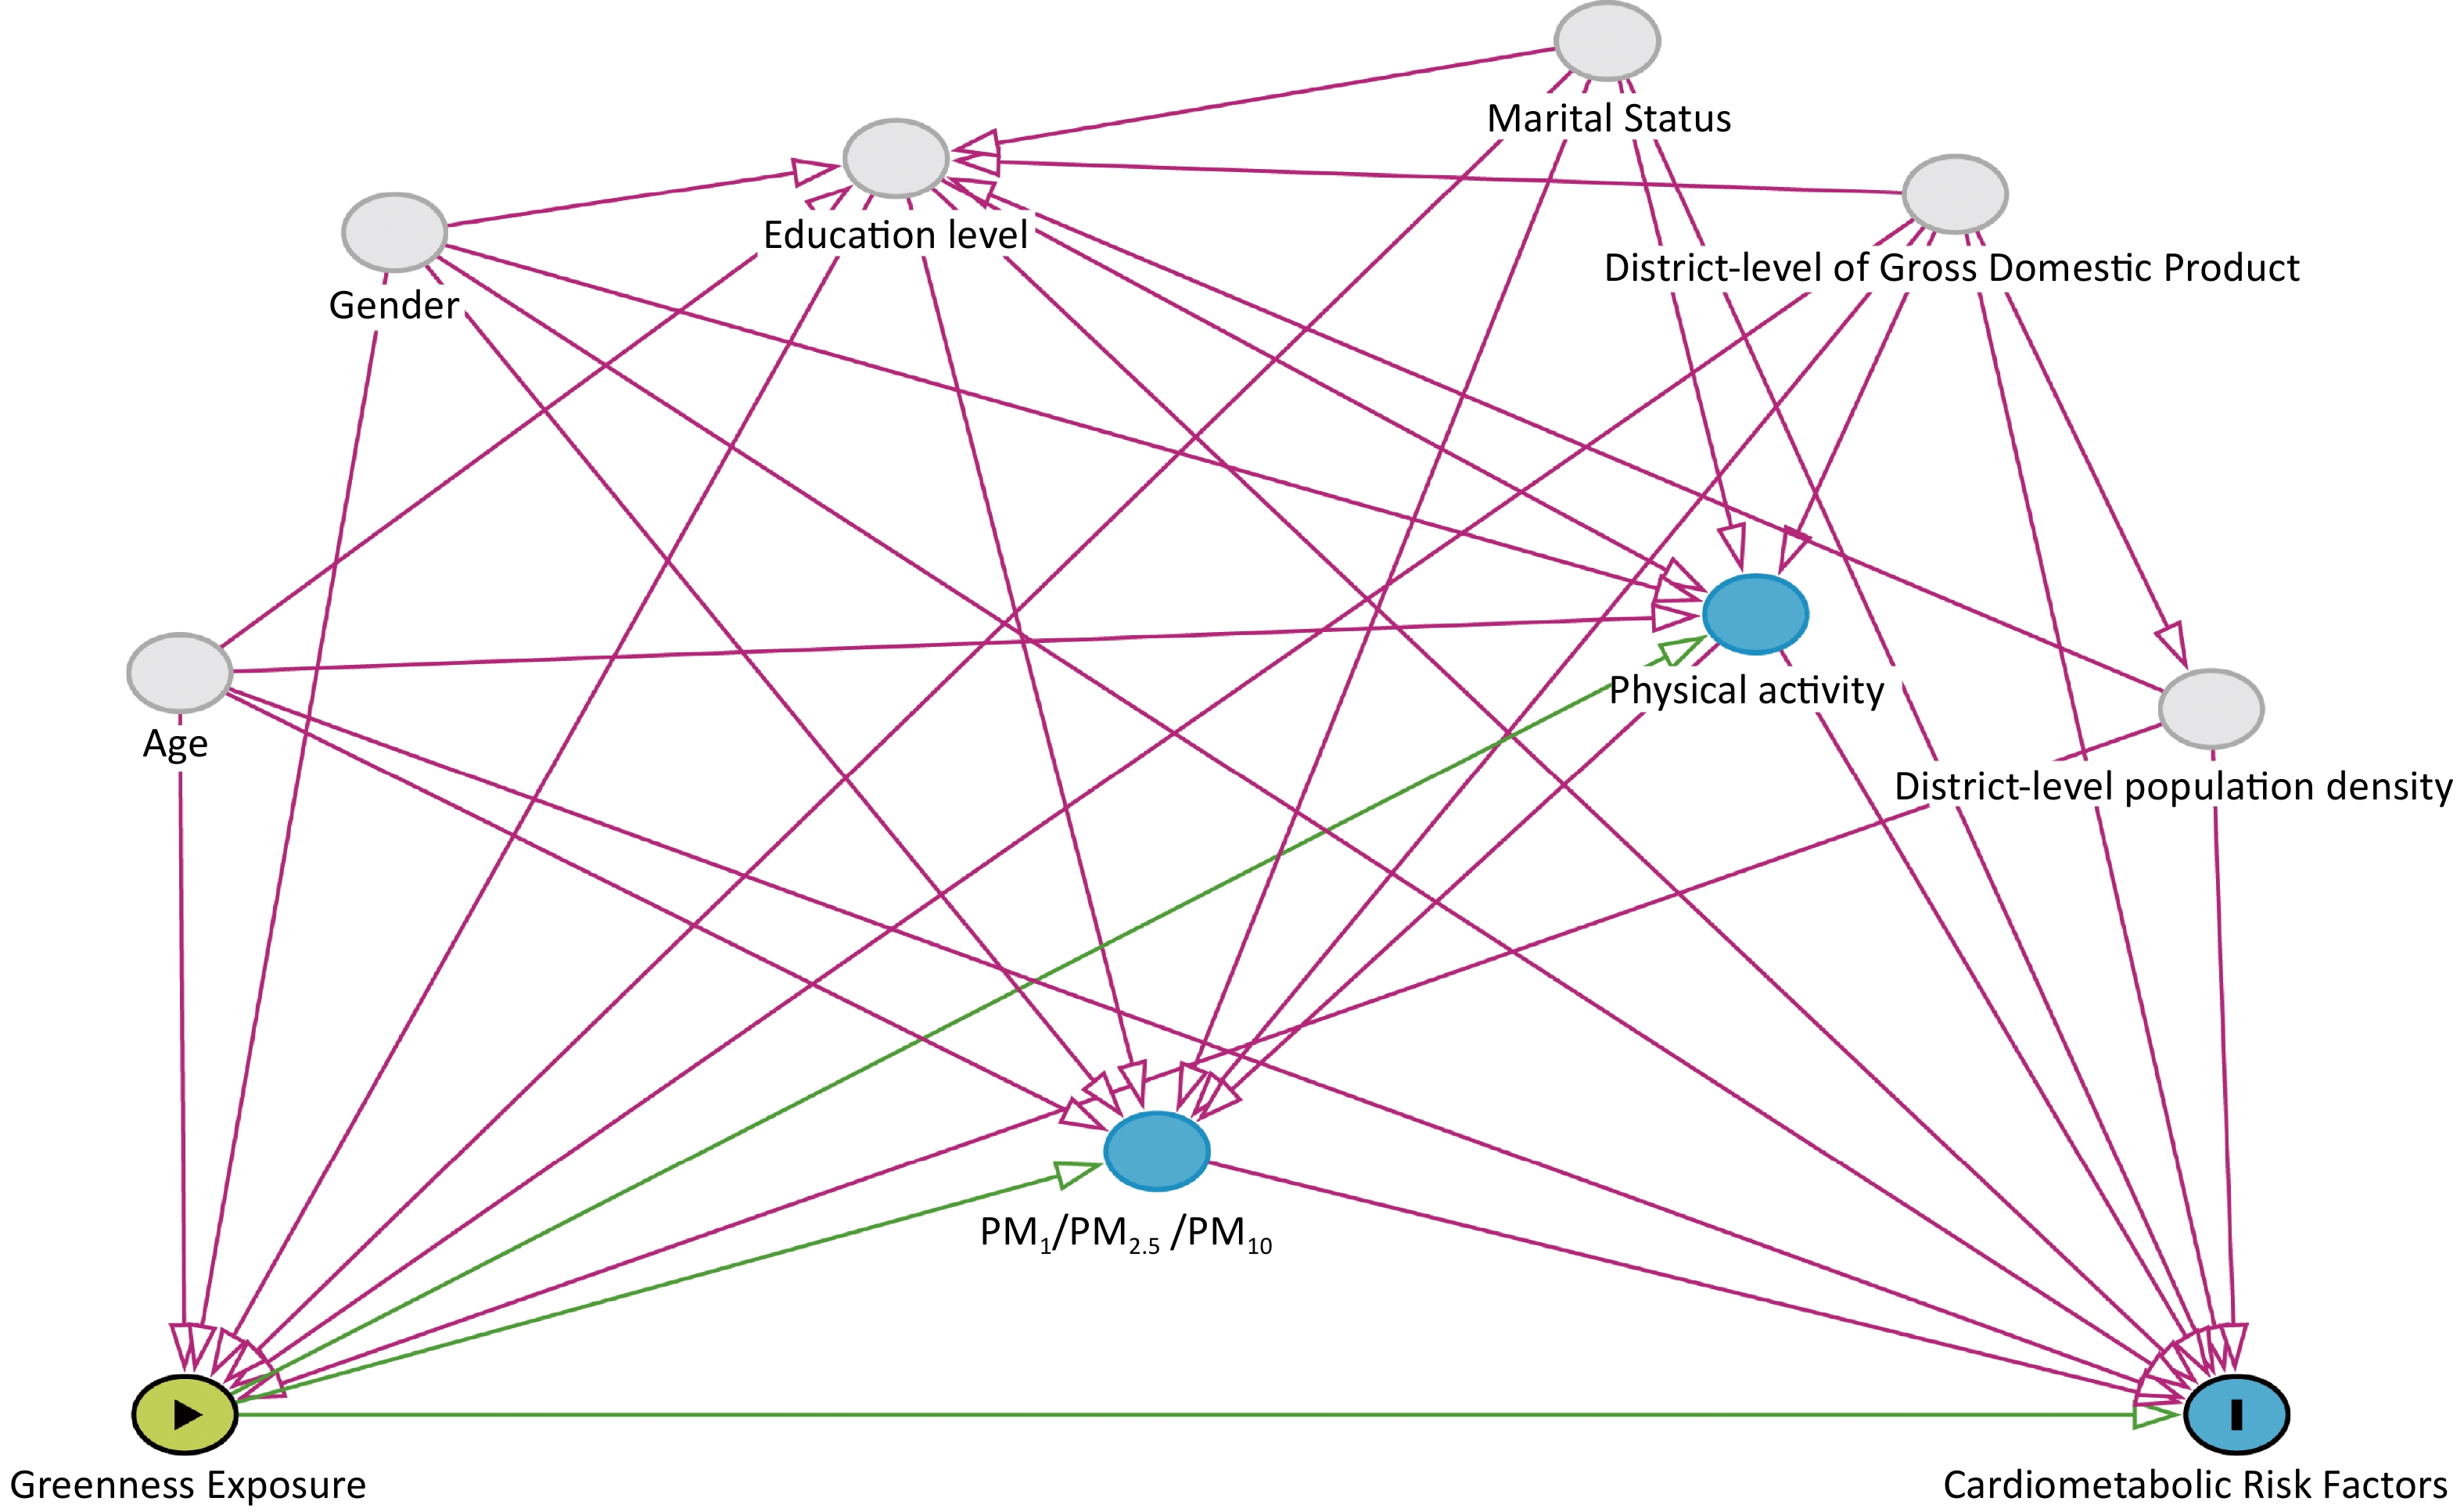
We identified common confounders of residential greenness and cardiometabolic risk factors from the literature and incorporated them into a directed acyclic graph (DAG) using DAGitty v3.1 software (www.dagitty.net). Based on Supplementary Figure S2 (available in www.besjournal.com), we identified the following variables as confounders: age (≤ 50 years vs. > 50 years), sex (men vs. women), education level (primary school and below vs. junior high school and above), marital status (single/divorced/widowed vs. married), district level of Gross Domestic Product (divided into 3 levels, namely, quantile 1, quantile 2, and quantile 3), and district level of population density (divided into 3 levels, namely, quantile 1, quantile 2, and quantile 3). Age, sex, education level, and marital status information was obtained through questionnaires. The district-level population density data were obtained from LandScan Population Data Explorer (https://landscan.ornl.gov/[2023-08-28]). The district-level GDP data were obtained from Zhao’s research[30].
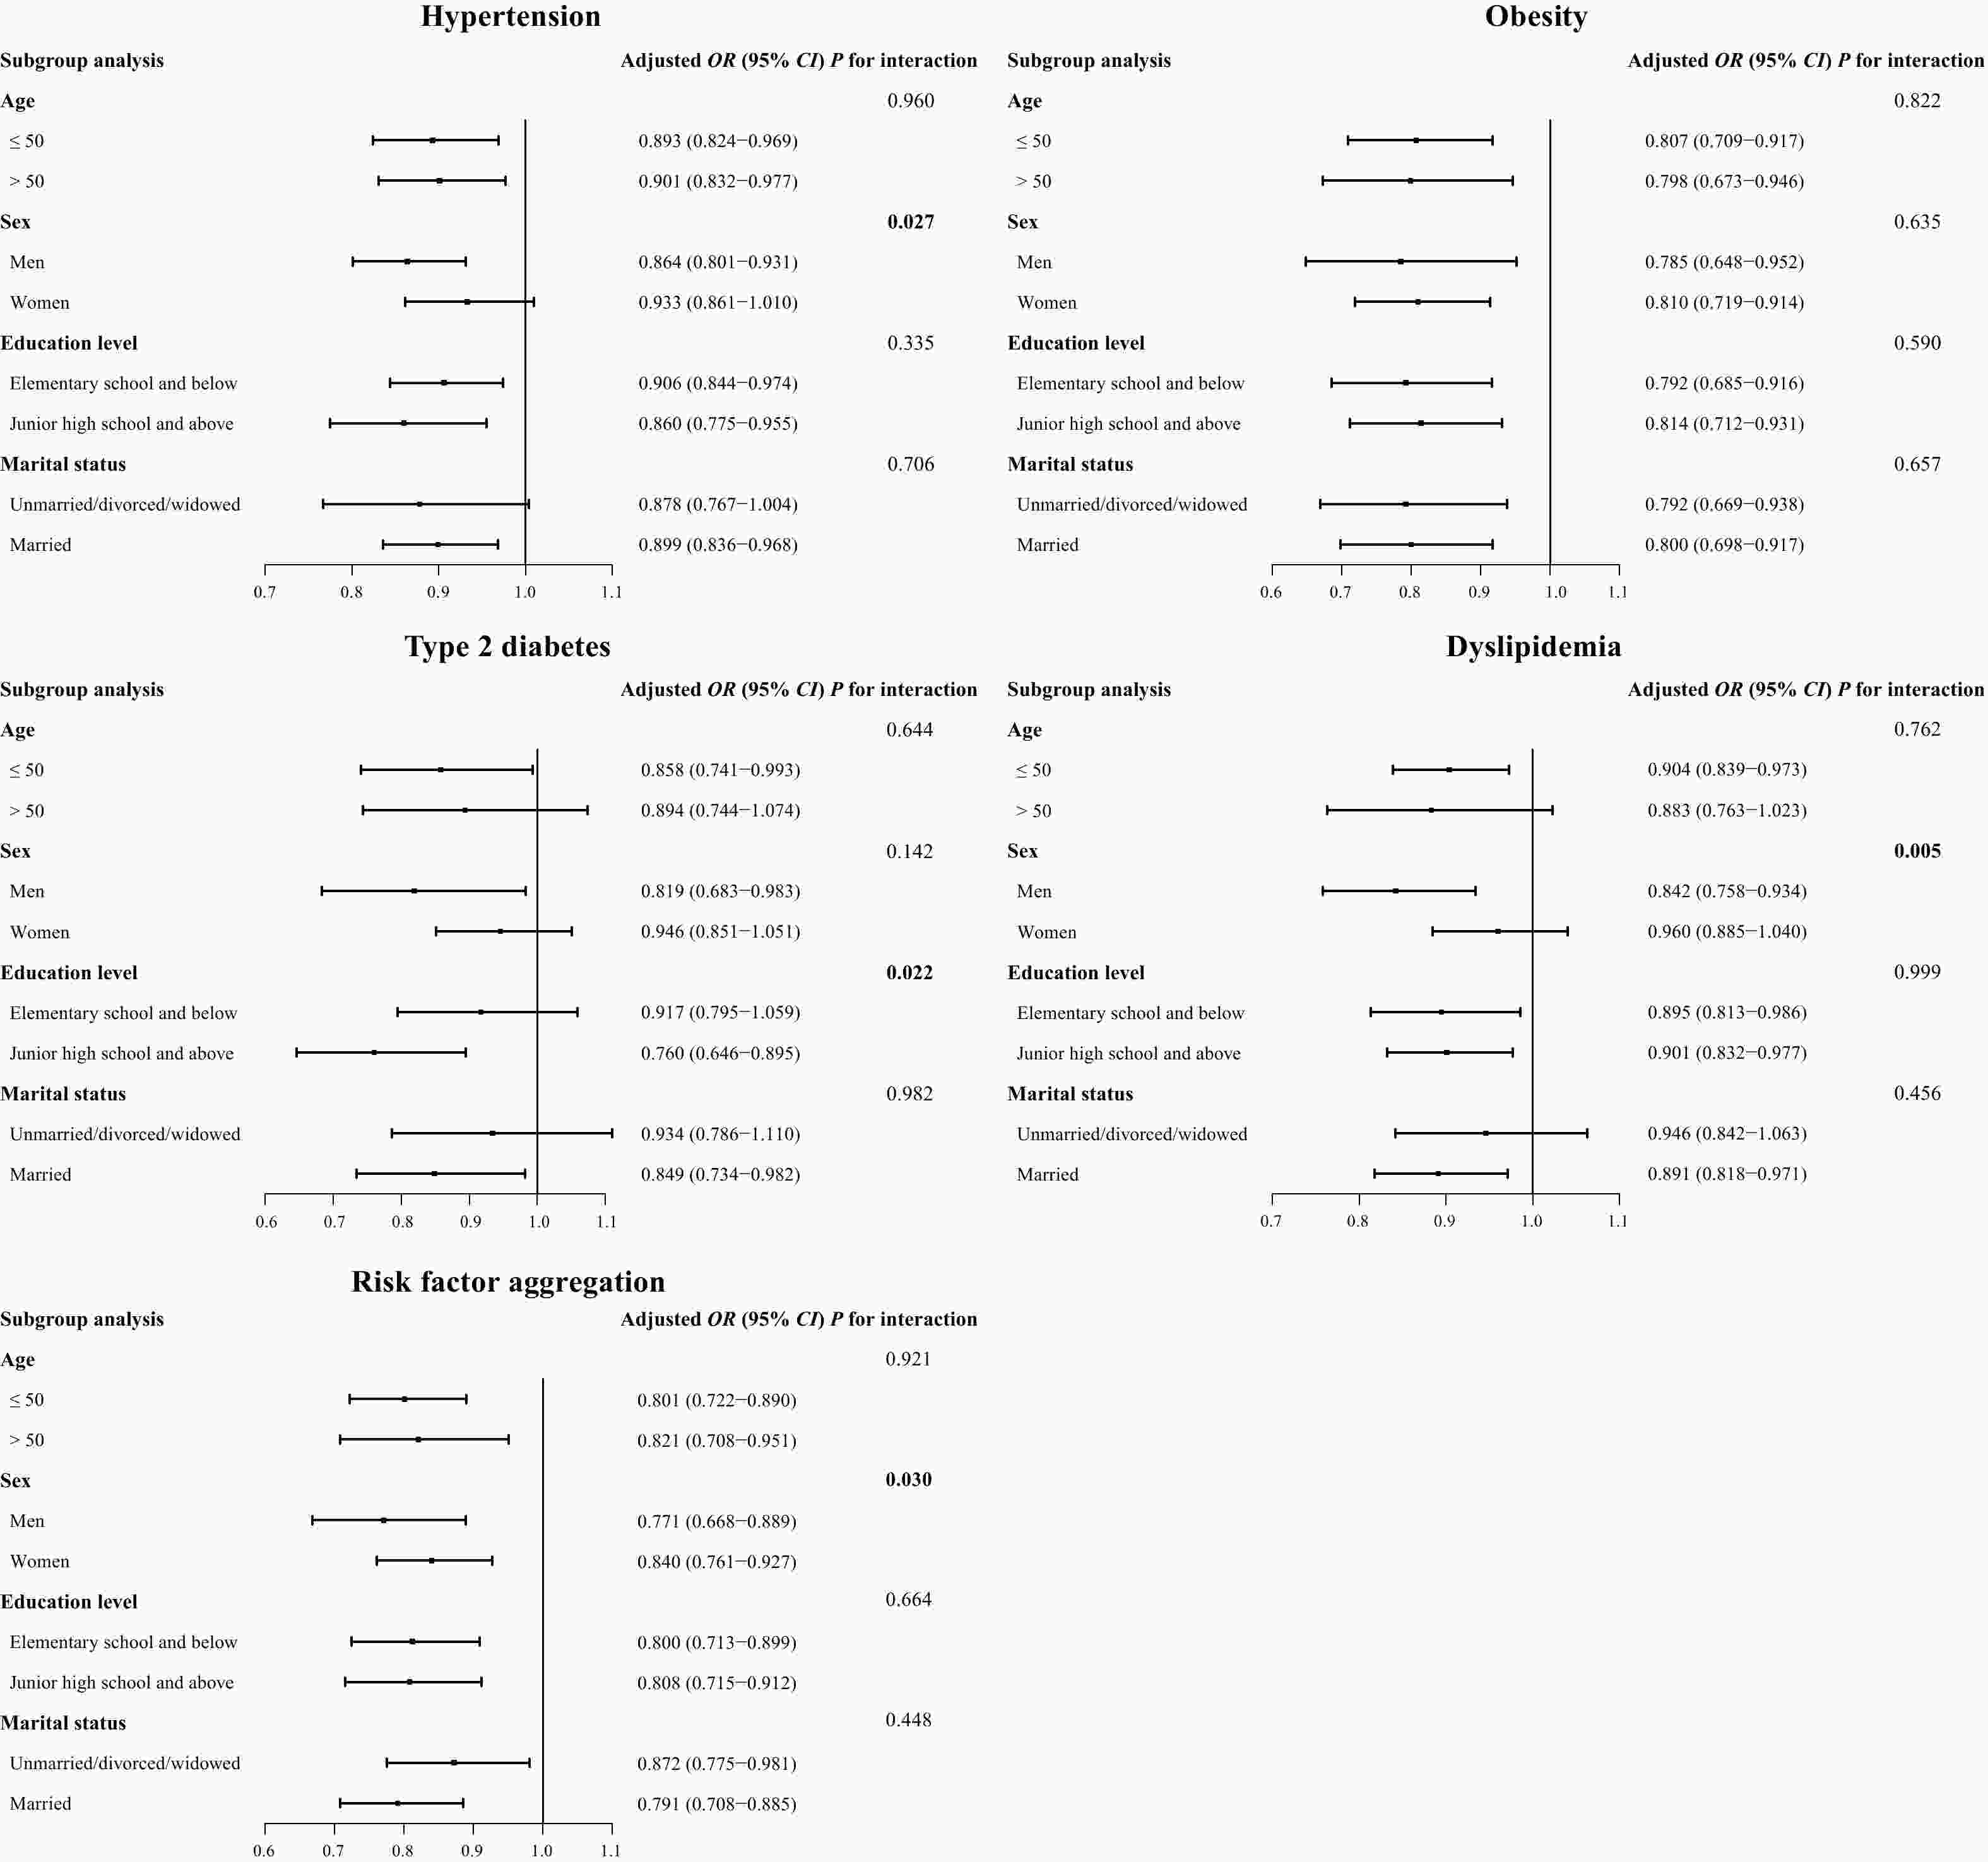
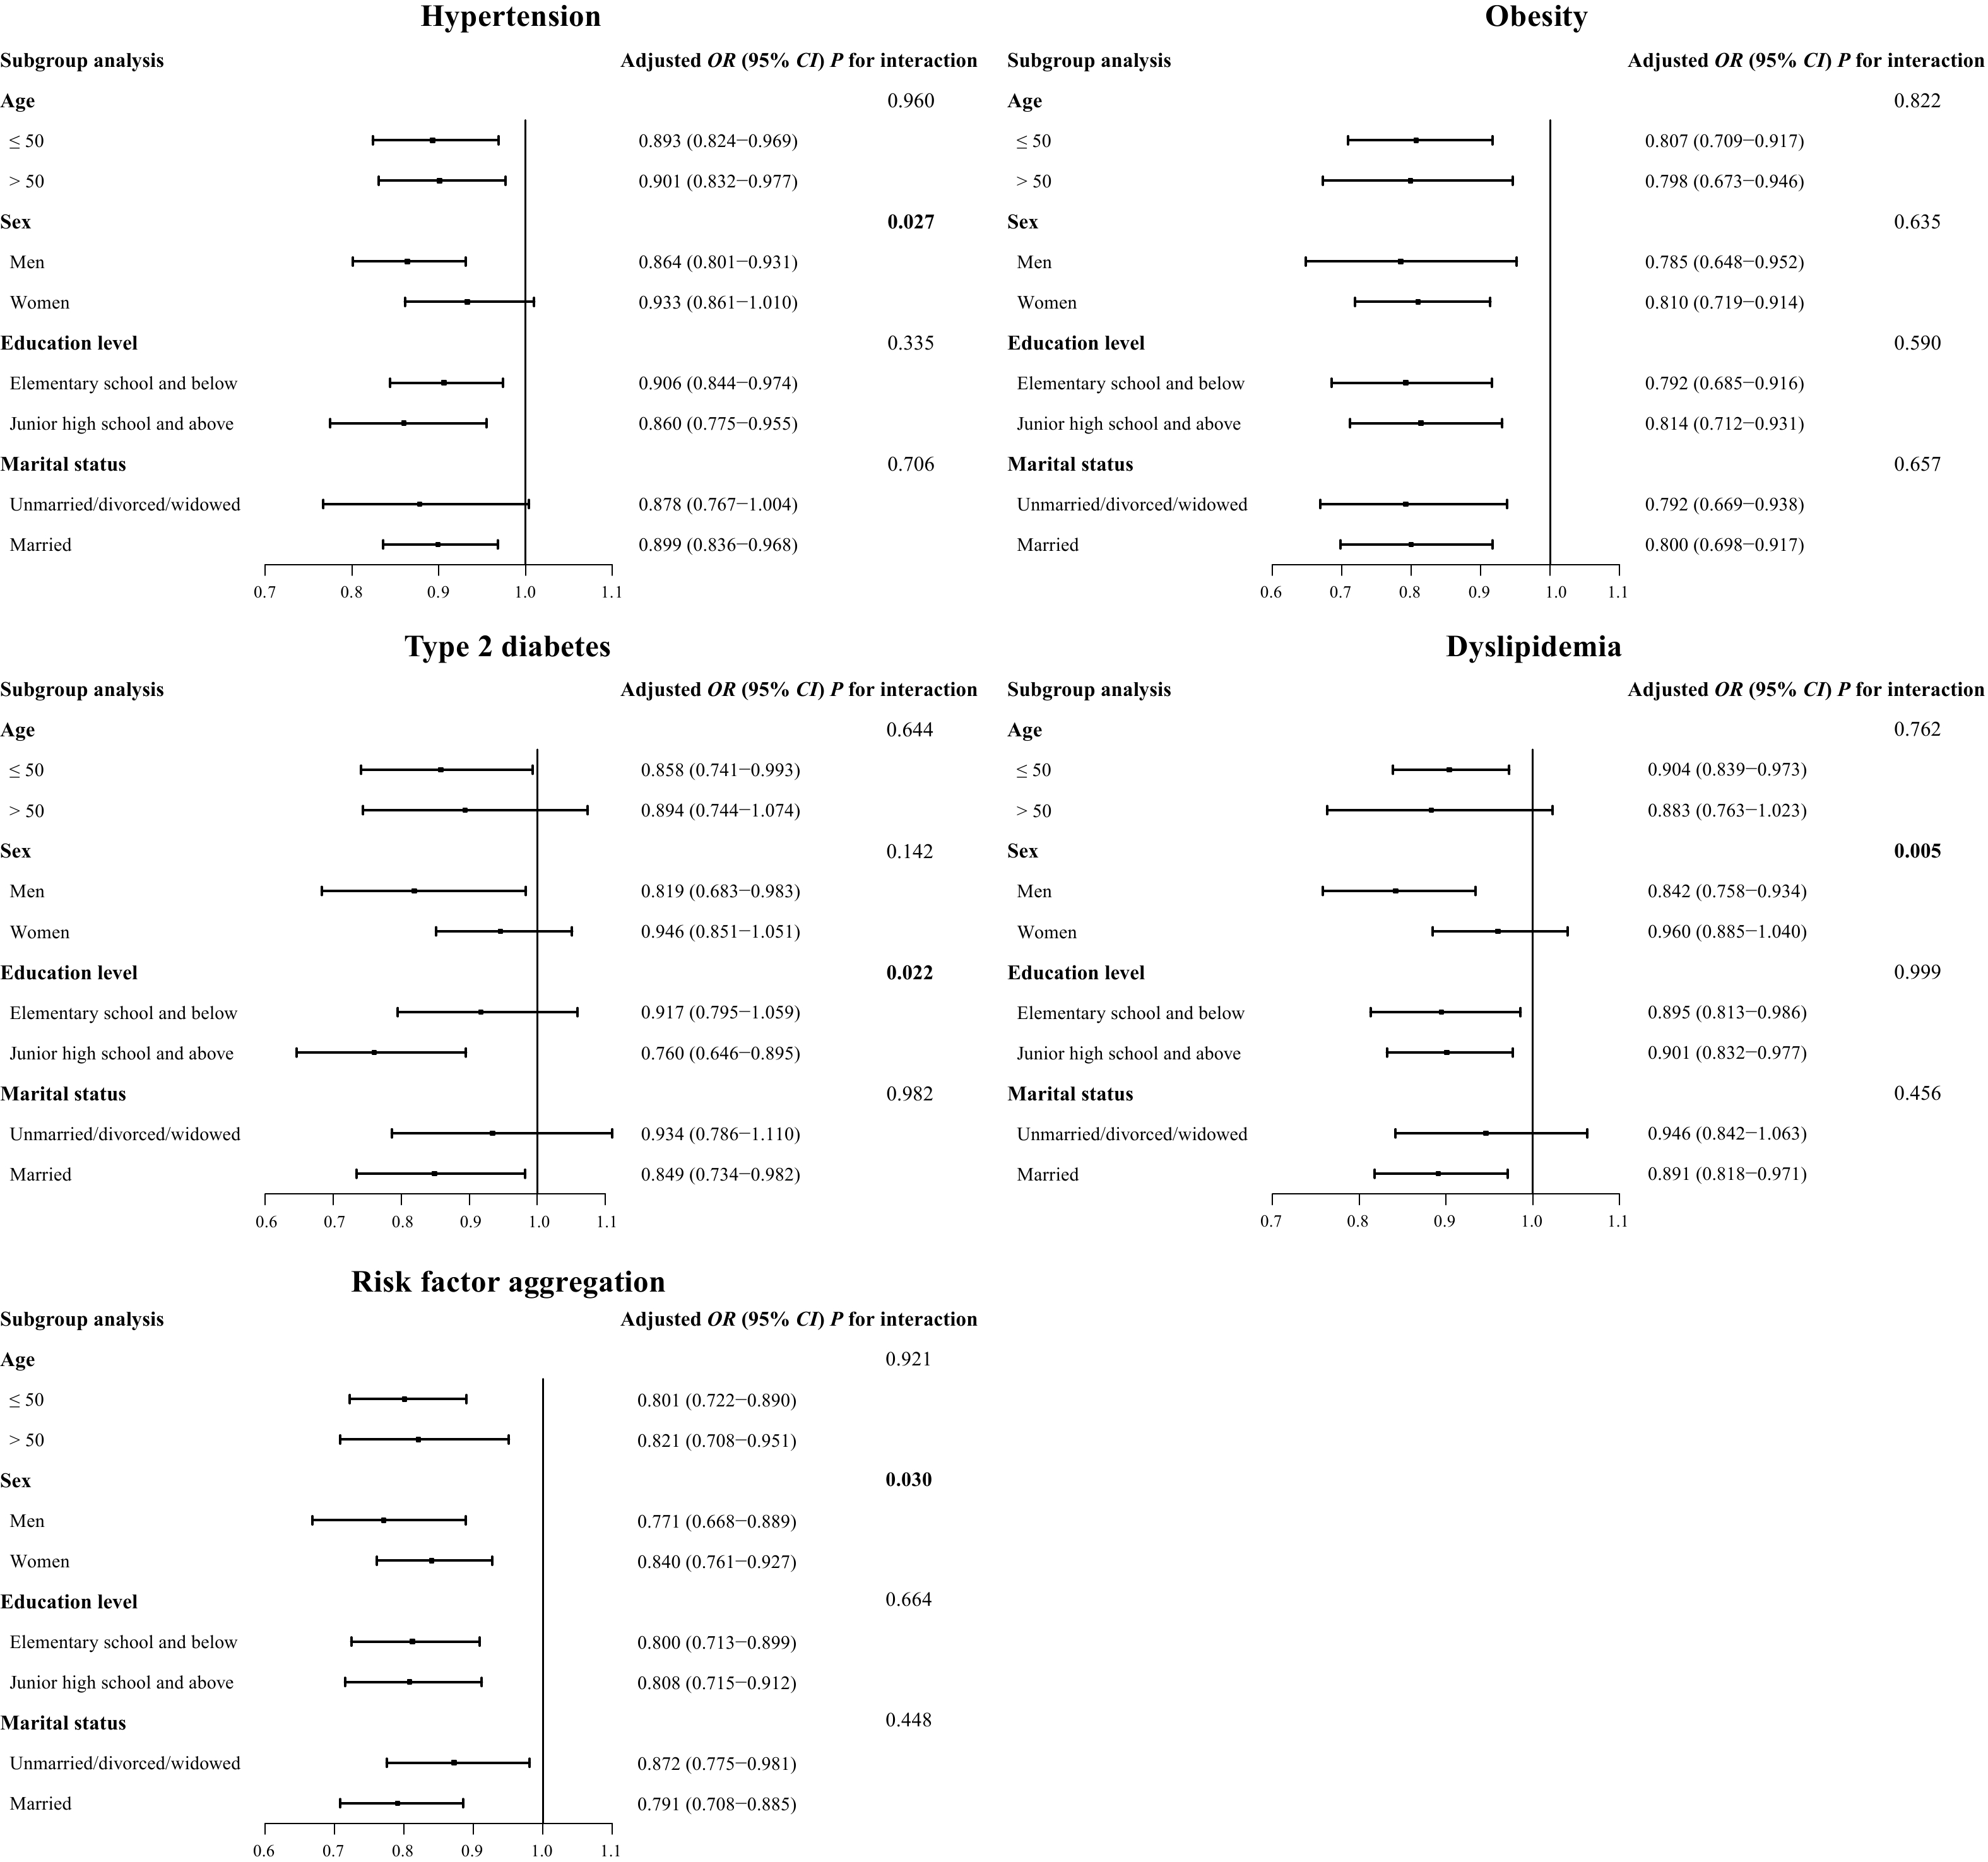
Figure 2. Association of residential greenness (per IQR increase) with cardiometabolic risk factors, stratified by age, sex, education level, and marital status.
In addition, air pollutants such as submicron particulate matter (PM1), fine particulate matter (PM2.5), inhalable particulate matter (PM10) and physical activity levels were identified as potential mediator variables. Air pollutant data were extracted from the ChinaHighPM1 dataset[31], ChinaHighPM2.5 dataset[32,33], and ChinaHighPM10 dataset[34] created by Wei Jing et al. They are long-term, full-coverage, high-resolution, high-quality ground air pollutant datasets of China. These datasets account for the temporal heterogeneity of air pollution, and artificial intelligence is used to generate them from big data such as ground measurements, satellite remote sensing products, atmospheric analysis, and model simulations. The resolution of these datasets is 1 km. We calculated the 3-year average concentrations of air pollutants from 2014 to 2016 as a proxy for long-term air pollutant exposure. Physical activity levels were assessed based on the following questions: 1) Do you usually do strenuous physical activity, with each session lasting more than 10 minutes (such as farm work)? If so, on average, how long do you spend daily on strenuous physical activity? 2) Do you usually do moderate-intensity physical activities, with each session lasting more than 10 minutes (such as housework). If so, on average, how long do you spend daily on physical activities of this intensity? 3) Do you usually do low-intensity physical activities, with each session lasting more than 10 minutes (such as walking)? If so, on average, how long do you spend daily on physical activities of this intensity? Subsequently, we categorized physical activity levels as high (180 min or more per week of any level of physical activity) or low (not meeting the above criteria).
-
Continuous variables were described using mean ± standard deviation or median ± interquartile range, and two independent sample t-tests or Mann-Whitney U tests were used for comparison between groups; categorical variables were described using frequency and composition ratio, and the χ2 test was used for comparison between groups. The correlation of the NDVI for different buffer ranges was analyzed using Spearman rank correlation. The generalized linear mixed model (GLMM) was used to explore the association of residential greenness per interquartile range (IQR) increase with cardiometabolic risk factors. In the GLMM analysis, the community/company where the subjects lived was used as a random effect, and the residential greenness and covariates were used as fixed effects. We constructed 3 models: Model 1: crude model; Model 2 (Main model): with adjustments for age, sex, education level, and marital status; Model 3: Adjusted Model 2 + district level of GDP and district level of population density (Supplementary Figure S2). We categorized the primary analytical measure, NDVI500-m, into quartiles and explored non-linear associations using the first quartile as a reference. Subsequently, we conducted sensitivity analyses as well to ensure the stability of the results. After adjusting the main model, we further adjusted for 1) smoking (defined as smoking more than 100 cigarettes in total[35]); 2) drinking (defined as drinking alcoholic beverages at least twice a month[36]); and 3) family history of cardiometabolic risk factors (defined as at least one of the subject’s parents or siblings having hypertension, diabetes, or cardiovascular disease before the survey). Subgroup analysis was used to explore the potential association of each stratification factor (age, sex, education level, and marital status) between residential greenness and cardiometabolic risk factors. An interaction item (such as NDVI*age) was added to the model to test the interaction effect. If the interaction item in the regression model is statistically significant, an interaction effect is considered to exist. Finally, we explored the mediating effects of air pollutants (PM1, PM2.5, and PM10) and physical activity levels on the association between NDVI500-m and cardiometabolic risk factors using the mediation package of R software. All statistical analyses were performed using R software (version 4.1.2, http://www.r-project.org/).
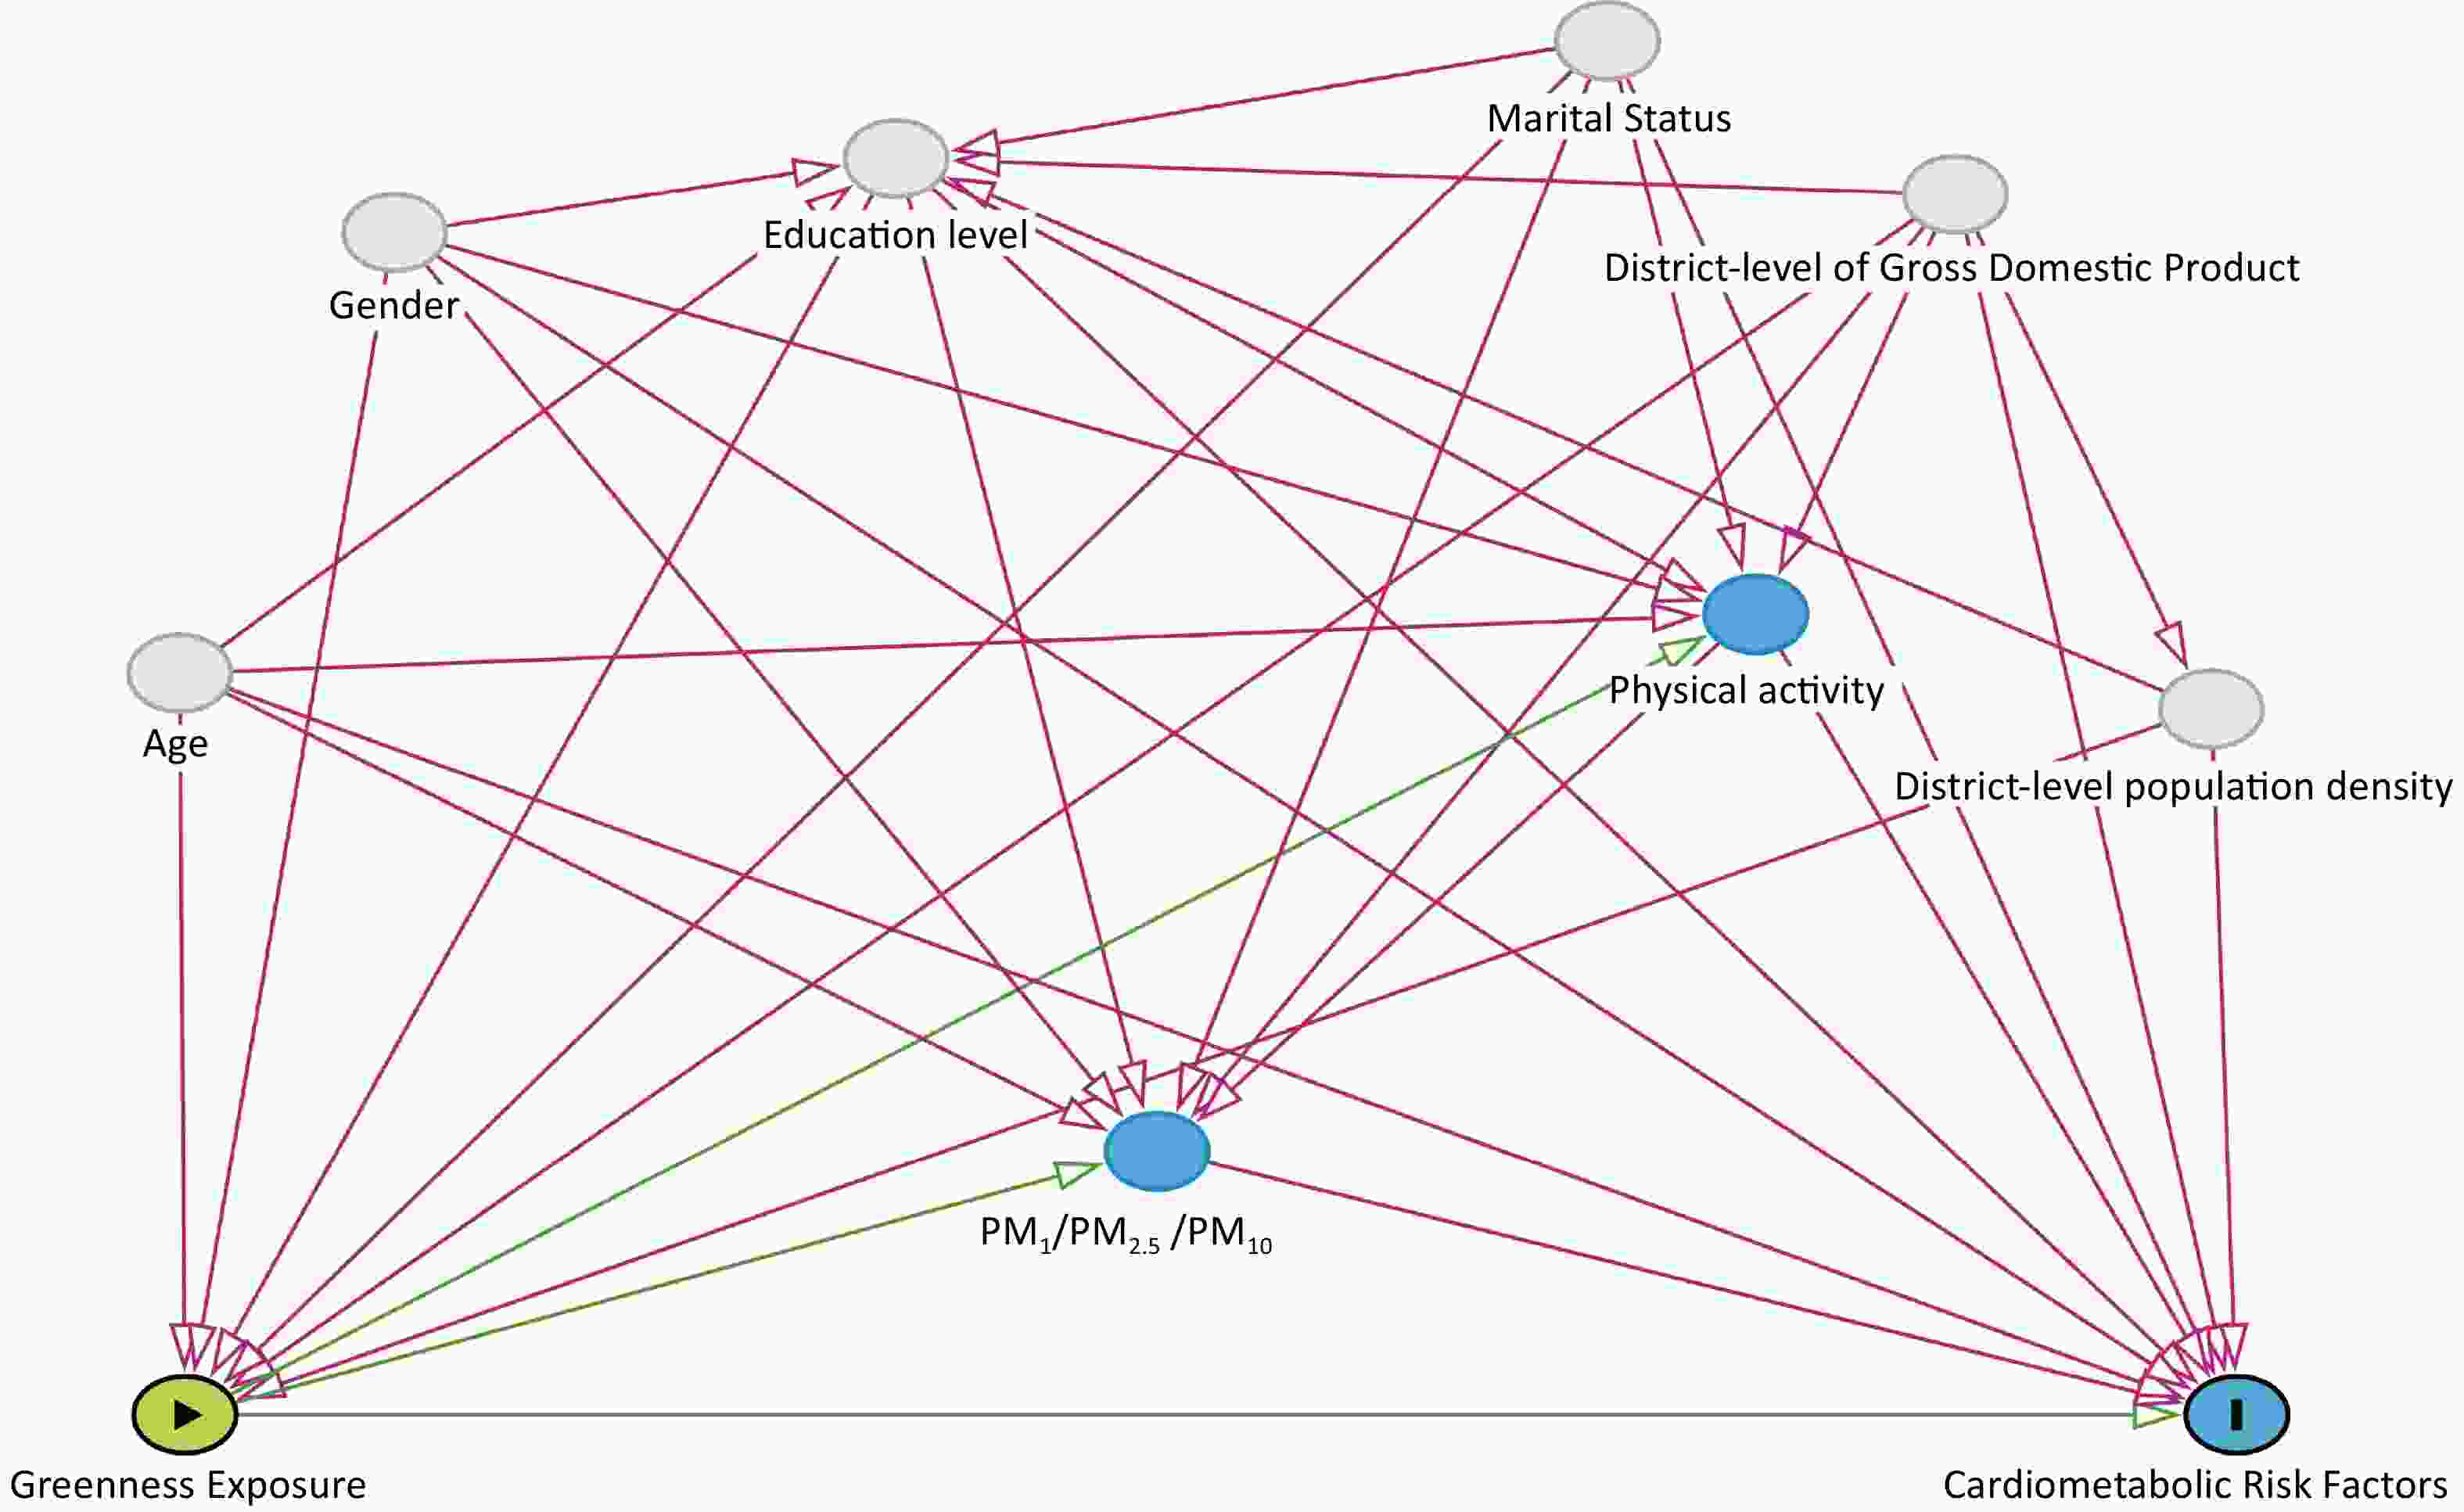
Figure S2. Directed acyclic graph for the association between residential greenness and cardiometabolic risk factors, showing potential confounders and mediators.
-
A total of 9,723 research subjects were included in the final data analysis. Of these subjects, 7,718 were ≤ 50 years old (79.4%), and 2,005 subjects (20.6%) were > 50 years old. There were 4,722 male subjects (48.6%) and 5,001 female participants (51.4%). The survey results revealed that the education level of 6,835 participants (70.3%) was primary school or below, and a total of 8,164 participants (84.0%) were married. The prevalence rates of hypertension, obesity, type 2 diabetes, dyslipidemia, and risk factor aggregation were 28.5%, 32.5%, 8.8%, 34.0%, and 30.1%, respectively. The BMI, WC, SBP, DBP, TC, TG, LDL-C, and FPG of subjects with cardiometabolic risk factors were significantly higher than that of subjects without cardiometabolic risk factors (all P < 0.001) (Table 1). The NDVI500-m range was 0.15–0.37. Furthermore, significant correlations were observed across the buffer ranges of the NDVI, and the Spearman correlation coefficients ranged from 0.688 to 0.944 across the buffer ranges of the NDVI (Supplementary Table S1, available in www.besjournal.com).
Variables Total (n = 9,723) Cardiometabolic risk factors
(n = 6,101)Non-cardiometabolic risk
factors (n = 3,622)P value Age (years), N (%) < 0.001 ≤ 50 7,718 (79.4) 4,446 (72.9) 3,272 (90.3) > 50 2,005 (20.6) 1,655 (27.1) 350 (9.7) Sex, N (%) < 0.001 Men 4,722 (48.6) 3,054 (50.1) 1,668 (46.1) Women 5,001 (51.4) 3,047 (49.9) 1,954 (53.9) Education level, N (%) < 0.001 Elementary school or below 6,835 (70.3) 4,568 (74.9) 2,267 (62.6) Junior high school and above 2,888 (29.7) 1,533 (25.1) 1,355 (37.4) Marital status, N (%) < 0.001 Windowed/single/divorced/separated 1,559 (16.0) 860 (14.1) 699 (19.3) Married 8,164 (84.0) 5,241 (85.9) 2,923 (80.7) Physical activity, N (%) 0.854 Low 7,149 (73.5) 4,482 (73.5) 2,667 (73.6) High 2,574 (26.5) 1,619 (26.5) 955 (26.4) BMI (kg/m2), mean ± SD 26.3 ± 5.0 28.1 ± 5.1 23.1 ± 2.7 < 0.001 WC (cm), mean ± SD 92.4 ± 14.6 96.6 ± 14.2 85.3 ± 12.2 < 0.001 SBP (mmHg), mean ± SD 129.3 ± 20.6 136.0 ± 21.8 117.8 ± 11.5 < 0.001 DBP (mmHg), mean ± SD 75.0 ± 12.5 78.2 ± 13.1 69.6 ± 9.0 < 0.001 FPG (mmol/L), median ± IQR 4.75 ± 1.20 4.88 ± 1.30 4.60 ± 1.00 < 0.001 TC (mmol/L), median ± IQR 4.61 ± 1.43 4.87 ± 1.53 4.25 ± 1.15 < 0.001 TG (mmol/L), median ± IQR 1.38 ± 1.20 1.72 ± 1.57 1.06 ± 0.70 < 0.001 LDL-C (mmol/L), median ± IQR 2.53 ± 1.16 2.70 ± 1.20 2.33 ± 0.99 < 0.001 HDL-C(mmol/L), median ± IQR 1.39 ± 0.68 1.33 ± 0.67 1.48 ± 0.71 < 0.001 NDVI250-m, mean ± SD 0.25 ± 0.06 0.24 ± 0.06 0.25 ± 0.06 < 0.001 NDVI500-m, mean ± SD 0.28 ± 0.06 0.27 ± 0.06 0.28 ± 0.06 < 0.001 NDVI1000-m, mean ± SD 0.31 ± 0.05 0.30 ± 0.05 0.31 ± 0.05 < 0.001 Note. BMI, body mass index; WC, waist circumference; SBP, systolic blood pressure; DBP, diastolic blood pressure; FPG, fasting plasma glucose; TC, total cholesterol; TG, triglyceride; LDL-C, low-density lipoprotein cholesterol; HDL-C, high-density lipoprotein cholesterol; NDVI, normalized difference vegetation index. Table 1. Basic characteristics of the participants according to the cardiometabolic risk factors
-
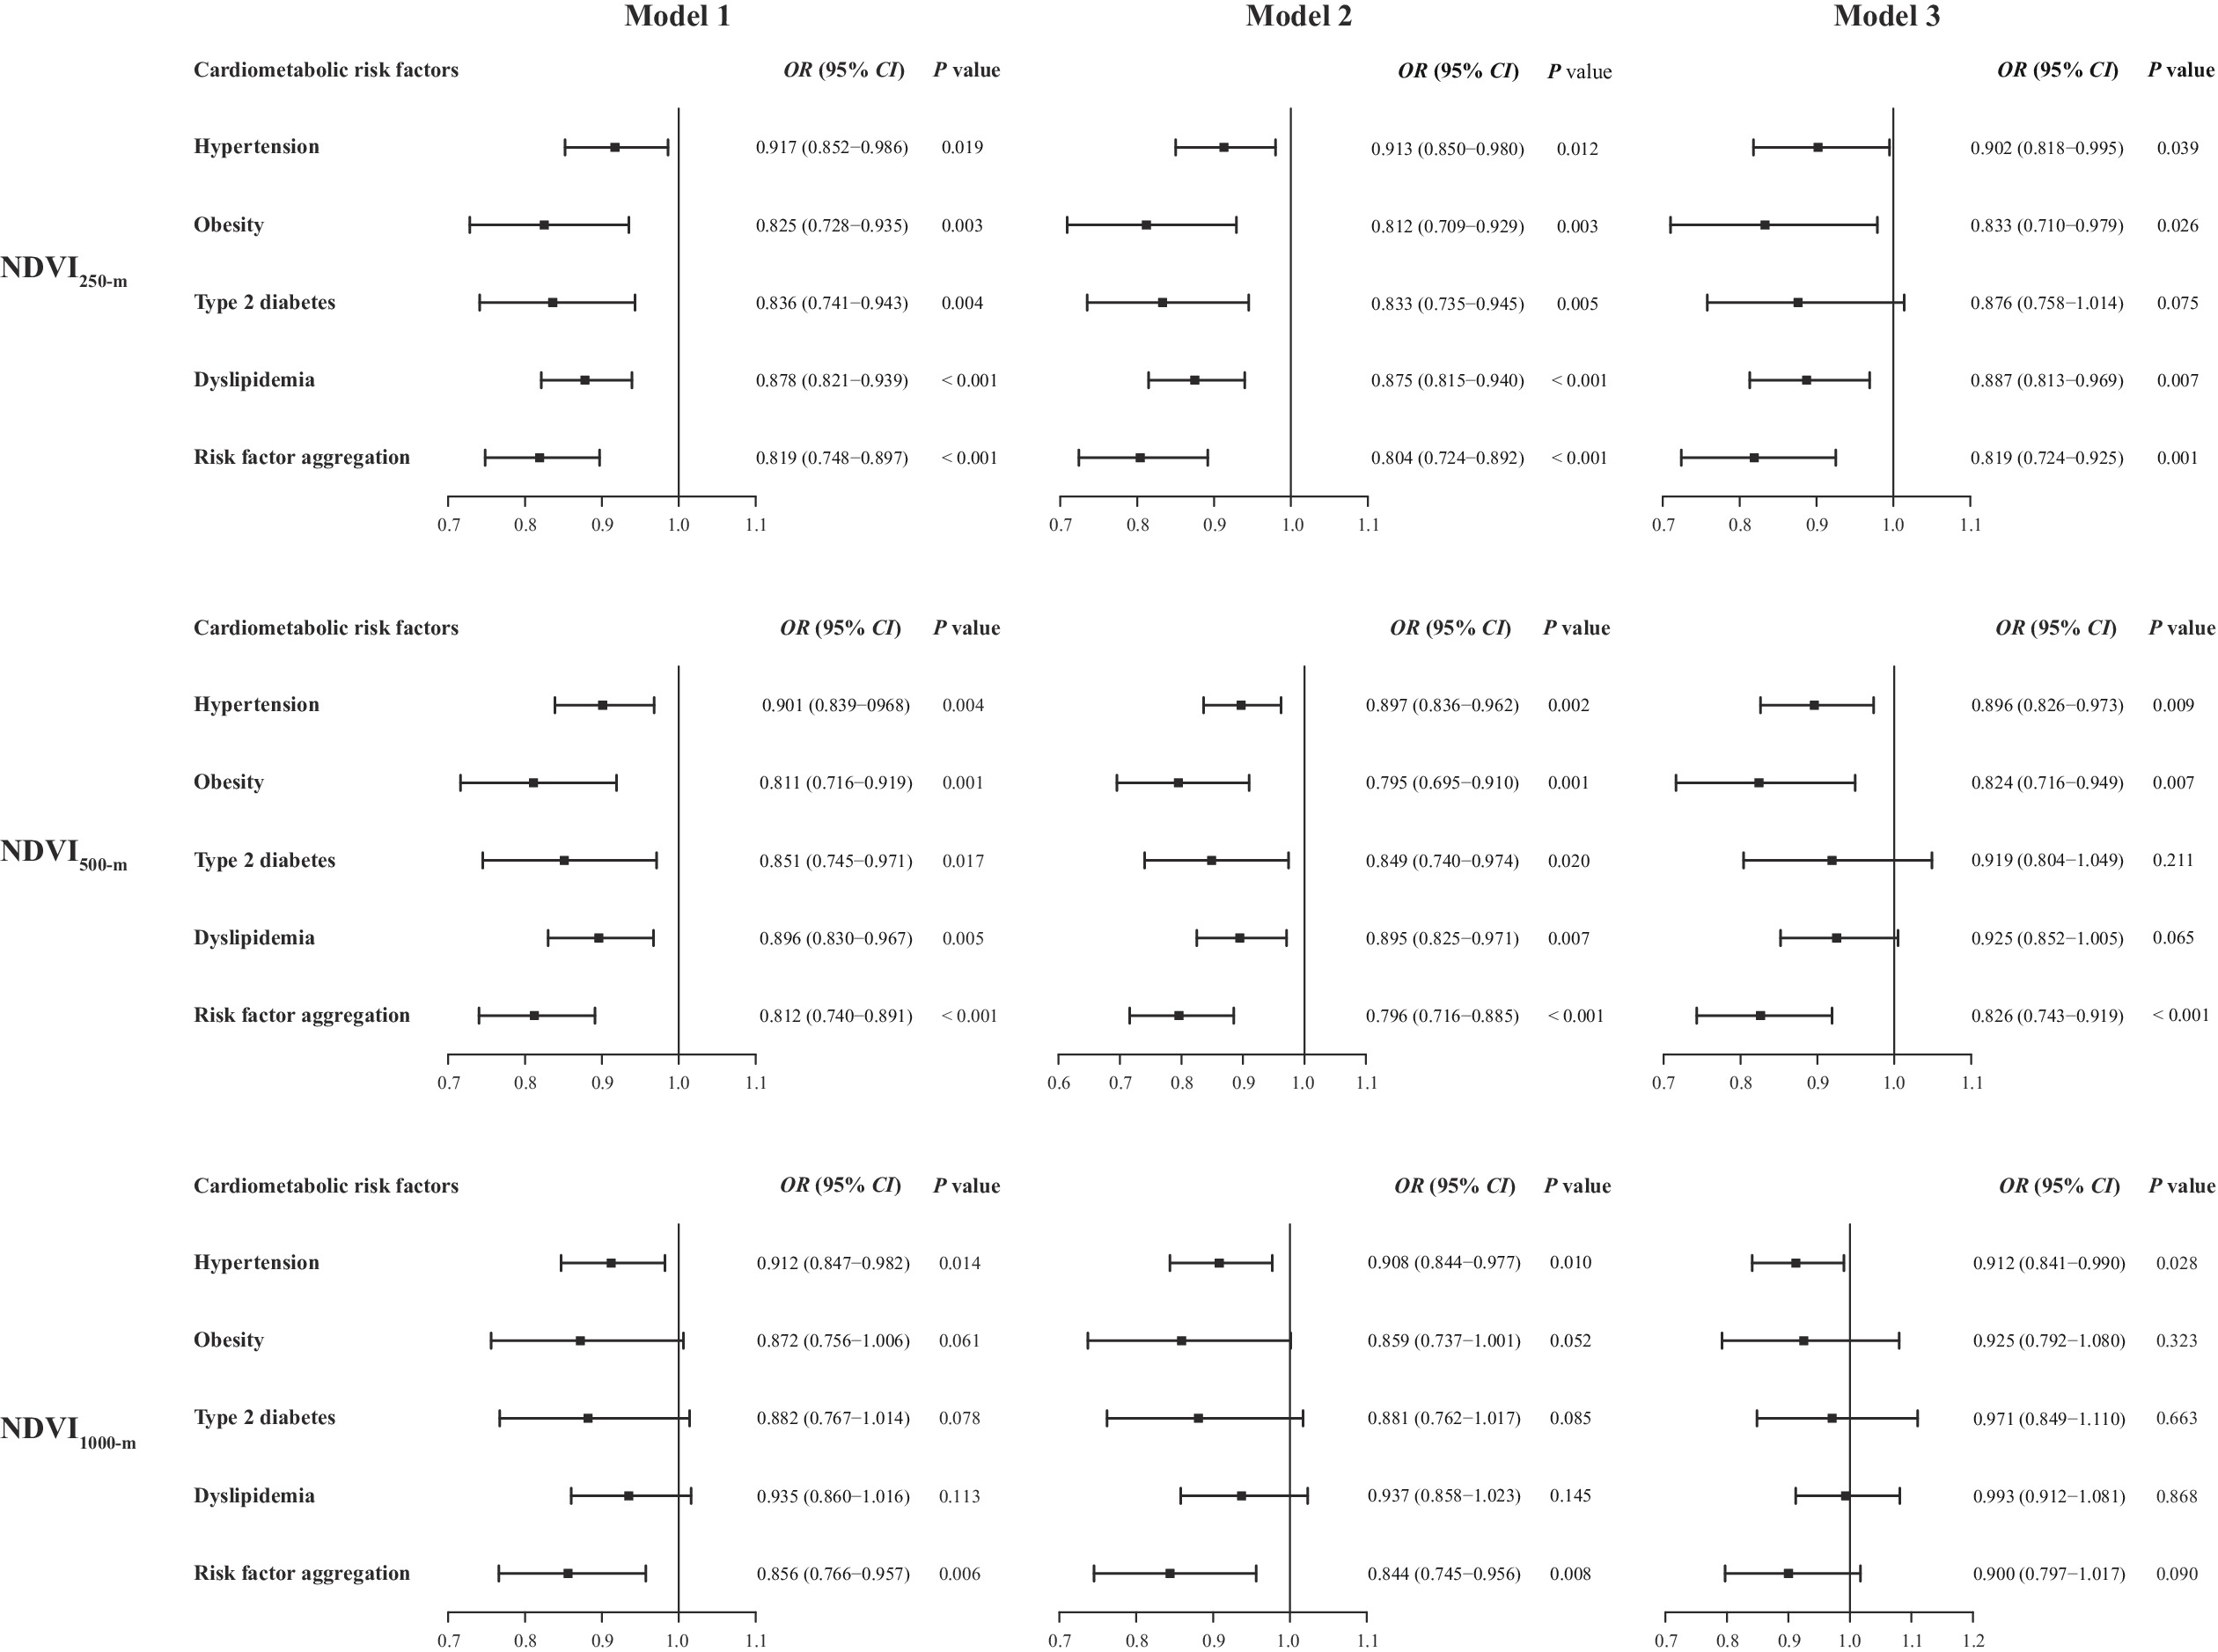
Figure 1 shows the association of the different buffer ranges of the NDVI with cardiometabolic risk factors. After adjusting for age, sex, education, and marital status (Model 2), for each interquartile range (IQR) increase of NDVI500-m, the risk of hypertension was reduced by 10.3% (OR = 0.897, 95% CI = 0.836–0.962), the risk of obesity was reduced by 20.5% (OR = 0.795, 95% CI = 0.695–0.910), the risk of type 2 diabetes was reduced by 15.1% (OR = 0.849, 95% CI = 0.740–0.974), the risk of dyslipidemia was reduced by 10.5% (OR = 0.895, 95% CI = 0.825–0.971), and the risk factor aggregation was reduced by 20.4% (OR = 0.796, 95% CI = 0.716–0.885). After further adjustments for the district levels of GDP and population density, the association of NDVI500-m with type 2 diabetes and dyslipidemia was not statistically significant. However, after additional adjustment for the district levels of population density and GDP, NDVI250-m still had a significant protective effect against hypertension, obesity, dyslipidemia, and risk factor aggregation. Furthermore, NDVI1000-m was only associated with hypertension and risk factor aggregation in Models 1 and 2 (Figure 1).
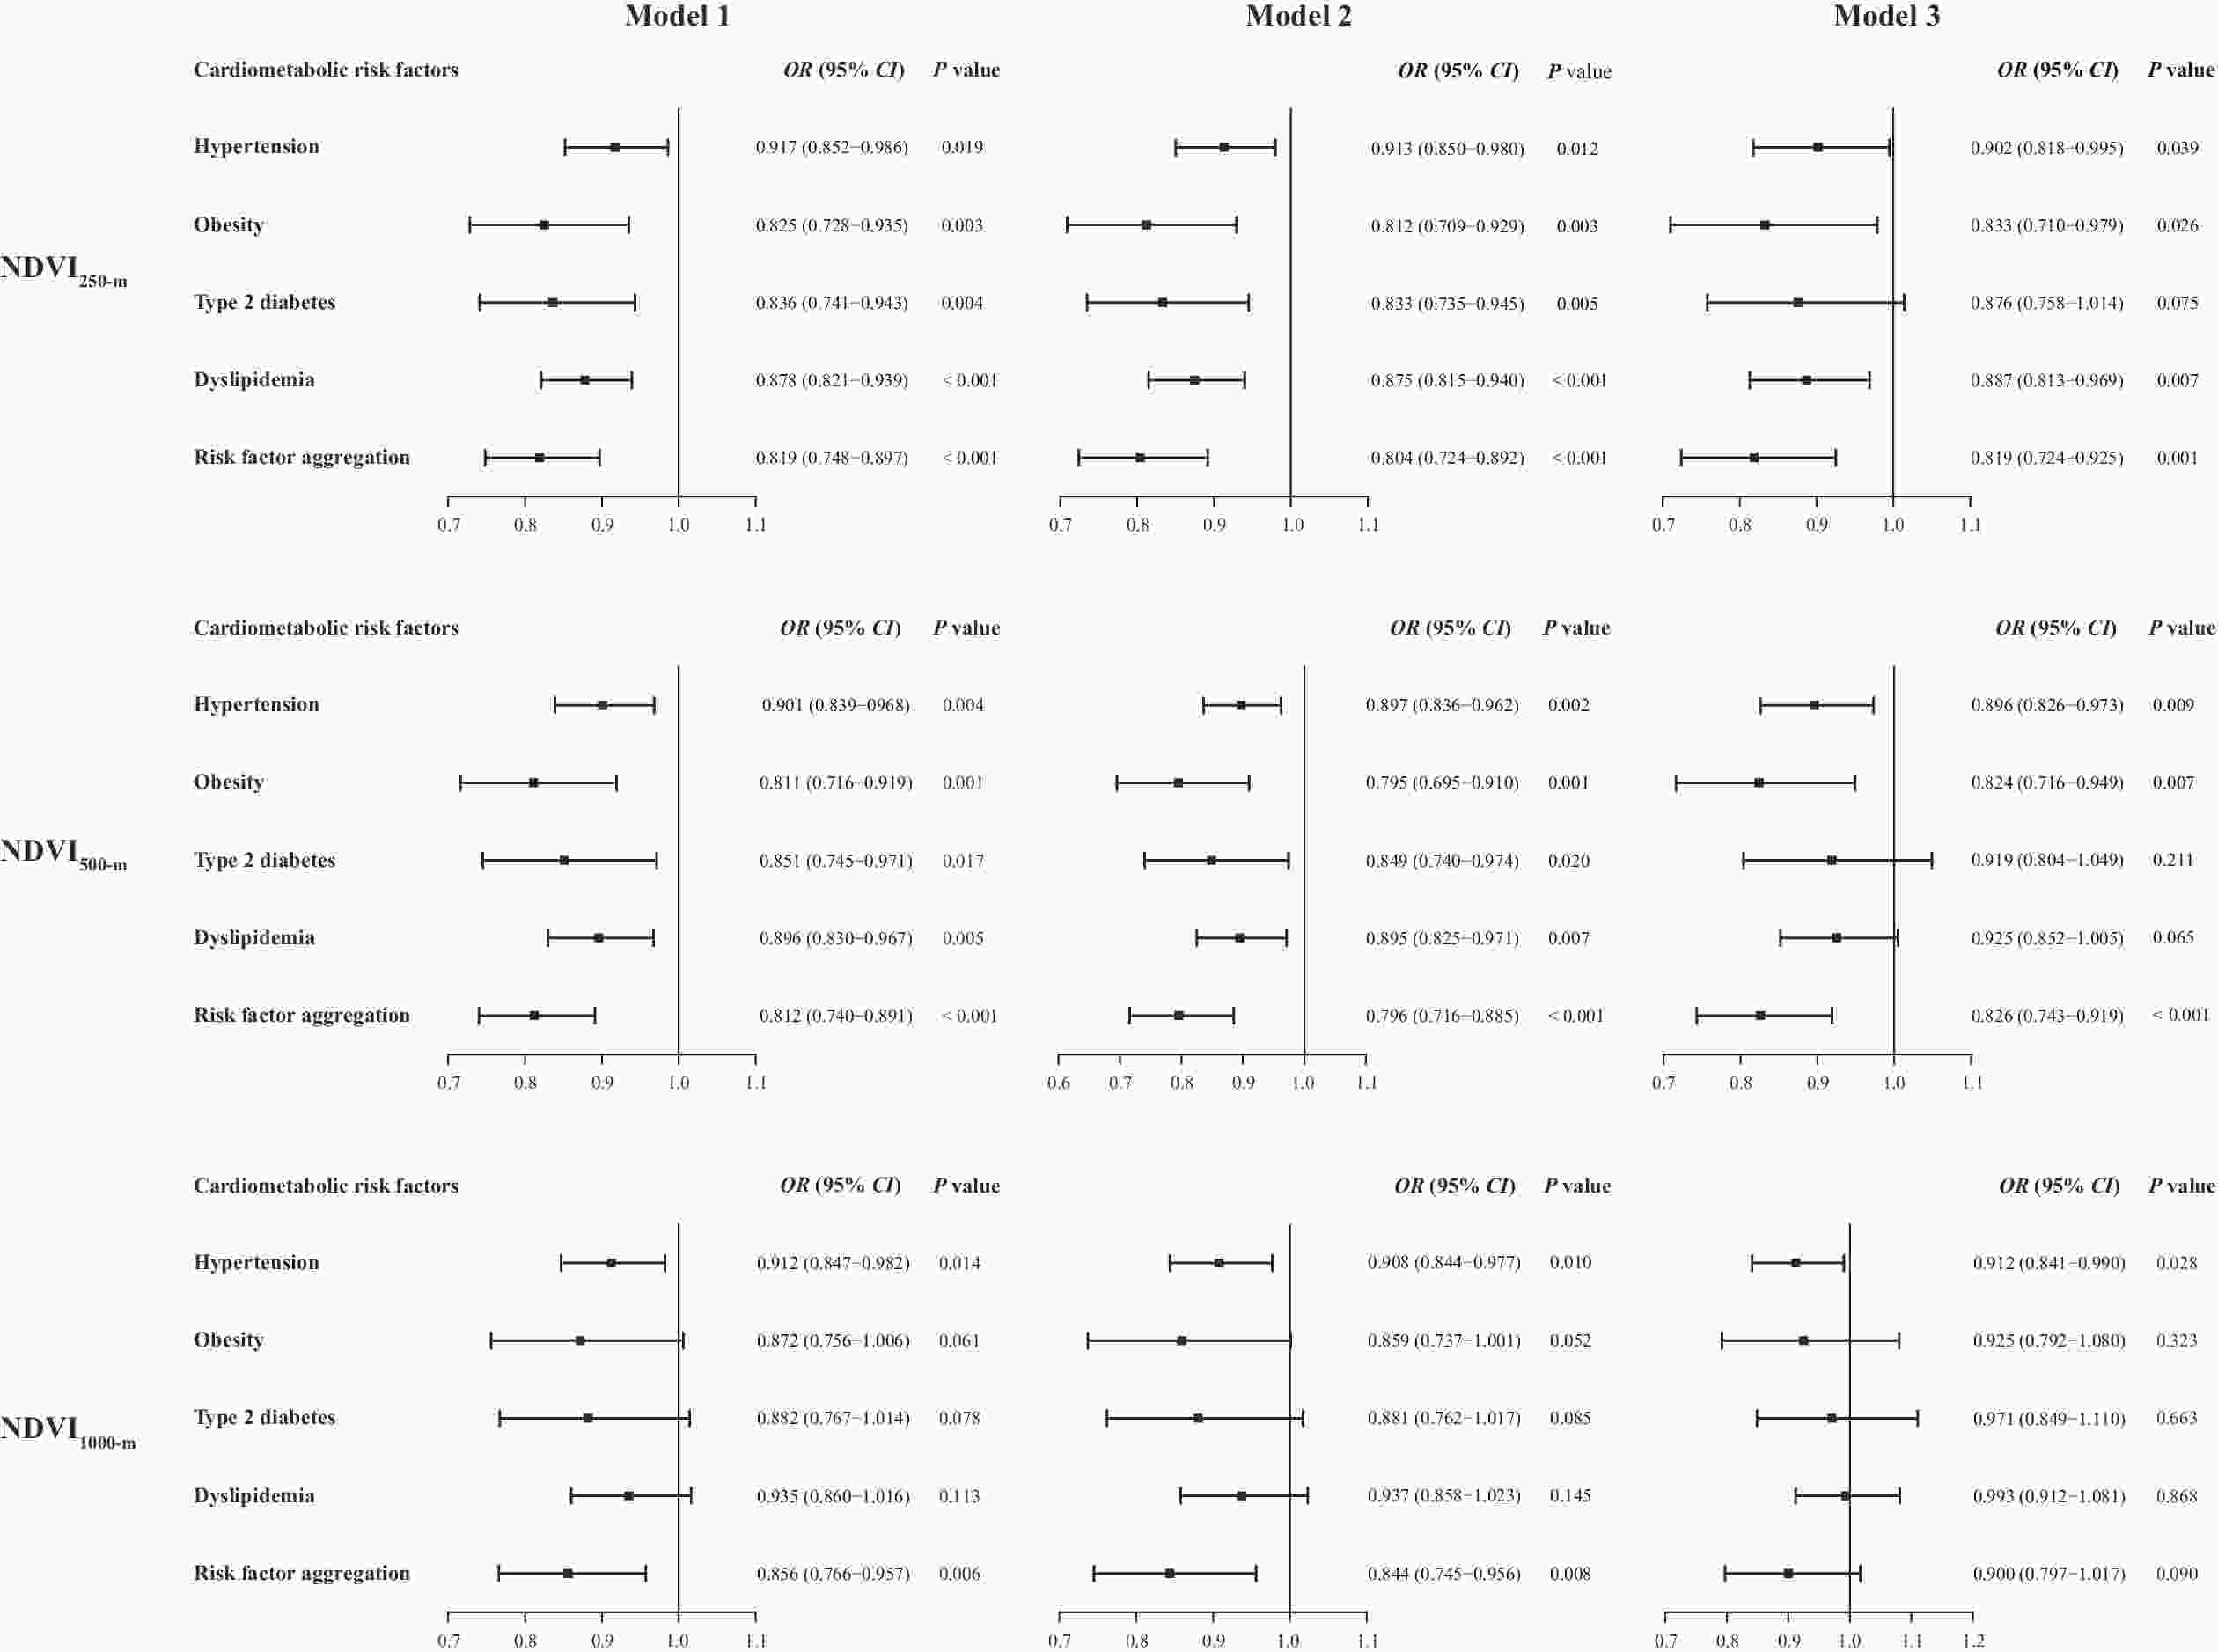
Figure 1. Association of residential greenness (per IQR increase) with cardiometabolic risk factors. IQR, interquartile range; OR, odds ratio; CI, confidence interval; NDVI, normalized difference vegetation index. Model 1: Crude model; Model 2: With adjustments for age, sex, education level, and marital status; Model 3: Model 2 + district level of GDP and district level of population density.
The Q2–Q4 quantiles had a significant protective effect against hypertension and risk factor aggregation (P values for trend < 0.05) when the Q1 quantile of NDVI500-m was used as reference (Supplementary Table S2, available in www.besjournal.com). Sensitivity analysis found that after further adjustment for smoking, drinking, and family history of cardiometabolic risk factors, the association between NDVI500-m and each cardiometabolic risk factor remained significant (Supplementary Table S3, available in www.besjournal.com). NDVI500-m has a significant protective effect against isolated systolic hypertension and obesity (diagnosed based on body fat percentage) (Supplementary Table S4, available in www.besjournal.com).
Cardiometabolic risk factors Adjusted OR (95% CI)a Hypertension Q1 1 (Reference) Q2 0.755 (0.615–0.927) Q3 0.709 (0.574–0.877) Q4 0.722 (0.589–0.885) P value for trend 0.002 Obesity Q1 1 (Reference) Q2 0.729 (0.472–1.124) Q3 0.634 (0.399–1.007) Q4 0.494 (0.325–0.751) P value for trend 0.001 Type 2 diabetes Q1 1 (Reference) Q2 1.020 (0.806–1.290) Q3 0.656 (0.416–1.035) Q4 0.638 (0.416–0.977) P value for trend 0.020 Dyslipidemia Q1 1 (Reference) Q2 1.020 (0.806–1.290) Q3 0.709 (0.553–0.909) Q4 0.771 (0.610–0.973) P value for trend 0.007 Risk factor aggregation Q1 1 (Reference) Q2 0.759 (0.540–1.067) Q3 0.584 (0.407–0.840) Q4 0.511 (0.366–0.715) P value for trend < 0.001 Note. OR, odds ratio; CI, confidence interval; NDVI, normalized difference vegetation index. aAdjusted for age, sex, education level, and marital status. Table S2. Association between quartile NDVI500-m and cardiometabolic risk factors
Cardiometabolic risk factors Adjusted OR (95% CI) Hypertension Main modela 0.897 (0.836–0.962) Main modela + smoking 0.895 (0.834–0.960) Main modela + drinking 0.898 (0.837–0.963) Main modela + family history of cardiometabolic risk factors 0.899 (0.838–0.964) Obesity Main modela 0.795 (0.695–0.910) Main modela + smoking 0.793 (0.694–0.906) Main modela + drinking 0.795 (0.695–0.910) Main modela + family history of cardiometabolic risk factors 0.797 (0.697–0.911) Type 2 diabetes Main modela 0.849 (0.740–0.974) Main modela + smoking 0.850 (0.740–0.976) Main modela + drinking 0.849 (0.740–0.975) Main modela + family history of cardiometabolic risk factors 0.863 (0.754–0.989) Dyslipidemia Main modela 0.895 (0.825–0.971) Main modela + smoking 0.896 (0.826–0.973) Main modela + drinking 0.897 (0.827–0.973) Main modela + family history of cardiometabolic risk factors 0.897 (0.829–0.972) Risk factor aggregation Main modela 0.796 (0.716–0.885) Main modela + smoking 0.796 (0.716–0.884) Main modela + drinking 0.797 (0.717–0.886) Main modela + family history of cardiometabolic risk factors 0.800 (0.721–0.887) Note. OR, odds ratio; CI, confidence interval; NDVI, normalized difference vegetation index. Family history of cardiometabolic risk factors including family history of hypertension, family history of diabetes and family history of cardiovascular disease. Family history is defined as at least one parent or sibling with the illness. aAdjusted for age, sex, education level, and marital status. Table S3. Associations of per IQR increase in NDVI500-m with cardiometabolic risk factors after additional adjustment for cigarette smoking, alcohol drinking and family history of cardiometabolic risk factors
Cardiometabolic risk factors Adjusted OR (95% CI) Hypertension (SBP ≥ 140 mmHg or DBP ≥ 90 mmHg) 0.897 (0.836–0.962) ISH (SBP ≥ 140 mmHg and DBP < 90 mmHg) 0.892 (0.822–0.969) IDH (SBP < 140 mmHg and DBP ≥ 90 mmHg) 0.998 (0.861–1.155) SDH (SBP ≥ 140 mmHg and DBP ≥ 90 mmHg) 0.913 (0.826–1.009) Obesity(BMI ≥ 28 kg/m2 ) 0.795 (0.695–0.910) abdominal obesity (WC ≥ 90 cm or 85 cm for men or women)[1] 0.956 (0.849–1.077) abdominal obesity (WHtR ≥ 0.5)[2] 0.930 (0.807–1.073) abdominal obesity (BF% ≥ 25% or 30% for men or women)[3] 0.814 (0.726–0.912) Note. OR, odds ratio; CI, confidence interval; NDVI, normalized difference vegetation index; ISH, isolated systolic hypertension; IDH, Isolated diastolic hypertension; SDH, systolic-diastolic hypertension; SBP, systolic blood pressure; DBP, diastolic blood pressure; BMI, body mass index; WC, waist circumference; WHtR, waist to height ratio; BF%, percent body fat. Adjusted for age, gender, education level, and marital status.
WHtR = WC (cm) / height (cm); BF%= (1.2 × BMI) + (0.23 × age) − 5.4[4].Table S4. Association of NDVI500-m per IQR increase with different types of hypertension and obesity
-
To further explore the potential association between residential greenness and cardiometabolic risk factors, we conducted stratified analyses according to age, sex, education level, and marital status (Figure 2). The results revealed a significant interaction between NDVI500-m and sex in the occurrence of hypertension, dyslipidemia, and risk factor aggregation (P for interaction was 0.027, 0.005, and 0.030, respectively). The results also indicated the stronger protective effect of residential greenness against type 2 diabetes among people with a higher education level (P for interaction = 0.022). However, we did not find any interaction for the other subgroups (all P values > 0.05).
-
The mediation analysis results showed that PM10 mediated the associations between NDVI500-m and obesity, dyslipidemia, and risk factor aggregation by 8.7%, 9.2%, and 5.4%, respectively. Physical activity accounted for 1.9% of the association between NDVI500-m and dyslipidemia. However, no mediating effect of PM1 and PM2.5 was observed (Table 2).
Cardiometabolic risk factors Potential mediators β (95% CI) Indirect/Total effects (%) P value Hypertension PM1 0.018 (−0.038 to 0.070) − 0.500 PM2.5 −0.004 (−0.038 to 0.030) 1.2 0.830 PM10 0.011 (0.000 to 0.020) − 0.054 Physical activity −0.001(−0.006 to 0.000) 0.4 0.500 Obesity PM1 0.164 (0.135 to 0.190) − < 0.001 PM2.5 0.114 (0.089 to 0.140) − < 0.001 PM10 −0.044 (−0.059 to −0.030) 8.7 < 0.001 Physical activity 0.009 (0.004 to 0.010) − < 0.001 Type 2 diabetes PM1 0.109 (0.043 to 0.180) − < 0.001 PM2.5 0.031 (−0.001 to 0.070) − 0.064 PM10 −0.008 (−0.017 to 0.000) 5.6 0.100 Physical activity 0.005 (0.002 to 0.010) − 0.002 Dyslipidemia PM1 −0.018 (−0.077 to 0.040) 5.0 0.530 PM2.5 0.002 (−0.034 to 0.040) − 0.960 PM10 −0.032 (−0.047 to −0.020) 9.2 < 0.001 Physical activity −0.007 (−0.013 to 0.000) 1.9 0.004 Risk factor aggregation PM1 0.117 (0.076 to 0.150) − < 0.001 PM2.5 0.066 (0.036 to 0.090) − < 0.001 PM10 −0.026 (−0.038 to −0.010) 5.4 < 0.001 Physical activity 0.004 (0.000 to 0.010) − 0.046 Note. NDVI, normalized difference vegetation index; PM1, submicron particulate matter; PM2.5, fine particulate matter; PM10, inhalable particulate matter. The associations were adjusted for age, sex, education level, and marital status. Table 2. Mediation of association between NDVI500-m and cardiometabolic risk factors by air pollutants and physical activity
-
In this large cross-sectional study, we found that higher residential greenness was associated with a lower prevalence of cardiometabolic risk factors, and the results were generally stable after several sensitivity analyses. Additionally, the stratified analysis found that the association between residential greenness and hypertension, dyslipidemia, and risk factor aggregation was greater in males, while the association between residential greenness and diabetes was greater in subjects with higher education levels. This study suggests that increasing green space around residences may be an effective measure for the prevention of cardiometabolic risk factors.
Although previous epidemiological studies have explored associations between residential greenness and cardiometabolic risk factors, their results have not been entirely consistent. Some researchers found residential greenness to have a protective effect against several cardiometabolic risk factors, including hypertension[12–14], obesity[15–17], type 2 diabetes[18], and dyslipidemia[19,20]. Two studies focusing on metabolic syndrome[37,38] also produced positive conclusions. In contrast, Iyer et al.[22] did not observe any association between greenness and hypertension or cholesterol in sub-Saharan Africa, and Markevych et al.[23] did not find an association between greenness and blood lipids in children aged 10–15 years in Germany. In addition, most studies were conducted in urban areas with relatively high economic levels. Therefore, their evidence may not necessarily apply to rural residents with a unique dietary structure and lifestyle in Xinjiang. Our study fills this gap regarding economically underdeveloped regions. We found higher residential greenness to have a protective effect against the four cardiometabolic risk factors mentioned above and the aggregation of risk factors in rural Xinjiang.
We found that residential greenness had the strongest protective effect against obesity among the cardiometabolic risk factors of hypertension, obesity, type 2 diabetes, and dyslipidemia. It is likely that residents with more greenery around their homes tend to be more willing to engage in physical activity, which contributes to better weight control. Although the underlying mechanism of greenness on cardiometabolic risk factors has not been fully elucidated, several potential biological pathways have been suggested. First, a study based on a United States population[39] suggested that residential greenness was associated with decreased levels of sympathetic activation, reduction in oxidative stress, and increased angiogenesis. All three are beneficial for improving cardiovascular system biomarkers. Second, multiple studies[40–42] have concluded that long-term exposure to air pollution is associated with higher cardiovascular risk. Additionally, both Dadvand et al.[21] and Yeager et al.[43] proposed that residential greenness can promote health by encouraging physical activity, improving air quality, and reducing psychological stress. In the present study, we found that PM10 accounted for 5.4%–9.2% of the association between residential greenness and obesity, dyslipidemia, and risk factor aggregation. Physical activity mediated the association between NDVI500-m and dyslipidemia by 1.9%. The study did not find PM1 and PM2.5 to have a mediating effect, but this may be due to the limited scope of the study area and the limited value range of PM1 and PM2.5. Furthermore, the data on psychological stress, social interaction, and noise were not included in this study, although they could be potential moderators. Therefore, larger mechanistic studies should be conducted to further explore the underlying mechanisms.
In the present study, the stratified analyses showed that the associations of residential greenness with hypertension, dyslipidemia, and risk factor aggression were influenced by sex, with stronger associations being found among males. This result is inconsistent with the study conducted by Yang et al.[12,19] among urban residents in Northeast China. Furthermore, we also found that the association between residential greenness and type 2 diabetes was influenced by education level, with a stronger association being found among the more educated participants. A study on residential greenness and sleep quality in rural Henan generated conclusions consistent with ours in that the benefits of residential greenness were greater among male and more educated participants[44]. In this study, in the context where rural residents in the area make a living by growing cotton, food, and fruits, men as the main labor force in agriculture may have a greater likelihood to benefit from green spaces. In addition, previous studies found that the metabolic status of women in the rural areas of Xinjiang was worse than that of men[45,46], and the cardiovascular and metabolic risk factors of women varied from that of men[47]. Hence, higher residential greenness has a greater protective effect on men. Regarding the residents with higher levels of education, they were more aware of the impact of the environment on health and were therefore more likely to live in locations with more vegetation and thus benefit from green spaces around their homes.
This study explored the associations between residential greenness and cardiometabolic risk factors based on a large-scale population located in the rural areas of Xinjiang. Thus, it provided a certain theoretical basis and data support for the prevention of cardiometabolic-related diseases in residents. To ensure the quality of the research, the questionnaire surveys, physical examinations, and biochemical indicators were subject to strict quality control. However, this study has some limitations. First, as this study was a cross-sectional study, we were only able to report associations and had limited ability to infer causal associations. The 51st Regiment of the Third Division of the Xinjiang Production and Construction Corps was chosen as the research site. However, Xinjiang is vast, and diet, lifestyle, and environment vary by region. Therefore, the conclusions of this study need to be extrapolated to other regions with caution. Second, our assessment of residential greenness is static and subjects may have traveled elsewhere, so an assessment of active space buffers may be more precise. Moreover, as our estimates of residential greenness were based on neighborhood/company rather than individual levels, some subjects may have been misclassified. However, this misclassification is random and tends toward the null hypothesis[48]. Therefore, the association may be stronger if the greenness is assessed based on individual levels. Finally, although we adjusted for some confounding factors, some potential covariate information could not be obtained, such as noise level and psychological stress. Future studies with more rigorous designs and larger prospective cohort studies are needed to elucidate this association.
-
Higher residential greenness has a protective effect against cardiometabolic risk factors among rural residents in Xinjiang; this association is stronger among males and subjects who have higher levels of education. Air pollutants and physical activity levels may mediate associations between residential greenness and cardiometabolic risk factors. Increasing the area of green space around residences is an effective measure to reduce the burden of cardiometabolic-related diseases among rural residents in Xinjiang.
HTML
Study Population
Anthropometric Measurements and Clinical Biochemical Tests
Outcome Assessment
Residential Greenness
Potential Confounders and Mediators
Statistical Analysis
Basic Characteristics of the Study Population
Residential Greenness Exposure and Cardiometabolic Risk Factors
Subgroup Analysis
Mediation Analysis
ETHICS APPROVAL AND CONSENT TO PARTICIPATE This study was approved by the Ethics Committee of the First Affiliated Hospital of Shihezi University School of Medicine (No. SHZ2010LL01). All the participants provided their written informed consent prior to participation in the study. All experimental protocols for involving human data were in accordance with the Declaration of Helsinki.
AVAILABILITY OF DATA AND MATERIALS The datasets used during the current study are available from the corresponding author on reasonable request. The Chinese questionnaire copy may be requested from the authors.
&These authors contributed equally to this work.
 23461+Supplementary Materials.pdf
|

|

 Quick Links
 DownLoad: